Article

Identification and Comprehensive Analysis of the Nuclear Factor-Y Family Genes Reveal Their Multiple Roles in Response to Nutrient Deficiencies in Brassica napus

1
Key Laboratory of Arable Land Conservation (Middle and Lower Reaches of Yangtze River), Ministry of Agriculture and Rural Affairs, State Environmental Protection Key Laboratory of Soil Health and Green Remediation, Ministry of Ecology and Environment, Microelement Research Center, College of Resources and Environment, Huazhong Agricultural University, Wuhan 430070, China
2
Institute of Environment and Safety, Wuhan Academy of Agricultural Sciences, Wuhan 430070, China
*
Authors to whom correspondence should be addressed.
These Authors equally contributed to this study.
Int. J. Mol. Sci. 2021, 22(19), 10354; https://doi.org/10.3390/ijms221910354
Submission received: 25 July 2021 / Revised: 22 September 2021 / Accepted: 23 September 2021 / Published: 26 September 2021
(This article belongs to the Special Issue ROS and Abiotic Stress in Plants 2.0)

Abstract

:
Nuclear Factor-Y (NF-Y) transcription factors play vital roles in plant abiotic stress response. Here, the NF-Y family in Brassica napus, which is hyper-sensitive to nitrogen (N) deprivation, was comprehensively identified and systematically characterized. A total of 108 NF-Y family members were identified in B. napus and categorized into three subfamilies (38 NF-YA, 46 NF-YB and 24 NF-YC; part of the Arabidopsis NF-YC homologous genes had been lost during B. napus evolution). In addition, the expansion of the NF-Y family in B. napus was driven by whole-genome duplication and segmental duplication. Differed expression patterns of BnaNF-Ys were observed in response to multiple nutrient starvations. Thirty-four genes were regulated only in one nutrient deficient condition. Moreover, more BnaNF-YA genes were differentially expressed under nutrient limited environments compared to the BnaNF-YB and BnaNF-YC subfamilies. Sixteen hub genes responded diversely to N deprivation in five rapeseed tissues. In summary, our results laid a theoretical foundation for the follow-up functional study of the key NF-Y genes in B. napus in regulating nutrient homeostasis, especially N.

1. Introduction

Nuclear Factor-Y (NF-Y) transcription factors were discovered in yeast, mammals, plants, and other eukaryotes [1,2,3]. The NF-Y family members can specifically recognize and bind to the CCAAT sequence in the target gene’s promoters [4]. The NF-Y transcription factor complex is composed of protein subunits from three unique subfamilies: NF-YA, NF-YB and NF-YC. A comparison of the protein sequences of three NF-Y subunits in different species, reveals that each subunit contains a conserved structural region. The NF-YA subunit has a carbon terminal region containing 56 amino acids, the NF-YB subunit a middle region containing 90 amino acids, and the NF-YC subunit a nitrogen (N) terminal region encompassing 84 amino acids [3]. The NF-Y family has been functionally annotated in a number of species. In yeast and animals, all NF-Y subunits contain only one or two members, but in plants, the number of genes encoding NF-Y subunits is expanded significantly [2]. In Arabidopsis thaliana, there are 36 NF-Y genes including 10, 13 and 13 members in the NF-YA, NF-YB, and NF-YC subunits, respectively. In theory, these subunits can be integrated into 1690 distinct complexes [5]. Likewise, in rice (Oryza sativa), 10, 11, and 7 members were identified in the NF-YA, NF-YB, and NF-YC subfamilies, respectively [6]. To date, the number of identified members of the three subfamilies in other crop plants have previously been studied, such as soybean [7], tomato [8], maize [9], sorghum [10,11], citrus [12], barley [13], cucumber [14], and apple [15]. The results indicate that the numbers of NF-Y family members have increased in plants. Therefore, these NF-Y family genes may combine with each other to form tens of thousands of potential heterotrimers in plants [16]. The differentiation of the NF-Y family genes may lead to the diversity of their functions.
In addition to regulating a wide range of growth and development processes, several NF-Y subfamily members also play crucial roles in plant abiotic stress tolerance [4]. Studies in plants have shown that NF-Y transcription factors are involved in the regulation of seed germination [17], flowering time [18,19,20], root elongation [21], fruit ripening [8], embryogenesis [22], photosynthesis [23], chloroplast biogenesis [24], and fatty acid biosynthesis [25]. For example, several NF-Y proteins interact with photoperiod-induced flowering pathway regulators in Arabidopsis and tomato, and overexpression of the NF-YA1 and NF-YB1 genes in Arabidopsis lead to delayed flowering in plants [18,19]. In addition to plant growth regulation, NF-Ys are widely involved in abiotic stress responses, such as osmotic stresses caused by drought and salt, via ABA-dependent or independent pathways [2,4,26]. For instance, the expression levels of most of the NF-Y genes in Arabidopsis increase under drought stress condition [27]. Overexpression of AtNF-YB1, AtNF-YB2 and AtNF-YB5 significantly improves Arabidopsis drought tolerance by mediating the expression of stress-responsive genes [28,29,30]. In rice, drought stress induces the expression of OsNF-YA7 which enhances plant drought tolerance through an ABA-independent manner [31]. Yet, TaNF-YB3 was reported to be crucial for plant drought tolerance by modulating an ABA-associated signaling pathway [32].
Furthermore, NF-Y genes act as key players in improving plant adaptability to nutritional constraints [33,34]. It is reported that N and phosphorus (P) deficiencies strongly induce the expression of five Arabidopsis NF-YA subfamily members, and N-starvation-induced senescence is significantly alleviated in plants overexpressing NF-YA genes [35]. Additionally, miR169, which regulates NF-YA genes at the post transcriptional level in Arabidopsis, is involved in N-starvation response [29,36]. The expression levels of most NF-YA genes in wheat are enhanced under both N and P deficiencies, and overexpression of TaNFYA-B1 stimulates root development as well as the up-regulation of transporters involved in root nitrate and phosphate uptake [37]. These results indicate that NF-YA genes can promote wheat to absorb phosphate under low P stress. However, the underlying mechanisms of how NF-Y genes regulate nutrient use efficiency are still unknown. Oilseed rape (Brassica napus) has been widely planted and harvested to produce vegetable oil, livestock feed and biodiesel [38]. B. napus (AACC genome, 2n = 38) is a heterotetraploid crop obtained by crossing B. oleracea (CC genome, 2n = 18) and B. rapa (AA genome, 2n = 20) [39]. Many duplicated segments and homeologous regions within the genome are generated by the allopolyploidy events in B. napus [40], which results in a significant increase in gene copy number variation. It is generally believed that B. napus is susceptible to multiple abiotic stresses [38]. NF-Y transcription factors have been identified in various plant species [7,8,9,10,12,13,41]. However, little is known about how NF-Y genes mediate nutrient stress responses in B. napus. Here, the physiological responses of rapeseed to nutrient starvations were investigated, and 108 B. napus NF-Y family members were identified using BLASTP search against the protein sequences of B. napus. Gene structure, chromosomal location, phylogenetic analysis, conserved motifs, evolutionary patterns and synteny analysis were conducted to characterize the BnaNF-Y family members. Moreover, the expression changes of the BnaNF-Y genes in response to multiple nutritional deficiencies were analyzed, as were as gene coexpression networks and gene subcellular localization. Collectively, our investigation laid a key foundation for further functional studies of the NF-Y family of genes in oilseed rape.

2. Results

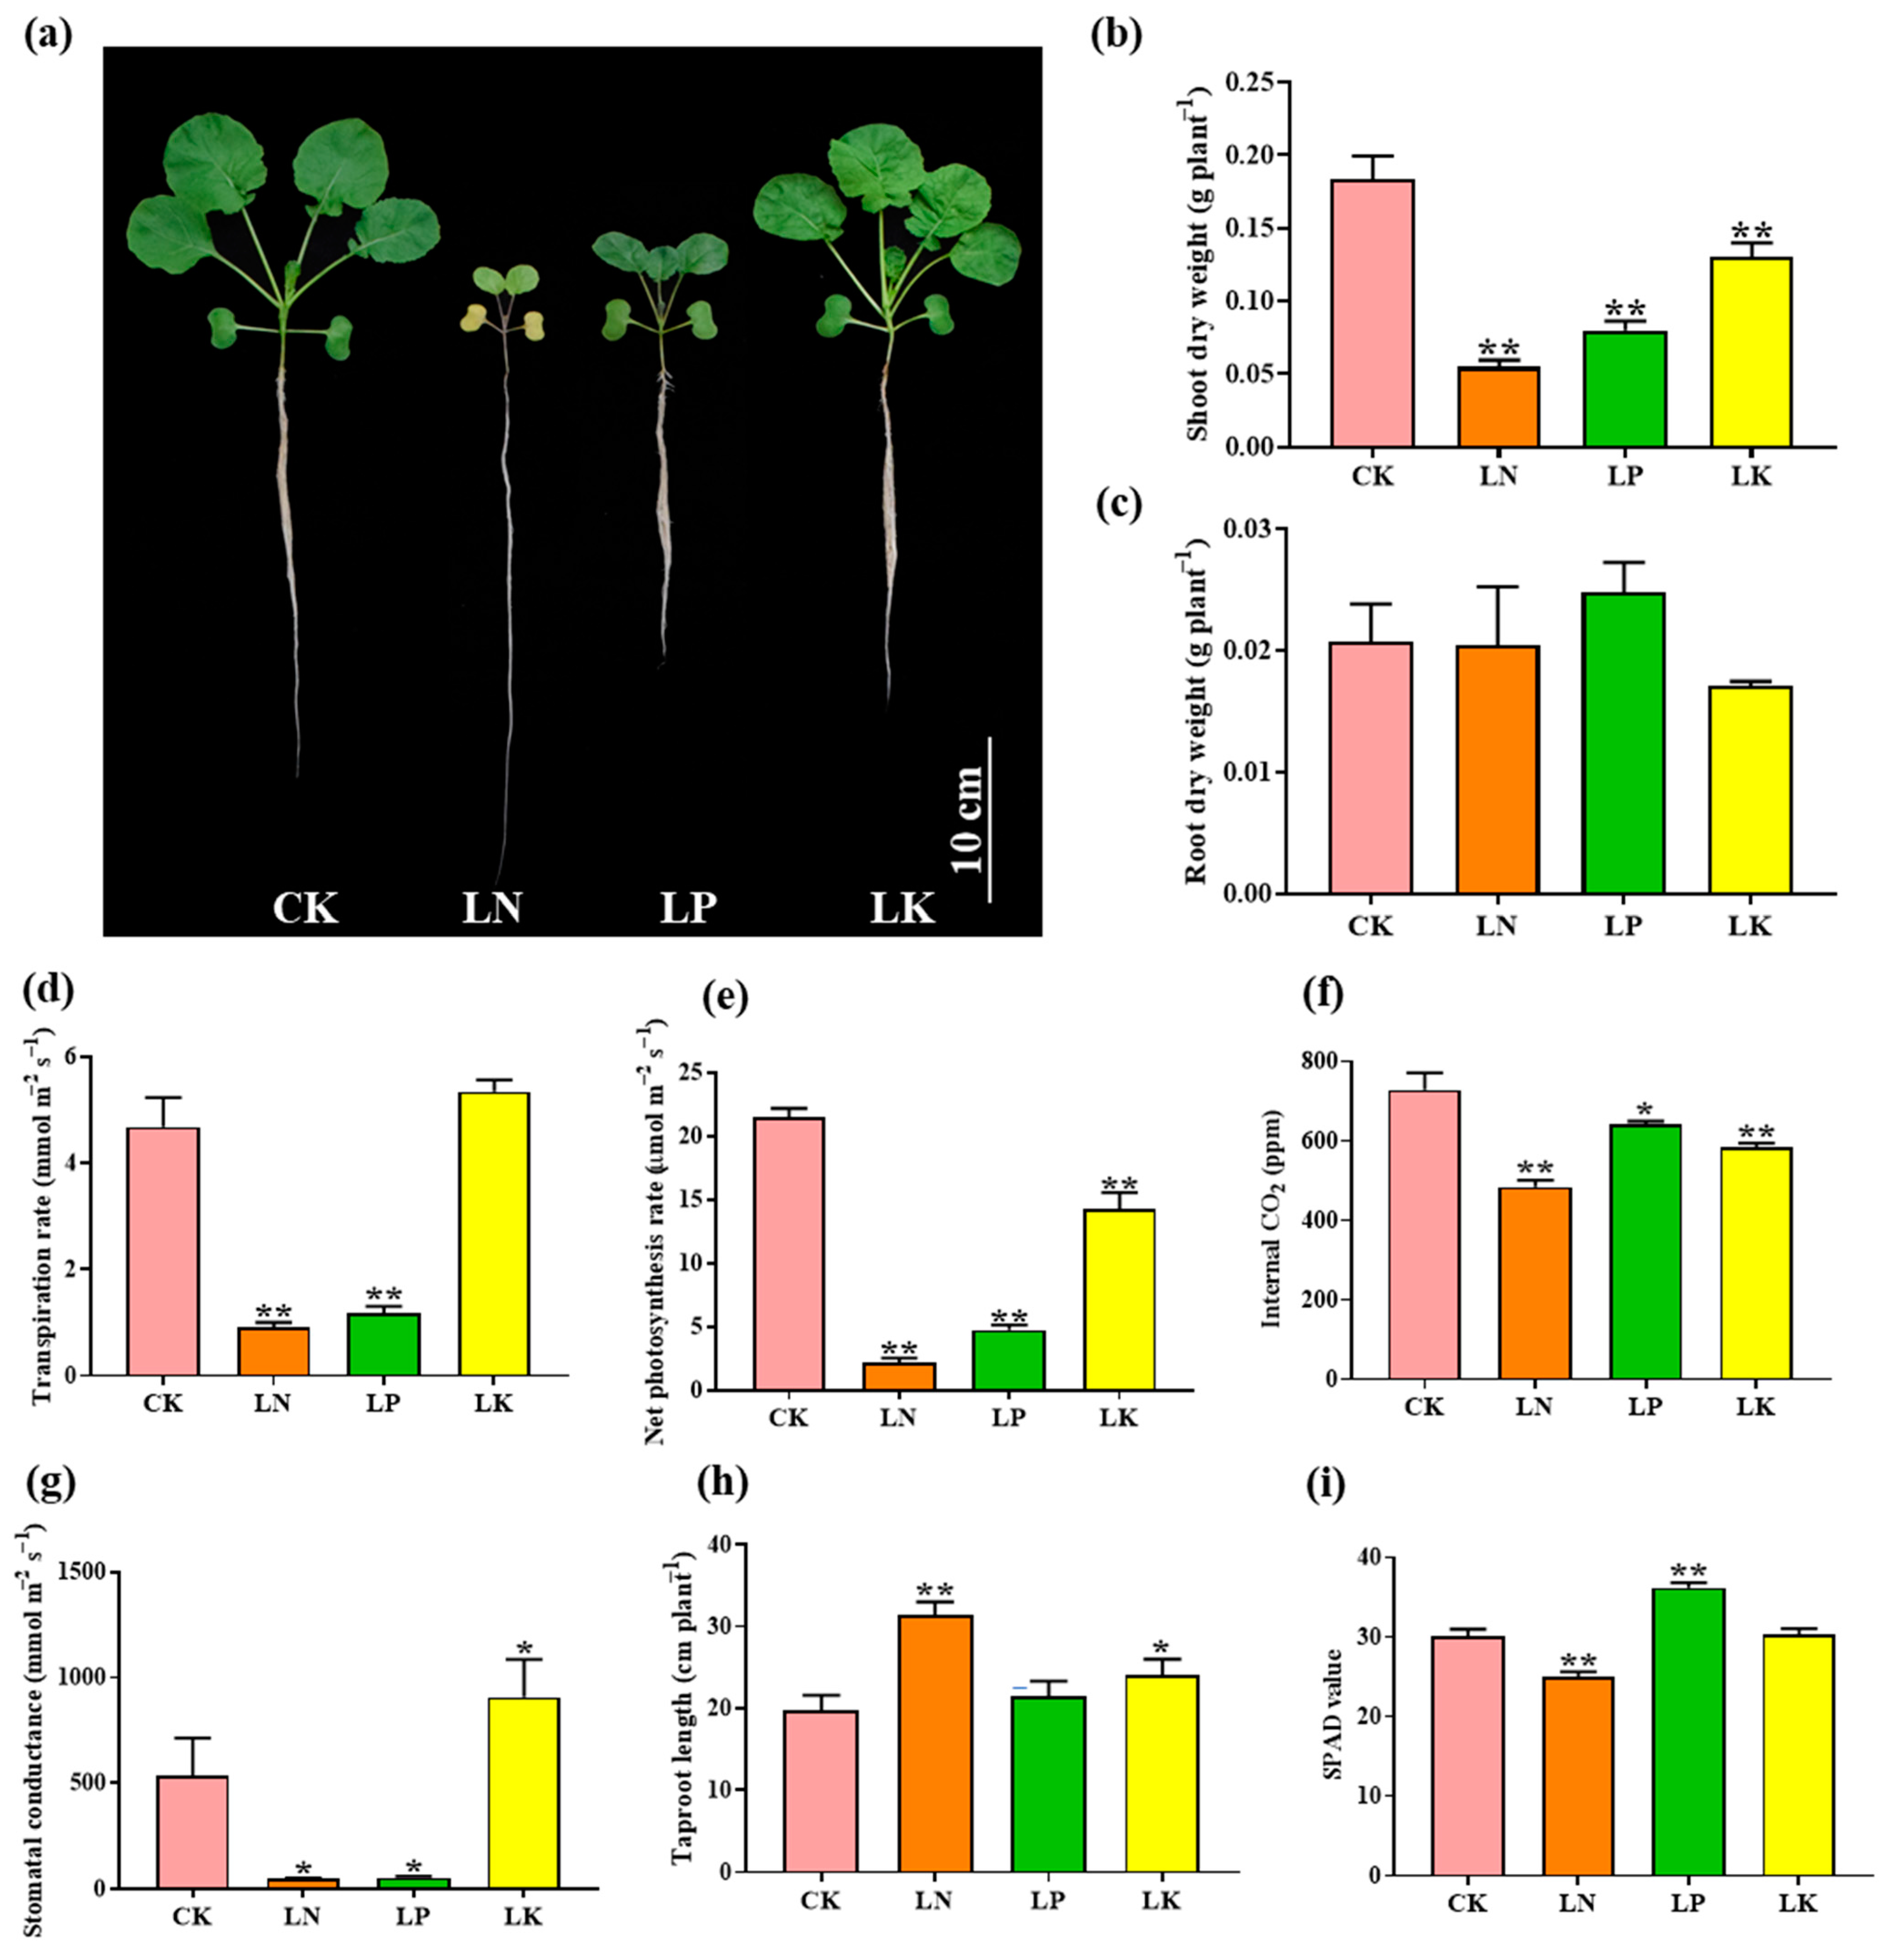
2.1. Physiological Response of B. napus to N, P and K Deficiencies

In order to explore the response of B. napus to diverse nutrient deficiencies, the B. napus cultivar “ZS11” was cultivated for 11 days under low N (LN, 100 μM), low P (LP, 5 μM) and low K (LK, 5 μM) conditions (Figure 1). Compared with normal nutrient supply (CK), the growth of B. napus under nutrient limitation was significantly inhibited, especially under N deficient conditions (Figure 1a–c). As expected, shoot dry weight under LN, LP and LK conditions was reduced to 70.11%, 56.40% and 29.01% of that under CK condition, respectively. However, no difference was observed in roots (Figure 1b,c). Moreover, the taproot growth was the most sensitive under LN condition, which was about 59.91% longer than that under CK. The SPAD value of leaves decreased significantly under LN condition, while the opposite trend was observed under LP condition (Figure 1i). We further determined the photosynthetic characters of B. napus under the same conditions. Compared with CK, the transpiration rate, net photosynthesis rate, internal CO2 and stomatal conductance were notably reduced under LN and LP conditions, indicating that the lack of N and P greatly inhibited B. napus photosynthesis (Figure 1d–g). For K deficiency, it led to 33.72% and 19.67% reduction in net photosynthesis rate and internal CO2 while the stomatal conductance was significantly increased, by 70.04% compared to CK. However, little effect was observed on the transpiration rate (Figure 1d–g). In general, B. napus has diverse responses to different nutrient deficiencies, and is especially sensitive to N deficiency and less affected by LK.

2.2. Identification and Molecular Characterization of the NF-Y Family Genes

Previous reports showed that the NF-Y family genes could improve nutrient uptake and assimilation [37]. Thus, in order to explore the role of the NF-Y family genes in regulating nutritional deficiency tolerance in B. napus, we comprehensively identified the family members. Through multiple BLAST search against the homologue of 36 Arabidopsis NF-Y family members, a total of 108 NF-Y genes were detected in the whole genome of B. napus (Table S1). The NF-Y genes of B. napus included 38 genes of NF-YA subfamily, 46 genes of NF-YB subfamily and 24 genes of NF-YC subfamily (Tables S2 and S3). Meanwhile, 54 members of the NF-Y family (18 NF-YA, 24 NF-YB and 12 NF-YC) in B. rapa were identified. In B. oleracea 62 (22 NF-YA, 27 NF-YB and 13 NF-YC) genes were identified (Tables S2 and S3). Surprisingly, we found that several copies of the NF-YC subfamily members were lost in the whole genomes of three Brassica species, including NF-YC1/3/5/6/7/8/12 (Table S1). We then summarized the NF-Y family genes in 14 species. Besides the three Brassica species, Glycine max has the highest number of NF-Y genes, with 68 (21 NF-YA, 32 NF-YB and 15 NF-YC) members, while Prunus persica has the least NF-Y genes, with 24 (6 NF-YA, 12 NF-YB and 6 NF-YC) members (Table S2). Moreover, multiple sequence alignment was conducted based on the specific conserved protein sequences of three NF-Y subfamilies [3]. The results showed that the NF-YA and NF-YB subfamilies of the three species were relatively conserved, while the NF-YC subfamily varied largely, which may be related to the loss of some NF-YC subfamily genes during evolution (Figure 2).
The gene ID, gene length (coding sequence), gene location, intron number, protein length and predicted subcellular localization of these genes are listed in Table S3. In general, the gene length of BnaNF-Ys varied from 324 bp to 2674 bp, and the genes encoding polypeptides varied from 107 to 642 amino acids in length. The intron number of BnaNF-Ys ranged from 0 to 7. The subcellular localization predicted by WoLF PSORT indicated that 86 BnaNF-Y proteins were localized in nucleus, 17 in chloroplast, two in mitochondria, two in cytoplasm, and one in plasma (Table S3). The grand average of hydropathy (GRAVY) value of the BnaNF-Y proteins varied from −1.358 to 0.027, most of them negative except BnaC06.NF-YA3b and BnaC04.NF-YA3, indicating that most of the BnaNF-Ys are hydrophilic (Figure 3a). The molecular weight (MW) of the BnaNF-Y proteins varied from 12.211 kDa to 73.177 kDa (Figure 3b), with isoelectronic points (pI) values which ranged from 4.34 to 10.55. The pI of most NF-YA subfamily genes was more than seven, but the pI of most NF-YB and NF-YC subfamily genes were less than seven (Figure 3c).

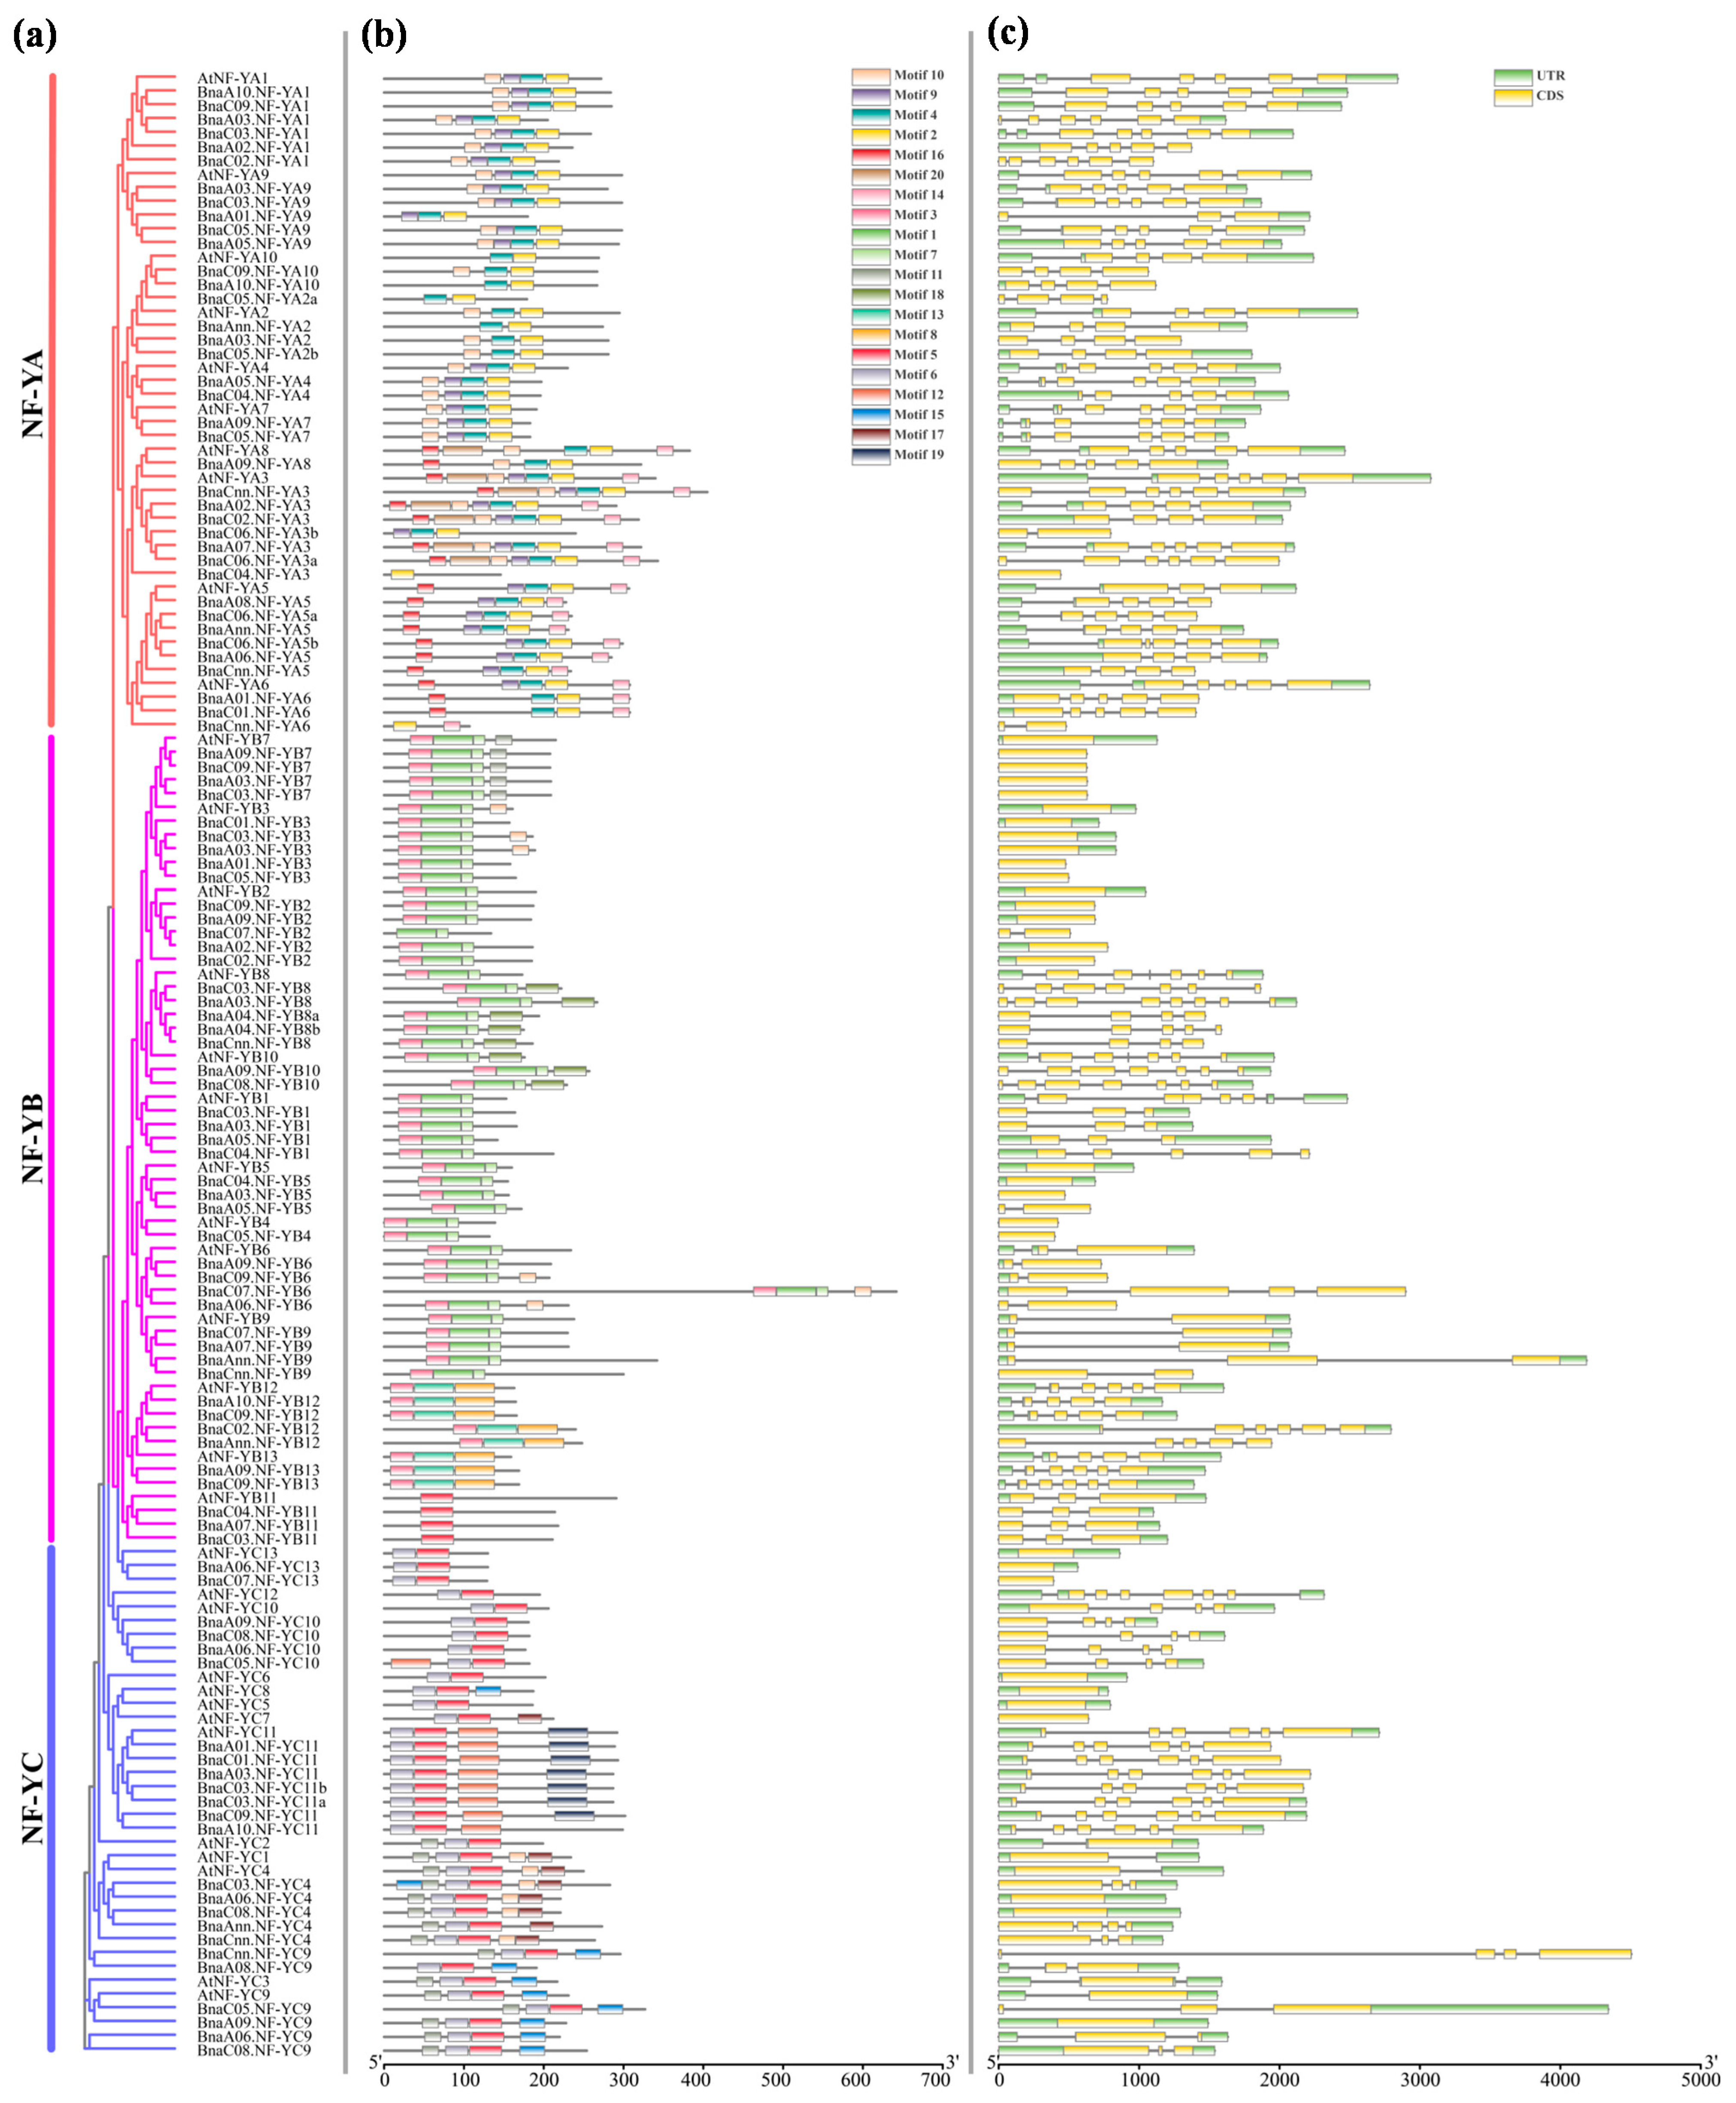
2.3. Phylogenesis of the NF-Y Genes in B. napus

In order to explore the genetic relationships of the NF-Y genes between Arabidopsis and B. napus, the protein sequences of 36 AtNF-Ys and 108 BnaNF-Ys were used to construct a phylogenetic tree in MEGA7.0 (Figure S1). The results showed that all of the NF-Y family members can be divided into three subgroups. Ten genes in Arabidopsis and 38 genes in B. napus were included in the NF-YA subfamily, 13 genes in Arabidopsis and 46 genes in B. napus were included in the NF-YB subfamily, and 13 genes in Arabidopsis and 24 genes in B. napus were included in the NF-YC subfamily. The NF-Y genes in the same subfamily were closely related to each other. Furthermore, some genes of the NF-Y group in Arabidopsis did not have homologous genes in B. napus, while some other genes of the Arabidopsis NF-Y groups had two or more homologous genes in B. napus. This may be due to the loss of certain genes and the homologous replication of chromosomes during evolution. To distinguish each subfamily of the NF-Y genes, all the BnaNF-Y members were renamed according to the Arabidopsis homologous genes following the international nomenclature from BnaA02.NF-YA1 to BnaC07.NF-YC13 (Figure S1, Table S3).

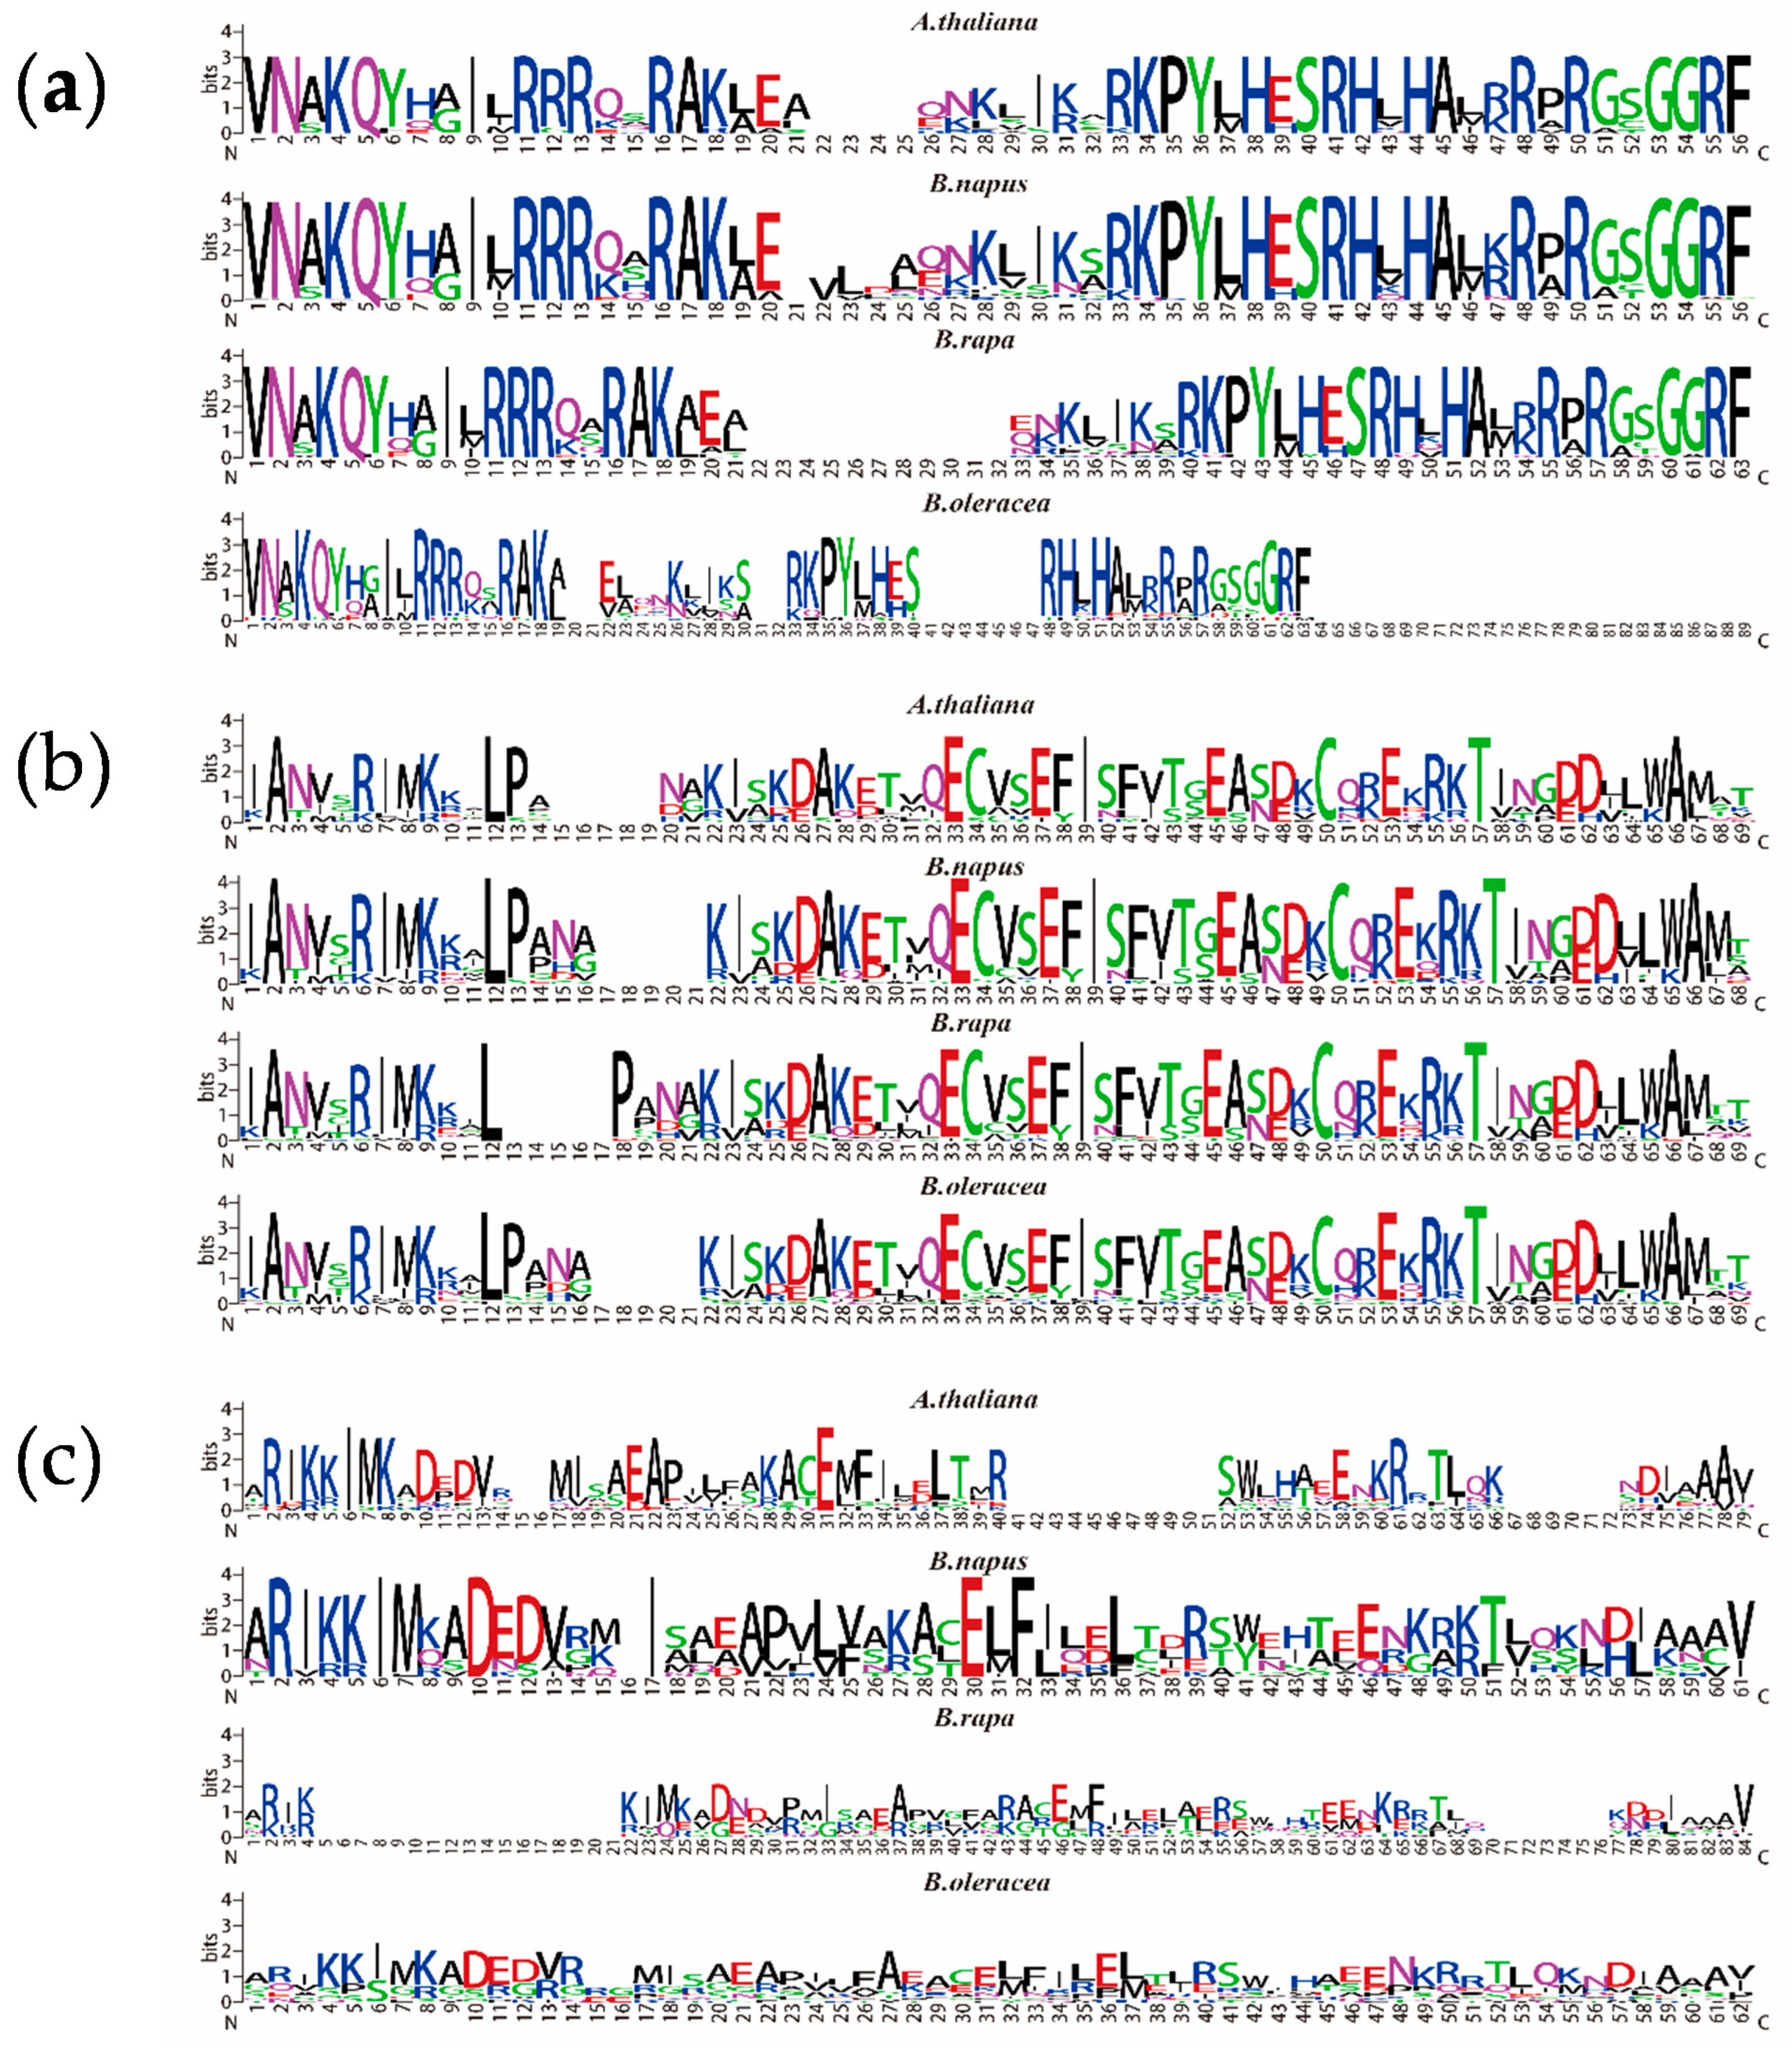
2.4. Structural Analysis and Conserved Motif Analysis of the NF-Y Genes in B. napus and Arabidopsis

The gene structure of the 144 NF-Y family members in B. napus and Arabidopsis were further analyzed. The results showed that the gene structure varied largely among different subfamilies, while it was relatively conserved in the same family (Figure 4, Table S3). The number of introns varied from 0 to 7 with an average number of 2.6. Twenty-two NF-Y genes had no intron, while BnaA03.NF-YB8 had eight introns, the largest number among all the members. Generally, the BnaNF-Y genes had similar numbers of introns as their counterparts in Arabidopsis. In addition, we analyzed the motif structures of the NF-Y family genes using their amino acid sequences in MEME. A total of 20 conserved motifs were identified, and the number of amino acids in each motif ranged from 6 to 50 (Figure 4 and Figure S2). Similar to gene structure, nearly all the NF-Y genes in the same subfamily had relatively conserved motif composition and arrangement; however, it varied to a substantial degree in different subfamilies, especially among the NF-YA, NF-YB and NF-YC subfamilies. In addition, each subfamily contains specific motifs. In detail, the NF-YA subfamily specifically contains motifs 2, 4, 9, 14, 16 and 20, NF-YB subfamily specifically contains motif 1, 3, 7, 8, 13 and 18, and NF-YC subfamily specifically contains motif 6, 12, 15, 17 and 19, and they all have motif 10 (Figure 4 and Figure S2). Taken together, the results of the structural analysis and conserved motif analysis strongly demonstrate the reliability of the genetic identification results.

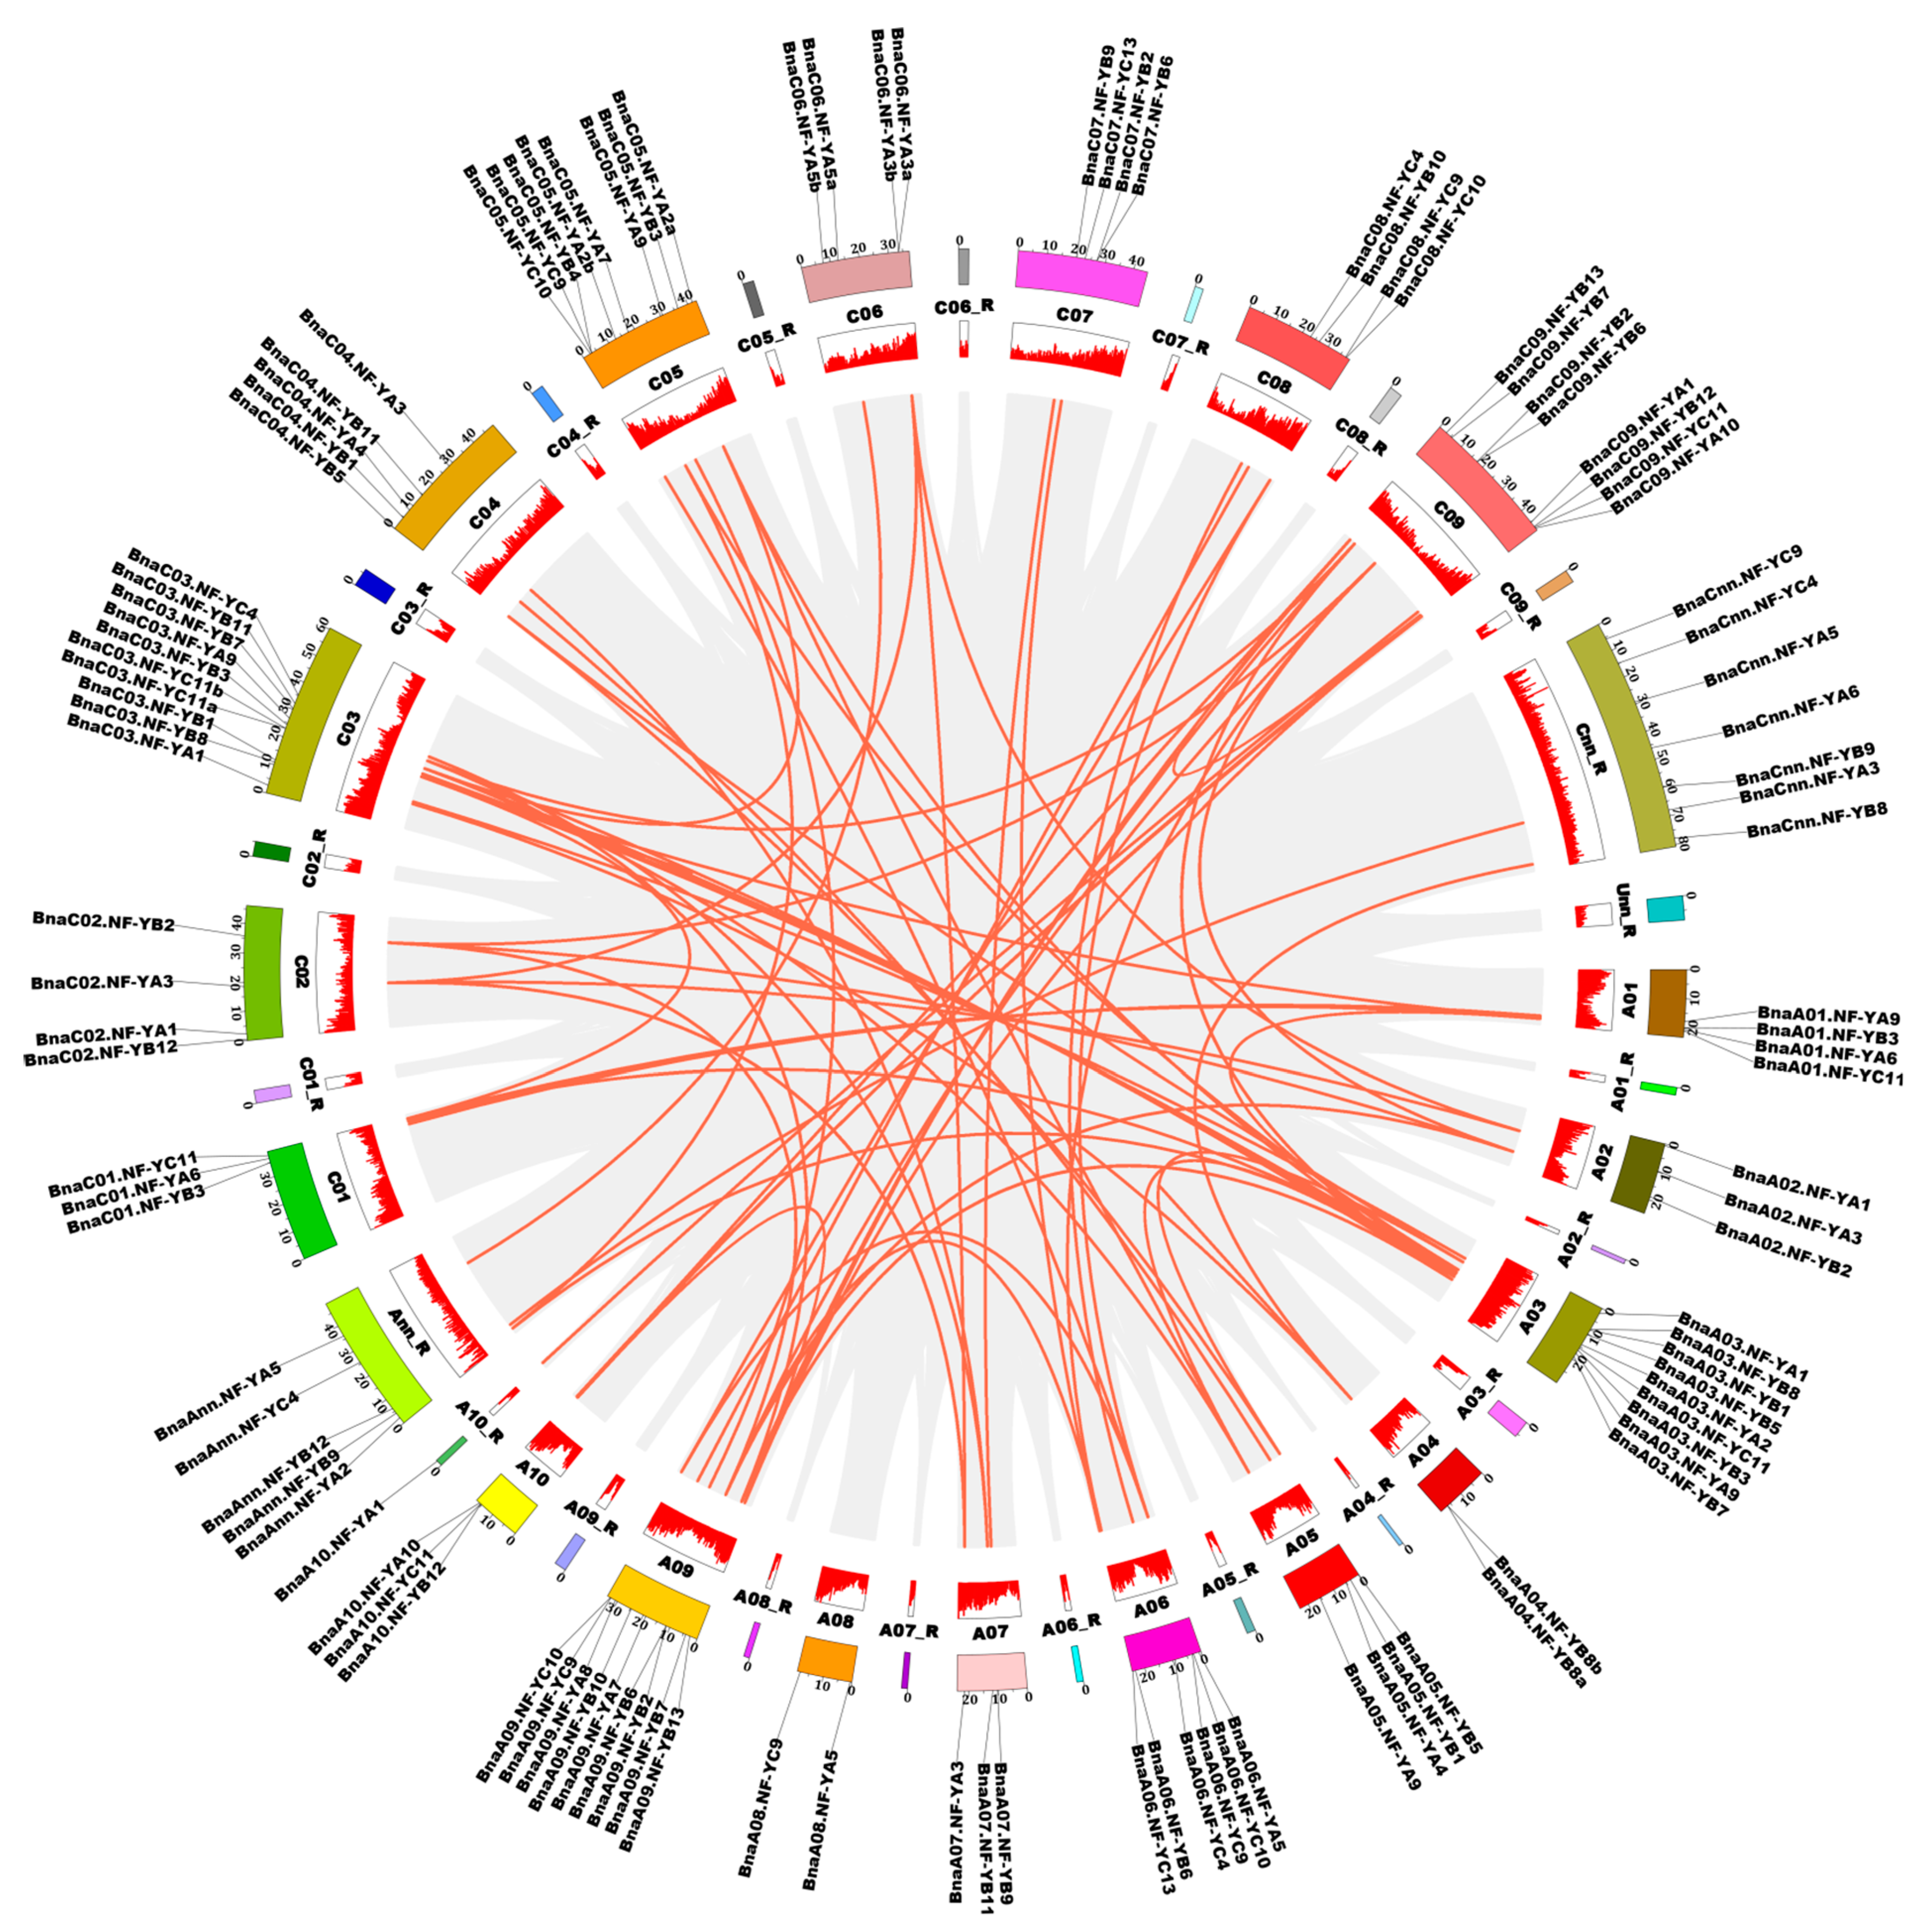
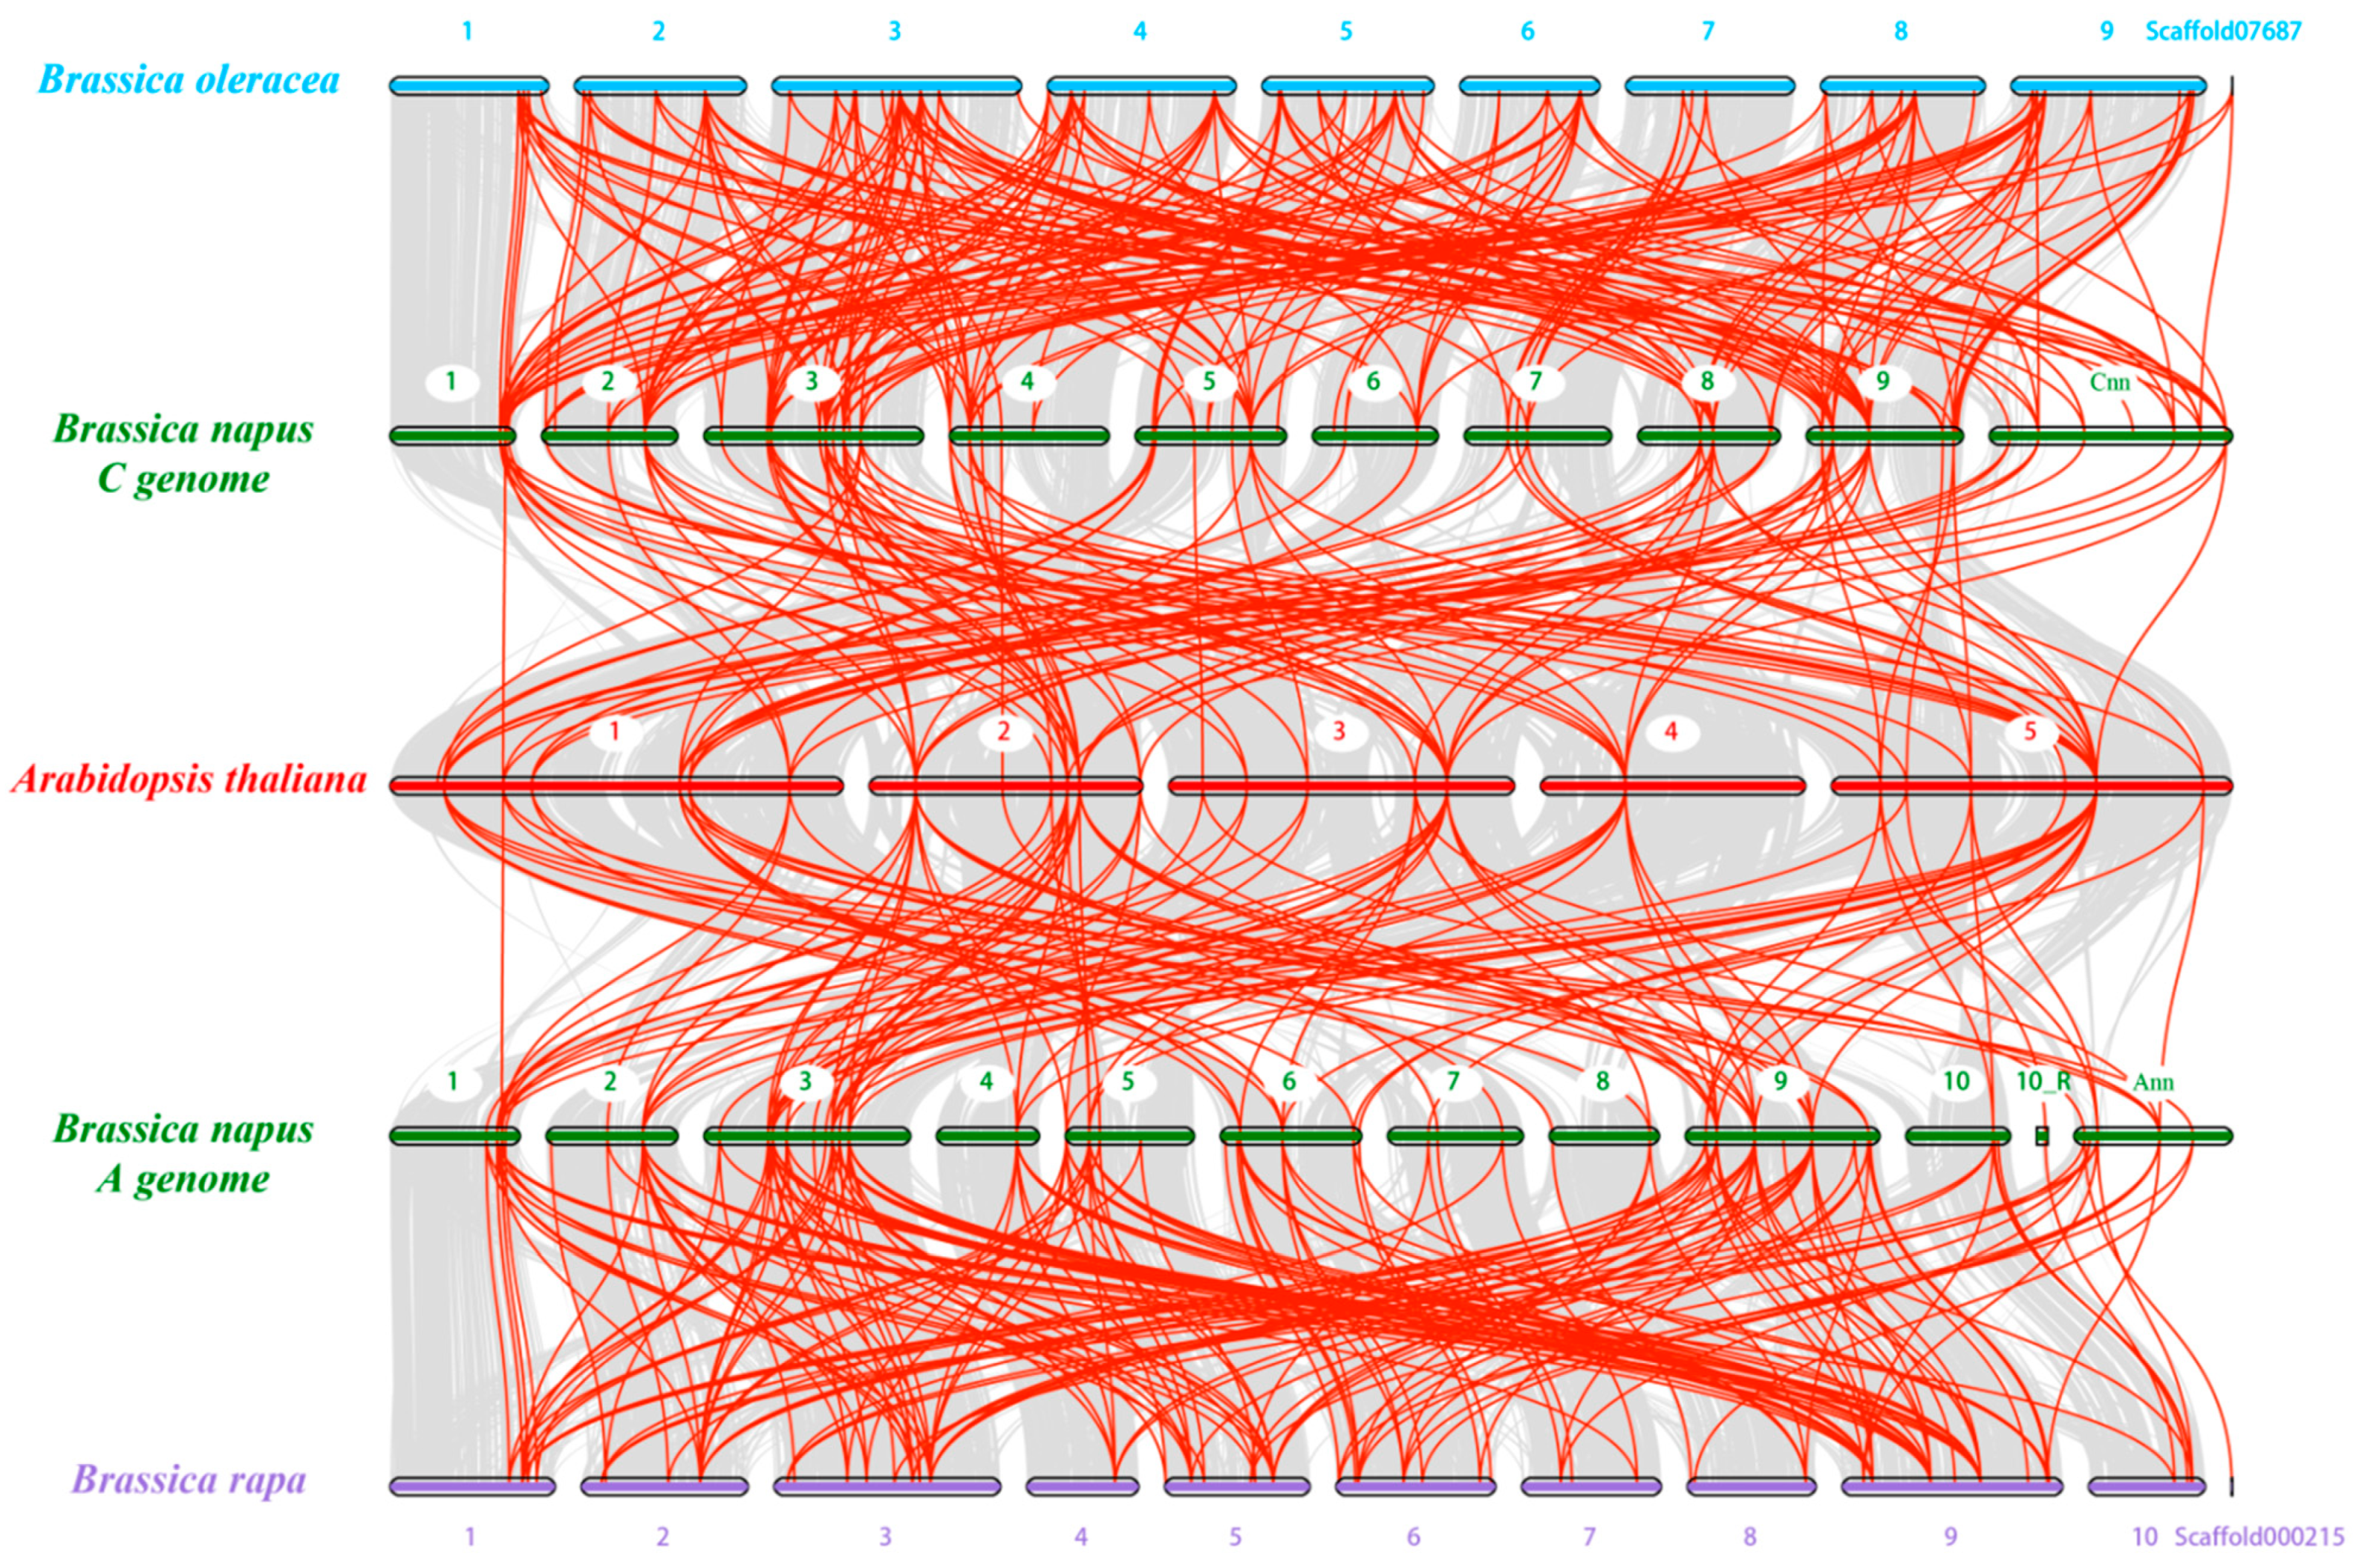
2.5. Chromosomal Location and Gene Duplication Patterns of the NF-Y Genes in B. napus

Chromosomal location analysis revealed that the 108 BnaNF-Y genes were unevenly distributed across ten chromosomes in the A subgenome (51 genes) and nine chromosomes in the C subgenome (57 genes) of B. napus (Figure S3). Among them, the specific location of BnaA10.NF-YA1 on chromosome A10 was unknown, while five genes (BnaAnn.NF-YA2, BnaAnn.NF-YB9, BnaAnn.NF-YB12, BnaAnn.NF-YC4 and BnaAnn.NF-YA5) and seven genes (BnaCnn.NF-YC9, BnaCnn.NF-YC4, BnaCnn.NF-YA5, BnaCnn.NF-YA6, BnaCnn.NF-YB9, BnaCnn.NF-YA3 and BnaCnn.NF-YB8) could not be mapped to a specific chromosome of B. napus. Chromosome C03 contained the largest number of the NF-Y family members, followed by A03, A09, C05 and C09. Chromosomes A08 and A04 had the smallest number of the NF-Y genes.
To unravel the evolutionary processes of the 108 NF-Y genes in oilseed rape, the gene expansion patterns including tandem and segmental duplication were further analyzed using the coding sequences. A total of 144 segmental duplication events were identified using MCScanX methods (Figure 5). The NF-Y genes in the A subgenome of B. napus had high homology with the NF-Y genes in the C subgenome. For example, two genes (BnaA03.NF-YB7 and BnaA03.NF-YC11) located on chromosome A03 had strong homology with two genes (BnaC03.NF-YB7 and BnaC03.NF-YC11a) located on the chromosome C03. Two genes (BnaA09.NF-YB2 and BnaA09.NF-YB6) located on chromosome A09 are highly homologous to two genes (BnaC09.NF-YB2 and BnaC09.NF-YB6) on chromosome C09. However, only two tandem duplication events were observed. These results indicate that the major driving force for the expansion of the NF-Y family genes in B. napus might be segmental duplication events.
Furthermore, a comparative syntenic map between the NF-Y genes in B. napus and Arabidopsis was constructed to further deduce the expansion mechanisms of the B. napus NF-Y family members. The results showed that there were strong orthologs among B. napus, B. rapa, B. oleracea and A. thaliana (Figure 6). In detail, 110 and 187 pairs of collinear relationships were observed in the A subgenome of B. napus with A. thaliana and B. rapa, respectively. Additionally, the C subgenome of B. napus contained 114 and 219 pairs of syntenic relationships with A. thaliana and B. oleracea, respectively. In order to better understand the evolutionary constraints acting on the NF-Y genes between B. napus and A. thaliana, the nonsynonymous (Ka)/synonymous (Ks) ratios were estimated. The results showed that the Ka/Ks ratios of all the NF-Y gene pairs between B. napus and A. thaliana were less than one (Figure 3d–f, Table S4), suggesting that the NF-Y genes in rapeseed might have suffered robust purifying selective pressure during evolution.

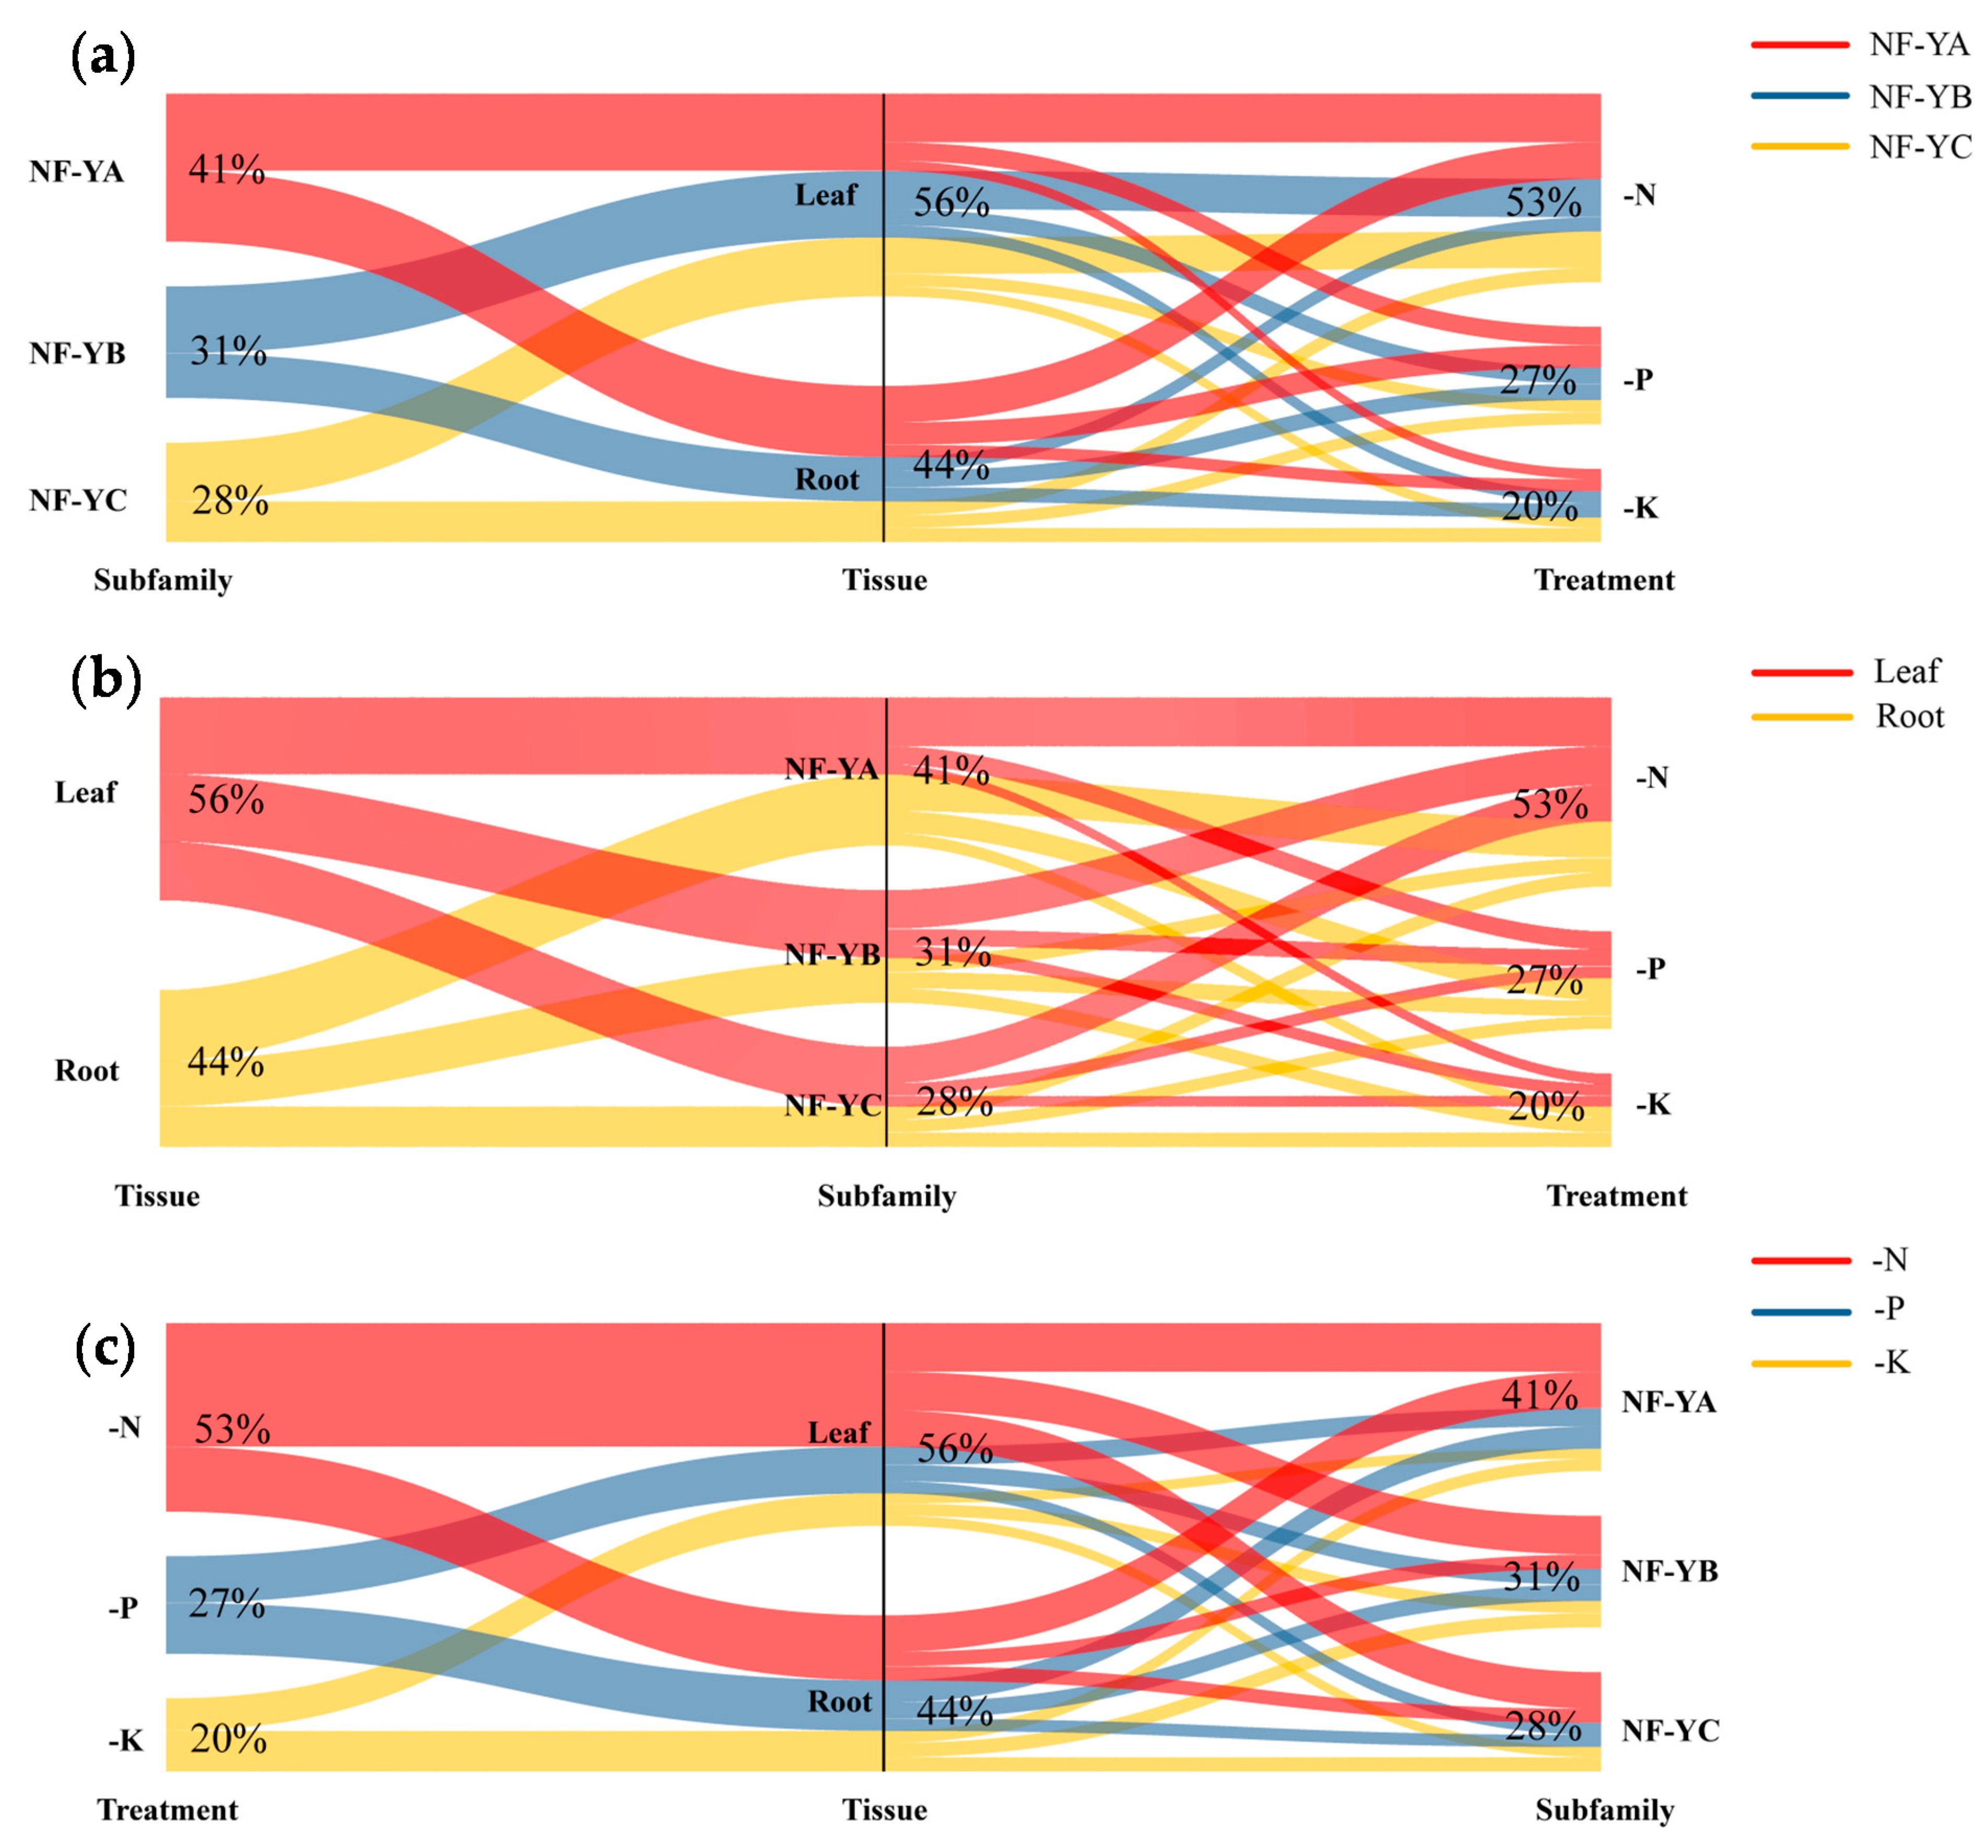
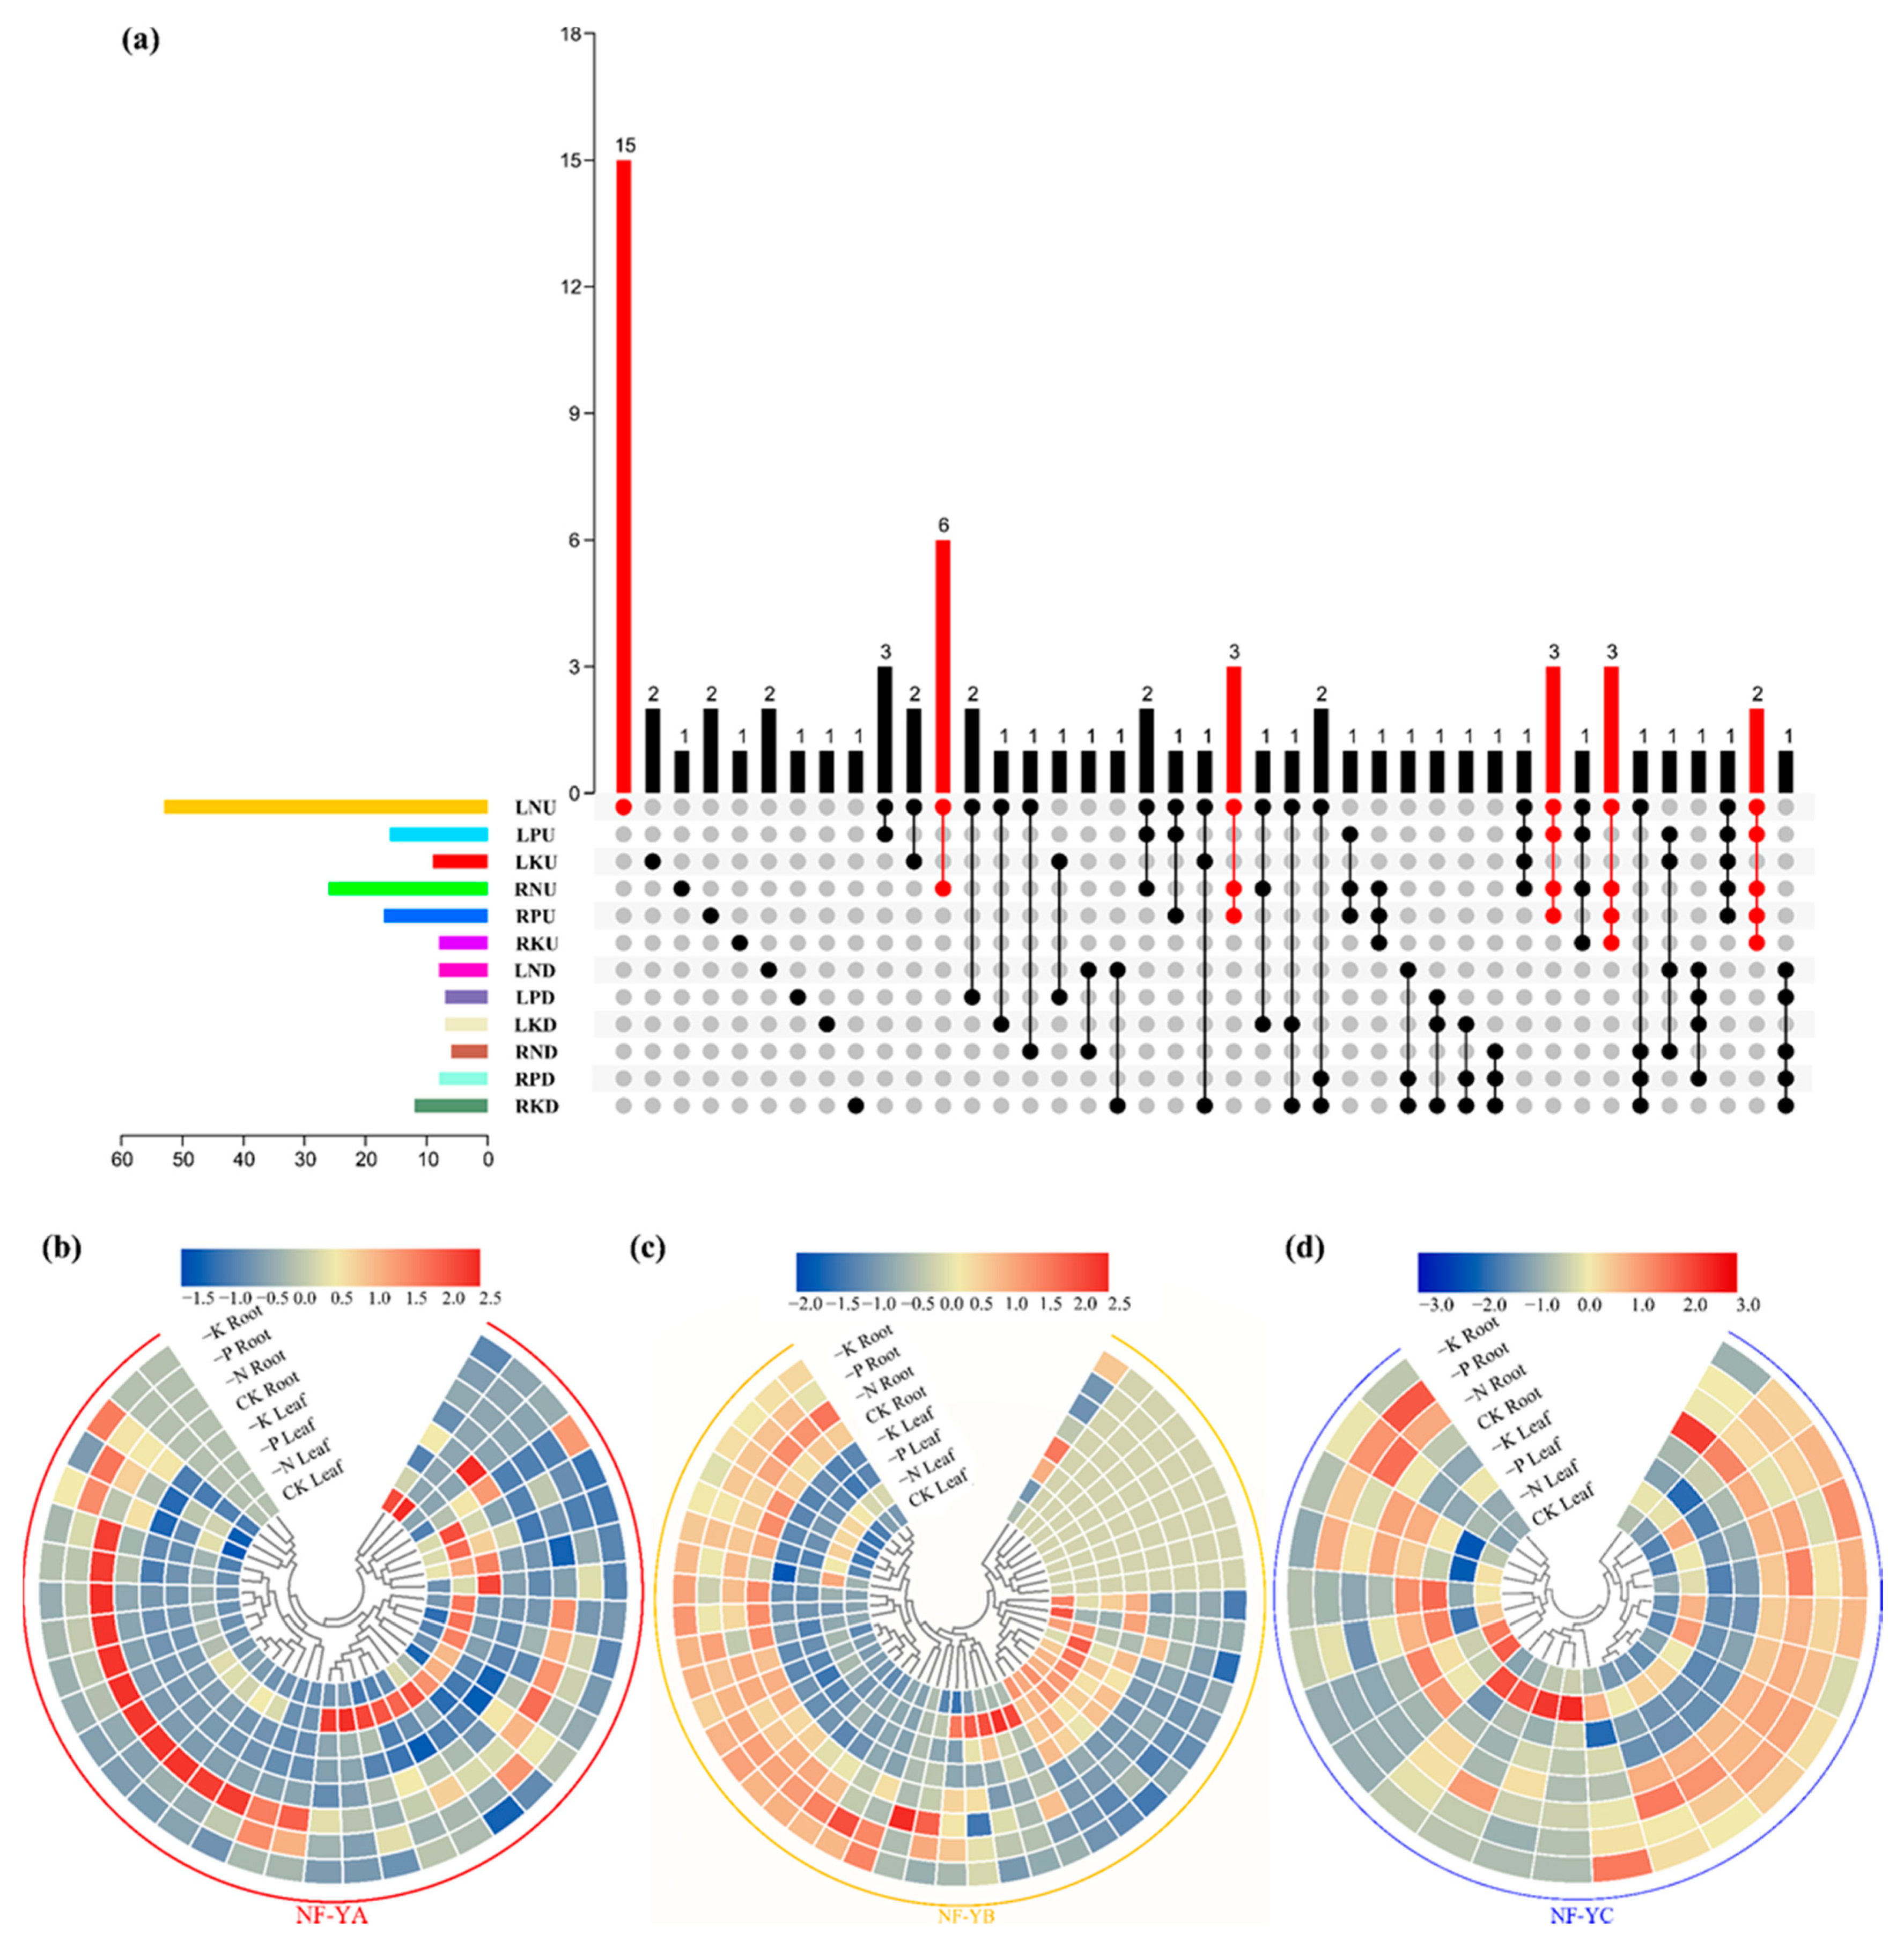
2.6. Expression Patterns of the BnaNF-Y Genes in Response to Different Nutrient Deficiencies

To check the functions of the BnaNF-Y genes in response to various nutrient limitations, the expression profiles of the 108 BnaNF-Y members were analyzed under N, P or K deficiencies as well as sufficient nutrient supply conditions using RNA-seq data. The results demonstrated that the expression levels of the BnaNF-Y genes changed largely in response to different nutrient deficiencies and varied among different subfamilies (Table S5, Figure 7 and Figure S4a). In leaf, the expression of 61, 23 and 16 genes were significantly changed under N, P and K starvations, respectively (Figure S3b). In root, 32, 25 and 20 genes were affected dramatically by N, P and K deficiencies, respectively (Figure S3c). Some of the differentially expressed genes (DEGs) responded specifically to a certain nutrient deprivation, while others changed in response to two or three nutrient deprivations (Figure S3b,c). Among all the DEGs, 86.89% (53/61), 69.57% (16/23) and 56.25% (9/16) of the BnaNF-Y genes were upregulated by N, P and K deficiencies in leaf, respectively (Figure S3d). In root, 81.25% (26/32), 68.00% (17/25) and 40.00% (8/20) of the DEGs were enhanced by N, P and K deficiencies, respectively (Figure S3e). The rest of the DEGs in leaf and root were downregulated by different nutrient limitations (Figure S3d,e). Further analysis of the DEGs showed that 34 genes were regulated only in one nutrient deficiency condition in both leaf and root, including 26 under N deficiency, three under P deficiency, and five under K deficiency (Figure 7a and Table S5). A total of 26 DEGs responded specifically to a certain environment in one organ (Figure 7a). Fifteen DEGs were specifically upregulated by N deficiency in leaf, and six DEGs were specifically induced by N starvation in both leaf and root (Figure 7a), indicating their key roles in N deficiency response. Twelve BnaNF-Y genes were upregulated in one nutrient deficiency treatment but downregulated in another (Figure S6), indicating their opposite roles in regulating different nutrient starvation responses.
Since the NF-Y family is a heterotrimeric complex with three distinct subfamilies, we further analyzed the expression pattern of each subfamily in response to N, P and K limitations. The results showed that 68.42% (26/38), 36.96% (17/46) and 33.33% (8/24) of the NF-YA, NF-YB and NF-YC genes, respectively, were differentially expressed under nutrient limitation conditions (Figure 7b–d). To further characterize the response of the three BnaNF-Y subfamilies to N, P and K starvations in two organs, we calculated the ratios of DEGs under different contexts and visualized the data using Sankey diagrams (Figure 8). In terms of the three NF-Y subfamilies, the differentially expressed NF-YA, NF-YB and NF-YC genes accounted for 41% (73/177), 31% (55/177) and 28% (49/177), respectively (Figure 8a). For the two organs, 44% (77/177) DEGs were detected in root, and 56% (100/177) in leaf (Figure 8b). Moreover, 53% (93/177), 27% (48/177) and 20% (36/177) of the total DEGs responded to N, P and K deficiencies, respectively (Figure 8c). These results suggest that the NF-YA subfamily may play a more important role in response to nutrient deprivation as compared to the NF-YB and NF-YC subfamilies, especially in N deficient environments.

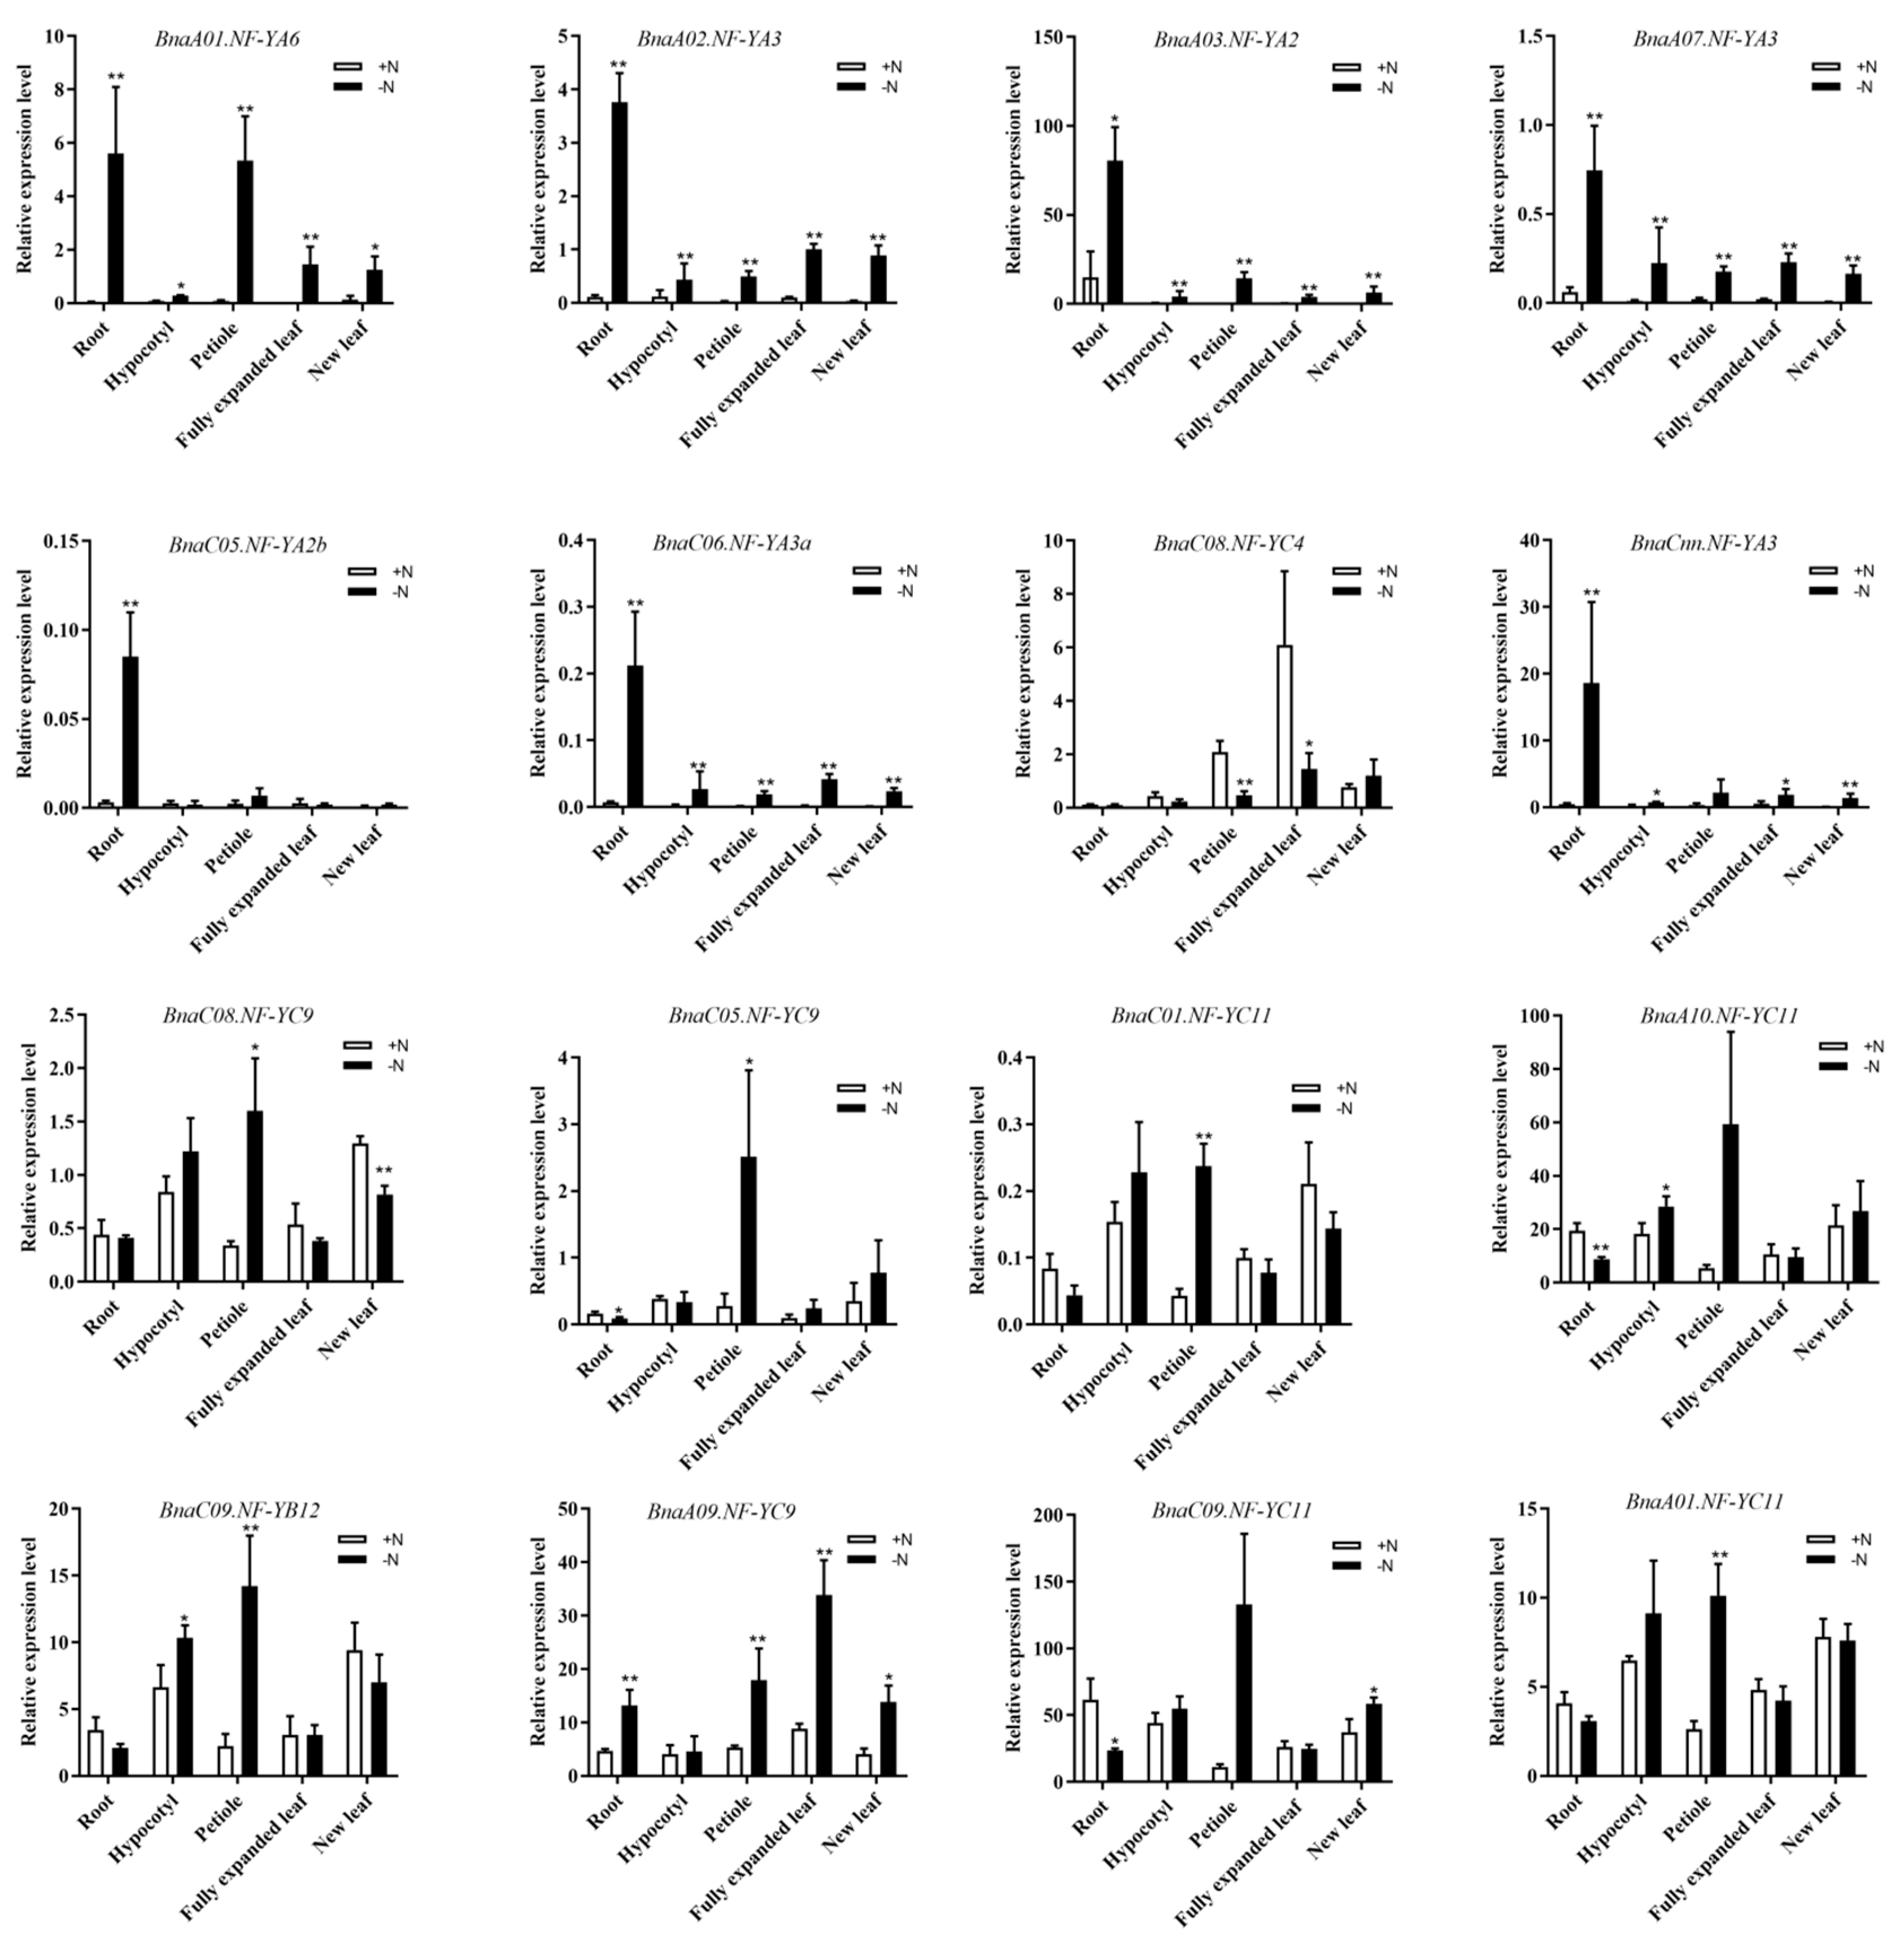
2.7. Discovery of the NF-Y Hub Genes in B. napus and Expression Analysis of these Genes among Different Tissues under N Limitation

To reveal the coexpression relationships among the BnaNF-Y genes, we calculated the interaction weight of the target genes based on the fragments per kilobase million (FPKM) values of the RNA-seq data under N, P and K starvation conditions (Figure S7). Generally, we identified 1091 pairs of coexpression relationships among the 108 BnaNF-Y family genes. Then, the BnaNF-Y genes with the ten strongest interaction relationships with other BnaNF-Y members were considered as the hub genes, as displayed in Figure S7. As shown in Figure 8, more than half (53%) of the DEGs were detected under N deficiency. Hence, to understand the detailed expression profiles of the BnaNF-Y family genes in response to N limitation, we further investigated the expression levels of the 16 core genes in root, hypocotyl, basal node, petiole, fully expanded leaf and new leaf of B. napus using quantitative real-time PCR (qRT-PCR). The results illustrated that the mRNA levels of these genes in oilseed rape were basically consistent with the results from the RNA-Seq data (Figure 9, Table S5). Some genes, such as BnaC05.NF-YA2b, BnaCnn.NF-YA3 and BnaC06.NF-YA3a, were specifically induced by N starvation in root and some had high expression levels in fully expanded leaf, such as BnaC08.NF-YC4 and BnaA09.NF-YC9. Additionally, the core NF-Y genes were expressed differently in tissues other than root and leaf in response to N deficiency (Figure 9). For example, the expression levels of BnaA01.NF-YA6, BnaC08.NF-YC9, BnaC05.NF-YC9, BnaC09.NF-YB12, BnaA01.NF-YC11 and BnaC01.NF-YC11 were significantly induced in petiole by N deficiency.

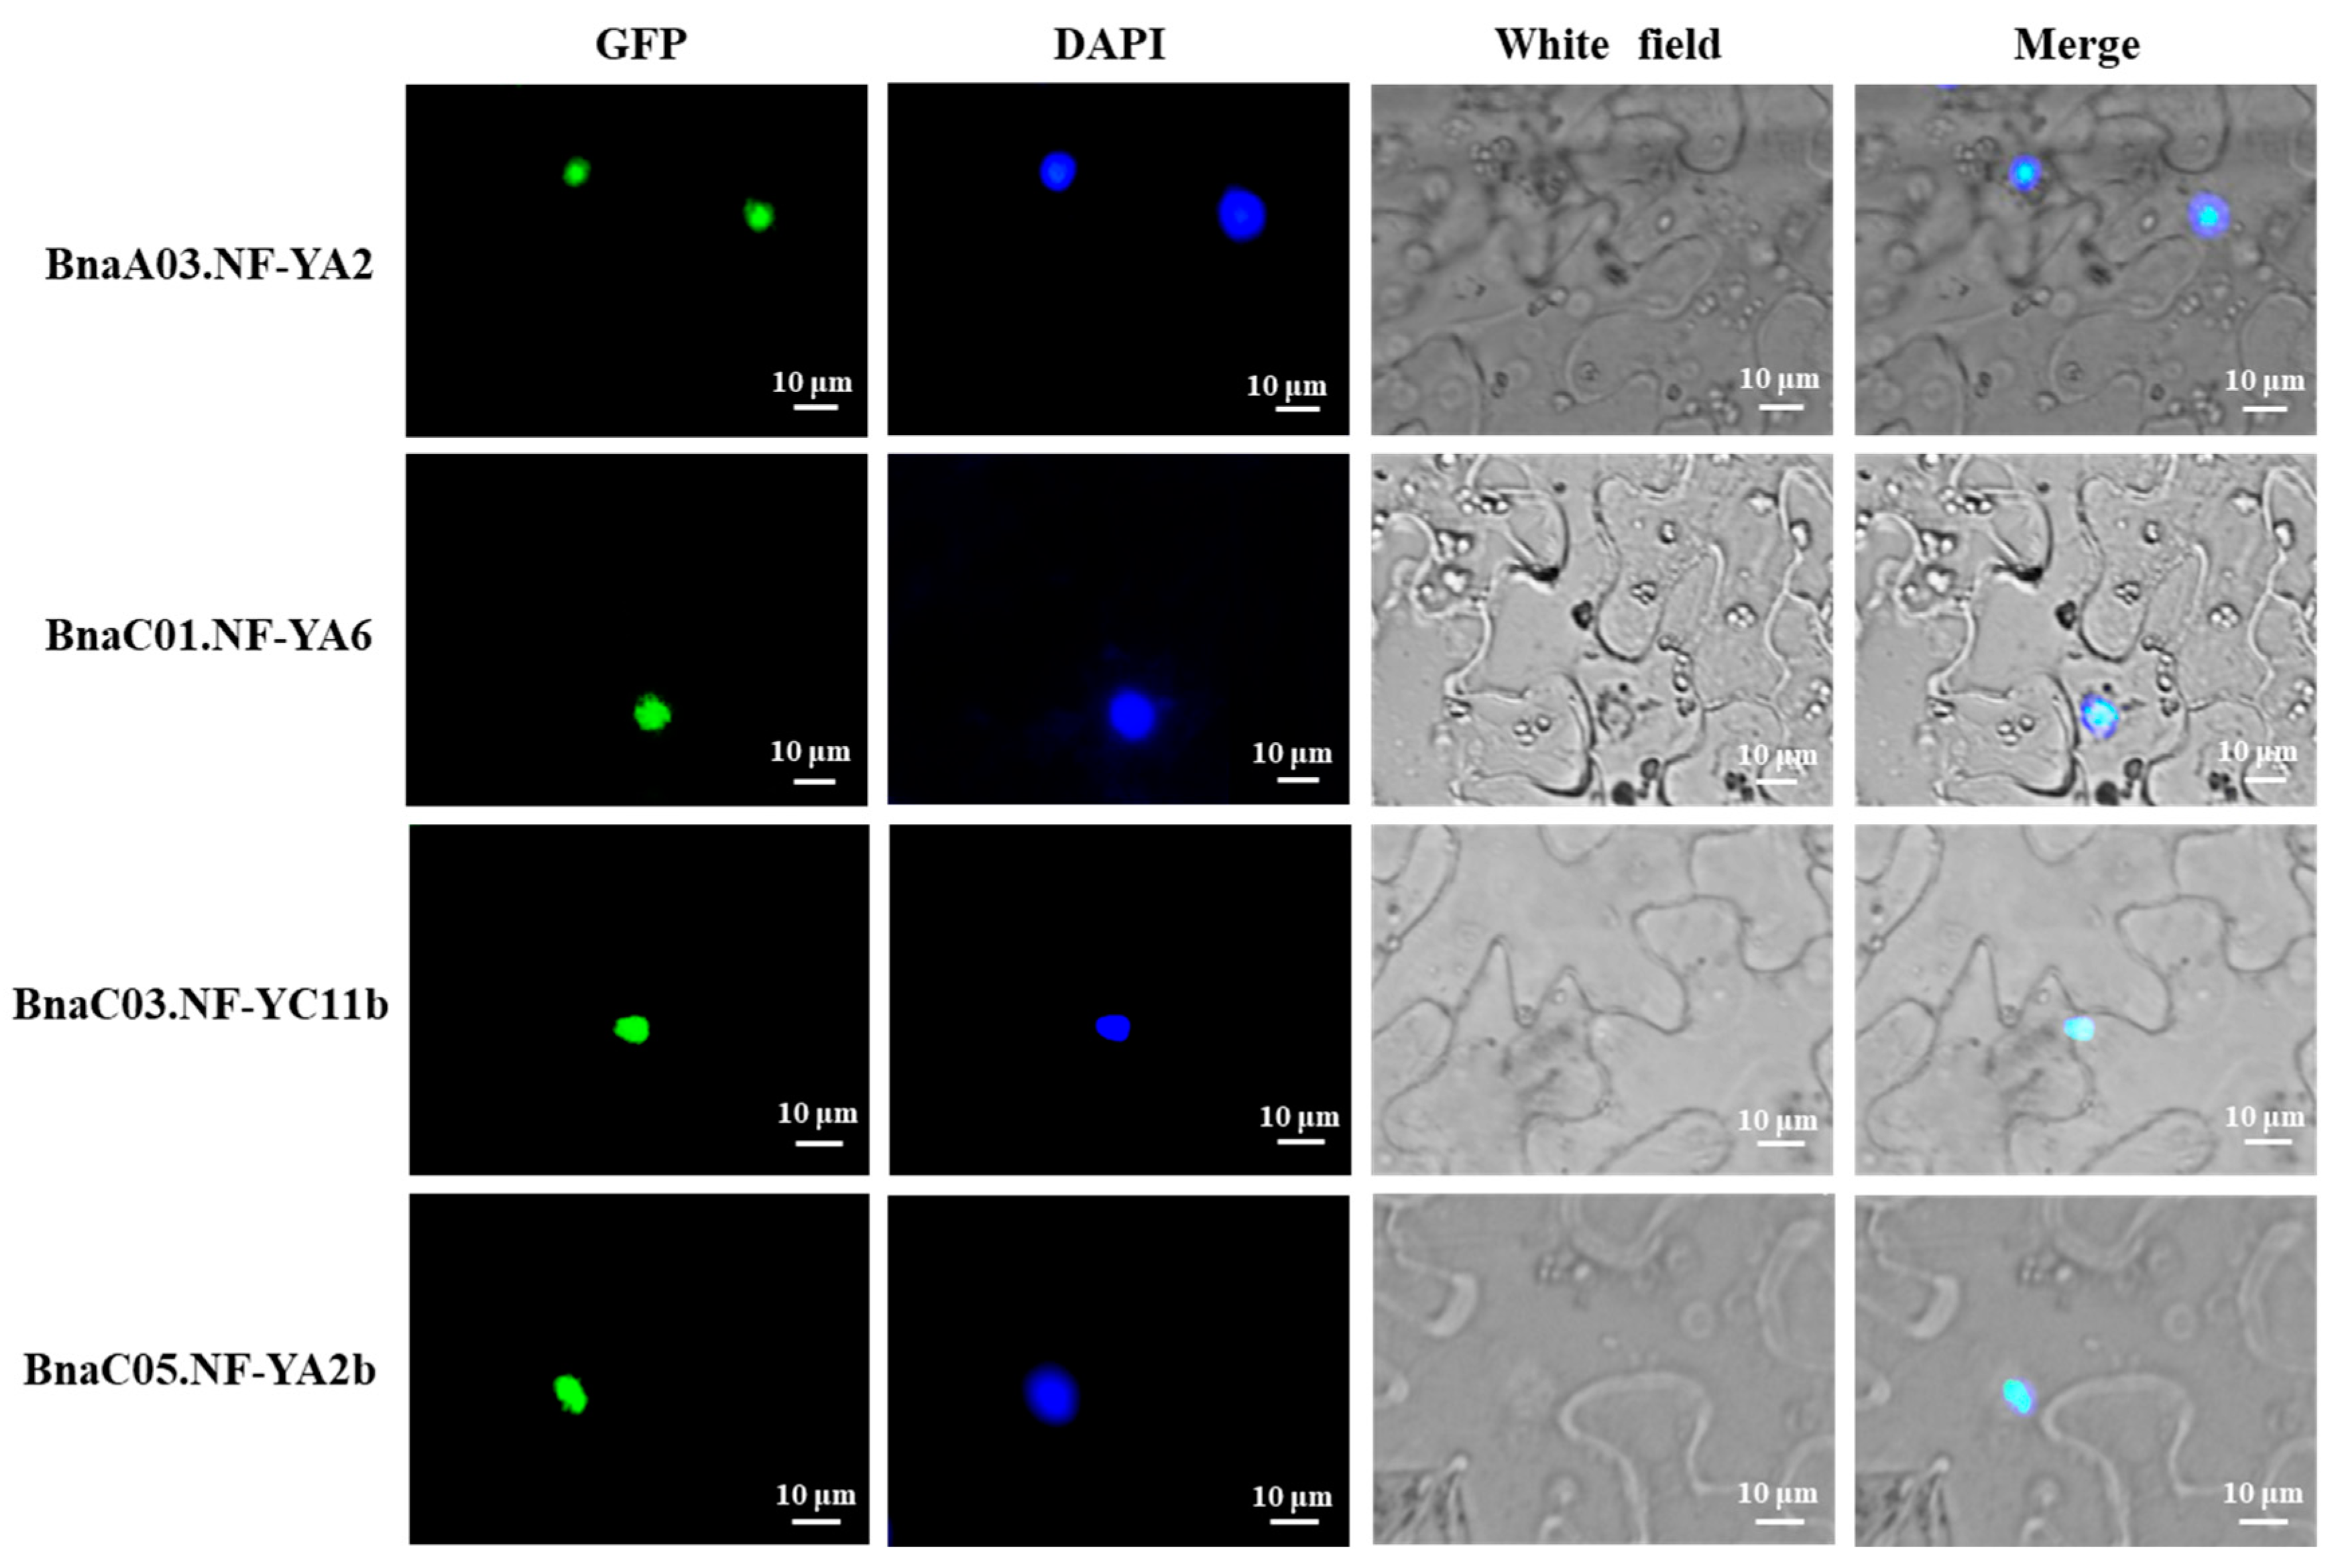
2.8. Subcellular Localization of Four NF-Y Hub Genes in Rapeseed

We further selected four NF-Y hub genes in rapeseed (BnaA03.NF-YA2, BnaC01.NF-YA6, BnaC03.NF-YC11b and BnaC05.NF-YA2b) to explore their subcellular localization. The full length cDNA of four BnaNF-Y genes was isolated and integrated with PMDC83 vector to form 35S::BnaNF-Ys-GFP protein structure. Then, these constructed vectors were injected into tobacco leaves. Meanwhile, we used nuclear dye 4′,6-diamidino-2-phenylindole (DAPI) for auxiliary labeling of nuclei. The results suggested that all of the GFP fusion protein signals were completely merged with the DAPI signals (Figure 10). Consistent with their characteristics as transcription factors, these BnaNF-Y genes were located in the nucleus. Combined with our above analysis, these results jointly emphasized the important roles of NF-Y genes in regulating plant responses to nutrient deficiencies, especially N deprivation.

3. Discussion

The NF-Y genes are trimeric transcription factors in plants, containing the NF-YA, NF-YB and NF-YC subfamilies which include multiple genes [2]. Recently, the NF-Y families have been identified and characterized in several plant species, including Arabidopsis [5], rice [6], soybean [7], sorghum [10], barley [13], apple [15] and more. Previously, the NF-Y genes were identified and characterized in B. napus based on an expressed sequence tag database and the completed B. napus genome sequence in the CoGe database [42,43]. However, there had been no comprehensive genome-wide investigation or systematic characterization in Brassica species. In the present study, 62, 54 and 108 NF-Y genes were identified in B. rapa, B. oleracea and B. napus, respectively (Table S1). Especially in B. napus, the number of NF-Y family members is far greater than that found in other species (Table S2) or in the two previous reports on B. napus [42,43]. Therefore, substantial changes via evolution and selection must have occurred during the evolution processes of Brassica species. Moreover, we found that such purifying selective pressure may have been a strong driving force in the evolution of Brassica species (Figure 3e, Table S4). Interestingly, and similar to other species, the Ka/Ks ratios of all the NF-Y gene pairs were less than one in B. napus, suggesting that the NF-Y family genes may be conserved in function [10]. The gene replication pattern analysis showed that 144 segmental duplication events occurred in the B. napus genome; however, only two tandem duplication pairs were observed (Figure 5). In rice, the NF-Y family expansion was mainly driven by segmental duplication events, which indicates that the NF-Y family might have similar expansion patterns in dicotyledons and monocots [6,32].
Moreover, the conserved domain analysis of the NF-Y subfamilies in three Brassica species and Arabidopsis indicates that the NF-YC subfamily excepted, the NF-YA and NF-YB subfamilies are relatively conservative (Figure 2). Both the NF-YA and NF-YC subfamilies in B. oleracea showed large differentiation compared with others, which further provides strong evidence for an obvious selection during the evolution of Brassica species. Similarly, the gene structure and motifs differed across different subfamilies in B. napus, which is consistent with previously reports in sorghum [10], citrus [12] and tea [44]. However, the NF-Y genes in the same subfamily, such as NF-YB11s, had a similar composition and arrangement of structure and motifs, suggesting that the function of genes in each subfamily may be relatively conserved in B. napus (Figure 4, Table S3). Generally, these results put forward new insights into the phylogenetic mechanism of the NF-Y family in Brassica species.
Over the past decade, the NF-Y genes as the key regulators of drought resistance in plants have been widely investigated [34]. Previous studies showed that over-expression of the NF-Y genes could enhance drought tolerance in Arabidopsis [45,46] and Populus [47]. However, fewer studies focused on the relationships between the NF-Y genes and plant stress resistance under nutrient limitation conditions. Here, we investigated the expression of the NF-Y family in B. napus in response to multiple nutrient limitations. The results suggest that the mRNA levels of the BnaNF-Y family members display various expression patterns under distinct nutrient deficiencies, which may be related to their complex structure and motif compositions (Figure 7 and Figure S4a, Table S5). In soybean, NF-YA12 was upregulated by abscisic acid, NaCl and cold stresses [7]. Likewise, several NF-Y genes were induced under multiple stress conditions in sorghum [11]. Interestingly, except for the BnaNF-Y genes (whose expression levels were regulated by different nutrient deficiencies) we also found that the expression changes of 34 genes were stress-specific (Figure 7 and Figure S5). Among them, the expression levels of seventeen, one and three BnaNF-Y genes were specifically regulated in leaf under N, P and K deprivations, respectively, while only five genes which specifically responded to a certain nutrient deficiency were observed in roots (Figure 7). Thus, that these NF-Y genes responded specifically to a certain tissue under a specific nutrient deficiency may indicate a unique role in improving stress resistance in B. napus. In addition, reports show that ABA-dependent or independent signaling pathways are involved in the response of many NF-Y genes to abiotic stresses [31,48]. In the current research, the expression levels of 12 BnaNF-Y genes were inversely regulated under multiple nutrient deprivations, indicating that they might participate in completely different regulatory pathways in order to regulate plant growth. However, whether the regulatory pathways associated with the BnaNF-Y genes are ABA-dependent or independent still needs to be further verified.
In sorghum, the expression profiles of the three NF-Y subfamily members differed largely in response to various abiotic stresses, suggesting that different NF-Y subfamily members might have specific subfunctionalization [11]. Similar results were observed here, in that the BnaNF-YA family genes had the most obvious response to multiple nutrient starvations (Figure 7b–d and Figure 8). Consistent with previous studies, the NF-YA family members were the genes most related to regulation of plant nutrient deficiency responses. For example, three Arabidopsis NF-YA genes (AtNF-YA2, AtNF-YA7 and AtNF-YA10) might be post-transcriptionally regulated by miR169 to regulate plant tolerance to P deficiency [35]. In addition, the absorption of N and P as well as grain yield were significantly enhanced in the TaNFYA-B1 over-expression lines under N and P deficient levels in wheat [37]. Therefore, compared with other subfamily members the NF-YA subfamily might act as a more critical player in response to nutrient deficiencies in B. napus. Among these, the responses of the BnaNF-YA family to nutritional starvations were slightly changed compare to that in Arabidopsis. For instance, the expressions of AtNF-YA2, AtNF-YA3 and AtNF-YA5 were be induced by P deficiency [49], while their homologous genes in B. napus were nearly unaffected by P limitation (Table S5). However, the three NF-YA genes were upregulated by N deprivation in both Arabidopsis and B. napus [36], indicating that they still retained some important functions in B. napus (Table S5). N deficiency significantly inhibited the growth of B. napus compared with other nutrient deficiencies, and strongly regulated the expression of most NF-Y genes (Figure 1 and Figure 8). Thus, the results fully suggest that the BnaNF-Y family genes may have important roles in response to N limitation in oilseed rape, especially the NF-YA subfamily (Figure 8).
The homologous genes of other species contained more than one copy compared with Arabidopsis, and might have experienced functional differentiation. In B. napus, the complex evolutionary processes of the NF-Y family genes give rise to its functional diversification under multiple nutrient deficiencies. To investigate the expression changes of the BnaNF-Y genes in response to different nutrient limitations in more details, we identified 10 hub genes based on the coexpression network analysis (Figure S7). Besides the NF-YA and NF-YC subfamilies that have been reported to be closely related to nutrient deficiencies, another four BnaNF-YB genes also displayed strong relationships (Figure S7). Reports showed that AtNF-YA2, AtNF-YA3, AtNF-YA5 and AtNF-YA8 were post-transcriptionally regulated by miR169a to enhance plant adaptability to low N availability in soil, while AtNF-YC4 was related to N and carbon distribution in plants [36,49]. Furthermore, the sensitivity of the NF-Y family genes to N starvation was higher than that to P and K starvations in B. napus (Figure 8). Thus, we further investigated the mRNA levels of the BnaNF-Y hub genes and other BnaNF-Y genes specifically responding to N deficiency in different tissues. In line with other species, most NF-Y genes revealed intense tissue specificity, and seven BnaNF-YA subfamily genes were mainly induced by N deficiency in root (Figure 9). Such tissue-specific expression patterns have been observed in a few plants [11,50]. Interestingly, BnaA10.NF-YC11 was significantly induced in hypocotyl by N deficiency, but was inhibited in root (Figure 9), suggesting that this gene might play different roles in specific tissues under N deficiency. In addition, unlike other genes, BnaC08.NF-YC4 was significantly inhibited in petiole and fully expanded leaf (Figure 9). Meanwhile, BnaNF-Ys as a transcription factor was located in the nucleus (Figure 10). This evidence indicates that the BnaNF-Y genes might participate in modulating nutritional stress tolerance through positive or negative mechanisms, which have been testified to in Arabidopsis [35].

4. Materials and Methods

4.1. Identification of the NF-Y Family Genes in B. napus

The NF-Y family members of B. napus were obtained using BLASTP in the CNS-Genoscope genomic database (http://www.genoscope.cns.fr/brassicanapus/, accessed on 1 September 2019) based on the protein sequences of 36 Arabidopsis NF-Y genes from TAIR database (https://www.arabidopsis.org/, accessed on 1 September 2019). The homologous genes in three Brassica species were obtained based on E-value < 1 × 10⁻⁵. The redundant gene sequences of the identified Brassica species were removed manually. In order to ensure the reliability of identified genes, the Hidden Markov Model (HMM) in the Pfam database (http://pfam.xfam.org/, accessed on 1 September 2019) was employed with E-value < 0.001 to eliminate out-of-standard genes, which also did not contain the complete CBFD-NFYs domain (PF02045 and PF00808). The full genomic sequences, coding sequences and protein sequences of B. napus NF-Y members were derived from the B. napus genome database. For B. rapa and B. oleracea, the same methods described above were used to obtain the sequence information of NF-Y family members from the Brassica Database (BRAD, http://brassicadb.org/brad, accessed on 1 September 2019).

4.2. Chromosomal Location and Gene Duplication Analysis of the NF-Y Genes in B. napus

The chromosomal locations of the NF-Y genes were determined from the B. napus genome database and were displayed by TBtools [51]. Gene duplication events and collinearity relationships of the NF-Y genes in Arabidopsis and three Brassica species were analyzed using Multiple Collinearity Scan toolkit (MCScanX) [52]. The standard for identifying potential gene duplication was defined by the following two points: (a) the comparison region covers more than 75% of the gene; and (b) the similarity of the aligned regions is more than 75%. Likewise, the gene duplication events and collinearity relationships of the NF-Y genes between B. oleracea and B. napus or between B. rapa and B. napus were analyzed using the same methods described above. MCScanX was employed to construct the map which was used to demonstrate the syntenic relationships between the B. napus NF-Y family genes and its ancestors in Arabidopsis, B. rapa and B. oleracea.

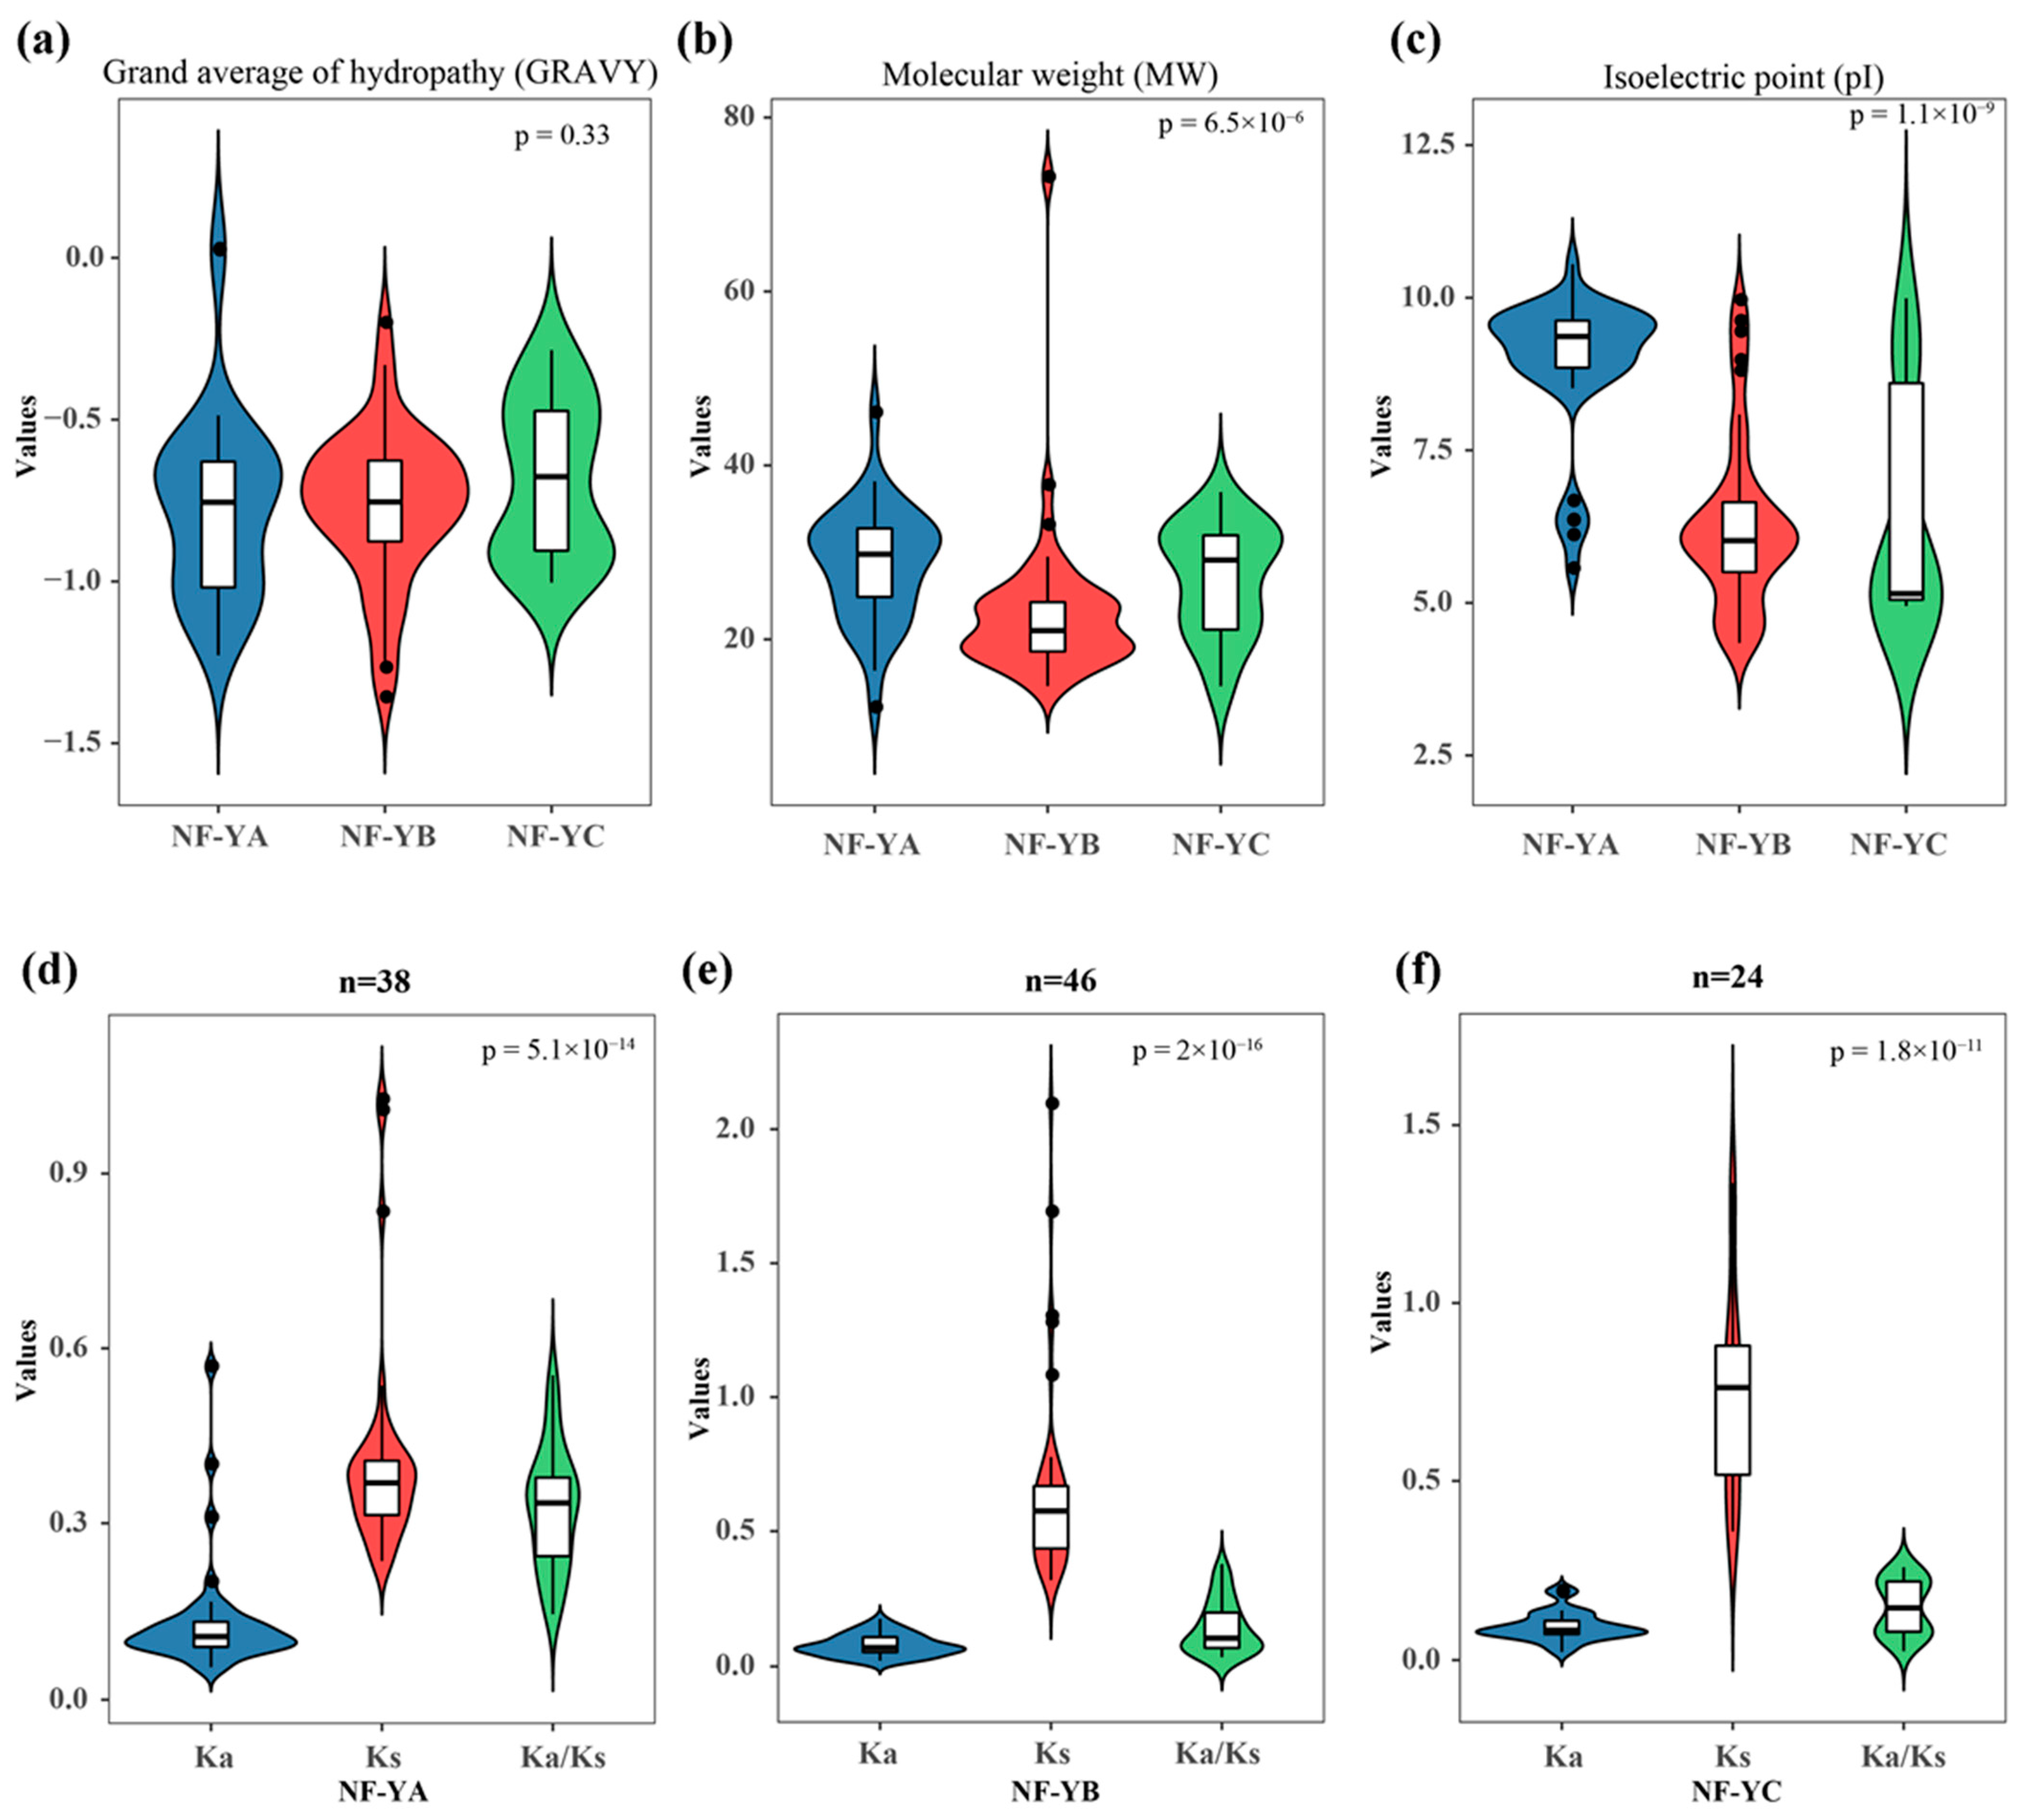
4.3. Phylogenetic Relationships and Evolutionary Pressure Analysis of the B. napus NF-Y Genes

MEGA7 software was employed to conduct the protein sequence alignments with default parameters, and the evolutionary tree analysis tool was used to build phylogenetic trees with the neighbor joining (NJ) method based on 1000 bootstraps [53]. In order to analyze the selection pressure of BnaNF-Y family evolution, values of the Ka, Ks and Ka/Ks ratio between Arabidopsis and B. napus were calculated based on the sequence alignments. Pairwise alignments of the gene CDS without stop codon were performed to calculate Ka/Ks ratio by the Ka/Ks calculator in TBtools software [51]. Generally, a Ka/Ks ratio greater than one indicates positive selection, while a Ka/Ks ratio less than one suggests a functional constraint; equal to one indicates neutral selection [54].

4.4. Molecular Characterization Analysis of the B. napus NF-Y Family Genes

The full genomic sequences, coding sequences and protein sequences of the BnaNF-Y genes downloaded from the CNS-Genoscope genomic database were used to analyze gene structure by multiple alignments. The gene structure was then visualized in TBtools [51]. The potential conserved motifs of the NF-Y family genes in Arabidopsis and B. napus were detected using Multiple Expectation Maximization for Motif Elicitation program (MEME, http://meme-suite.org/tools/meme, accessed on 3 June 2019) with the following four parameters: (a) the maximum input data was 6000; (b) the analysis mode was anr; (c) the optimum motif width ranged from 6 to 50; and (d) the maximum motif number was 20 [55]. Moreover, the MW and pI of BnaNF-Y proteins were calculated using ExPASy tool (http://www.expasy.org/tools/, accessed on 3 June 2019), and the GRAVY values of the proteins were analyzed using the PROTPARAM tool (http://web.expasy.org/protparam, accessed on 3 June 2019). WoLF PSORT server (https://wolfpsort.hgc.jp/, accessed on 3 June 2019) was employed to predict the subcellular localizations of the BnaNF-Y proteins.

4.5. Heat Map and Coexpression Networks of the BnaNF-Y Family Genes Using RNA-seq Data

The heat map and gene coexpression network analysis were performed based on the RNA-seq data. In the RNA-seq experiment, 14-day-old rapeseed seedlings were treated with N-free, P-free and K-free nutrient solution for 10 days. Then, the fully expanded leaf and root were harvested separately for RNA extraction. After harvest, all samples were frozen immediately in liquid N and then stored at −80 °C. Each treatment included three independent biological replicates. Illumina HiSeq 2500 platform (Illumina, San Diego, CA, USA) was applied to perform transcriptome sequencing. The FPKM values indicating the transcript abundance of all genes under control and N/P/K deficient conditions were obtained based on gene length and the reads mapped to the gene. Moreover, DEGs were identified based on p value < 0.05 between control and treatments. The interactions and weight values of the target genes were analyzed using DeGNServer online tools (http://plantgrn.noble.org/DeGNServer/Analysis.jsp, accessed on 9 October 2019) based on the FPKM values. Cytoscape software was employed to visualize the coexpression networks of the BnaNF-Y genes [56].

4.6. Plant Materials and Growth Conditions

A B. napus cultivar named “ZS11” was planted in an illuminated growth room (22 °C; 16 h light/8 h dark) with a light intensity 300–320 mmol protons m−2 s−1. The seeds were first disinfected and soaked in deionized water in the dark for two days, then transferred to 0.5 mM CaCl2 solution for three days to promote root development. Finally, modified Hoagland’s solution with pH 5.8 was used for seedling growth, containing 5.0 mM Ca(NO3)2, 5.0 mM KNO3, 1.0 mM KH2PO4, 2.0 mM MgSO4, 46.0 μM H3BO3, 9.0 μM MnCl2, 0.3 μM CuCl2, 0.8 μM ZnCl2, 0.32 μM Na2MoO4 and 50.0 μM EDTA-iron (Fe). After nine days’ growth, plants were treated with different nutrient concentrations for six days, including N, P and K deficiencies. CaSO4 and K2SO4 were used to substitute Ca(NO3)2 and KNO3 in N starvation treatment, respectively. K2SO4 was replaced by KH2PO4 in P starvation treatment. In K starvation treatment, NaH2PO4 and NaNO3 were used to replace KH2PO4 and KNO3, respectively. Tissue samples were collected after the treatments and stored at −80 °C until RNA extraction. Three biological replicates were prepared for each treatment. For phenotypic analysis, the B. napus cultivar “ZS11” was cultivated for 11 days under low N (LN, 100 μM), low P (LP, 5 μM) and low K (LK, 5 μM) conditions (Figure 1). Then, the taproot root length, shoot and root dry weight were measured. SPAD value was measured by SPAD meter (SPAD 502 plus, Minolta, Japan). Photosynthetic parameters were detected by Photosynthesis System (CIRAS-3, America).

4.7. Expression Analysis of the BnaNF-Y Genes under Multiple Nutrient Deficiencies

A RNeasy Plant Mini Kit (Qiagen) was used to extract the total RNA of each sample, and a First Strand cDNA synthesis kit (Toyobo) was employed to synthesize cDNA. The qRT-PCR was carried out in a 10 μL volume containing 2.5 μL cDNA, 0.2 μL primers, 5 μL Hieff qPCR SYBR Green Master Mix (Low Rox). The thermal cycle was as follow: 95 °C 5 min; 40 cycles of 95 °C for 10 s, 60 °C for 20 s, 72 °C for 20 s. qRT-PCR was performed using the QuantStudio 6 Flex instrument (Life Technologies, USA). The relative gene expression levels were calculated according to the 2−ΔΔCt method [57]. The housekeeping gene EF1-α (Accession number DQ312264) was used as an internal standard [58]. The primers used for qRT-PCR in this study are listed in Table S6.

4.8. Subcellular Localization Analysis of the BnaNF-Y Genes

For subcellular localization, the coding regions of four BnaNF-Y genes without stop codons amplified from “ZS11” were ligated separately into the vector (PMDC83) driven by the CaMV35S promoter. DAPI was used to stain nuclei; they were cultured on LB agar supplemented with selection antibiotics and incubated at 28 °C for two days. The confluent Agrobacterium with the target vector were resuspended in infiltration buffer (10 mM MgCl2, 0.5M MES (pH 5.6), 100 mM acetosyringone) to an optical density (600 nm) of 1.0, and incubated at room temperature without shaking for 3 h before infiltration. Approximately 2 mL of the Agrobacterium mixture was then infiltrated into the back of 3-4 young leaves of tobacco. The subcellular localization assay was performed 2 d after inoculation [59]. A fluorescence microscope was used to record the images.

4.9. Statistical Analysis

Student’s t test was used to perform the statistics in SPSS 22 (IBM, Chicago, IL, USA). Significance of differences was defined as * p < 0.05, ** p < 0.01.

Supplementary Materials

The following are available online at https://www.mdpi.com/article/10.3390/ijms221910354/s1, Figure S1: Phylogenetic tree of the NF-Y family in B. napus and Arabidopsis. The analysis includes 144 protein sequences, including 108 from B. napus (white star) and 36 from Arabidopsis (light green circle). The different colors mean different subfamilies. Figure S2: The sequence information of the NF-Y family protein for each motif in Arabidopsis and B. napus. Figure S3: Chromosomal distribution of the NF-Y family members in B. napus. The localization of each BnaNF-Y gene on the chromosome was represented via colored fonts. Bar = 5 Mb. Figure S4: The expression map of all B. napus NF-Y genes: (a) The heat map of all B. napus NF-Y genes. The color scale is shown above the expression map. The data in the heat map was normalized (z-scores) using FPKM values and then visualized by Tbtools. The higher the value of the color scale, the higher the expression, and vice versa; (b) Venn diagram of the differentially expressed genes (DEGs) among three nutrient deficiencies in leaf; (c) Venn diagram of the DEGs among three nutrient deprivations in root; (d) The number of total, up- and downregulated DEGs in response to three nutrient deficiencies in leaf; (e) The number of total, up- and downregulated DEGs in response to three nutrient limitations in root. CK: sufficient nutrient supply; -N: nitrogen deficiency condition; -P: phosphorus deficiency condition; -K: potassium deficiency condition. Figure S5: Heat map of the B. napus NF-Y family genes differentially expressed in only one treatment based on the RNA-seq data. The color scale is shown above each subfamily. The data in the heat map was normalized (z-scores) using FPKM values and then visualized by TBtools. The higher the value of the color scale, the higher the expression, and vice versa. CK: sufficient nutrient supply; -N: nitrogen deficiency condition; -P: phosphorus deficiency condition; -K: potassium deficiency condition. * and ** indicate significant differences at p < 0.05 and p < 0.01 per student’s t test, respectively. Figure S6: Heat map of the B. napus NF-Y family genes differentially expressed in two or three treatments based on the RNA-seq data. The color scale is shown above each subfamily. The data in the heat map was normalized (z-scores) using FPKM values and then visualized by Tbtools. The higher the value of the color scale, the higher the expression, and vice versa. CK: sufficient nutrient supply; -N: nitrogen deficiency condition; -P: phosphorus deficiency condition; -K: potassium deficiency condition. * and ** indicate significant differences at p < 0.05 and p < 0.01 per Student’s t test, respectively. Figure S7: Co-expression networks of the BnaNF-Y genes. Cycle nodes represent genes, and the size and color of the nodes represents the power of the interrelation among the nodes by degree value. The width and the color of the lines between two nodes represent interactions between two genes. The hub NF-Y genes are located in the center of the network, while the 10 most coexpressed genes are displayed in the network. Table S1: Statistics of the NF-Y genes in each subfamily in Arabidopsis and three Brassica species. Table S2: Copy number variations of the NF-Y family in higher plants. Table S3: Characteristics of the NF-Y family members in B. napus and subcellular localization prediction. Table S4: Non-synonymous (Ka) and synonymous (Ks) nucleotide substitution rates for the NF-Y coding loci in Arabidopsis and B. napus. Table S5. FPKM values of the NF-Y family genes in leaf and root of B. napus under N, P and K deficiencies based on the RNA-seq data. Table S6: Primers used for quantitative real-time PCR in this study.

Author Contributions

Conceptualization, J.H. and G.D.; Data curation, X.Z.; Formal analysis, S.W.; Funding acquisition, J.H. and G.D.; Investigation, H.Z. and L.Z.; Methodology, X.Z.; Writing—original draft, H.Z. and G.D.; Writing—review & editing, F.X. and L.S. All authors have read and agreed to the published version of the manuscript.

Funding

This work was supported by the National Key Research and Development Program of China (2018YFD0200900), the Grants from the National Natural Science Foundation of China (31672215) and the Fundamental Research Funds for the Central Universities of China (2662019PY013).

Institutional Review Board Statement

Not applicable.

Informed Consent Statement

Not applicable.

Data Availability Statement

The data presented in this study are available on request from the corresponding authors.

Conflicts of Interest

The authors declare that they have no known competing financial interests or personal relationships that could have appeared to influence the work reported in this paper.

References

  1. Hahn, S.; Guarente, L. Yeast HAP2 and HAP3: Transcriptional activators in a heteromeric complex. Science 1988, 240, 317–321. [Google Scholar] [CrossRef]
  2. Petroni, K.; Kumimoto, R.W.; Gnesutta, N.; Calvenzani, V.; Fornari, M.; Tonelli, C.; Holt, B.F.; Mantovani, R. The Promiscuous Life of Plant NUCLEAR FACTOR Y Transcription Factors. Plant Cell 2013, 24, 4777–4792. [Google Scholar] [CrossRef] [Green Version]
  3. Laloum, T.; De Mita, S.; Gamas, P.; Baudin, M.; Niebel, A. CCAAT-box binding transcription factors in plants: Y so many? Trends Plant Sci. 2013, 18, 157–166. [Google Scholar] [CrossRef]
  4. Myers, Z.A.; Holt, B.F. NUCLEAR FACTOR-Y: Still complex after all these years? Curr. Opin. Plant Biol. 2018, 45, 96–102. [Google Scholar] [CrossRef]
  5. Siefers, N.; Dang, K.K.; Kumimoto, R.W.; Bynum, W.E.; Tayrose, G.; Holt, B.F. Tissue-Specific Expression Patterns of Arabidopsis NF-Y Transcription Factors Suggest Potential for Extensive Combinatorial Complexity. Plant Physiol. 2009, 149, 625–641. [Google Scholar] [CrossRef] [Green Version]
  6. Thirumurugan, T.; Ito, Y.; Kubo, T.; Serizawa, A.; Kurata, N. Identification, characterization and interaction of HAP family genes in rice. Mol. Genet. Genom. 2008, 279, 279–289. [Google Scholar] [CrossRef]
  7. Quach, T.N.; Nguyen, H.T.M.; Valliyodan, B.; Joshi, T.; Xu, D.; Nguyen, H.T. Genome-wide expression analysis of soybean NF-Y genes reveals potential function in development and drought response. Mol. Genet. Genom. 2015, 290, 1095–1115. [Google Scholar] [CrossRef] [PubMed] [Green Version]
  8. Li, S.; Li, K.; Ju, Z.; Cao, D.; Fu, D.; Zhu, H.; Zhu, B.; Luo, Y. Genome-wide analysis of tomato NF-Y factors and their role in fruit ripening. BMC Genom. 2016, 17, 36. [Google Scholar] [CrossRef] [PubMed] [Green Version]
  9. Zhang, Z.; Li, X.; Zhang, C.; Zou, H.; Wu, Z. Isolation, structural analysis, and expression characteristics of the maize nuclear factor Y gene families. Biochem. Biophys. Res. Commun. 2016, 478, 752–758. [Google Scholar] [CrossRef] [PubMed]
  10. Malviya, N.; Jaiswal, P.; Yadav, D. Genome- wide characterization of Nuclear Factor Y (NF-Y) gene family of sorghum [Sorghum bicolor (L.) Moench]: A bioinformatics approach. Physiol. Mol. Biol. Plants 2016, 22, 33–49. [Google Scholar] [CrossRef] [PubMed] [Green Version]
  11. Maheshwari, P.; Kummari, D.; Palakolanu, S.R.; Tejaswi, U.N.; Nagaraju, M.; Rajasheker, G.; Jawahar, G.; Jalaja, N.; Rathnagiri, P.; Kishor, P.B.K. Genome-wide identification and expression profile analysis of nuclear factor Y family genes in Sorghum bicolor L. (Moench). PLoS ONE 2019, 14, e0222203. [Google Scholar] [CrossRef]
  12. Pereira, S.L.S.; Martins, C.P.S.; Sousa, A.O.; Camillo, L.R.; Araújo, C.P.; Alcantara, G.M.; Camargo, D.S.; Cidade, L.C.; De Almeida, A.-A.F.; Costa, M.G.C. Genome-wide characterization and expression analysis of citrus NUCLEAR FACTOR-Y (NF-Y) transcription factors identified a novel NF-YA gene involved in drought-stress response and tolerance. PLoS ONE 2018, 13, e0199187. [Google Scholar] [CrossRef] [Green Version]
  13. Panahi, B.; Mohammadi, S.A.; Ruzicka, K.; Holaso, H.A.; Mehrjerdi, M.Z. Genome-wide identification and co-expression network analysis of nuclear factor-Y in barley revealed potential functions in salt stress. Physiol. Mol. Biol. Plants 2019, 25, 485–495. [Google Scholar] [CrossRef]
  14. Chen, L.; Zhou, Y.; Lai, W.; Hu, L.; Jiang, L.; Liu, S. In Silico Identification and Expression Analysis of Nuclear Factor Y (Nf-Y) Transcription Factors in Cucumber. Agronomy 2020, 10, 236. [Google Scholar] [CrossRef] [Green Version]
  15. Qu, Y.; Wang, Y.; Zhu, J.; Zhang, Y.; Hou, H. Genomic Organization, Phylogenetic Comparison, and Differential Expression of the Nuclear Factor-Y Gene Family in Apple (Malus Domestica). Plants 2021, 10, 16. [Google Scholar] [CrossRef] [PubMed]
  16. Chaves-Sanjuan, A.; Gnesutta, N.; Gobbini, A.; Martignago, D.; Bernardini, A.; Fornara, F.; Mantovani, R.; Nardini, M. Structural determinants for NF-Y subunit organization and NF-Y/DNA association in plants. Plant J. 2021, 105, 49–61. [Google Scholar] [CrossRef] [PubMed]
  17. Liu, X.; Hu, P.; Huang, M.; Tang, Y.; Li, Y.; Li, L.; Hou, X. The NF-YC–RGL2 module integrates GA and ABA signalling to regulate seed germination in Arabidopsis. Nat. Commun. 2016, 7, 12768. [Google Scholar] [CrossRef] [PubMed] [Green Version]
  18. Wenkel, S.; Turck, F.; Singer, K.; Gissot, L.; Le Gourrierec, J.; Samach, A.; Coupland, G. CONSTANS and the CCAAT Box Binding Complex Share a Functionally Important Domain and Interact to Regulate Flowering of Arabidopsis. Plant Cell 2006, 18, 2971–2984. [Google Scholar] [CrossRef] [Green Version]
  19. Cai, X.; Ballif, J.; Endo, S.; Davis, E.; Liang, M.; Chen, D.; DeWald, D.; Kreps, J.; Zhu, T.; Wu, Y. A Putative CCAAT-Binding Transcription Factor Is a Regulator of Flowering Timing in Arabidopsis. Plant Physiol. 2007, 145, 98–105. [Google Scholar] [CrossRef] [Green Version]
  20. Kumimoto, R.W.; Zhang, Y.; Siefers, N.; Holt, B.F. NF-YC3, NF-YC4 and NF-YC9 are required for CONSTANS-mediated, photoperiod-dependent flowering in Arabidopsis thaliana. Plant J. 2010, 63, 379–391. [Google Scholar] [CrossRef]
  21. Sorin, C.; Declerck, M.; Christ, A.; Blein, T.; Ma, L.; Lelandais-Brière, C.; Njo, M.F.; Beeckman, T.; Crespi, M.; Hartmann, C. A miR 169 isoform regulates specific NF-YA targets and root architecture in Arabidopsis. New Phytol. 2014, 202, 1197–1211. [Google Scholar] [CrossRef]
  22. Braybrook, S.; Harada, J.J. LECs go crazy in embryo development. Trends Plant Sci. 2008, 13, 624–630. [Google Scholar] [CrossRef]
  23. Xuanyuan, G.; Lu, C.; Zhang, R.; Jiang, J. Overexpression of StNF-YB3.1 reduces photosynthetic capacity and tuber production, and promotes ABA-mediated stomatal closure in potato (Solanum tuberosum L.). Plant Sci. 2017, 261, 50–59. [Google Scholar] [CrossRef]
  24. Miyoshi, K.; Ito, Y.; Serizawa, A.; Kurata, N. OsHAP3genes regulate chloroplast biogenesis in rice. Plant J. 2003, 36, 532–540. [Google Scholar] [CrossRef]
  25. Gago, C.; Drosou, V.; Paschalidis, K.; Guerreiro, A.; Miguel, G.; Antunes, D.; Hilioti, Z. Targeted gene disruption coupled with metabolic screen approach to uncover the LEAFY COTYLEDON1-LIKE4 (L1L4) function in tomato fruit metabolism. Plant Cell Rep. 2017, 36, 1065–1082. [Google Scholar] [CrossRef] [PubMed]
  26. Chen, M.; Zhao, Y.; Zhuo, C.; Lu, S.; Guo, Z. Overexpression of aNF-YC transcription factor from bermudagrass confers tolerance to drought and salinity in transgenic rice. Plant Biotechnol. J. 2015, 13, 482–491. [Google Scholar] [CrossRef] [PubMed]
  27. Hackenberg, D.; Keetman, U.; Grimm, B. Homologous NF-YC2 Subunit from Arabidopsis and Tobacco Is Activated by Photooxidative Stress and Induces Flowering. Int. J. Mol. Sci. 2012, 13, 3458–3477. [Google Scholar] [CrossRef] [PubMed] [Green Version]
  28. Nelson, D.E.; Repetti, P.P.; Adams, T.R.; Creelman, R.A.; Wu, J.; Warner, D.C.; Anstrom, D.C.; Bensen, R.J.; Castiglioni, P.P.; Donnarummo, M.G.; et al. Plant nuclear factor Y (NF-Y) B subunits confer drought tolerance and lead to improved corn yields on water-limited acres. Proc. Natl. Acad. Sci. USA 2007, 104, 16450–16455. [Google Scholar] [CrossRef] [PubMed] [Green Version]
  29. Li, W.-X.; Oono, Y.; Zhu, J.; He, X.-J.; Wu, J.; Iida, K.; Lu, X.-Y.; Cui, X.; Jin, H.; Zhu, J.-K. The Arabidopsis NFYA5 Transcription Factor Is Regulated Transcriptionally and Posttranscriptionally to Promote Drought Resistance. Plant Cell 2008, 20, 2238–2251. [Google Scholar] [CrossRef] [PubMed] [Green Version]
  30. Sato, H.; Suzuki, T.; Takahashi, F.; Shinozaki, K.; Yamaguchi-Shinozaki, K. NF-YB2 and NF-YB3 Have Functionally Diverged and Differentially Induce Drought and Heat Stress-Specific Genes. Plant Physiol. 2019, 180, 1677–1690. [Google Scholar] [CrossRef] [Green Version]
  31. Lee, D.-K.; Kim, H.I.; Jang, G.; Chung, P.J.; Jeong, J.S.; Kim, Y.S.; Bang, S.W.; Jung, H.; Choi, Y.D.; Kim, J.-K. The NF-YA transcription factor OsNF-YA7 confers drought stress tolerance of rice in an abscisic acid independent manner. Plant Sci. 2015, 241, 199–210. [Google Scholar] [CrossRef]
  32. Yang, M.; Zhao, Y.; Shi, S.; Du, X.; Gu, J.; Xiao, K. Wheat nuclear factor Y (NF-Y) B subfamily gene TaNF-YB3;l confers critical drought tolerance through modulation of the ABA-associated signaling pathway. Plant Cell Tissue Organ Cult. 2017, 128, 97–111. [Google Scholar] [CrossRef]
  33. Müller, R.; Morant, M.; Jarmer, H.; Nilsson, L.; Nielsen, T.H. Genome-Wide Analysis of the Arabidopsis Leaf Transcriptome Reveals Interaction of Phosphate and Sugar Metabolism. Plant Physiol. 2007, 143, 156–171. [Google Scholar] [CrossRef] [Green Version]
  34. Zanetti, M.E.; Rípodas, C.; Niebel, A. Plant NF-Y transcription factors: Key players in plant-microbe interactions, root development and adaptation to stress. Biochim. Biophys. Acta 2017, 1860, 645–654. [Google Scholar] [CrossRef] [PubMed]
  35. González, M.A.L.; Ibarra-Laclette, E.; Cruz-Ramírez, L.A.; Herrera-Estrella, L. Functional and Transcriptome Analysis Reveals an Acclimatization Strategy for Abiotic Stress Tolerance Mediated by Arabidopsis NF-YA Family Members. PLoS ONE 2012, 7, e48138. [Google Scholar] [CrossRef] [Green Version]
  36. Zhao, M.; Ding, H.; Zhu, J.-K.; Zhang, F.; Li, W. Involvement of miR169 in the nitrogen-starvation responses in Arabidopsis. New Phytol. 2011, 190, 906–915. [Google Scholar] [CrossRef] [PubMed] [Green Version]
  37. Qu, B.; He, X.; Wang, J.; Zhao, Y.; Teng, W.; Shao, A.; Zhao, X.; Ma, W.; Wang, J.; Li, B.; et al. A Wheat CCAAT Box-Binding Transcription Factor Increases the Grain Yield of Wheat with Less Fertilizer Input. Plant Physiol. 2015, 167, 411–423. [Google Scholar] [CrossRef] [Green Version]
  38. Lohani, N.; Jain, D.; Singh, M.B.; Bhalla, P.L. Engineering Multiple Abiotic Stress Tolerance in Canola, Brassica napus. Front. Plant Sci. 2020, 11, 3. [Google Scholar] [CrossRef]
  39. Snowdon, R.J.; Friedrich, T.; Friedt, W.; Köhler, W. Identifying the chromosomes of the A- and C-genome diploid Brassica species B. rapa (syn. campestris) and B. oleracea in their amphidiploid B. napus. Theor. Appl. Genet. 2002, 104, 533–538. [Google Scholar] [CrossRef] [PubMed]
  40. Chalhoub, B.; Denoeud, F.; Liu, S.; Parkin, I.A.P.; Tang, H.; Wang, X.; Chiquet, J.; Belcram, H.; Tong, C.; Samans, B.; et al. Early allopolyploid evolution in the post-Neolithic Brassica napus oilseed genome. Science 2014, 345, 950–953. [Google Scholar] [CrossRef] [Green Version]
  41. Liu, R.; Wu, M.; Liu, H.; Gao, Y.; Chen, J.; Yan, H.; Xiang, Y. Genome-wide identification and expression analysis of the NF-Y transcription factor family in Populus. Physiol. Plant. 2021, 171, 309–327. [Google Scholar] [CrossRef] [PubMed]
  42. Liang, M.; Yin, X.; Lin, Z.; Zheng, Q.; Liu, G.; Zhao, G. Identification and characterization of NF-Y transcription factor families in Canola (Brassica napus L.). Planta 2014, 239, 107–126. [Google Scholar] [CrossRef] [PubMed]
  43. Wang, J.; Jin, Z.; Zhou, M.; Yu, Y.; Liang, M. Characterization of NF-Y transcription factor families in industrial rapeseed (Brassica napus L.) and identification of BnNF-YA3, which functions in the abiotic stress response. Ind. Crop. Prod. 2020, 148, 112253. [Google Scholar] [CrossRef]
  44. Wang, P.; Zheng, Y.; Guo, Y.; Chen, X.; Sun, Y.; Yang, J.; Ye, N. Identification, expression, and putative target gene analysis of nuclear factor-Y (NF-Y) transcription factors in tea plant (Camellia sinensis). Planta 2019, 250, 1671–1686. [Google Scholar] [CrossRef]
  45. Ma, X.-J.; Yu, T.-F.; Li, X.H.; Cao, X.-Y.; Ma, J.; Chen, J.; Zhou, Y.-B.; Chen, M.; Ma, Y.-Z.; Zhang, J.H.; et al. Overexpression of GmNFYA5 confers drought tolerance to transgenic Arabidopsis and soybean plants. BMC Plant Biol. 2020, 20, 1–18. [Google Scholar] [CrossRef] [PubMed] [Green Version]
  46. Yu, Y.; Bai, Y.; Wang, P.; Wang, Y.; Wan, H.; Liu, C.; Ni, Z. Soybean nuclear factor YA10 positively regulates drought resistance in transgenic Arabidopsis thaliana. Environ. Exp. Bot. 2020, 180, 104249. [Google Scholar] [CrossRef]
  47. Zhou, Y.; Zhang, Y.; Wang, X.; Han, X.; An, Y.; Lin, S.; Shen, C.; Wen, J.; Liu, C.; Yin, W.; et al. Root-specific NF-Y family transcription factor, PdNF-YB21, positively regulates root growth and drought resistance by abscisic acid-mediated indoylacetic acid transport in Populus. New Phytol. 2020, 227, 407–426. [Google Scholar] [CrossRef]
  48. Yang, W.; Lu, Z.; Xiong, Y.; Yao, J. Genome-wide identification and co-expression network analysis of the OsNF-Y gene family in rice. Crop. J. 2017, 5, 21–31. [Google Scholar] [CrossRef] [Green Version]
  49. Li, L.; Zheng, W.; Zhu, Y.; Ye, H.; Tang, B.; Arendsee, Z.W.; Jones, D.; Li, R.; Ortiz, D.; Zhao, X.; et al. QQS orphan gene regulates carbon and nitrogen partitioning across species via NF-YC interactions. Proc. Natl. Acad. Sci. USA 2015, 112, 14734–14739. [Google Scholar] [CrossRef] [Green Version]
  50. Feng, Z.-J.; He, G.-H.; Zheng, W.-J.; Lu, P.-P.; Chen, M.; Gong, Y.-M.; Ma, Y.-Z.; Xu, Z.-S. Foxtail Millet NF-Y Families: Genome-Wide Survey and Evolution Analyses Identified Two Functional Genes Important in Abiotic Stresses. Front. Plant Sci. 2015, 6, 1142. [Google Scholar] [CrossRef] [Green Version]
  51. Chen, C.; Chen, H.; Zhang, Y.; Thomas, H.R.; Frank, M.H.; He, Y.; Xia, R. TBtools: An Integrative Toolkit Developed for Interactive Analyses of Big Biological Data. Mol. Plant 2020, 13, 1194–1202. [Google Scholar] [CrossRef] [PubMed]
  52. Wang, Y.; Tang, H.; DeBarry, J.; Tan, X.; Li, J.; Wang, X.; Lee, T.-H.; Jin, H.; Marler, B.; Guo, H.; et al. MCScanX: A toolkit for detection and evolutionary analysis of gene synteny and collinearity. Nucleic Acids Res. 2012, 40, e49. [Google Scholar] [CrossRef] [PubMed] [Green Version]
  53. Kumar, S.; Stecher, G.; Tamura, K. MEGA7: Molecular Evolutionary Genetics Analysis Version 7.0 for Bigger Datasets. Mol. Biol. Evol. 2016, 33, 1870–1874. [Google Scholar] [CrossRef] [PubMed] [Green Version]
  54. Nekrutenko, A.; Makova, K.D.; Li, W.-H. The KA/KS Ratio Test for Assessing the Protein-Coding Potential of Genomic Regions: An Empirical and Simulation Study. Genome Res. 2002, 12, 198–202. [Google Scholar] [CrossRef] [PubMed] [Green Version]
  55. Bailey, T.L.; Boden, M.; Buske, F.A.; Frith, M.; Grant, C.E.; Clementi, L.; Ren, J.; Li, W.W.; Noble, W.S. MEME SUITE: Tools for motif discovery and searching. Nucleic Acids Res. 2009, 37, w202–w208. [Google Scholar] [CrossRef] [PubMed]
  56. Su, G.; Morris, J.H.; Demchak, B.; Bader, G. Biological Network Exploration with Cytoscape 3. Curr. Protoc. Bioinform. 2014, 47, 1–24. [Google Scholar] [CrossRef] [PubMed] [Green Version]
  57. Livak, K.J.; Schmittgen, T.D. Analysis of relative gene expression data using real-time quantitative PCR and the 2(-Delta Delta C(T)) Method. Methods 2001, 25, 402–408. [Google Scholar] [CrossRef]
  58. Zhang, H.; Li, S.; Shi, M.; Wang, S.; Shi, L.; Xu, F.; Ding, G. Genome-Wide Systematic Characterization of the NPF Family Genes and Their Transcriptional Responses to Multiple Nutrient Stresses in Allotetraploid Rapeseed. Int. J. Mol. Sci. 2020, 21, 5947. [Google Scholar] [CrossRef] [PubMed]
  59. Zhong, C.; Tang, Y.; Pang, B.; Li, X.; Yang, Y.; Deng, J.; Feng, C.; Li, L.; Ren, G.; Wang, Y.; et al. The R2R3-MYB transcription factor GhMYB1a regulates flavonol and anthocyanin accumulation in Gerbera hybrida. Hortic. Res. 2020, 7, 78. [Google Scholar] [CrossRef]
Figure 1. The physiological responses of B. napus to N, P and K deficiencies. (a) The phenotypes of B. napus under N, P and K deficiencies; (b) Shoot dry weight; (c) Root dry weight; (d) Transpiration rate; (e) Net photosynthesis rate; (f) Internal CO2; (g) Stomatal conductance; (h) Taproot length; (i) SPAD value. CK: normal nutrient supply; LN: N deficiency (100 μM N); LP: P deficiency (5 μM P); LK: K deficiency (5 μM K). Error line represents variance (n = 4), different letters (ad) indicate significant differences per Student’s t test, * p < 0.05, ** p < 0.01.
Ijms 22 10354 g001
Figure 2. The conserved domains of three NF-Y subfamilies of B. napus, B. rapa, B. oleracea and Arabidopsis. The logo diagrams illustrate the consensus sequences of conserved domains of the three NF-Y subfamilies in different species, which are determined based on the multiple sequence alignments in each species: (a) The Nuclear Factor-YA (NF-YA) subfamily; (b) The Nuclear Factor-YB (NF-YB) subfamily; (c) The Nuclear Factor-YC (NF-YC) subfamily.
Ijms 22 10354 g002
Figure 3. Harp diagrams of the molecular characteristics of NF-Y proteins and the synonymous (Ks), nonsynonymous (Ka) and Ka/Ks ratio of each NF-Y subfamily in rapeseed. (a) Grand average of hydropathy (GRAVY); (b) Molecular weight (MW); (c) Theoretical isoelectric point (pI); The GRAVY value is defined as the sum of the hydropathy values of the amino acids divided by the protein length. (df) Ka, Ks, Ka/Ks ratio of the NF-YA: (d) NF-YB; (e) NF-YC; (f) Subfamilies.
Ijms 22 10354 g003
Figure 4. Phylogenetic relationships, gene structure and conserved motif compositions of the NF-Y family in B. napus and Arabidopsis. (a) The phylogenetic relationships of the BnaNF-Y and AtNF-Y genes. The 108 genes of B. napus and 36 genes of Arabidopsis are divided into three groups; (b) Conserved motif compositions. Each colored box in the middle represents a motif, and the black line represents non-conserved sequences; (c) Gene structure. The untranslated region (UTR), exon and intron in the right of each subfamily are represented by a green box, yellow box and gray line, respectively.
Ijms 22 10354 g004
Figure 5. Schematic representations for the chromosomal distribution and interchromosomal relationships of the rapeseed NF-Y genes. The chromosomal localizations are shown in the outer cycle. The sequence length of each B. napus chromosome is indicated by the numbers along the box. The BnaNF-Y genes are mapped on the different chromosomes. Gene density of the whole B. napus genome is shown in the inner cycle. The higher the red column in the inner circle, the more genes there are on the chromosome. Gray lines inside the cycle indicate the genome-wide collinearity within the B. napus genome, while the red lines show the syntenic BnaNF-Y gene pairs. R: random.
Ijms 22 10354 g005
Figure 6. Collinearity analysis of the NF-Y family genes in B. napus, B. rapa, B. oleracea and Arabidopsis chromosomes. The solid bars with different colors represent different chromosomes of the four species. The gray lines in the background suggest the syntenic blocks between the genomes of two species for comparison, while the red lines indicate the syntenic NF-Y gene pairs. R: random.
Ijms 22 10354 g006
Figure 7. Expression profiles of each NF-Y subfamily in rapeseed leaf and root under three nutrient deficient conditions. Seedlings 14 days old were cultivated under nitrogen, phosphorus and potassium deficient environments, respectively, for 6 days. The fully expanded leaf and root were harvested separately for RNA extraction. (a) Upset plot of significantly regulated genes under different treatments in two tissues. The red column represents the treatment with the highest number of genes in the same number of crosses; (b) The BnaNF-YA subfamily; (c) The BnaNF-YB subfamily; (d) The BnaNF-YC subfamily. The color scale is shown above each subfamily. The data in the heat map was normalized (z-scores) using FPKM values and then generated by Tbtools; the higher the value of the color scale, the higher the expression, and vice versa. −N: nitrogen deficiency; −P: phosphorus deficiency; −K: potassium deficiency; CK: sufficient nutrient supply. L: leaf; R: root; N: nitrogen deficiency; P: phosphorus deficiency; K: potassium deficiency. D: downregulated; U: upregulated.
Ijms 22 10354 g007
Figure 8. Genome distribution map of the differentially expressed NF-Y genes in two tissues under three nutrient starvations. Sankey diagram is drawn to depict the ratios of the differentially expressed NF-Y genes in one triad. (a) Three NF-YA subfamilies; (b) Two tissues; (c) Three nutrient deficiencies. -N: nitrogen deficiency; -P: phosphorus deficiency; -K: potassium deficiency. Distinct colors represent the flow of triads belonging to one category into the other two categories. The ratios of each triad are shown on the map.
Ijms 22 10354 g008
Figure 9. The expression levels of the 16 selected BnaNF-Y genes in five tissues of B. napus in response to nitrogen (N) deficiency by qRT-PCR. Fourteen-day-old rapeseed seedlings were cultivated in a nutrient solution free of N for six days. RNA was extracted separately from five tissues including root, hypocotyl, petiole, fully expanded leaf and new leaf under N sufficient and deficient conditions. +N: N sufficient condition; −N: N free (0 μM N) condition. Each sample included three independent biological replicates. * and ** indicate significant differences at p < 0.05 and p < 0.01 per student’s t test, respectively.
Ijms 22 10354 g009
Figure 10. Subcellular localization of BnaA03.NF-YA2, BnaC01.NF-YA6, BnaC03.NF-YC11b and BnaC05.NF-YA2b. 35S::BnaNF-Ys-GFP constructs were introduced into tobacco. The blue color shows nuclei by DAPI staining. The GFP and DAPI fluorescence was observed with a fluorescence microscope. The images were taken in the dark and white field.
Ijms 22 10354 g010
Publisher’s Note: MDPI stays neutral with regard to jurisdictional claims in published maps and institutional affiliations.

