
Potential Biomarkers Associated with Multiple Sclerosis Pathology

 ,
,  and
and
Abstract
1. Introduction
2. The Criterion to Be Considered as a Standard Biomarker
- (1)
- It must have the ability to differentiate between a patient and a healthy individual;
- (2)
- It must be expressed at an early stage before the disease progresses;
- (3)
- It must be easy to evaluate, safe for patients, and informative for subsequent management of the disease;
- (4)
- It must offer reproducible results. Furthermore, the biomarker must be sensitive, specific, and must have a clear predictive value.
- (1)
- The measurement of biomarkers in a blood sample may not necessarily reflect changes in the CNS, unlike CSF;
- (2)
- In blood samples, markers are affected by many clinical and biological processes;
- (3)
- The concentration of biomarkers in blood may be lower than the corresponding amount in the CSF.
3. Challenges in the Development of Biomarkers
4. Classification of Biomarkers
- (A)
- Personal susceptibility or predictiveness;
- (B)
- Diagnosis;
- (C)
- Prognosis;
- (D)
- Disease-associated activity;
- (E)
- Response to treatment in different disease courses of MS (Table 1).
4.1. Predictive Biomarkers
- (A)
- Children and siblings of MS patients;
- (B)
- Healthy individuals diagnosed with clinically isolated syndrome (CIS) and other disorders related to the nervous system.
- Epstein–Barr virus (EBV)
- Human herpesvirus type-6 (HHV-6)
- Anti-MOG and anti-MBP antibodies
4.2. Diagnostic Biomarkers
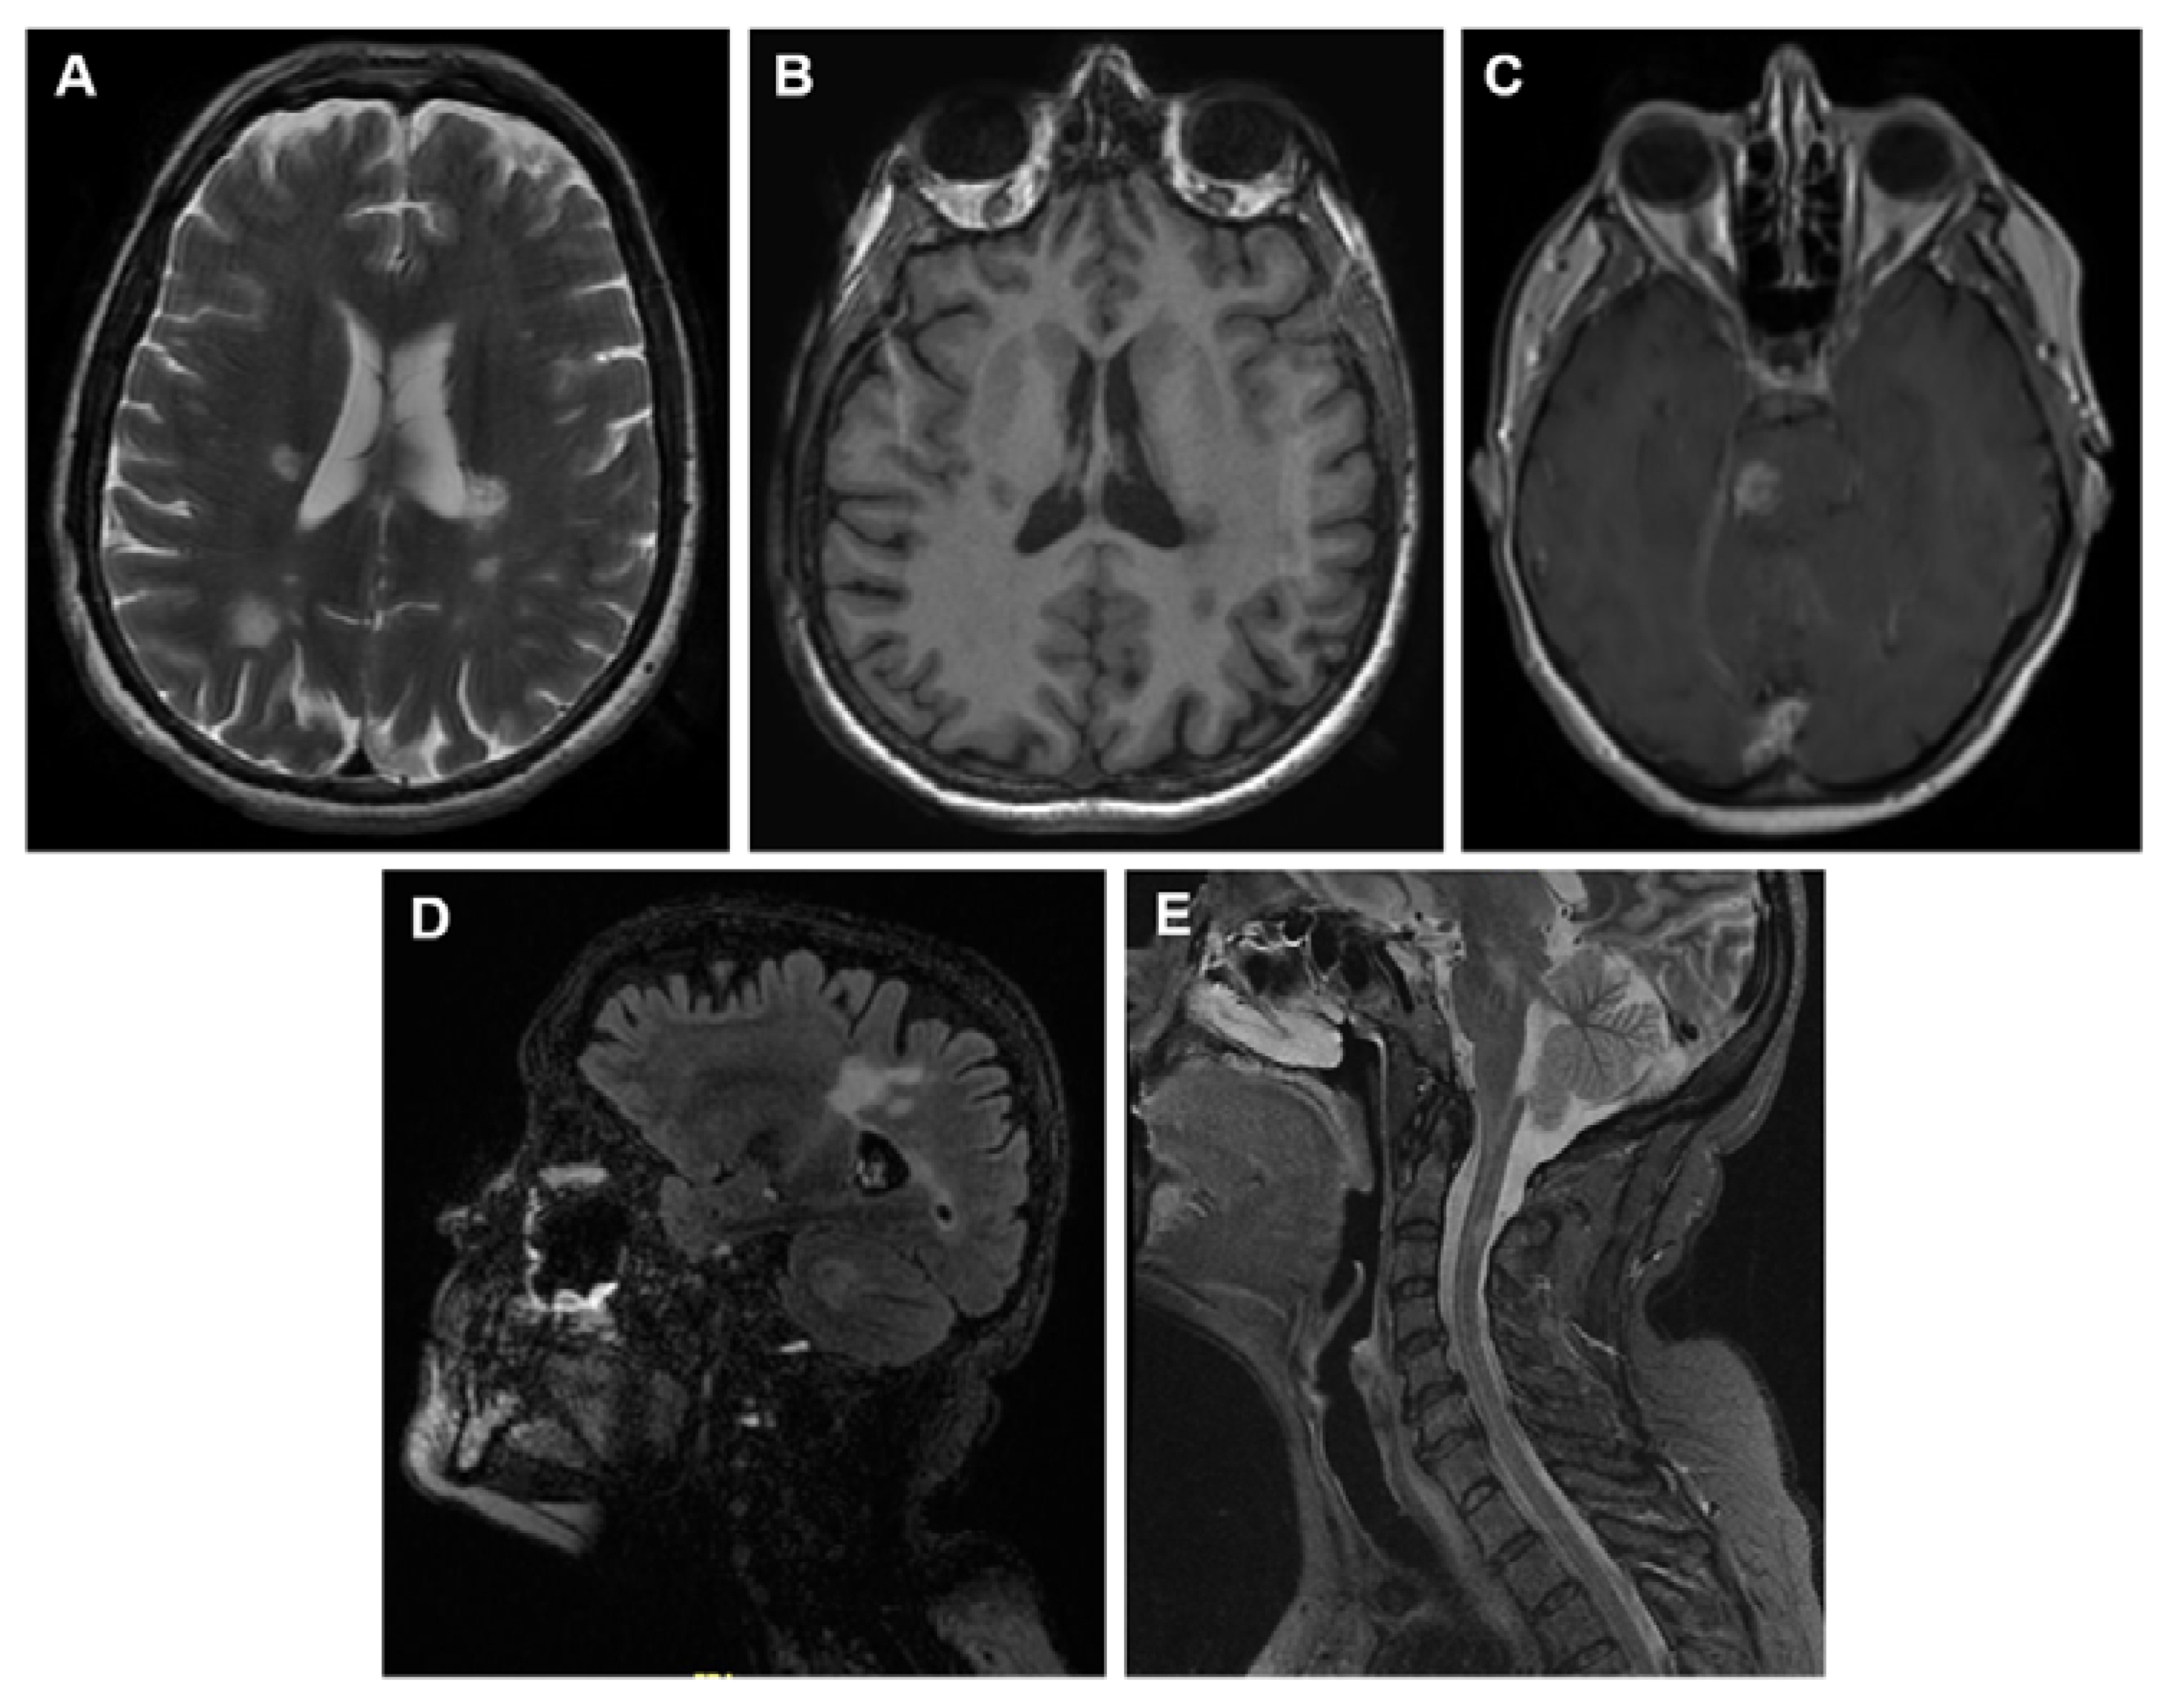
4.2.1. MRI as Diagnostic Biomarker
- (A)
- T1-weighted or longitudinal magnetization relaxation time;
- (B)
- T2-weighted or transverse magnetization relaxation time;
- (C)
- A post-contrast scan. T1-weighted lesions are used primarily to detect any abnormalities in the integrity blood-brain barrier (BBB). Hypointense T1 lesions (also referred to as black holes) are used as a marker representing the loss of axons that occur during the development of MS.
Conventional Image Techniques
- T2- weighted MR imaging
- T1-weighted images with gadolinium enhancement
- Fluid Attenuated Inversion Recovery Sequence (FLAIR)
- Proton density (PD)-weighted spin-echo (SE) images
Non-Conventional Image Techniques
- The Magnetization Transfer Imaging (MTI)
- (a)
- Bound to macromolecules;
- (b)
- In free water;
- (c)
- As water in the hydration layer between macromolecules and free water.
- Diffusion-Weighted (DWI) and Diffusion Tensor (DTI) Images
- (a)
- Axial diffusivity (DA)
- (b)
- Radial diffusivity (RD);
- (c)
- Mean diffusivity (MD);
- (d)
- Fractional anisotropy (AF) [42].
- Magnetic Resonance Spectroscopy (MRS)
- Optical Coherence Tomography (OCT)
- Positron Emission Tomography (PET)
4.2.2. Diagnostic Biomarkers in CSF and Serum
- Oligoclonal bands (IgG) and (IgM)
- Immunoglobulin G index (IgG index)
- Kappa Free (KFLC) and Lambda Free Light Chains (LFLC)
- Anti-Aquaporin-4 (AQP4) antibodies
4.3. Biomarkers of Prognosis
- Oligoclonal bands (IgM)
- Chitinase-3-Like-1 precursor (CHI3L1)
- Neurofilaments (NF)
- (a)
- NF-L (polypeptide light chain) of 68 kDa;
- (b)
- NF-M (neurofilament of medium size) of 150 kDa;
- (c)
- NF-H (heavy chain) from 190 to 210 kDa and α-internexin [95].
- miRNAs
4.4. Biomarkers of Dysfunction and Pathology
4.4.1. Biomarkers of Immunological Dysfunction
- Cytokines
4.4.2. Biomarkers of Demyelination
- Myelin basic protein (MBP)
4.4.3. Biomarkers of Axonal Damage
- Neurofilaments (NF)
- Microtubule-associated protein Tau
- N-acetylaspartate (NAA)
- Amyloid-precursor protein (APP)
- Ionic Imbalance
4.4.4. Biomarkers of Glial Activation/Dysfunction
- Nitric Oxide (NO)
- Reactive Oxygen Species (ROS)
- Glial fibrillary acidic protein (GFAP)
- S100 calcium-binding protein B (S-100B)
5. Conclusions
Author Contributions
Funding
Acknowledgments
Conflicts of Interest
Abbreviations
| APP | Amyloid-Precursor Protein |
| AQP4 | Aquaporin-4 Protein |
| BBB | Blood-Brain Barrier |
| CDMS | Clinically Defined MS |
| CHI3L1 | Chitinase-3-Like-1 Precursor |
| CIS | Clinically Isolated Syndrome |
| CSF | Cerebro Spinal Fluid |
| DMT | Disease-Modifying Therapies |
| DTI | Diffusion Tensor Imaging |
| DWI | Diffusion Weighted Imaging |
| EBNA | Epstein-Barr Nuclear Antigen |
| FLAIR | FLuid Attenuated Inversion Recovery Sequence |
| KFLC | Kappa Free Light Chain |
| LFLC | Lambda Free Light Chain |
| MBP | Myelin Basic Protein |
| MOG | Myelin Oligodendrocyte Glycoprotein |
| MS | Multiple Sclerosis |
| MRI | Magnetic Resonance Imaging |
| MRS | Magnetic Resonance Spectroscopy |
| MTI | Magnetization Transfer Imaging |
| MTR | Magnetization Transfer Ratio |
| NAA | N-Acetyl-Aspartate |
| NAWM | Normal-Appearing White Matter |
| NF | Neurofilaments |
| GFAP | Glial Fibrillary Acidic Protein |
| NMOSD | Neuromyelitis Optica Spectrum Disorders |
| OCB | Oligoclonal Bands |
| OCGB | IgG-Type Oligoclonal Bands |
| OCMB | IgM-Type Oligoclonal Bands |
| OCT | Optical Coherence Tomography |
| PD-SE | Proton Density-Weighted Spin-Echo Imaging |
| PET | Positron Emission Tomography |
| PPMS | Primary Progressive MS |
| RIS | Radiologically Isolated Syndrome |
| RNFL | Retinal Nerve Fiber Layer |
| RRMS | Relapsing Remitting MS |
| SPMS | Secondary Progressive MS |
| S-100B | S100 Calcium-Binding Protein B |
| VCA | Viral Capsid Antigen |
References
- Dilokthornsakul, P.; Valuck, R.J.; Nair, K.V.; Corboy, J.R.; Allen, R.R.; Campbell, J.D. Multiple Sclerosis prevalence in the United States Commercially insured population. Neurology 2016, 86, 1014–1021. [Google Scholar] [CrossRef]
- Bhatia, R.; Bali, P.; Chowdhary, R. Epidemiology and genetic aspects of multiple sclerosis in India. Ann. Indian Acad. Neurol. 2015, 18, 6. [Google Scholar] [CrossRef]
- Huang, W.J.; Chen, W.W.; Zhang, X. Multiple sclerosis: Pathology, diagnosis and treatments. Exp. Ther. Med. 2017, 13, 3163–3166. [Google Scholar] [CrossRef] [PubMed]
- Lublin, F.D.; Reingold, S.C.; Cohen, J.A.; Cutter, G.R.; Sørensen, P.S.; Thompson, A.J.; Wolinsky, J.S.; Balcer, L.J.; Banwell, B.; Barkhof, F.; et al. Defining the clinical course of multiple sclerosis: The 2013 revisions. Neurology 2014, 83, 278–286. [Google Scholar] [CrossRef] [PubMed]
- Weinshenker, B.G.; Bass, B.; Rice, G.P.; Noseworthy, J.; Carriere, W.; Baskerville, J.; Ebers, G.C. The natural history of multiple sclerosis: A geographically based study. I. Clinical course and disability. Brain 1989, 112, 133–146. [Google Scholar] [CrossRef] [PubMed]
- Confavreux, C.; Vukusic, S. Natural history of multiple sclerosis: A unifying concept. Brain 2006, 129, 606–616. [Google Scholar] [CrossRef] [PubMed]
- Wallin, M.T.; Wilken, J.A.; Turner, A.P.; Williams, R.M.; Kane, R. Depression and multiple sclerosis: Review of a lethal combination. J. Rehabil. Res. Dev. 2006, 43, 45–46. [Google Scholar] [CrossRef] [PubMed]
- Gilgun-Sherki, Y.; Melamed, E.; Offen, D. The role of oxidative stress in the pathogenesis of multiple sclerosis: The need for effective antioxidant therapy. J. Neurol. 2004, 251, 261–268. [Google Scholar] [PubMed]
- Kleinschnitz, C.; Meuth, S.G.; Wiendl, H. The trials and errors in MS therapy. Int. MS J. 2008, 15, 79–80. [Google Scholar]
- Brilot, F.; Dale, R.C.; Selter, R.C.; Grummel, V.; Kalluri, S.R.; Aslam, M.; Selter, C.; Busch, V.; Zhou, D.; Cepok, S.; et al. Antibodies to native myelin oligodendrocyte glycoprotein in children with inflammatory demyelinating central nervous system disease. Ann. Neurol. 2009, 66, 833–842. [Google Scholar] [CrossRef]
- Lalive, P.H.; Häusler, M.G.; Maurey, H.; Mikaeloff, Y.; Tardieu, M.; Wiendl, H.; Schroeter, M.; Hartung, H.P.; Kieseier, B.C.; Menge, T. Highly reactive anti-myelin oligodendrocyte glycoprotein antibodies differentiate demyelinating diseases from viral encephalitis in children. Mult. Scler. 2011, 17, 297–302. [Google Scholar] [CrossRef] [PubMed]
- Baumann, M.; Sahin, K.; Lechner, C.; Hennes, E.M.; Schanda, K.; Mader, S.; Karenfort, M.; Selch, C.; Häusler, M.; Eisenkölbl, A.; et al. Clinical and neuroradiological differences of paediatric acute disseminating encephalomyelitis with and without antibodies to the myelin oligodendrocyte glycoprotein. J. Neurol. Neurosurg. Psychiatry 2015, 86, 265–272. [Google Scholar] [CrossRef] [PubMed]
- Ramanathan, S.; Dale, R.C.; Brilot, F. Anti-MOG antibody: The history, clinical phenotype, and pathogenicity of a serum biomarker for demyelination. Autoimmun. Rev. 2016, 15, 307–324. [Google Scholar] [CrossRef] [PubMed]
- Reindl, M.; Di Pauli, F.; Rostasy, K.; Berger, T. The spectrum of MOG autoantibody-associated demyelinating diseases. Nat. Rev. Neurol. 2013, 9, 455–461. [Google Scholar] [CrossRef] [PubMed]
- Paul, A.; Comabella, M.; Gandhi, R. Biomarkers in Multiple Sclerosis. Cold Spring Harb. Perspect. Med. 2019, 9, a029058. [Google Scholar] [CrossRef]
- Gul, M.; Jafari, A.A.; Shah, M.; Mirmoeeni, S.M.S.; Haider, S.U.; Moinuddin, S.; Chaudhry, A. Molecular Biomarkers in Multiple Sclerosis and Its Related Disorders: A Critical Review. Int. J. Mol. Sci. 2020, 21, 6020. [Google Scholar] [CrossRef]
- Porter, L.; Shoushtarizadeh, A.; Jelinek, G.A.; Brown, C.R.; Lim, C.K.; de Livera, A.M.; Jacobs, K.R.; Weiland, T.J. Metabolomic Biomarkers of Multiple Sclerosis: A Systematic Review. Front. Mol. Biosci. 2020, 7, 574133. [Google Scholar] [CrossRef]
- Toscano, S.; Patti, F. CSF biomarkers in multiple sclerosis: Beyond neuroinflammation. Neuroimmunol. Neuroinflamm. 2021, 8, 14–41. [Google Scholar]
- Jones, J.L.; Phuah, C.-L.; Cox, A.L.; Thompson, S.A.; Ban, M.; Shawcross, J.; Walton, A.; Sawcer, S.J.; Compston, A.; Coles, A.J. IL-21 drives secondary autoimmunity in patients with multiple sclerosis, following therapeutic lymphocyte depletion with alemtuzumab (Campath-1H). J. Clin. Investig. 2009, 119, 2052–2061. [Google Scholar] [CrossRef]
- Azzopardi, L.; Thompson, S.A.; Harding, K.E.; Cossburn, M.; Robertson, N.; Compston, A.; Coles, A.J.; Jones, J.L. Predicting autoimmunity after alemtuzumab treatment of multiple sclerosis. J. Neurol. Neurosurg. Psychiatry. 2013, 85, 795–798. [Google Scholar] [CrossRef]
- Berger, T.; Rubner, P.; Schautzer, F.; Egg, R.; Ulmer, H.; Mayringer, I.; Dilitz, E.; Deisenhammer, F.; Reindl, M. Antimyelin antibodies as a predictor of clinically definite multiple sclerosis after a first demyelinating event. N. Engl. J. Med. 2003, 349, 139–145. [Google Scholar] [CrossRef] [PubMed]
- Brickshawana, A.; Hinson, S.R.; Romero, M.F.; Lucchinetti, C.F.; Guo, Y.; Buttmann, M.; McKeon, A.; Pittock, S.J.; Chang, M.-H.; Chen, A.-P.; et al. Investigation of the KIR4.1 potassium channel as a putative antigen in patients with multiple sclerosis: A comparative study. Lancet Neurol. 2014, 13, 795–806. [Google Scholar] [CrossRef]
- Kuhle, J.; Pohl, C.; Mehling, M.; Edan, G.; Freedman, M.S.; Hartung, H.P.; Polman, C.H.; Miller, D.H.; Montalban, X.; Barkhof, F.; et al. Lack of association between antimyelin antibodies and progression to multiple sclerosis. N. Engl. J. Med. 2007, 356, 371–378. [Google Scholar] [CrossRef]
- Vastava, R.; Aslam, M.; Kalluri, S.; Schirmer, L.; Buck, D.; Tackenberg, B.; Rothhammer, V.; Chan, A.; Gold, R.; Berthele, A.; et al. Potassium channel KIR4.1 as an immune target in multiple sclerosis. N. Engl. J. Med. 2012, 367, 115–123. [Google Scholar]
- Corvol, J.C.; Pelletier, D.; Henry, R.G.; Caillier, S.J.; Wang, J.; Pappas, D.; Casazza, S.; Okuda, D.T.; Hauser, S.L.; Oksenberg, J.R.; et al. Abrogation of T cell quiescence characterizes patients at high risk for multiple sclerosis after the initial neurological event. Proc. Natl. Acad. Sci. USA 2008, 105, 11839–11844. [Google Scholar] [CrossRef] [PubMed]
- Hedström, A.K.; Huang, J.; Michel, A.; Butt, J.; Brenner, N.; Hillert, J.; Waterboer, T.; Kockum, I.; Olsson, T.; Alfredsson, L. High Levels of Epstein–Barr virus nuclear antigen1-specific antibodies and infectious mononucleosis act both independently and synergistically to Increase multiple sclerosis risk. Front. Neurol. 2020, 10, 1368. [Google Scholar] [CrossRef] [PubMed]
- Abrahamyan, S.; Eberspächer, B.; Muna, H.M.M.; Hoshi, M.; Aly, L.; Luessi, F.; Groppa, S.; Klotzl, L.; Meuth, S.G.; Schroeder, C.; et al. Complete Epstein-Barr virus seropositivity in a large cohort of patients with early multiple sclerosis. J. Neurol. Neurosurg. Psychiatry 2020, 91, 681–686. [Google Scholar] [CrossRef]
- Dobson, R.; Kuhle, J.; Middeldorp, J.; Giovannoni, G. Epstein-Barr-negative MS: A true phenomenon? Neurol. Neuroimmunol. Neuroinflamm. 2017, 4, e318. [Google Scholar] [CrossRef] [PubMed]
- Zivadinov, R.; Bergsland, N.; Dwyer, M.G. Atrophied brain lesion volume, a magnetic resonance imaging biomarker for monitoring neurodegenerative changes in multiple sclerosis. Quant. Imaging Med. Surg. 2018, 8, 979–983. [Google Scholar] [CrossRef]
- Brex, P.A.; Parker, G.J. Lesion heterogeneity in multiple sclerosis: A study of the relations between appearances on T1 weighted images, T1 relaxation times and metabolite concentrations. J. Neurol. Neurosurg. Psychiatry 2000, 68, 627–632. [Google Scholar] [CrossRef]
- Sahraian, M.A.; Radue, E.W.; Haller, S.; Kappos, L. Black holes in multiple sclerosis: Definition, evolution, and clinical correlations. Acta Neurol. Scand. 2010, 122, 1–8. [Google Scholar] [CrossRef] [PubMed]
- Grossman, R.I.; Gonzalez-Scarano, F.; Atlas, S.W.; Galetta, S.; Silberberg, D.H. Multiple sclerosis: Gadolinium enhancement in MR imaging. Radiology 1986, 161, 721–725. [Google Scholar] [CrossRef]
- Kermode, A.G.; Thompson, A.J.; Tofts, P.; MacManus, D.G.; Kendall, B.E.; Kingsley, D.P.; Moseley, I.F.; Rudge, P.; McDonald, W.I. Breakdown of the blood-brain barrier precedes symptoms and other MRI signs of new lesions in multiple sclerosis. Pathogenetic and clinical implications. Brain 1990, 113, 1477–1489. [Google Scholar] [CrossRef]
- Schmidt, C.; Hattingen, E.; Faehndrich, J.; Jurcoane, A.; Porto, L. Detectability of multiple sclerosis lesions with 3T MRI: A comparison of proton-density weighted and FLAIR sequence. J. Neuroradiol. 2012, 39, 52–57. [Google Scholar] [CrossRef] [PubMed]
- Trip, S.A.; Miller, D.H. Imaging in multiple sclerosis. J. Neurol. Neurosurg. Psychiatry 2005, 76, iii11–iii18. [Google Scholar] [CrossRef] [PubMed]
- Chong, A.L.; Chandra, R.V.; Chuah, K.C.; Roberts, E.L.; Stuckey, S.L. Proton density MRI increases detection of cervical spinal cord multiple sclerosis lesions compared with T2-weighted fast spin-echo. AJNR Am. J. Neuroradiol. 2016, 37, 180–184. [Google Scholar] [CrossRef]
- Moccia, M.; Van de Pavert, S.; Eshaghi, A.; Haider, L.; Pichat, J.; Yiannakas, M.; Ourselin, S.; Wang, Y.; Wheeler-Kingshott, C.; Thompson, A.; et al. Pathologic correlates of the magnetization transfer ratio in multiple sclerosis. Neurology 2020, 95, e2965–e2976. [Google Scholar] [CrossRef]
- Dousset, V.; Grossman, R.I.; Ramer, K.N.; Schnall, M.D.; Young, L.H.; Gonzalez-Scarano, F.; Lavi, E.; Cohen, J.A. Experimental allergic encephalomyelitis and multiple sclerosis: Lesion characterization with magnetization transfer imaging. Radiology 1992, 182, 483–491. [Google Scholar] [CrossRef]
- Deloire-Grassin, M.S.; Brochet, B.; Quesson, B.; Delalande, C.; Dousset, V.; Canioni, P.; Petry, K.G. In vivo evaluation of remyelination in rat brain by magnetization transfer imaging. J. Neurol. Sci. 2000, 178, 10–16. [Google Scholar] [CrossRef]
- Trip, S.A.; Schlottmann, P.G.; Jones, S.J.; Li, W.Y.; Garway-Heath, D.F.; Thompson, A.J.; Plant, G.T.; Miller, D.H. Optic nerve magnetization transfer imaging and measures of axonal loss and demyelination in optic neuritis. Mult. Scler. 2007, 13, 875–879. [Google Scholar] [CrossRef]
- Avila, M.G.S.; Claudio, A.O.; Zabala, E.L.; Teledo, J.D. Diffusion weighted imaging changes in multiple sclerosis patients, frequency and co-relation to disease activity. Austin Neurol. 2018, 3, 1012. [Google Scholar]
- Abolhasani Foroughi, A.; Salahi, R.; Nikseresht, A.; Heidari, H.; Nazeri, M.; Khorsand, A. Comparison of diffusion-weighted imaging and enhanced T1-weighted sequencing in patients with multiple sclerosis. Neuroradiol. J. 2017, 30, 347–351. [Google Scholar] [CrossRef] [PubMed]
- Aung, W.Y.; Mar, S.; Benzinger, T.L. Diffusion tensor MRI as a biomarker in axonal and myelin damage. Imaging Med. 2013, 5, 427–440. [Google Scholar] [CrossRef] [PubMed]
- Pierpaoli, C.; Jezzard, P.; Basser, P.J.; Barnett, A.; Di Chiro, G. Diffusion tensor MR imaging of the human brain. Radiology 1996, 201, 637–648. [Google Scholar] [CrossRef] [PubMed]
- Liu, Y.; Mitchell, P.J.; Kilpatrick, T.J.; Stein, M.S.; Harrison, L.C.; Baker, J.; Ditchfield, M.; Li, K.; Egan, G.F.; Butzkueven, H.; et al. Diffusion tensor imaging of acute inflammatory lesion evolution in multiple sclerosis. J. Clin. Neurosci. 2012, 19, 1689–1694. [Google Scholar] [CrossRef] [PubMed]
- Tian, W.; Zhu, T.; Zhong, J.; Liu, X.; Rao, P.; Segal, B.M.; Ekholm, S. Progressive decline in fractional anisotropy on serial DTI examinations of the corpus callosum: A putative marker of disease activity and progression in SPMS. Neuroradiology 2012, 54, 287–297. [Google Scholar] [CrossRef]
- Hasan, K.M.; Gupta, R.K.; Santos, R.M.; Wolinsky, J.S.; Narayana, P.A. Diffusion tensor fractional anisotropy of the normal-appearing seven segments of the corpus callosum in healthy adults and relapsing-remitting multiple sclerosis patients. J. Magn. Reson. Imaging 2005, 21, 735–743. [Google Scholar] [CrossRef]
- Hakulinen, U.; Brander, A.; Ryymin, P.; Öhman, J.; Soimakallio, S.; Helminen, M.; Dastidar, P.; Eskola, H. Repeatability and variation of region-of-interest methods using quantitative diffusion tensor MR imaging of the brain. BMC Med. Imaging 2012, 12, 30. [Google Scholar] [CrossRef]
- Akbar, N.; Rudko, D.A.; Parmar, K. Magnetic resonance imaging of multiple sclerosis. Sci. J. Mult. Scler. 2017, 1, 008–020. [Google Scholar]
- Narayana, P.A. Magnetic resonance spectroscopy in the monitoring of multiple sclerosis. J. Neuroimaging. 2005, 15, 46S–57S. [Google Scholar] [CrossRef]
- Grazioli, E.; Zivadinov, R.; Weinstock-Guttman, B.; Lincoff, N.; Baier, M.; Wong, J.R.; Hussein, S.; Cox, J.L.; Hojnacki, D.; Ramanathan, M. Retinal nerve fiber layer thickness is associated with brain MRI outcomes in multiple sclerosis. J. Neurol. Sci. 2008, 268, 12–17. [Google Scholar] [CrossRef]
- Britze, J.; Frederiksen, J.L. Optical coherence tomography in multiple sclerosis. Eye 2018, 32, 884–888. [Google Scholar] [CrossRef]
- Oh, U.; Fujita, M.; Ikonomidou, V.N.; Evangelou, I.E.; Matsuura, E.; Harberts, E.; Fujimura, Y.; Richert, N.D.; Ohayon, J.; Pike, V.W.; et al. Translocator protein PET imaging for glial activation in multiple sclerosis. J. Neuroimm. Pharmacol. 2011, 6, 354–361. [Google Scholar] [CrossRef]
- Stankoff, B.; Poirion, E.; Tonietto, M.; Bodini, B. Exploring the heterogeneity of MS lesions using positron emission tomography: A reappraisal of their contribution to disability. Brain Path. 2018, 28, 723–734. [Google Scholar] [CrossRef]
- Hinsinger, G.; Galéotti, N.; Nabholz, N.; Urbach, S.; Rigau, V.; Demattei, C.; Lehmann, S.; Camu, W.; Labauge, P.; Castelnovo, G.; et al. Chitinase 3-like proteins as diagnostic and prognostic biomarkers of multiple sclerosis. Mult. Scler. 2015, 21, 1251–1261. [Google Scholar] [CrossRef] [PubMed]
- Cantó, E.; Reverter, F.; Morcillo-Suárez, C.; Matesanz, F.; Fernández, O.; Izquierdo, G.; Vandenbroeck, K.; Rodríguez-Antigüedad, A.; Urcelay, E.; Arroyo, R.; et al. Chitinase 3-like 1 plasma levels are increased in patients with progressive forms of multiple sclerosis. Mult. Scler. 2012, 8, 983–990. [Google Scholar] [CrossRef] [PubMed]
- Burman, J.; Raininko, R.; Blennow, K.; Zetterberg, H.; Axelsson, M.; Malmestrom, C. YKL-40 is a CSF biomarker of intrathecal inflammation in secondary progressive multiple sclerosis. J. Neuroimmunol. 2016, 292, 52–57. [Google Scholar] [CrossRef]
- Khademi, M.; Kockum, I.; Andersso, M.L.; Iacobaeus, E.; Brundin, L.; Sellebjerg, F.; Hillert, J.; Piehl, F.; Olsson, T. Cerebrospinal Fluid CXCL13 in multiple sclerosis: A suggestive prognostic marker for the disease course. Mult. Scler. J. 2010, 17, 335–343. [Google Scholar] [CrossRef] [PubMed]
- Mouzaki, A.; Rodi, M.; Dimisianos, N.; Emmanuil, A.; Kalavrizioti, D.; Lagoudaki, R.; Grigoriadis, N.C.; Papathanasopoulos, P. Immune Parameters That Distinguish Multiple Sclerosis Patients from Patients with Other Neurological Disorders at Presentation. PLoS ONE 2015, 10, e0135434. [Google Scholar]
- Kim, B.S.; Jin, Y.H. IL-1 signal affects both protection and pathogenesis of virus-induced chronic CNS demyelinating disease. J. Neuroinflammation 2012, 9, 217. [Google Scholar]
- Huang, J.; Khademi, M.; Fugger, L.; Lindhe, Ö.; Novakova, L.; Axelsson, M.; Malmeström, C.; Constantinescu, C.; Lycke, J.; Piehl, F.; et al. Inflammation-related plasma and CSF biomarkers for multiple sclerosis. Proc. Natl. Acad. Sci. USA 2020, 117, 12952–12960. [Google Scholar] [CrossRef]
- Bai, Z.; Chen, D. Cerebrospinal fluid and blood cytokines as biomarkers for multiple sclerosis: A systematic review and meta-analysis of 226 studies with 13,526 patients. Front. Neurosci. 2019, 13, 1026. [Google Scholar] [CrossRef]
- Chen, Y.C.; Yang, X.; Miao, L. Serum level of interleukin-6 in Chinese patients with multiple sclerosis. J. Immunol. 2012, 249, 109–111. [Google Scholar] [CrossRef] [PubMed]
- Ozenci, V.; Kouwenhoven, M.; Huang, Y.M.; Kivisakk, P.; Link, H. Multiple sclerosis is associated with an imbalance between tumor necrosis factor -alpha and IL- 10 secreting blood cells that is corrected by interferon-beta treatment. Clin. Exp. Immunol. 2000, 120, 147–153. [Google Scholar] [CrossRef]
- Ascherio, A.; Munger, K.L. Environmental risk factors for multiple sclerosis. Part I: The role of infection. Ann. Neurol. 2007, 61, 288–299. [Google Scholar] [CrossRef] [PubMed]
- Leibovitch, E.C.; Jacobson, S. Evidence linking HHV-6 with multiple sclerosis: An update. Curr. Opin. Virol. 2014, 9, 127–133. [Google Scholar] [CrossRef] [PubMed]
- Merelli, E.; Bedin, R.; Sola, P.; Barozzi, P.; Mancardi, G.L.; Ficarra, G.; Franchini, G. Human herpes virus 6 and human herpes virus 8 DNA sequences in brains of multiple sclerosis patients, normal adults and children. J. Neurol. 1997, 244, 450–454. [Google Scholar] [CrossRef]
- Barres, B.A.; Schmid, R.; Sendnter, M.; Raff, M.C. Multiple extracellular signals are required for long-term oligodendrocyte survival. Development 1993, 118, 283–295. [Google Scholar] [CrossRef]
- Opsahl, M.L.; Kennedy, P.G. Early and late HHV-6 gene transcripts in multiple sclerosis lesions and normal appearing white matter. Brain 2005, 128, 516–527. [Google Scholar] [CrossRef]
- Dominguez-Mozo, M.I.; Perez-Perez, S.; Villar, L.M.; Oliver-Martos, B.; Villarrubia, N.; Matesanz, F.; Costa-Frossard, L.; Pinto-Medel, M.J.; García-Sánchez, M.I.; Ortega-Madueño, I.; et al. Predictive factors and early biomarkers of response in multiple sclerosis patients treated with natalizumab. Sci. Rep. 2020, 10, 14244. [Google Scholar] [CrossRef]
- Pryce, G.; Baker, D. Oligoclonal bands in multiple sclerosis; Functional significance and therapeutic implications. Does the specificity matter? Mult. Scler. Relat. Disord. 2018, 25, 131–137. [Google Scholar] [CrossRef]
- Trbojevic-Cepe, M. Detection of oligoclonal Ig bands: Clinical significance and trends in methodological improvement. EJIFCC 2004, 15, 86–94. [Google Scholar]
- Ziemssen, T.; Ziemssen, F. The role of the humoral immune system in multiple sclerosis (MS) and its animal model experimental autoimmune encephalomyelitis (EAE). Autoimmun. Rev. 2005, 4, 460–467. [Google Scholar] [CrossRef]
- Kuhle, J.; Disanto, G.; Dobson, R.; Adiutori, R.; Bianchi, L.; Topping, J.; Bestwick, J.P.; Meier, U.-C.; Marta, M.; Dalla Costa, G.; et al. Conversion from clinically isolated syndrome to multiple sclerosis: A large multicentre study. Mult. Scler. 2015, 21, 1013–1024. [Google Scholar] [CrossRef]
- Matute-Blanch, C.; Villar, L.M.; Álvarez-Cermeño, J.C.; Rejdak, K.; Evdoshenko, E.; Makshakov, G.; Nazarov, V.; Lapin, S.; Midaglia, L.; Vidal-Jordana, A.; et al. Neurofilament light chain and oligoclonal bands are prognostic biomarkers in radiologically isolated syndrome. Brain 2018, 141, 1085–1093. [Google Scholar] [CrossRef] [PubMed]
- Dobson, R.; Ramagopalan, S.; Davis, A.; Giovannoni, G. Cerebrospinal fluid oligoclonal bands in multiple sclerosis and clinically isolated syndromes: A meta-analysis of prevalence, prognosis and effect of latitude. J. Neurol. Neurosurg. Psychiatry 2013, 84, 909–914. [Google Scholar] [CrossRef] [PubMed]
- Katsavos, S.; Anagnostouli, M. Biomarkers in Multiple Sclerosis: An up-to-date overview. Mult. Scler. Int. 2013, 2013, 340508. [Google Scholar] [CrossRef]
- Nilsson, P.; Larsson, E.M.; Maly-Sundgren, P.; Perfekt, R.; Sandberg-Wollheim, M. Predicting the outcome of optic neuritis: Evaluation of risk factors after 30 years of follow-up. J. Neurol. 2005, 252, 396–402. [Google Scholar] [CrossRef] [PubMed]
- Tintore, M.; Rovira, À.; Río, J.; Otero-Romero, S.; Arrambide, G.; Tur, C.; Comabella, M.; Nos, C.; Arévalo, M.J.; Negrotto, L.; et al. Defining high, medium and low impact prognostic factors for developing multiple sclerosis. Brain 2015, 138, 1863–1874. [Google Scholar] [CrossRef]
- Skov, A.G.; Skov, T.; Frederiksen, J.L. Oligoclonal bands predict multiple sclerosis after optic neuritis: A literature survey. Mult. Scler. 2011, 17, 404–410. [Google Scholar] [CrossRef]
- Söderström, M.; Ya-Ping, J.; Hillert, J.; Link, H. Optic neuritis: Prognosis for multiple sclerosis from MRI, CSF, and HLA findings. Neurology 1998, 50, 708–714. [Google Scholar] [CrossRef]
- Freedman, M.S.; Thompson, E.J.; Deisenhammer, F.; Giovannoni, G.; Grimsley, G.; Keir, G.; Ohman, S.; Racke, M.K.; Sharief, M.; Sindic, C.J.; et al. Recommended standard of cerebrospinal fluid analysis in the diagnosis of multiple sclerosis: A consensus statement. Arch. Neurol. 2005, 62, 865–870. [Google Scholar] [CrossRef]
- Farina, G.; Magliozzi, R.; Pitteri, M.; Reynolds, R.; Rossi, S.; Gajofatto, A.; Benedetti, M.D.; Facchiano, F.; Monaco, S.; Calabrese, M. Increased cortical lesion load and intrathecal inflammation is associated with oligoclonal bands in multiple sclerosis patients: A combined CSF and MRI study. J. Neuroinflammation 2017, 14, 40. [Google Scholar] [CrossRef] [PubMed]
- Graner, M.; Pointon, T.; Manton, S.; Green, M.; Dennison, K.; Davis, M.; Braiotta, G.; Craft, J.; Edwards, T.; Polonsky, B.; et al. Oligoclonal IgG antibodies in multiple sclerosis target patient-specific peptides. PLoS ONE 2020, 15, e0228883. [Google Scholar]
- Rojas, J.I.; Patrucco, L.; Tizio, S.; Cristiano, E. Oligoclonal bands in the cerebrospinal fluid and increased brain atrophy in early stages of relapsing-remitting multiple sclerosis. Arq. Neuropsiquiatr. 2012, 70, 574–577. [Google Scholar] [CrossRef] [PubMed][Green Version]
- Ferreira, D.; Voevodskaya, O.; Imrell, K.; Stawiarz, L.; Spulber, G.; Wahlund, L.O.; Hillert, J.; Westman, E.; Karrenbauer, V.D. Multiple sclerosis patients lacking oligoclonal bands in the cerebrospinal fluid have less global and regional brain atrophy. J. Neuroinmun. 2014, 274, 149–154. [Google Scholar] [CrossRef] [PubMed]
- Villar, L.M.; Sádaba, M.C.; Roldán, E.; Masjuan, J.; González-Porqué, P.; Villarrubia, N.; Espiño, M.; García-Trujillo, J.A.; Bootello, A.; Alvarez-Cermeño, J.C. Intrathecal synthesis of oligoclonal IgM against myelin lipids predicts an aggressive disease course in MS. J. Clin. Investig. 2005, 115, 187–194. [Google Scholar] [CrossRef] [PubMed]
- Thompson, A.J.; Banwell, B.L.; Barkhof, F.; Carroll, W.M.; Coetzee, T.; Comi, G.; Correale, J.; Fazekas, F.; Filippi, M.; Freedman, M.S.; et al. Diagnosis of multiple sclerosis: 2017 revisions of the McDonald criteria. Lancet Neurol. 2018, 17, 162–173. [Google Scholar] [CrossRef]
- Villar, L.; García-Barragán, N.; Espiño, M.; Roldán, E.; Sádaba, M.; Gómez-Rial, J.; González-Porqué, P.; Alvarez-Cermeño, J. Influence of oligoclonal IgM specificity in multiple sclerosis disease course. Mult. Scler. 2008, 14, 183–187. [Google Scholar] [CrossRef]
- Monreal, E.; Sainz de la Maza, S.; Costa-Frossard, L.; Walo-Delgado, P.; Zamora, J.; Fernández-Velasco, J.I.; Villarrubia, N.; Espiño, M.; Lourido, D.; Lapuente, P.; et al. Predicting aggressive multiple sclerosis with intrathecal IgM synthesis among patients with a clinically isolated syndrome. Neurol. Neuroimmunol. Neuroinflamm. 2021, 8, e1047. [Google Scholar] [CrossRef]
- Thangarajh, M.; Gomez-Rial, J.; Hedström, A.K.; Hillert, J.; Alvarez-Cermeño, J.C.; Masterman, T.; Villar, L.M. Lipid-specific immunoglobulin M in CSF predicts adverse long-term outcome in multiple sclerosis. Mult. Scler. 2008, 14, 1208–12013. [Google Scholar] [CrossRef]
- Álvarez-Cermeño, J.C.; Muñoz-Negrete, F.J.; Costa-Frossard, L.; Sainz de la Maza, S.; Villar, L.M.; Rebolleda, G. Intrathecal lipid-specific oligoclonal IgM synthesis associates with retinal axonal loss in multiple sclerosis. J. Neurol. Sci. 2016, 360, 41–44. [Google Scholar] [CrossRef]
- Villar, L.M.; Picón, C.; Costa-Frossard, L.; Alenda, R.; García-Caldentey, J.; Espiño, M.; Muriel, A.; Álvarez-Cermeño, J.C. Cerebrospinal fluid immunological biomarkers associated with axonal damage in multiple sclerosis. Eur. J. Neurol. 2015, 22, 1169–1175. [Google Scholar] [CrossRef] [PubMed]
- Villar, L.M.; Casanova, B.; Ouamara, N.; Comabella, M.; Jalili, F.; Leppert, D.; de Andrés, C.; Izquierdo, G.; Arroyo, R.; Avşar, T.; et al. Immunoglobulin M oligoclonal bands: Biomarker of targetable inflammation in primary progressive multiple sclerosis. Ann. Neurol. 2014, 76, 231–240. [Google Scholar] [CrossRef] [PubMed]
- Yuan, A.; Rao, M.V.; Nixon, R.A. Neurofilaments at a glance. J. Cell Sci. 2012, 125, 3257–3263. [Google Scholar] [CrossRef] [PubMed]
- Khalil, M.; Teunissen, C.E.; Otto, M.; Pieh, L.F.; Sormani, M.P.; Gattringer, T.; Barro, C.; Kappos, L.; Comabella, M.; Fazekas, F.; et al. Neurofilaments as biomarkers in neurological disorders. Nature Rev. Neurol. 2018, 14, 577–589. [Google Scholar] [CrossRef] [PubMed]
- Salzer, J.; Svenningsson, A.; Sundstrom, P. Neurofilament light as a prognostic marker in multiple sclerosis. Mult. Scler. 2010, 16, 287–292. [Google Scholar] [CrossRef] [PubMed]
- Arrambide, G.; Espejo, C.; Eixarch, H. Neurofilament light chain level is a weak risk factor for the development of MS. Neurology 2016, 87, 1076–1084. [Google Scholar] [CrossRef] [PubMed]
- Modvig, S.; Degn, M.; Roed, H.; Sørensen, T.L.; Larsson, H.B.; Langkilde, A.R.; Frederiksen, J.L.; Sellebjerg, F. Cerebrospinal fluid levels of chitinase 3-like 1 and neurofilament light chain predict multiple sclerosis development and disability after optic neuritis. Mult. Scler. 2015, 21, 1761–1770. [Google Scholar] [CrossRef] [PubMed]
- Barro, C.; Leocani, L.; Leppert, D.; Comi, G.; Kappos, L.; Kuhle, J. Fluid biomarker and electrophysiological outcome measures for progressive MS trials. Mult. Scler. 2017, 23, 1600–1613. [Google Scholar] [CrossRef]
- Novakova, L.; Zetterberg, H.; Sundström, P.; Axelsson, M.; Khademi, M.; Gunnarsson, M.; Malmeström, C.; Svenningsson, A.; Olsson, T.; Piehl, F.; et al. Monitoring disease activity in multiple sclerosis using serum neurofilament light protein. Neurology 2017, 89, 2230–2237. [Google Scholar] [CrossRef]
- Gunnarsson, M.; Malmeström, C.; Axelsson, M.; Sundström, P.; Dahle, C.; Vrethem, M.; Olsson, T.; Piehl, F.; Norgren, N.; Rosengren, L.; et al. Axonal damage in relapsing multiple sclerosis is markedly reduced by natalizumab. Ann. Neurol. 2011, 69, 83–89. [Google Scholar] [CrossRef]
- Kuhle, J.; Kropshofer, H.; Haering, D.A.; Kundu, U.; Meinert, R.; Barro, C.; Dahlke, F.; Tomic, D.; Leppert, D.; Kappos, L. Blood neurofilament light chain as a biomarker of MS disease activity and treatment response. Neurology 2019, 92, e1007–e1015. [Google Scholar] [CrossRef]
- Petzold, A. Neurofilament phosphoforms: Surrogate markers for axonal injury, degeneration and loss. J. Neurol. Sci. 2005, 233, 183–198. [Google Scholar] [CrossRef] [PubMed]
- Teunissen, C.E.; Iacobaeus, E.; Khademi, M.; Brundin, L.; Norgren, N.; Koel-Simmelink, M.J.; Schepens, M.; Bouwman, F.; Twaalfhoven, H.A.; Blom, H.J.; et al. Combination of CSF N-acetylaspartate and neurofilaments in multiple sclerosis. Neurology 2009, 72, 1322–1329. [Google Scholar] [CrossRef] [PubMed]
- Cohen, S.R.; Herndon, R.M.; McKhann, G.M. Radioimmunoassay of myelin basic protein in spinal fluid: An index of active demyelination. N. Engl. J. Med. 1976, 295, 1455–1457. [Google Scholar] [CrossRef] [PubMed]
- Whitaker, J.N. Myelin encephalitogenic protein fragments in cerebrospinal fluid of persons with multiple sclerosis. Neurology 1977, 27, 911–920. [Google Scholar] [CrossRef]
- Romme Christensen, J.; Börnsen, L.; Khademi, M.; Olsson, T.; Jensen, P.E.; Sørensen, P.S. Sellebjerg F CSF inflammation and axonal damage are increased and correlate in progressive multiple sclerosis. Mult. Scler. 2013, 19, 877–884. [Google Scholar] [CrossRef]
- Harris, V.K.; Sadiq, S.A. Disease biomarkers in multiple sclerosis: Potential for use in therapeutic decision making. Mol. Diagn. Ther. 2009, 13, 225–244. [Google Scholar] [CrossRef]
- Wekerle, H.; Lassmann, H. The immunology of inflammatory demyelinating disease. In McAlpine’s Multiple Sclerosis, 4th ed.; Compston, A., Ed.; Elsevier Health Sciences: Amsterdam, The Netherlands, 2005. [Google Scholar]
- Sellebjerg, F.; Christiansen, M.; Garred, P. MBP, anti-MBP and anti-PLP antibodies, and intrathecal complement activation in multiple sclerosis. Mult. Scler. 1998, 4, 127–131. [Google Scholar] [CrossRef]
- O’Conner, K.C.; Lopez-Amaya, C.; Gagne, D.; Lovato, L.; Moore-Odom, N.H.; Kennedy, J.; Krupp, L.; Tenembaum, S.; Ness, J.; Belman, A.; et al. Antimyelin antibodies modulate clinical expression of childhood Multiple Sclerosis. J. Immunol. 2010, 223, 92–99. [Google Scholar]
- Spadaro, M.; Gerdes, L.A.; Krumbholz, M.; Ertl-Wagner, B.; Thaler, F.S.; Schuh, E.; Metz, I.; Blaschek, A.; Dick, A.; Bruck, W.; et al. Autoantibodies to MOG in a distinct subgroup of adult Multiple Sclerosis. Neurol. Neuroimmunol. Neuroinflamm. 2016, 3, e257. [Google Scholar] [CrossRef]
- Kuerten, S.; Lanz, T.V.; Lingampalli, N.; Lahey, L.J.; Kleinschnitz, C.; Mäurer, M.; Schroeter, M.; Braune, S.; Ziemssen, T.; Ho, P.P.; et al. Autoantibodies against central nervous system antigens in a subset of B cell-dominant multiple sclerosis patients. Proc. Natl. Acad. Sci. USA 2020, 117, 21512–21518. [Google Scholar] [CrossRef] [PubMed]
- Ziemssen, T.; Akgün, K.; Brück, W. Molecular biomarkers in multiple sclerosis. J. Neuroinflammation 2019, 16, 272. [Google Scholar] [CrossRef] [PubMed]
- Lefvert, A.K.; Link, H. IgG production within the central nervous system: A critical review of proposed formulae. Ann. Neurol. 1985, 17, 13–20. [Google Scholar] [CrossRef] [PubMed]
- LeVine, S.M. Albumin and multiple sclerosis. BMC Neurol. 2016, 16, 47. [Google Scholar] [CrossRef]
- Harris, V.K.; Tuddenham, J.F.; Sadiq, S.A. Biomarkers of multiple sclerosis: Current findings. Degener. Neurol. Neuromuscul. Dis. 2017, 7, 19–29. [Google Scholar] [CrossRef]
- Ahlbrecht, J.; Martino, F.; Pul, R.; Skritpuletz, T.; Suhs, K.W.; Schauerte, C.; Yildiz, O.; Trebst, O.; Tasto, L.; Thum, S.; et al. Deregulation of microRNA-181C in cerebrospinal fluid of patients clinically isolated syndrome is associated with early conversion to Relapsing-Remitting Multiple Sclerosis. Mult. Scler. 2016, 22, 1202–1214. [Google Scholar] [CrossRef]
- Bergman, P.; Piket, E.; Khademi, M.; James, T.; Brundin, L.; Olsson, T.; Piehl, F.; Jagodic, M. Circulating miR-150 in CSF is a novel candidate biomarker for multiple sclerosis. Neurol. Neuroimmunol. Neuroinflamm. 2016, 3, e219. [Google Scholar] [CrossRef]
- Ma, X.; Zhou, J.; Zhong, Y. Expression, regulation and functions of microRNAs in multiple sclerosis. Int. J. Med. Sci. 2014, 11, 810–818. [Google Scholar] [CrossRef]
- Gresle, M.M.; Shaw, G.; Jarrott, B.; Alexandrou, E.N.; Friedhuber, A.; Kilpatrick, T.J.; Butzkueven, H. Validation of a novel biomarker for acute axonal injury in experimental autoimmune encephalomyelitis. J. Neurosci. Res. 2008, 86, 3548–3555. [Google Scholar] [CrossRef] [PubMed]
- Petzold, A.; Eikelenboom, M.J.; Keir, G.; Grant, D.; Lazeron, R.H.; Polman, C.H.; Uitdehaag, B.M.; Thompson, E.J.; Giovannoni, G. Axonal damage accumulates in the progressive phase of multiple sclerosis: Three years follow up study. J. Neurol. Neurosurg. Psychiatry 2005, 76, 206–211. [Google Scholar] [CrossRef] [PubMed]
- Brettschneider, J.; Petzold, A.; Junker, A.; Tumani, H. Axonal damage markers in the cerebrospinal fluid of patients with clinically isolated syndrome improve predicting conversion to definite multiple sclerosis. Mult. Scler. 2006, 12, 143–148. [Google Scholar] [CrossRef] [PubMed]
- Rejdak, K.; Petzold, A.; Stelmasiak, Z.; Giovannoni, G. Cerebrospinal fluid brain specific proteins in relation to nitric oxide metabolites during relapse of multiple sclerosis. Mult. Scler. 2008, 14, 59–66. [Google Scholar] [CrossRef]
- Lycke, J.N.; Karlsson, J.E.; Andersen, O.; Rosengren, L.E. Neurofilament protein in cerebrospinal fluid: A potential marker of activity in multiple sclerosis. J. Neurol. Neurosurg. Psychiatry 1998, 64, 402–404. [Google Scholar] [CrossRef]
- Malmeström, C.; Haghighi, S.; Rosengren, L.; Andersen, O.; Lycke, J. Neurofilament light protein and glial fibrillary acidic protein as biological markers in MS. Neurology 2003, 61, 1720–1725. [Google Scholar] [CrossRef] [PubMed]
- Teunissen, C.E.; Dijkstra, P.C.; Polman, C. Biological markers in CSF and blood for axonal degeneration in multiple sclerosis. Lancet Neurol. 2005, 4, 32–41. [Google Scholar] [CrossRef]
- Bandyopadhyay, B.; Li, G.; Yin, H.; Kuret, J. Tau aggregation and toxicity in a cell culture model of tauopathy. J. Biol. Chem. 2007, 282, 16454–16464. [Google Scholar] [CrossRef]
- Anderson, J.M.; Patani, R.; Reynolds, R.; Nicholas, R.; Compston, A.; Spillantini, M.G.; Chandran, S. Evidence for abnormal tau phosphorylation in early aggressive multiple sclerosis. Acta Neuropathol. 2009, 117, 583–589. [Google Scholar] [CrossRef]
- Sjögren, M.; Vanderstichele, H.; Agren, H.; Zachrisson, O.; Edsbagge, M.; Wikkelsø, C.; Skoog, I.; Wallin, A.; Wahlund, L.O.; Marcusson, J.; et al. Tau and Abeta42 in cerebrospinal fluid from healthy adults 21-93 years of age: Establishment of reference values. Clin. Chem. 2001, 47, 1776–1781. [Google Scholar] [CrossRef]
- Anderson, J.M.; Patani, R.; Reynolds, R.; Nicholas, R.; Compston, A.; Spillantini, M.G.; Chandran, S. Abnormal tau phosphorylation in primary progressive multiple sclerosis. Acta Neuropath. 2010, 119, 591–600. [Google Scholar] [CrossRef]
- Brettschneider, J.; Maier, M.; Arda, S.; Claus, A.; Süssmuth, S.D.; Kassubek, J.; Tumani, H. Tau protein level in cerebrospinal fluid is increased in patients with early multiple sclerosis. Mult. Scler. 2005, 11, 261–265. [Google Scholar] [CrossRef]
- Tiberio, M.; Chard, D.T.; Altmann, D.R.; Davies, G.; Griffin, C.M.; McLean, M.A.; Rashid, W.; Sastre-Garriga, J.; Thompson, A.J.; Miller, D.H. Metabolite changes in early relapsing-remitting multiple sclerosis: A two-year follow-up study. J. Neurol. 2006, 253, 224–230. [Google Scholar] [CrossRef] [PubMed]
- Van Au Duong, M.; Audoin, B.; Le Fur, Y.; Confort-Gouny, S.; Malikova, I.; Soulier, E.; Viout, P.; Ali-Cherif, A.; Pelletier, J.; Cozzone, P.J.; et al. Relationships between gray matter metabolic abnormalities and white matter inflammation in patients at the very early stage of MS: A MRSI study. J. Neurol. 2007, 254, 914–923. [Google Scholar] [CrossRef] [PubMed]
- Viala, K.; Stievenart, J.L.; Cabanis, E.A.; Lyon-Caen, O.; Tourbah, A. Study with localized proton magnetic resonance spectroscopy of 31 multiple sclerosis lesions: Correlations with clinical and MRI features. Rev. Neurol. 2001, 157, 35–44. [Google Scholar]
- Narayanan, S.; De Stefano, N.; Francis, G.S.; Arnaoutelis, R.; Caramanos, Z.; Collins, D.L.; Pelletier, D.; Arnason, B.G.W.; Antel, J.P.; Arnold, D.L. Axonal metabolic recovery in multiple sclerosis patients treated with interferon beta-1b. J. Neurol. 2001, 248, 979–986. [Google Scholar] [CrossRef] [PubMed]
- Povlishock, J.T. Traumatically induced axonal injury: Pathogenesis and pathobiological implications. Brain Pathol. 1992, 2, 1–12. [Google Scholar]
- Adams, R.D.; Kubik, C.S. The morbid anatomy of the demyelinative disease. Am. J. Med. 1952, 12, 510–546. [Google Scholar] [CrossRef]
- Mattsson, N.; Axelsson, M.; Haghighi, S.; Malmeström, C.; Wu, G.; Anckarsäter, R.; Sankaranarayanan, S.; Andreasson, U.; Fredrikson, S.; Gundersen, A.; et al. Reduced cerebrospinal fluid BACE1 activity in multiple sclerosis. Mult. Scler. 2009, 15, 448–454. [Google Scholar] [CrossRef]
- Gehrmann, J.; Banati, R.B.; Cuzner, M.L.; Kreutzberg, G.W.; Newcombe, J. Amyloid precursor protein (APP) expression in multiple sclerosis lesions. Glia 1995, 15, 141–151. [Google Scholar] [CrossRef]
- Clarner, T.; Buschmann, J.P.; Beyer, C.; Kipp, M. Glial amyloid precursor protein expression is restricted to astrocytes in an experimental toxic model of multiple sclerosis. J. Mol. Neurosci. 2011, 43, 268–274. [Google Scholar] [CrossRef]
- Young, E.A.; Fowler, C.D.; Kidd, G.J.; Chang, A.; Rudick, R.; Fisher, E.; Trapp, B.D. Imaging co-relates of decreased axonal Na+/K+ ATPase in chronic multiple sclerosis lesions. Ann. Neurol. 2008, 63, 428–435. [Google Scholar] [CrossRef] [PubMed]
- Stys, P.K.; Waxman, S.G.; Ransom, B.R. Ionic mechanisms of anoxic injury in mammalian CNS white matter: Role of Na+ channels and Na (+)-Ca2+ exchanger. J. Neurosci. 1992, 12, 430–439. [Google Scholar] [CrossRef] [PubMed]
- Mathur, D.; Riffo-Campos, A.L.; Castillo, J.; Haines, J.D.; Vidaurre, O.G.; Zhang, F.; Coret-Ferrer, F.; Casaccia, P.; Casanova, B.; Lopez-Rodas, G. Bioenergetic failure in rat oligodendrocyte progenitor cells treated with cerebrospinal fluid derived from multiple sclerosis patients. Front. Cell. Neurosci. 2017, 11, 209. [Google Scholar] [CrossRef]
- Mathur, D.; María-Lafuente, E.; Ureña-Peralta, J.R.; Sorribes, L.; Hernández, A.; Casanova, B.; López-Rodas, G.; Coret-Ferrer, F.; Burgal-Marti, M. Disturbed glucose metabolism in rat neurons exposed to cerebrospinal fluid obtained from multiple sclerosis subjects. Brain Sci. 2017, 8, 1. [Google Scholar] [CrossRef]
- Waxman, S.G. Axonal dysfunction in chronic multiple sclerosis: Meltdown in the membrane. Ann. Neurol. 2008, 63, 411–413. [Google Scholar] [CrossRef] [PubMed]
- Zhu, X.H.; Qiao, H.; Du, F.; Xiong, Q.; Liu, X.; Zhang, X.; Ugurbil, K.; Chen, W. Quantitative imaging of energy expenditure in human brain. Neuroimage 2012, 60, 2107–2117. [Google Scholar] [CrossRef]
- Zaaraoui, W.; Konstandin, S.; Audoin, B.; Nagel, A.M.; Rico, A.; Malikova, I.; Soulier, E.; Viout, P.; Confort-Gouny, S.; Cozzone, P.J.; et al. Distribution of brain sodium accumulation correlates with disability in multiple sclerosis: A cross-sectional 23Na MR imaging study. Radiology 2012, 264, 859–867. [Google Scholar] [CrossRef]
- Paling, D.; Solanky, B.S.; Riemer, F.; Tozer, D.J.; Wheeler-Kingshott, C.A.; Kapoor, R.; Golay, X.; Miller, D.H. Sodium accumulation is associated with disability and a progressive course in multiple sclerosis. Brain 2013, 136, 2305–2317. [Google Scholar] [CrossRef]
- Petracca, M.; Fleysher, L.; Oesingmann, N.; Inglese, M. Sodium MRI of multiple sclerosis. NMR Biomed. 2016, 29, 153–161. [Google Scholar] [CrossRef]
- Eisele, P.; Konstandin, S.; Szabo, K.; Ebert, A.; Roßmanith, C.; Paschke, N.; Kerschensteiner, M.; Platten, M.; Schoenberg, S.O.; Schad, L.R.; et al. Temporal evolution of acute multiple sclerosis lesions on serial sodium (23Na) MRI. Mult. Scler. Relat. Disord. 2019, 29, 48–54. [Google Scholar] [CrossRef]
- Huhn, K.; Engelhorn, T.; Linker, R.A.; Nagel, A.M. Potential of sodium MRI as a biomarker for neurodegeneration and neuroinflammation in multiple sclerosis. Front. Neurol. 2019, 10, 84. [Google Scholar] [CrossRef] [PubMed]
- Brebner, J.A.; Stockley, R.A. Polyclonal free light chains: A biomarker of inflammatory disease or treatment target? F1000 Med. Rep. 2013, 5, 4. [Google Scholar] [CrossRef] [PubMed]
- Presslauer, S.; Milosavljevic, D.; Brücke, T.; Bayer, P.; Hübl, W. Elevated levels of kappa free light chains in CSF support the diagnosis of multiple sclerosis. J. Neurol. 2008, 255, 1508–1514. [Google Scholar] [CrossRef] [PubMed]
- Rinker, J.R., 2nd; Trinkaus, K.; Cross, A.H. Elevated CSF free kappa light chains correlate with disability prognosis in multiple sclerosis. Neurology 2006, 67, 1288–1290. [Google Scholar] [CrossRef]
- Villar, L.M.; Espino, M.; Costa-Frossard, L.; Muriel, A.; Jimenez, J.; Alvarez-Cermeño, J.C. High levels of cerebrospinal fluid free kappa chains predict conversion to multiple sclerosis. Clin. Chim. Acta 2012, 413, 1813–1816. [Google Scholar] [CrossRef]
- Arneth, B.; Birklein, F. High sensitivity of free lambda and free kappa light chains for detection of intrathecal immunoglobulin synthesis in cerebrospinal fluid. Acta Neurol. Scand. 2009, 119, 39–44. [Google Scholar] [CrossRef]
- Brundin, L.; Morcos, E.; Olsson, T.; Wiklund, N.P.; Andersson, M. Increased intrathecal nitric oxide formation in multiple sclerosis, cerebrospinal fluid nitrite as activity marker. Eur. J. Neurol. 1999, 6, 585–590. [Google Scholar] [CrossRef]
- Danilov, A.I.; Andersson, M.; Bavand, N.; Wiklund, N.P.; Olsson, T.; Brundin, L. Nitric oxide metabolite determinations reveal continuous inflammation in multiple sclerosis. J. Neuroinmunol. 2003, 136, 112–118. [Google Scholar] [CrossRef]
- Brown, G.C.; Bal-Price, A. Inflammatory neurodegeneration mediated by nitric oxide, glutamate, and mitochondria. Mol. Neurobiol. 2003, 27, 325–355. [Google Scholar] [CrossRef]
- Sellebjerg, F.; Giovannoni, G.; Hand, A.; Madsen, H.O.; Jensen, C.V.; Garred, P. Cerebrospinal fluid levels of nitric oxide metabolites predict response to methylprednisolone treatment in multiple sclerosis and optic neuritis. J. Neuroinmunol. 2002, 125, 198–203. [Google Scholar] [CrossRef]
- Vladimirova, O.; Lu, F.M.; Shawver, L.; Kalman, B. The activation of protein kinase C induces higher production of reactive oxygen species by mononuclear cells in patients with multiple sclerosis than in controls. Inflamm. Res. 1999, 48, 412–416. [Google Scholar] [CrossRef]
- Diestel, A.; Akta, S.O.; Hackel, D.; Hake, I.; Meier, S.; Raine, C.S.; Nitsch, R.; Zipp, F.; Ullrich, O. Activation of microglial poly (ADP-ribose)-polymerase-1 by cholesterol breakdown products during neuroinflammation: A link between demyelination and neuronal damage. J. Exp. Med. 2003, 198, 1729–1740. [Google Scholar] [CrossRef] [PubMed]
- Lucchinetti, C.F.; Bruck, W.; Rodriguez, M.; Lassmann, H. Distinct patterns of multiple sclerosis pathology indicate heterogeneity on pathogenesis. Brain Pathol. 1996, 6, 259–274. [Google Scholar] [CrossRef] [PubMed]
- Ozawa, K.; Suchanek, G. Patterns of oligodendroglia pathology in multiple sclerosis. Brain 1994, 117, 1311–1322. [Google Scholar] [CrossRef]
- Sun, M.; Liu, N.; Xie, Q.; Li, X.; Sun, J.; Wang, H.; Wang, M.A. candidate biomarker of glial fibrillary acidic protein in CSF and blood in differentiating multiple sclerosis and its subtypes: A systematic review and meta-analysis. Mult. Scler. Relat. Disord. 2021, 51, 102870. [Google Scholar] [CrossRef] [PubMed]
- Petzold, A.; Eikelenboom, M.J.; Gveric, D.; Keir, G.; Chapman, M.; Lazeron, R.H.; Cuzner, M.L.; Polman, C.H.; Uitdehaag, B.M.; Thompson, E.J. Markers for different glial cell responses in multiple sclerosis: Clinical and pathological correlations. Brain 2002, 125, 1462–1473. [Google Scholar] [CrossRef] [PubMed]
- Misu, T.; Takahashi, T.; Nakashima, I.; Fujihara, K. Biomarkers in Neuromyelitis Optica. Brain Nerve 2012, 64, 525–535. [Google Scholar]
- Takano, R.; Misu, T.; Takahashi, T.; Sato, S.; Fujihara, K.; Itoyama, Y. Astrocytic damage is far more severe than demyelination in NMO: A clinical CSF biomarker study. Neurology 2010, 75, 208–216. [Google Scholar] [CrossRef]
- Flanagan, E.P.; Cabre, P.; Weinshenker, B.G.; Sauver, J.S.; Jacobson, D.J.; Majed, M.; Lennon, V.A.; Lucchinetti, C.F.; McKeon, A.; Matiello, M.; et al. Epidemiology of aquaporin-4 autoimmunity and neuromyelitis optica spectrum. Ann. Neurol. 2016, 79, 775–783. [Google Scholar] [CrossRef]
- McCreary, M.; Mealy, M.A.; Wingerchuk, D.M.; Levy, M.; DeSena, A.; Greenberg, B.M. Updated diagnostic criteria for neuromyelitis optica spectrum disorder: Similar outcomes of previously separate cohorts. Mult. Scler. J. Exp. Transl. Clin. 2018, 4, 2055217318815925. [Google Scholar] [CrossRef] [PubMed]
- Paul, F.; Jarius, S.; Aktas, O.; Bluthner, M.; Bauer, O.; Appelhans, H.; Franciotta, D.; Bergamaschi, R.; Littleton, E.; Palace, J.; et al. Antibody to aquaporin 4 in the diagnosis of neuromyelitis optica. PLoS Med. 2007, 4, e133. [Google Scholar] [CrossRef] [PubMed]
- Schwenkenbecher, P.; Wurster, U.; Konen, F.F.; Gingele, S.; Sühs, K.W.; Wattjes, M.P.; Stangel, M.; Skripuletz, T. Impact of the McDonald Criteria 2017 on Early Diagnosis of Relapsing-Remitting Multiple Sclerosis. Front. Neurol. 2019, 10, 188. [Google Scholar] [CrossRef] [PubMed]


| Biomarkers | Description |
|---|---|
| Predictive | Risk to Develop MS |
| Diagnostic | Fast Interpretation of Pathological State of MS |
| Prognosis | Outcome or Course of MS |
| Disease-Associated Activity | Demonstration of Current MS Condition as Inflammation, Demyelination, Cognitive Dysfunction, etc. |
| Response to Treatment | Predict Response to Therapy in MS Patients |
| Predictive Biomarkers | Diagnostic Biomarkers | Prognostic Biomarker | Biomarkers of Dysfunction and Pathology |
|---|---|---|---|
| Epstein–Barr Virus (EBV) [26,27,28] | Radiological Biomarkers [29,30,31,32,33,34,35,36,37,38,39,40,41,42,43,44,45,46,47,48,49,50,51,52,53,54] | Chitinase-3-Like-1 (CHI3L1) [55,56,57] | Immunological Dysfunction Cytokines [58,59,60,61,62,63,64] |
| Human Herpesvirus Type-6 (HHV-6) [65,66,67,68,69,70] | Oligoclonal Bands (IgG) and (IgM) [71,72,73,74,75,76,77,78,79,80,81,82,83,84,85,86,87,88,89,90,91,92,93,94] | Neurofilaments (NF) [95,96,97,98,99,100,101,102,103,104,105] | Demyelination Myelin Basic Protein (MBP) [106,107,108,109,110,111] |
| Anti-MOG and Anti-MBP Antibodies [112,113,114,115] | Immunoglobulin G Index (IgG Index) [116,117] | miRNAs [118,119,120,121] | Axonal Damage Neurofilaments (NF) [122,123,124,125,126,127] Microtubule-Associated Protein Tau [128,129,130,131,132,133] N-acetylaspartate (NAA) [134,135,136,137] Amyloid-precursor protein (APP) [138,139,140,141,142] Ionic Imbalance [143,144,145,146,147,148,149,150,151,152,153] |
| Kappa Free (KFLC) and Lambda Free Light Chains (LFLC) [154,155,156,157,158] | Glial activation/dysfunction Nitric Oxide (NO) [159,160,161,162] Reactive Oxygen Species (ROS) [163,164] Glial Fibrillary Acidic Protein (GFAP) [165,166,167,168,169,170] S100 Calcium-Binding Protein B (S-100B) [168] | ||
| Anti-Aquaporin-4 (AQP4) Antibodies [171,172,173] |
| Imaging Biomarker | Lesion Category | References | Utility in MS | Limitations |
|---|---|---|---|---|
| T2-Weighted | Periventricular Juxtacortical | [29] | Indicate Demyelination and Inflammation | Variations in the MR Images which is Due to Variable Radiofrequency Response in the Brain. Background Noise Makes Difficult to Separate Lesions from White Matter |
| T1-Weighted | Gd-Enhancing Lesions and Spinal Cord Lesions | [31,32] | Shows About Axonal Loss and BBB Disruption | Need of Reproducible and Reliable Method to Quantify Brain Atrophy |
| MTR | Gd-Enhancing Demyelinated Remyelinated and Necrotic Lesions | [38,39] | Indicate Changes in Myelin Composition and Axonal Loss | Measurements are Not Absolute and Results Vary Repeatedly as a Function of the Shape, Bandwidth and Frequency of MS Pulse so More Errors Occur |
| DWI and DTI | Demyelinating and Periventricular Lesions | [41,42,43] | Demonstrates about Demyelination and Axonal Loss | Lack of Pathology Specificity. Required Variable Samples According to Different Type of Lesions and Different Locations of the Brain |
| MRS | Periventricular and Cortical Lesions | [49,50] | Assess Measure Biochemicals as NAA, GABA, etc. which Reflect Axonal Damage and Shows Abnormalities in Pathology of MS | |
| OCT | Optic Nerve Lesions | [51,52] | Used to Measure RNFL Thickness and Macular Volume also Gives Data about Axonal Loss, Neurodegeneration | Movement of Patient Can Diminish the Quality of Image |
| PET | Periventricular Necrotic Juxtacortical and Gd-enhancing Lesions | [53,54] | Assess Inflammation in Cortex, NAWM and Gives Information about Clinical Severity | Invasive and Expensive Tool Not Available all the Time. During Acquisition, if Patient Moves the Activity Will Blur Over Brain Structures. Resolution Will be Degraded and Interpretation of Results Will be Impossible |
Publisher’s Note: MDPI stays neutral with regard to jurisdictional claims in published maps and institutional affiliations. |
© 2021 by the authors. Licensee MDPI, Basel, Switzerland. This article is an open access article distributed under the terms and conditions of the Creative Commons Attribution (CC BY) license (https://creativecommons.org/licenses/by/4.0/).
Share and Cite
Mathur, D.; Mishra, B.K.; Rout, S.; Lopez-Iranzo, F.J.; Lopez-Rodas, G.; Vallamkondu, J.; Kandimalla, R.; Casanova, B. Potential Biomarkers Associated with Multiple Sclerosis Pathology. Int. J. Mol. Sci. 2021, 22, 10323. https://doi.org/10.3390/ijms221910323
Mathur D, Mishra BK, Rout S, Lopez-Iranzo FJ, Lopez-Rodas G, Vallamkondu J, Kandimalla R, Casanova B. Potential Biomarkers Associated with Multiple Sclerosis Pathology. International Journal of Molecular Sciences. 2021; 22(19):10323. https://doi.org/10.3390/ijms221910323
Chicago/Turabian StyleMathur, Deepali, Bikash Kumar Mishra, Soumyashree Rout, Francisco Jose Lopez-Iranzo, Gerardo Lopez-Rodas, Jayalakshmi Vallamkondu, Ramesh Kandimalla, and Bonaventura Casanova. 2021. "Potential Biomarkers Associated with Multiple Sclerosis Pathology" International Journal of Molecular Sciences 22, no. 19: 10323. https://doi.org/10.3390/ijms221910323
APA StyleMathur, D., Mishra, B. K., Rout, S., Lopez-Iranzo, F. J., Lopez-Rodas, G., Vallamkondu, J., Kandimalla, R., & Casanova, B. (2021). Potential Biomarkers Associated with Multiple Sclerosis Pathology. International Journal of Molecular Sciences, 22(19), 10323. https://doi.org/10.3390/ijms221910323