Article

Personalised Medicine for Colorectal Cancer Using Mechanism-Based Machine Learning Models

Systems Biology Ireland, School of Medicine, University College Dublin, Belfield, Dublin 4, Ireland
*
Author to whom correspondence should be addressed.
Int. J. Mol. Sci. 2021, 22(18), 9970; https://doi.org/10.3390/ijms22189970
Submission received: 2 August 2021 / Revised: 1 September 2021 / Accepted: 10 September 2021 / Published: 15 September 2021
(This article belongs to the Special Issue Targeted Cancer Therapy and Mechanisms of Resistance)

Abstract

:
Gaining insight into the mechanisms of signal transduction networks (STNs) by using critical features from patient-specific mathematical models can improve patient stratification and help to identify potential drug targets. To achieve this, these models should focus on the critical STNs for each cancer, include prognostic genes and proteins, and correctly predict patient-specific differences in STN activity. Focussing on colorectal cancer and the WNT STN, we used mechanism-based machine learning models to identify genes and proteins with significant associations to event-free patient survival and predictive power for explaining patient-specific differences of STN activity. First, we identified the WNT pathway as the most significant pathway associated with event-free survival. Second, we built linear-regression models that incorporated both genes and proteins from established mechanistic models in the literature and novel genes with significant associations to event-free patient survival. Data from The Cancer Genome Atlas and Clinical Proteomic Tumour Analysis Consortium were used, and patient-specific STN activity scores were computed using PROGENy. Three linear regression models were built, based on; (1) the gene-set of a state-of-the-art mechanistic model in the literature, (2) novel genes identified, and (3) novel proteins identified. The novel genes and proteins were genes and proteins of the extant WNT pathway whose expression was significantly associated with event-free survival. The results show that the predictive power of a model that incorporated novel event-free associated genes is better compared to a model focussing on the genes of a current state-of-the-art mechanistic model. Several significant genes that should be integrated into future mechanistic models of the WNT pathway are DVL3, FZD5, RAC1, ROCK2, GSK3B, CTB2, CBT1, and PRKCA. Thus, the study demonstrates that using mechanistic information in combination with machine learning can identify novel features (genes and proteins) that are important for explaining the STN heterogeneity between patients and their association to clinical outcomes.

1. Introduction

Colorectal cancer (CRC) is the second leading cause of cancer-related death worldwide [1,2,3]. From the four global consensus molecular subtypes (CMS) of CRC, CMS1–4, no specific drugs have been identified that target a specific CMS [4]. However, there are multiple studies showing that some CMS subtypes benefit from specific therapeutic regimens [5,6,7]. For CMS2 and 3, both of which are poorly immunogenic in comparison to CMS1 and 4, the only associated treatment is toxic chemotherapy, which results in poor patient prognosis [2,8]. Biomarkers are foundations of clinical and personalised medicine; despite being vital tools in the area of clinical diagnostics, many are based on single time-point measurements and lack the dynamic information that is needed to follow diseases and therapy [9]. Therefore, we hypothesised that by integrating tumour profiling data with dynamic information about signal transduction networks (STNs), mechanism-based machine learning models could aid in the prediction of patient survival and response to therapy, and overall provide insight into the disease and drug-response mechanisms and reveal potential drug targets and novel biomarkers.
STNs are extremely adjustable and dynamic [10]. To better understand these STNs in the context of CRC, knowledge about how active these STNs are and how this activity varies between patients and relates to patient outcomes is desired. To date, numerous CRC STNs have been identified, including TGF-β (transforming growth factor beta), PI3K/Akt (phosphatidylinositol 3-kinase/protein kinase B), TP53 (tumour protein P53), MAPK (microtubule-associated protein kinase), Apoptosis, Cell Cycle (cell-division cycle), mTOR (mammalian target of rapamycin), Notch, and WNT (Wingless-related integration site) [3,11]. Table 1 portrays these critical CRC STNs and their associated functions. This study analyses only five of these critical pathways, including TGF-β, PI3K/Akt, TP53, MAPK, and WNT, because PROGENy (pathway responsive genes for activity inference) is not available for Notch, Apoptosis, mTOR, and Cell Cycle.
STNs can be mapped to their most frequent mutations. Interestingly, APC (adenomatous polyposis coli) negatively regulates WNT activity since it is an integral part of the destruction complex, which targets ß-catenin for degradation. Mutations in APC thus lead to hyperactive WNT signalling [18]. Across all CRC STNs, the role of WNT signalling in carcinogenesis has most notably been described for CRC [24]. Roughly all CRCs present hyperactivation of the WNT pathway, which in many cases is believed to be the initiating and driving event [3,25,26]. Despite this, most mechanistic models of the canonical WNT signalling pathway (β-catenin-dependent) are based on solely the intracellular steps, neglecting the extracellular steps [27,28,29,30,31,32]. Classically, the term “canonical” for this pathway refers to the pathway components, which lead to the stabilisation of β-catenin in response to WNT ligands. Consequently, the analysis for this study was restricted to this specific WNT sub-pathway, i.e., canonical. In contrast to most studies, Kogan et al. developed a flexible framework for identifying potential drug targets in the WNT STN. This mechanistic model was based on the initial steps of the activation solely and analysed the effects of two extracellular inhibitors, DKK (Dickkopf) and sFRP (secreted frizzled-related protein) [27]. This validated mathematical model, which predicts effective combinational therapy by sFRP and DKK, is the most recent WNT STN model to date and, interestingly has never been validated in human cell lines. Overall, it is not instinctively apparent which components of the WNT STN are best to target for therapeutic intervention or how such interventions should be designed in order to achieve the best clinical outcomes [27]. However, it has emerged that in recent years, using patient-specific mathematical models can improve patient-stratification and help to identify potential drug targets and largely improve patient response to therapy [9,10,33]. Additionally, combining mechanism-based machine learning models of disease dynamics has been proven to enhance the development of novel disease interventions [34]. Concretely, mechanism-based machine learning models are firmly based upon the behaviour and critical features of mechanistic signal transduction networks of interest, whilst formed by classic linear regression. Adapting this, a schematic of the approach is shown in Figure 1.
In the present study, we developed adjustable linear regression machine learning models of the activation of the canonical WNT signalling pathway and incorporated genes and proteins that were significantly associated with event-free patient survival in CRC. The term “adjustable” in such models represents the capability to vary (include/remove) features with ease to determine which features are most important. The results revealed that the machine learning models can not only help to understand the behaviour of the initial steps of this complex network by identifying novel features not yet included in mechanistic models but also interpret its behaviour by relating pathway activity to clinical outcomes on the level of individual patients.

2. Results

2.1. Determining Significant Genes and Proteins in CRC: A Kaplan–Meier Survival Analysis

In line with the literature, five signalling pathways critical in CRC were selected to analyse, from several network databases, including WikiPathways, Gene Set Enrichment Analysis (GSEA), and KEGG [14,21,22,37,38]. These five signalling pathways comprise WNT, PI3K-Akt, TP53, MAPK, and TGF-Beta. As mentioned above, the motivation behind choosing these five pathways is due to the limited data available to perform a PROGENy analysis. The five STNs analysed are the only CRC STNs available on PROGENy. To determine which genes and proteins are significant in CRC, components of each pathway were used to integrate data from the listed resources. In total, 1156 features were analysed across all pathways. The correlation between patient event-free survival and the expression of proteins and genes from a Kaplan–Meier and log-rank test resulted in 464 significant features. In total, 389 genes and 75 proteins were found to be significant across the eight major CRC signalling pathways. A concrete list of all significant genes and proteins is available in the supplemental data. The associated hazard ratios and p-values of each significant feature are denoted below in Table 2 and Table 3. All significant genes were obtained from the transcriptomic TCGA (The Cancer Genome Atlas), Firehose legacy dataset, with a cohort of 329/636 patients. The 329/636 TCGA patients selected were solely from the transcriptomic, mRNA (messenger ribonucleic acid) expression dataset; all patients had the necessary clinical data available. Similarly, all significant proteins were obtained from the proteomics TCGA Firehose legacy dataset, a cohort of 73 patients [39,40]. The associated clinical information can be found in the supplemental data.

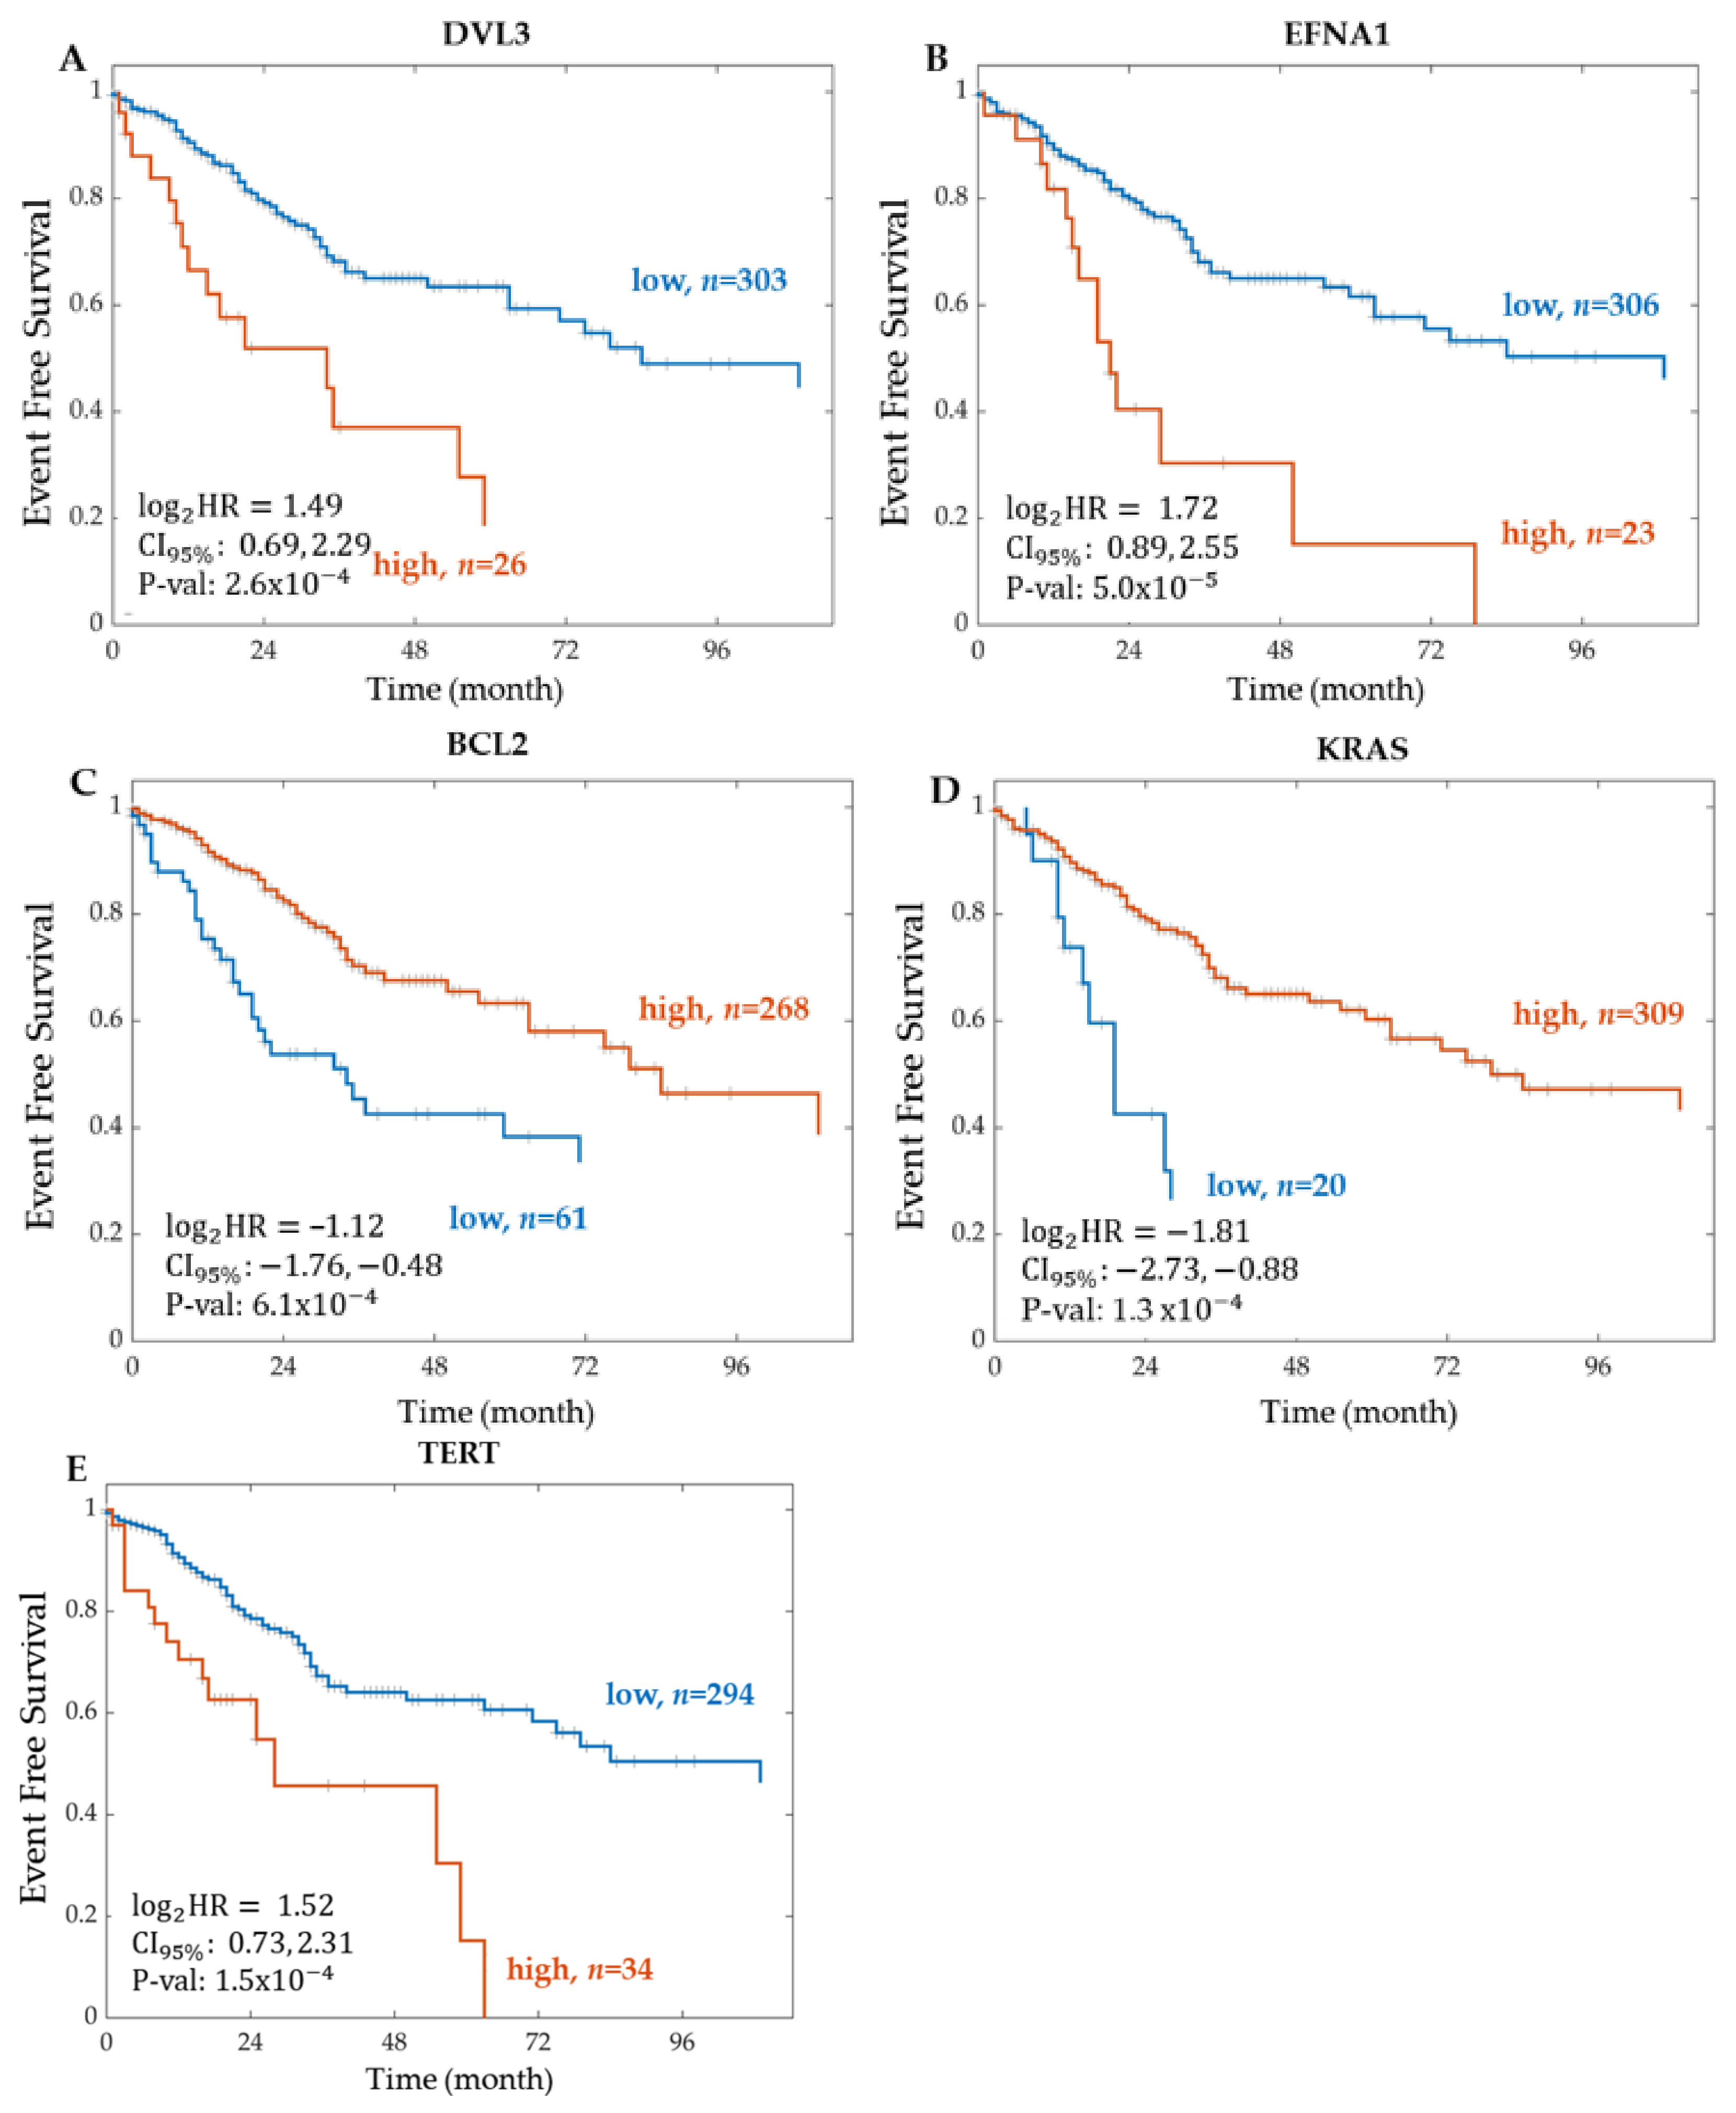
2.1.1. Significant Genes from RNA Sequencing

The total number of genes whose RNA expression correlated with event-free patient survival in this cohort was 389 of 872 genes across all CRC signalling pathways considered. For most pathways, including the WNT pathway, approximately half of the genes were significant using a fold change and p-value cut-off of 0.5 and 0.05, respectively.
Next, we wanted to obtain a more comprehensive picture of the significant genes within a pathway. Using the WNT pathway as an exemplar, the volcano plot in Figure 2 shows the p-values of the significant genes in the y-axis against their log 2 fold change on the x-axis. Genes above the dashed threshold line, to the right, DVL3 (dishevelled segment polarity protein 3), VANGL2 (vang-like protein 2), CER1 (cerberus 1), and TCF7L1 (transcription factor 7-like 1), etc., are found to be significant, with the lowest p-values and greatest positive hazard-ratio fold-changes. These genes were associated with increased risk. Conversely, genes to the left above the threshold line, including MAPK8, have a negative hazard-ratio fold change and were thus associated with decreased risk. Overall, 15 genes were found to be significant negative markers, and the remaining 39 genes were significant positive markers determined for the WNT signalling pathway.
Plotting the event-free survival Kaplan–Meier curve for DVL3, the most significant gene in the WNT signalling pathway, resulted in a log 2 hazard ratio of 1.49 and a 95% confidence interval between 0.69 and 2.29 (Figure 3). Kaplan–Meier scanning to determine the optimal cut-off divided the patients into high (n = 26) and low (n = 303) groups by scanning the group size from 10–90 to 90–10 percent splits, where 10–90 means that 10% of the patients were in the low group and 90% of the patients in the high group and calculating the p-value for the overall event-free survival difference between the groups using a log-rank test with Yates’ correction. A high expression of DVL3 resulted in poor patient survival, where a 2-year event-free survival equals 38% in the high group (n = 26). The Kaplan–Meier curves for the most significant gene found for each CRC STN is shown in Figure 3.

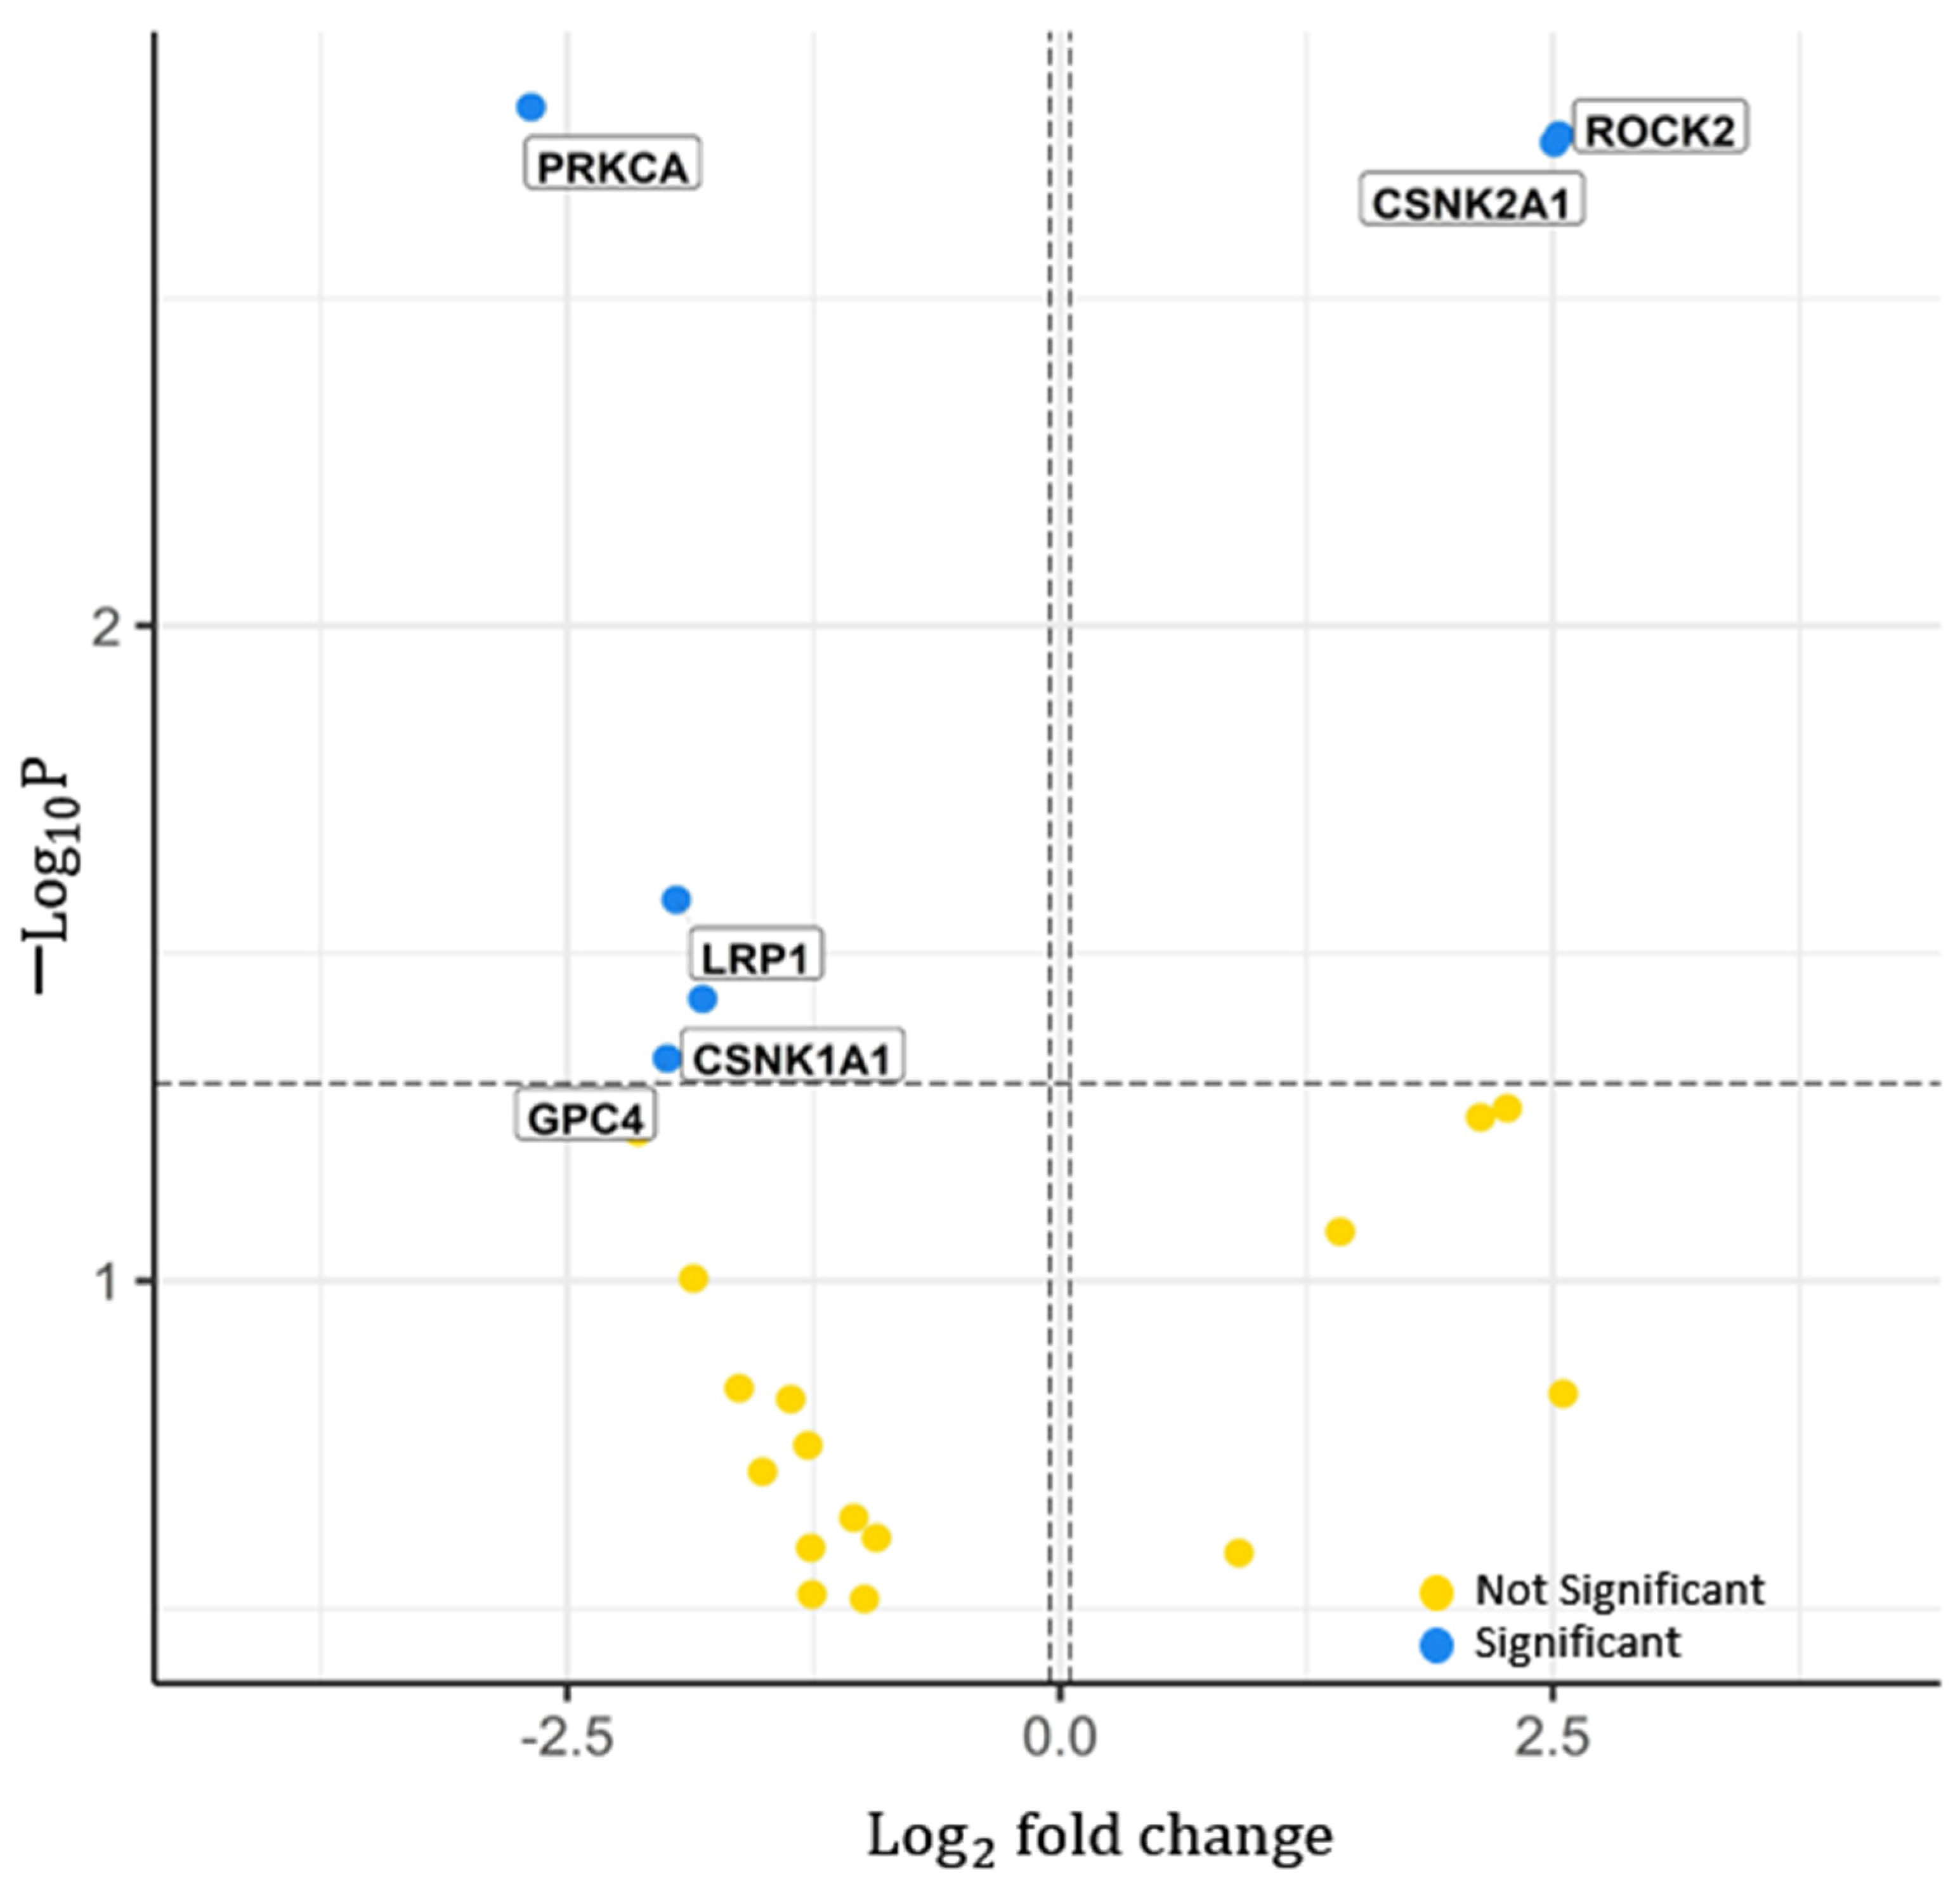
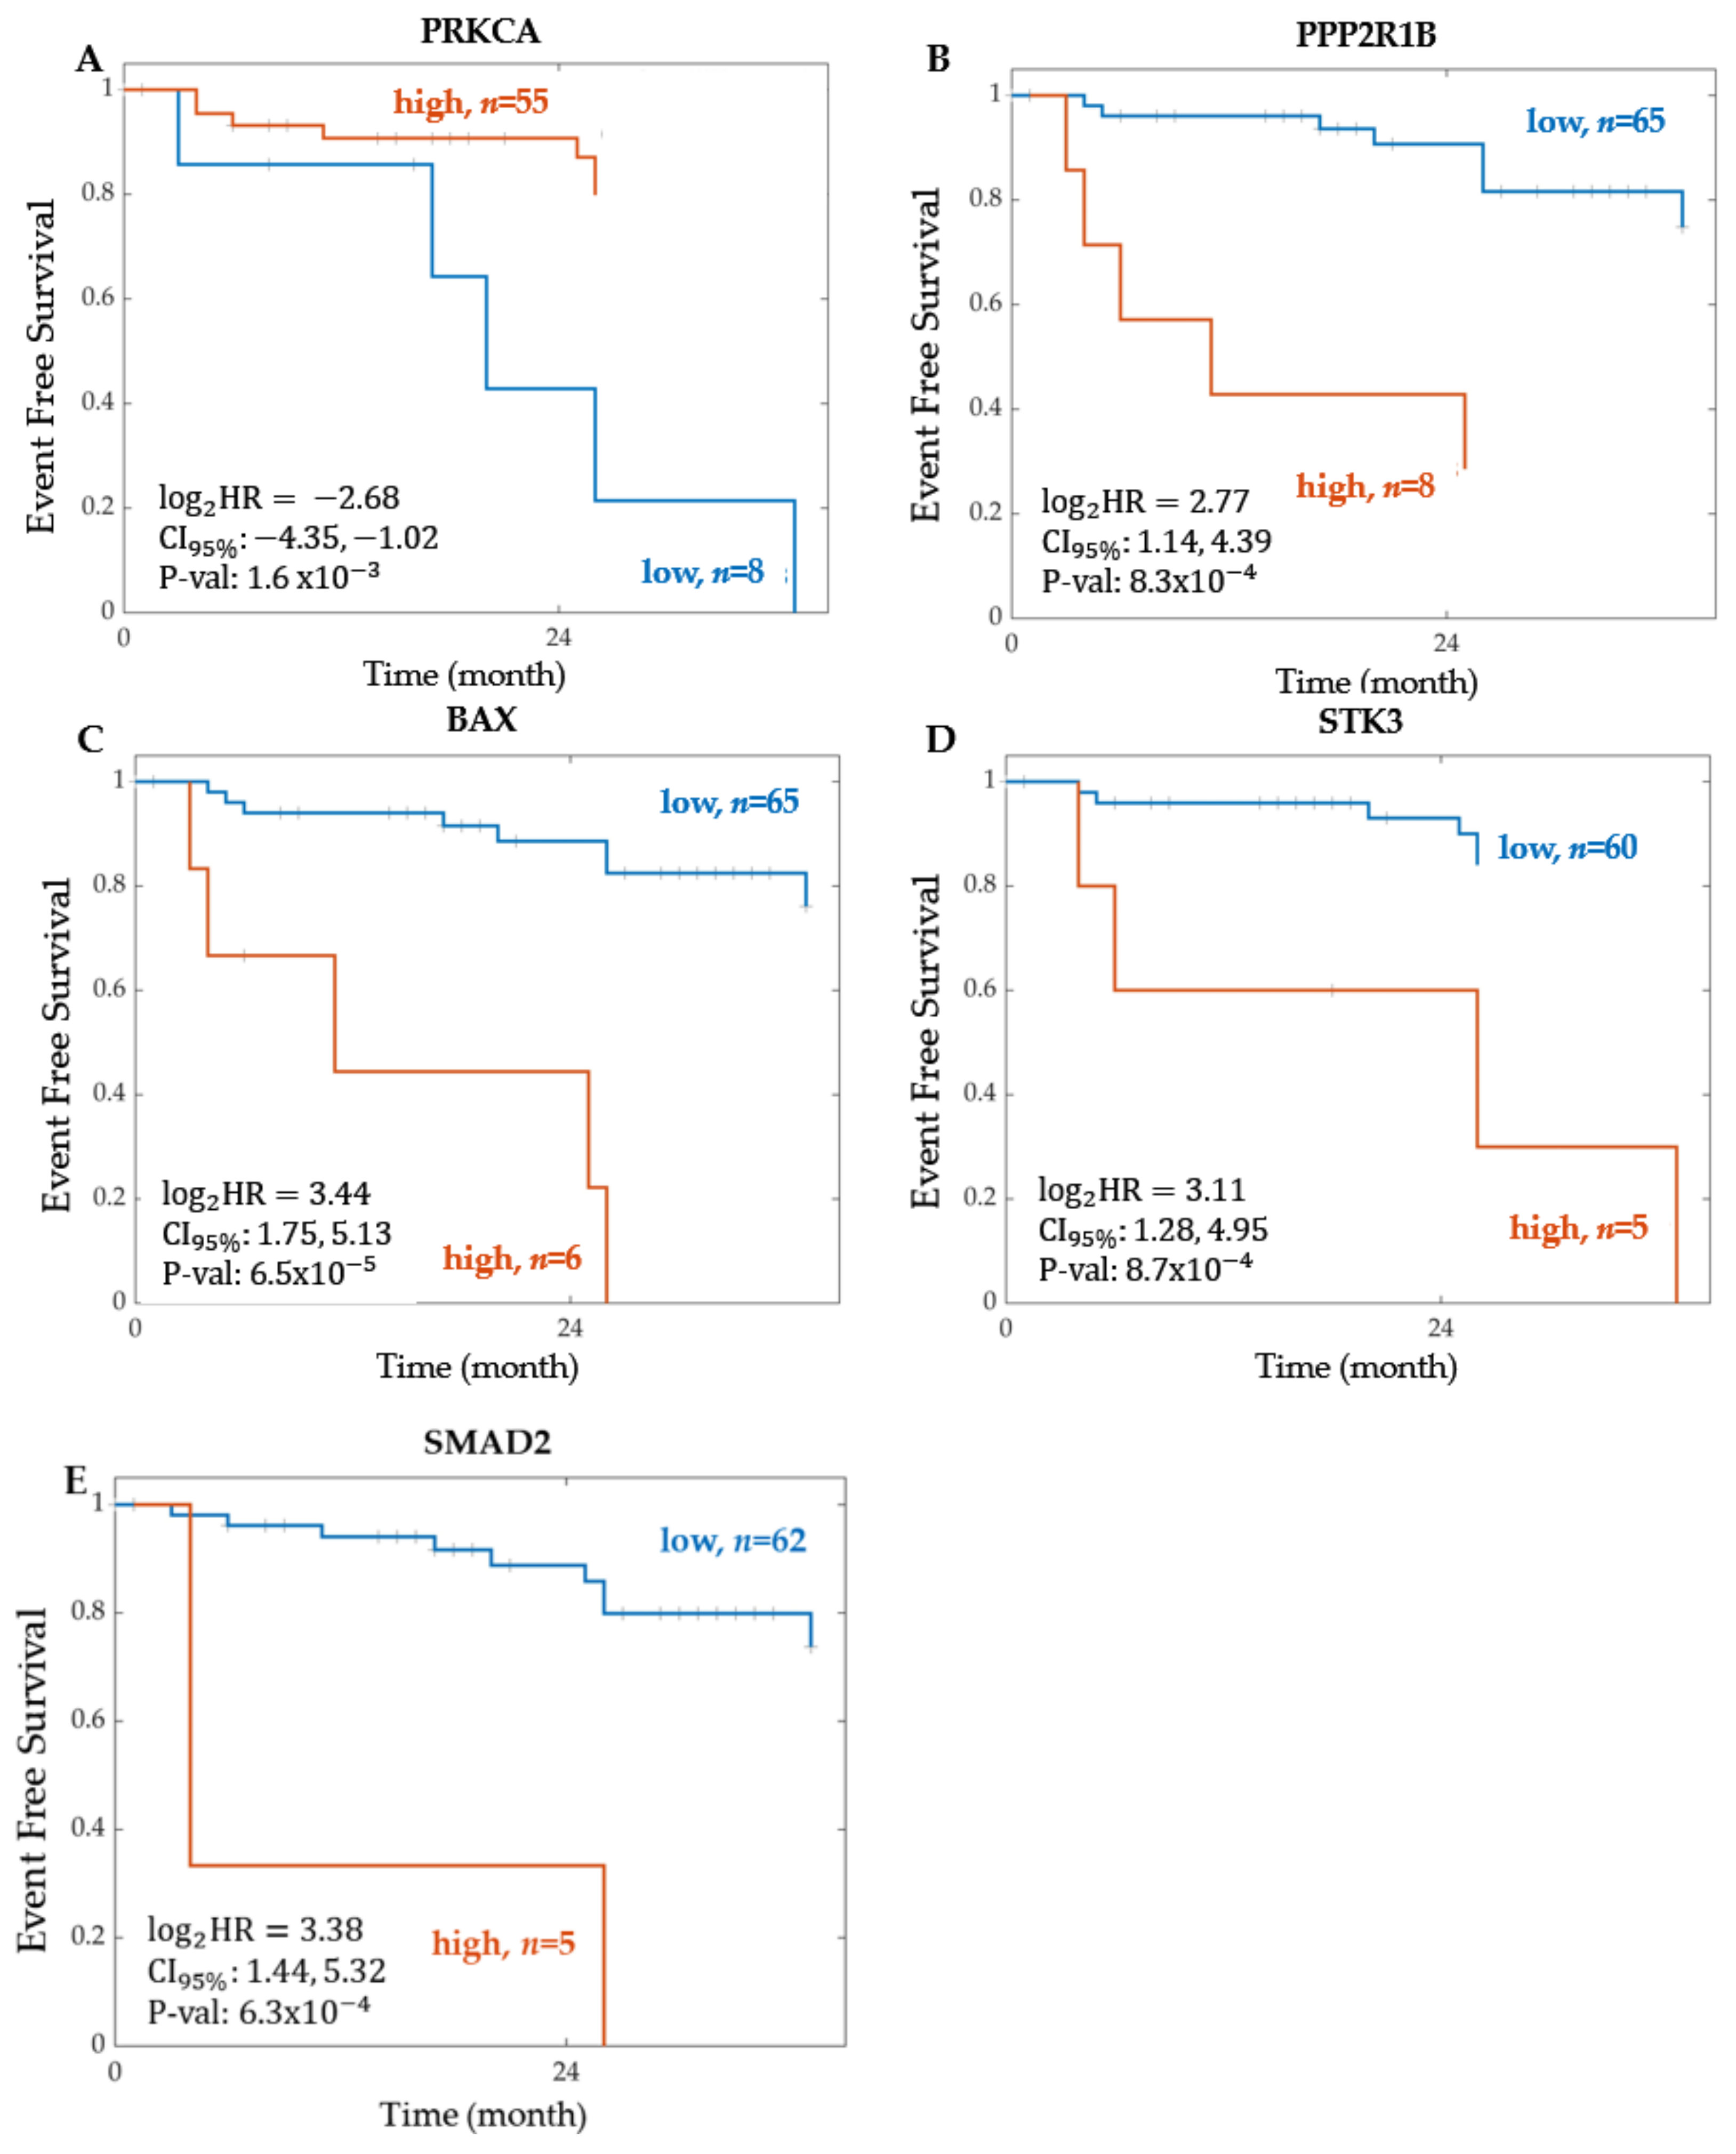
2.1.2. Significant Proteins from Proteomics

Across all of the CRC signalling pathways considered, 75 of 284 proteins exhibited expressions that correlated with event-free patient survival. For each pathway, about 4–10% of the pathway proteins exhibited an association with event-free survival. The top two significant proteins across each CRC signalling pathway are shown in Table 3. PRKCA (protein kinase c alpha) and ROCK2 (rho associated coiled-coil containing protein kinase 2) were found to be the most correlated to the patient’s survival in the WNT signalling pathway. PRKCA was found to be the most significant protein with an associated hazard ratio of 0.1557 and a p-value of 1.61 × 10 3 . The signalling pathway PI3K-Akt has the greatest number of significant proteins associated, 29 proteins in total.
Six significant proteins within the WNT signalling pathway were found from the proteomics dataset, including PRKCA, ROCK2, CSNK2A1 (casein kinase 2 alpha 1), LRP1 (low-density lipoprotein receptor-related protein 1), CSNK1A1 (casein kinase 1 alpha 1), and GPC4 (glypican 4). This is represented by the volcano plot in Figure 4. In total, 92 proteins in this pathway could not be analysed because of missing values. Significant proteins, ROCK2 and CSNK2A1, have a positive hazard ratio with a log 2 fold change above 1.5. All other significant proteins have a low-risk association with hazard ratios below −1.5. In summary, six proteins were found to be significant, two with an increased risk and four with decreased risk.
Plotting the event-free survival Kaplan–Meier curve for PRKCA, the most significant protein in the WNT signalling pathway, resulted in a log 2 hazard ratio of −2.68, a confidence interval between −4.35 and −1.02, and a p-value of 1.61 × 10 3 . From Kaplan–Meier scanning, 55 patients were in the high expression group, and 8 were in the low expression group. High expression of PRKCA resulted in improved patient survival, with 2-year event-free survival of about 90% in the high group (n = 55). The Kaplan–Meier curves for the most significant proteins found for each CRC STN are shown in Figure 5.

2.1.3. Summary of the Event-Free Survival Analysis Results

Across five critical CRC signalling pathways, the results from the WNT signalling pathway introduced several significant genes and proteins that have not yet been accounted for in current WNT mechanistic models. Therefore, the results of this section reinforce the need to propose a strategy to incorporate them into current WNT mechanistic models. To summarise, Table 4 is composed of all 53 significant genes and 6 significant proteins found in the WNT signalling pathway. These results were from the TCGA Legacy, the transcriptomic dataset of 329 CRC patients, and the proteomic from mass spectroscopy dataset of 73 patients. Interestingly, some significant genes (DVL3, DKK1, SFPR2, WNT3A, WNT3, SFPR1, and GSK3B) are found in published mechanistic models of the WNT pathway [27,28,29,30,31,32]. The remaining 52 significant features found in this study are not found in these mechanistic models. Thus, we have identified many genes that were associated with event-free survival and that constitute prime candidates to improve current WNT mechanistic models. These improved models could then be used for patient stratification and predicting response to therapy [9,33].

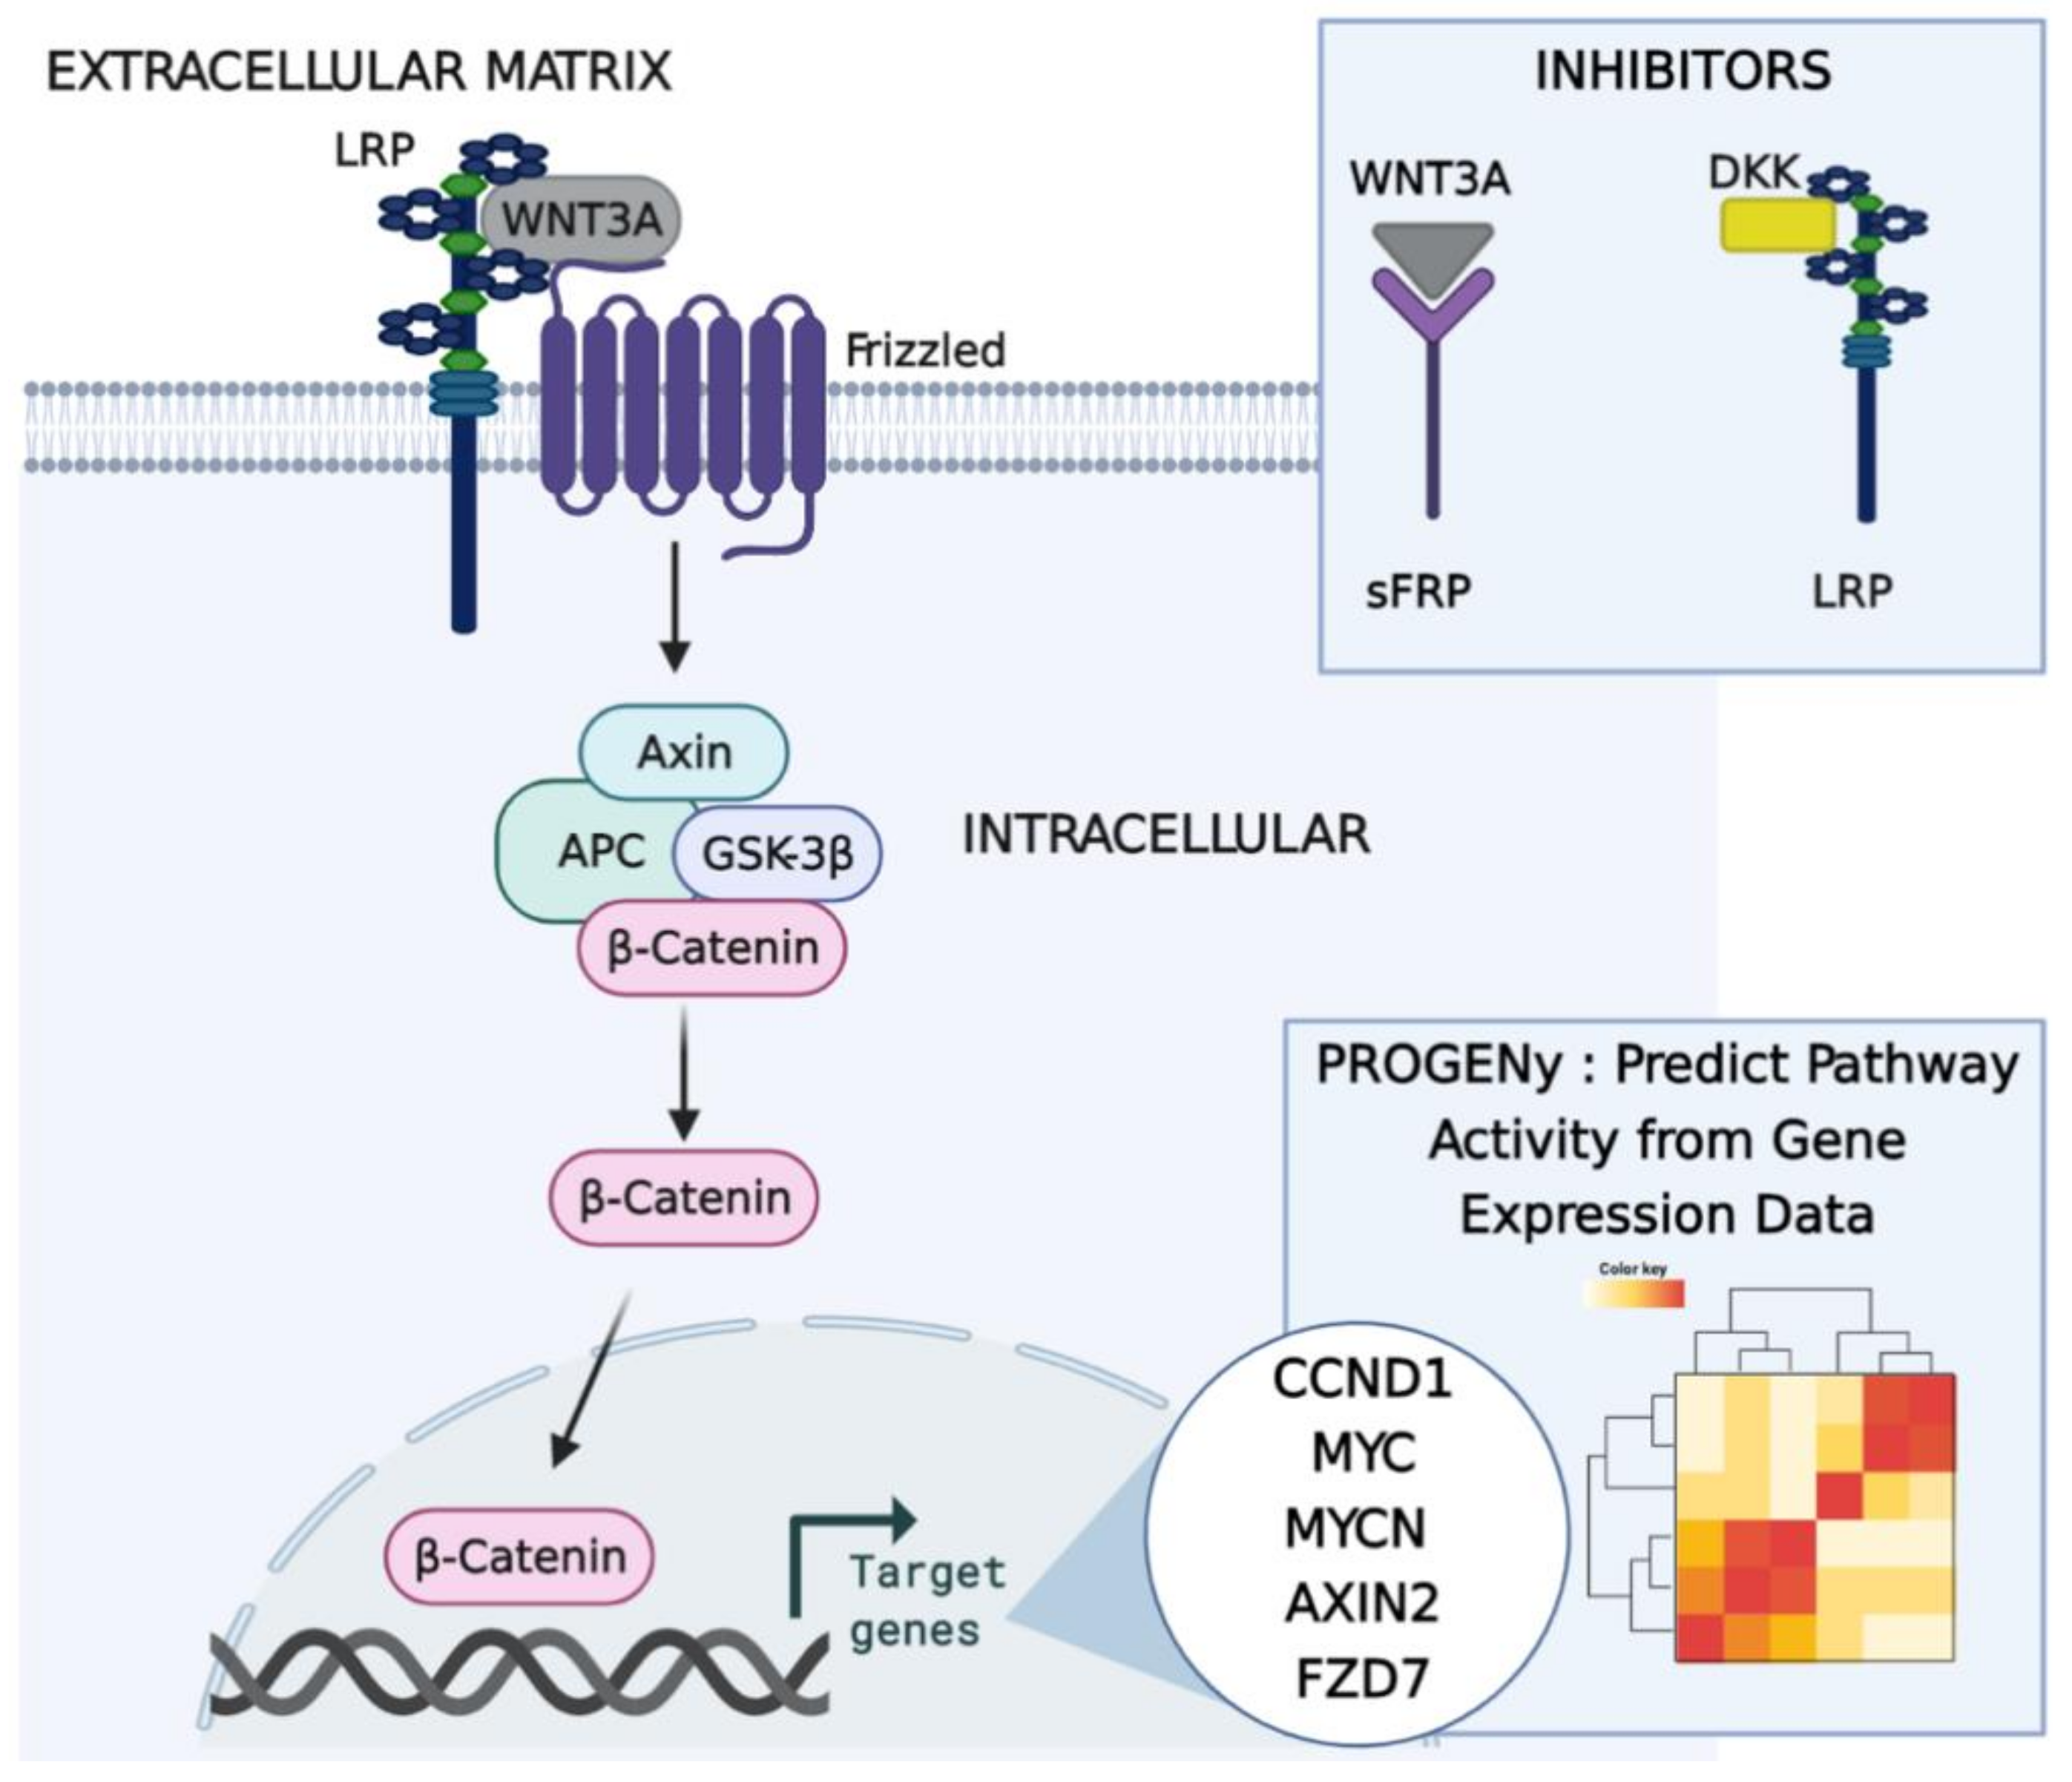
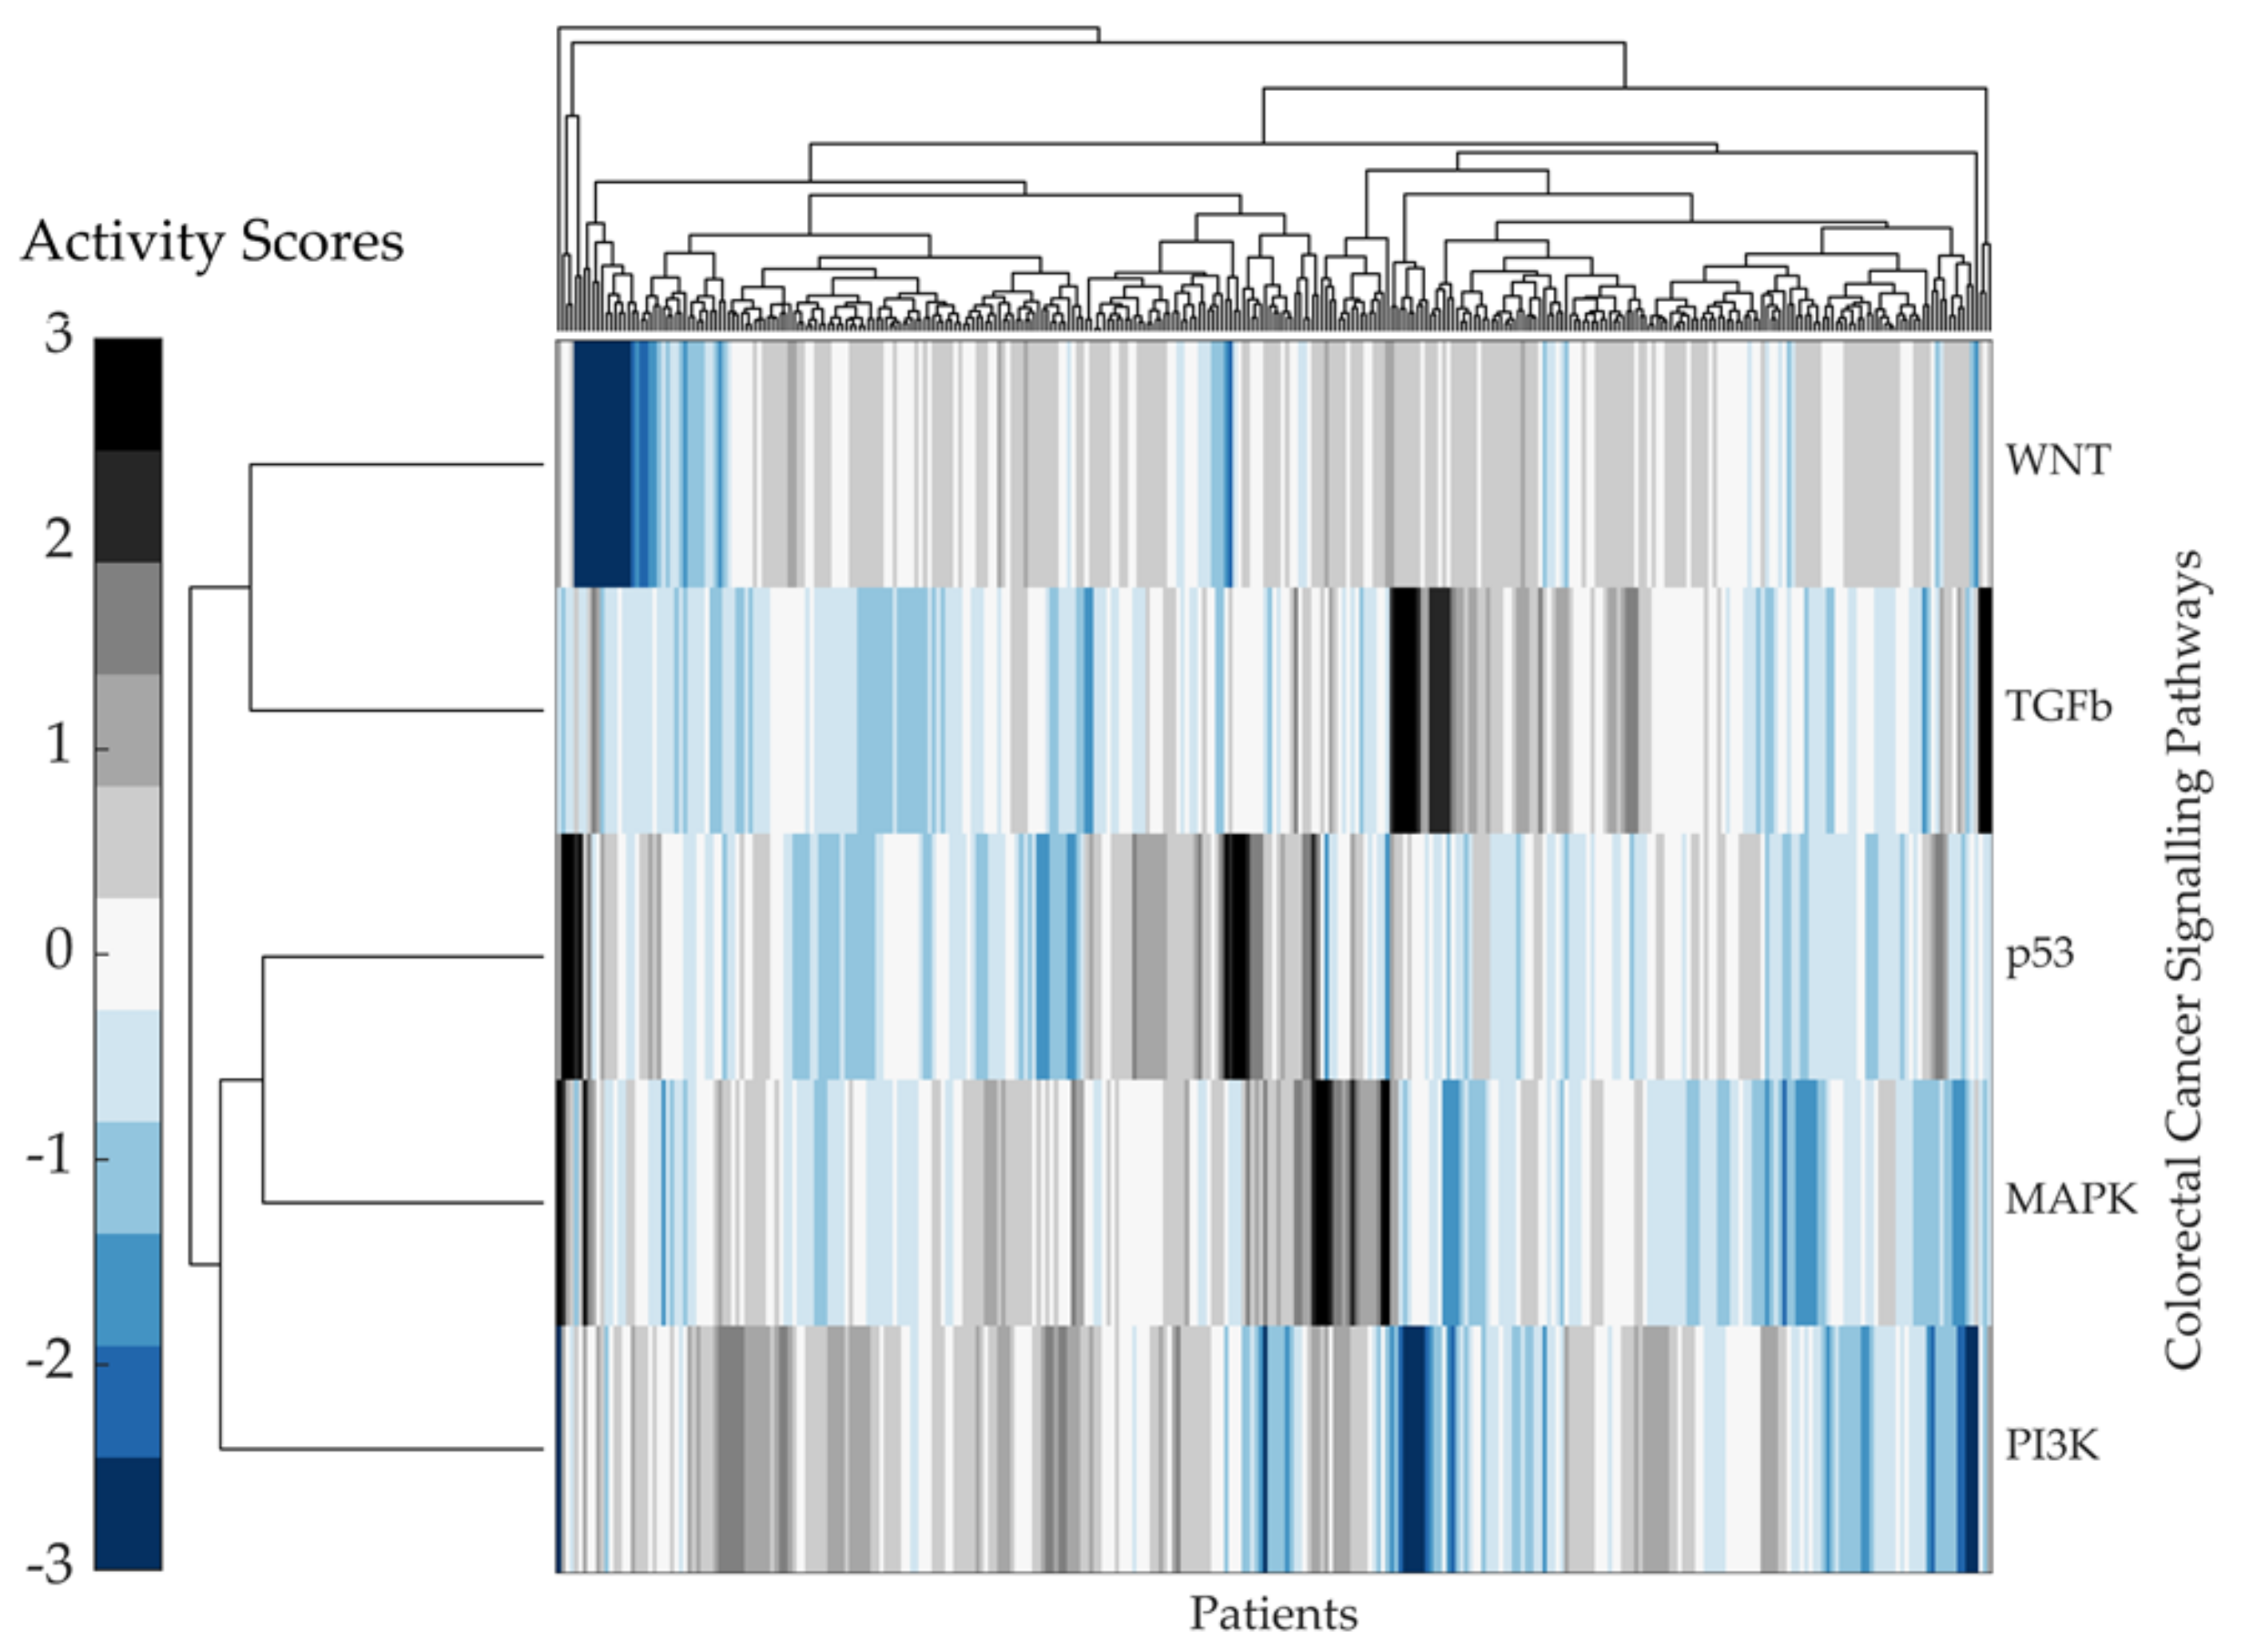
2.2. Predicting Pathway Responsive Genes for Activity Interference from Gene Expression: A PROGENy Analysis

Having identified the significant genes and proteins within the pathways, we now sought to obtain activity scores for each pathway. The purpose was two-fold. Firstly, to identify pathway activities that correlate with event-free patient survival; and secondly, to relate the genes and proteins expression of a pathway to its activity score. The RStudio package function PROGENy was used to obtain pathway scores from the RNA sequencing data of the TCGA legacy dataset. Albeit PROGENy’s composition of 14-cancer relevant pathways, specifically for this study, only the CRC pathways were analysed in depth. The only available CRC pathways in PROGENy were PI3K, MAPK, TGF-Beta, WNT, and p53.
The PROGENy activity scores for each CRC signalling pathway are shown in Figure 6. Although the TGF-Beta and PI3K appear to have an inverse relationship, most pathways exhibit a cluster of high activity scores in a small subset of patients. However, specific activity patterns are difficult to discern.

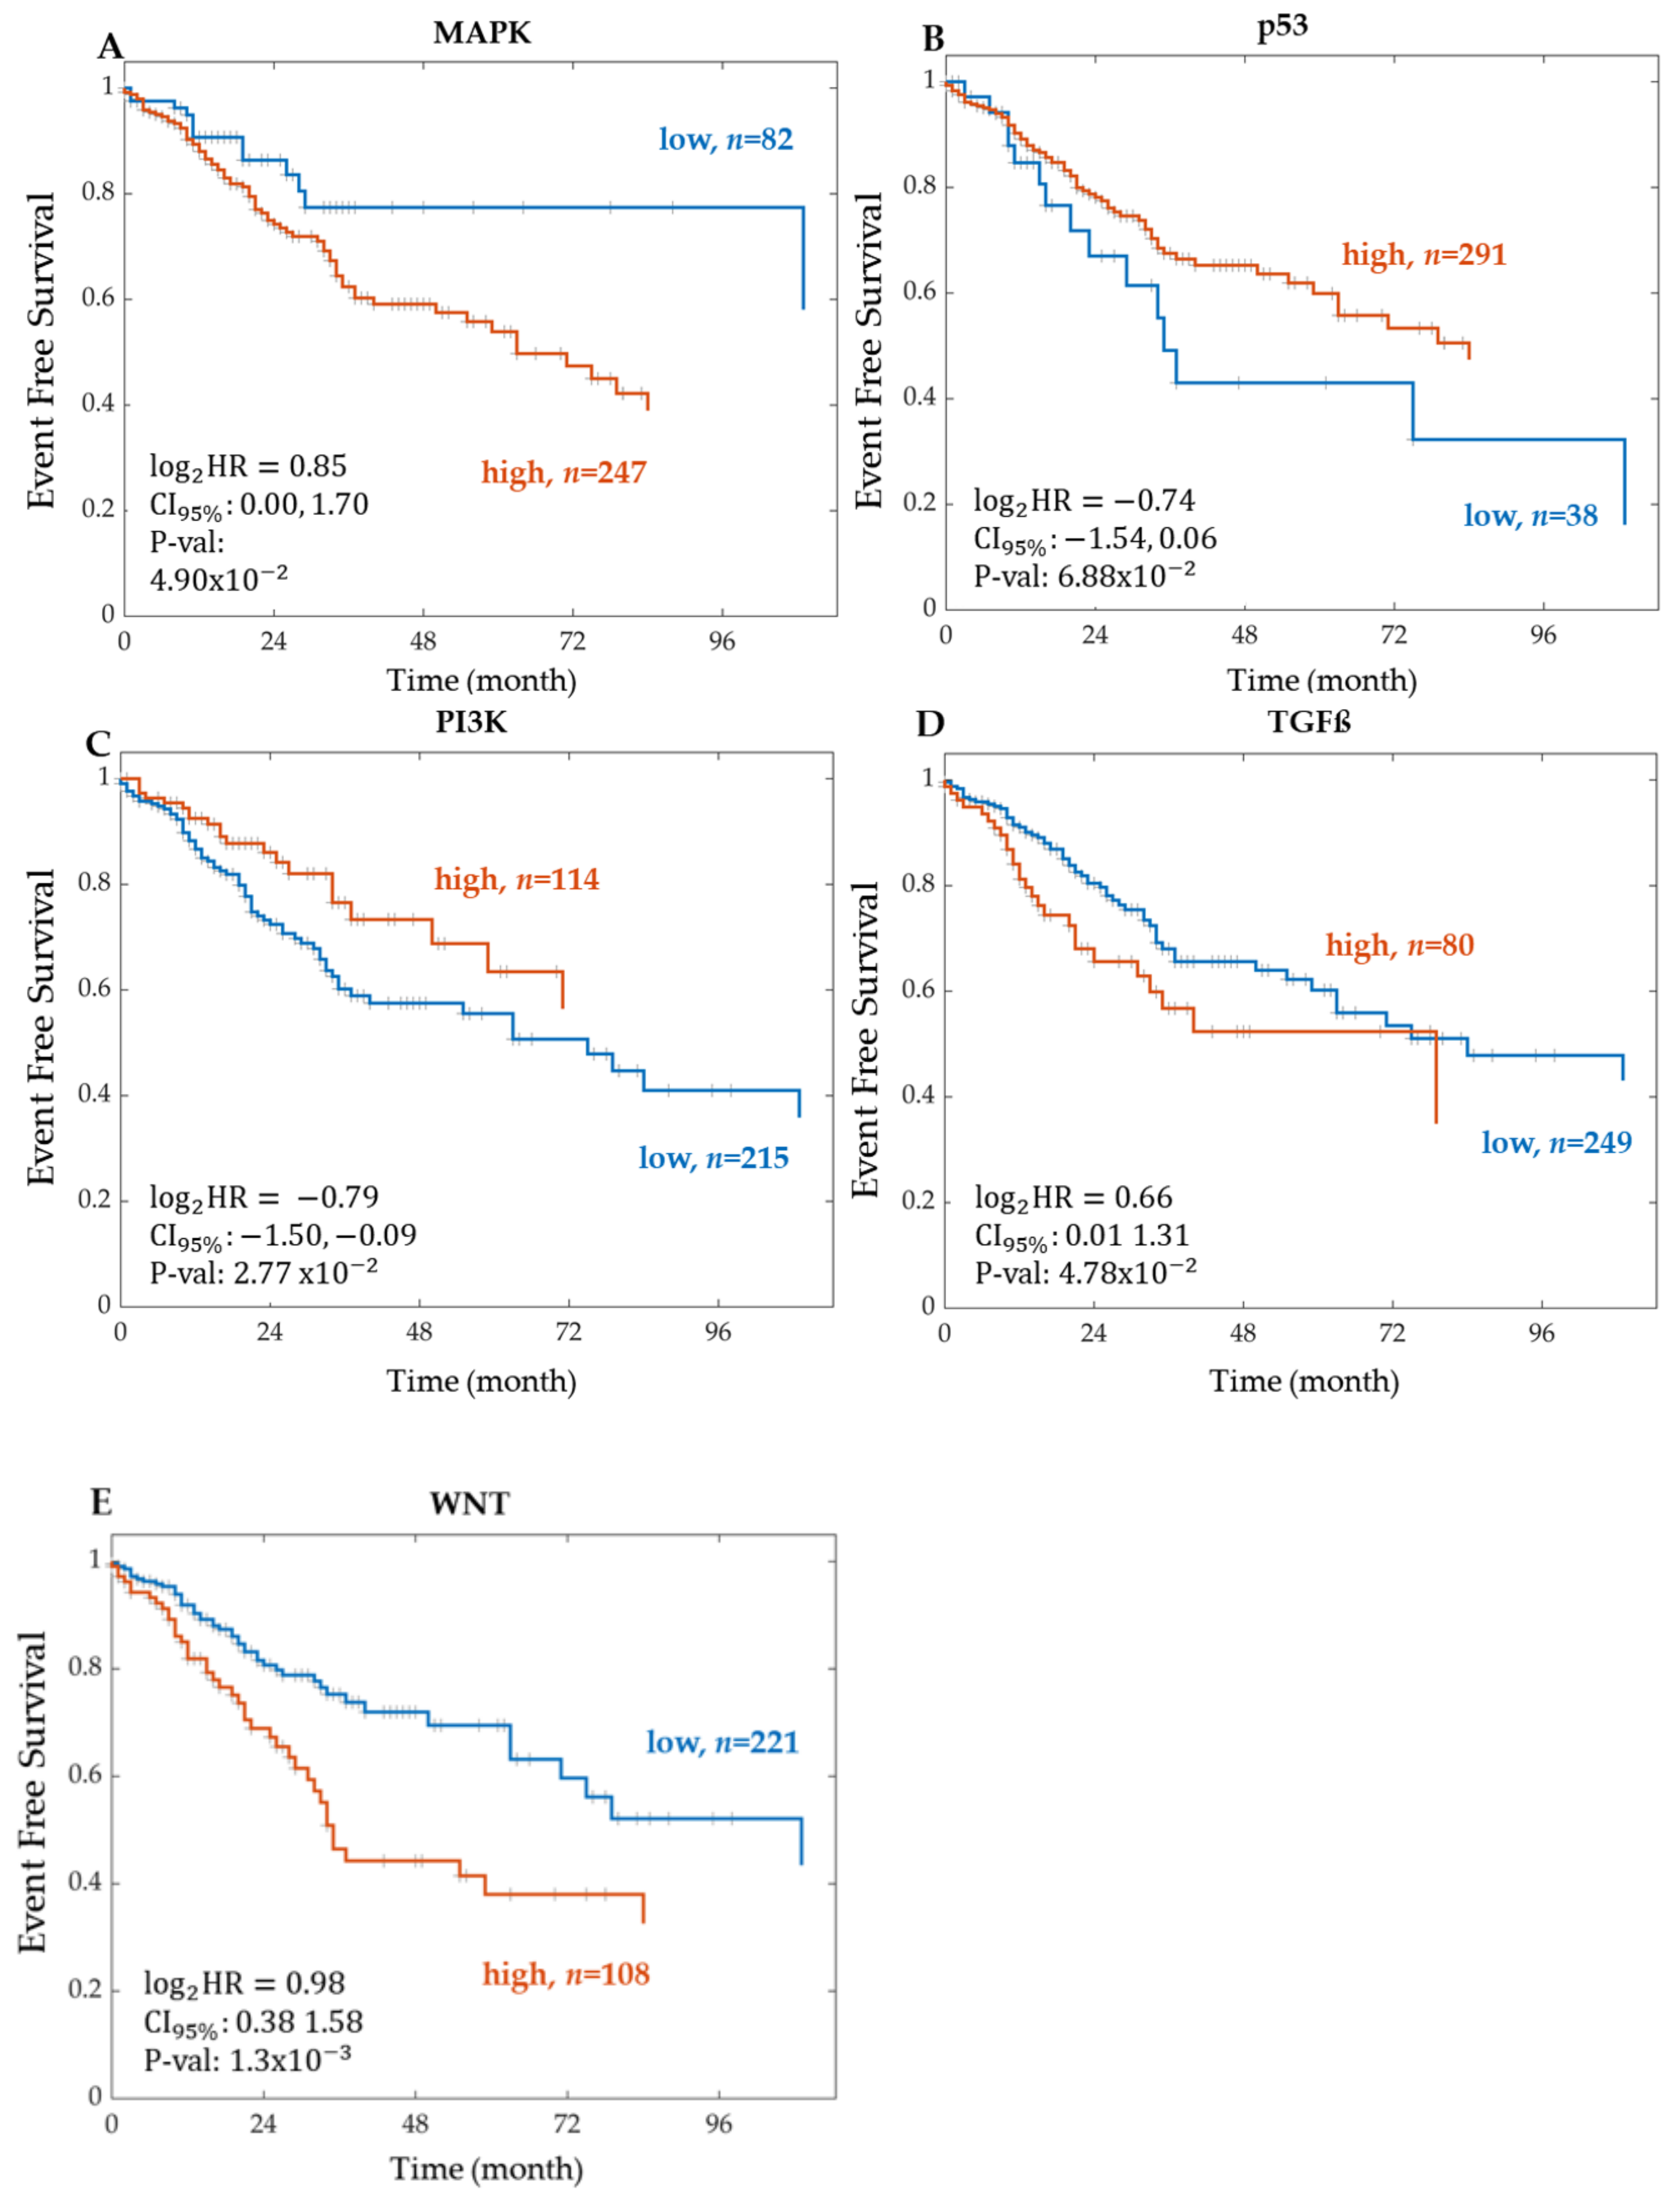
Kaplan–Meier Survival Analysis on PROGENy Activity Scores

To investigate the correlation between the PROGENy pathway activity scores and patient event-free survival, a Kaplan–Meier analysis and log-rank test were used. The activities of the WNT, PI3K, TGF-Beta, and MAPK pathways were all significantly correlated with event-free survival (Table 5). In particular, we found that activity of the WNT STN exhibited the strongest association with event-free patient survival (hazard ratio and p-value of 1.9731 and 0.0013, respectively).
The event-free survival Kaplan–Meier curves for the CRC STNs MAPK, TGF-Beta, PI3K, p53, and WNT, associated with patient survival through PROGENy activity scores, are shown in Figure 7. The STNs MAPK, TGF-Beta, and WNT followed a similar trend, where a high pathway activation was associated with shorter event-free survival. From the literature, this is expected considering that both pathways, MAPK and WNT, drive cell proliferation. Activation of the WNT pathway in CRC increases the levels of β-catenin within the cytosol, causing it to further travel into the nucleus and express WNT target genes, including genes that control the cell cycle [41]. For the WNT signalling pathway, the log 2 hazard ratio was 0.98 with a 95% confidence interval between 0.38 and 1.58 and a p-value of 1.3 × 10 3 . The high group characterised by high WNT activity consisted of 108 patients and the low group of 221 patients. Similarly, the results for TGF-Beta are in line with its immunosuppressive function. Conversely, for the other STNs, p53 and PI3K, a high pathway activity was associated with longer event-free survival. The p53 result is in line with its known functions as a tumour-suppressor. The PI3K result is counterintuitive considering that the PI3K/AKT pathway is a classical survival signalling pathway but might be a confounding factor explained by “side-effect” activation due to crosstalk.

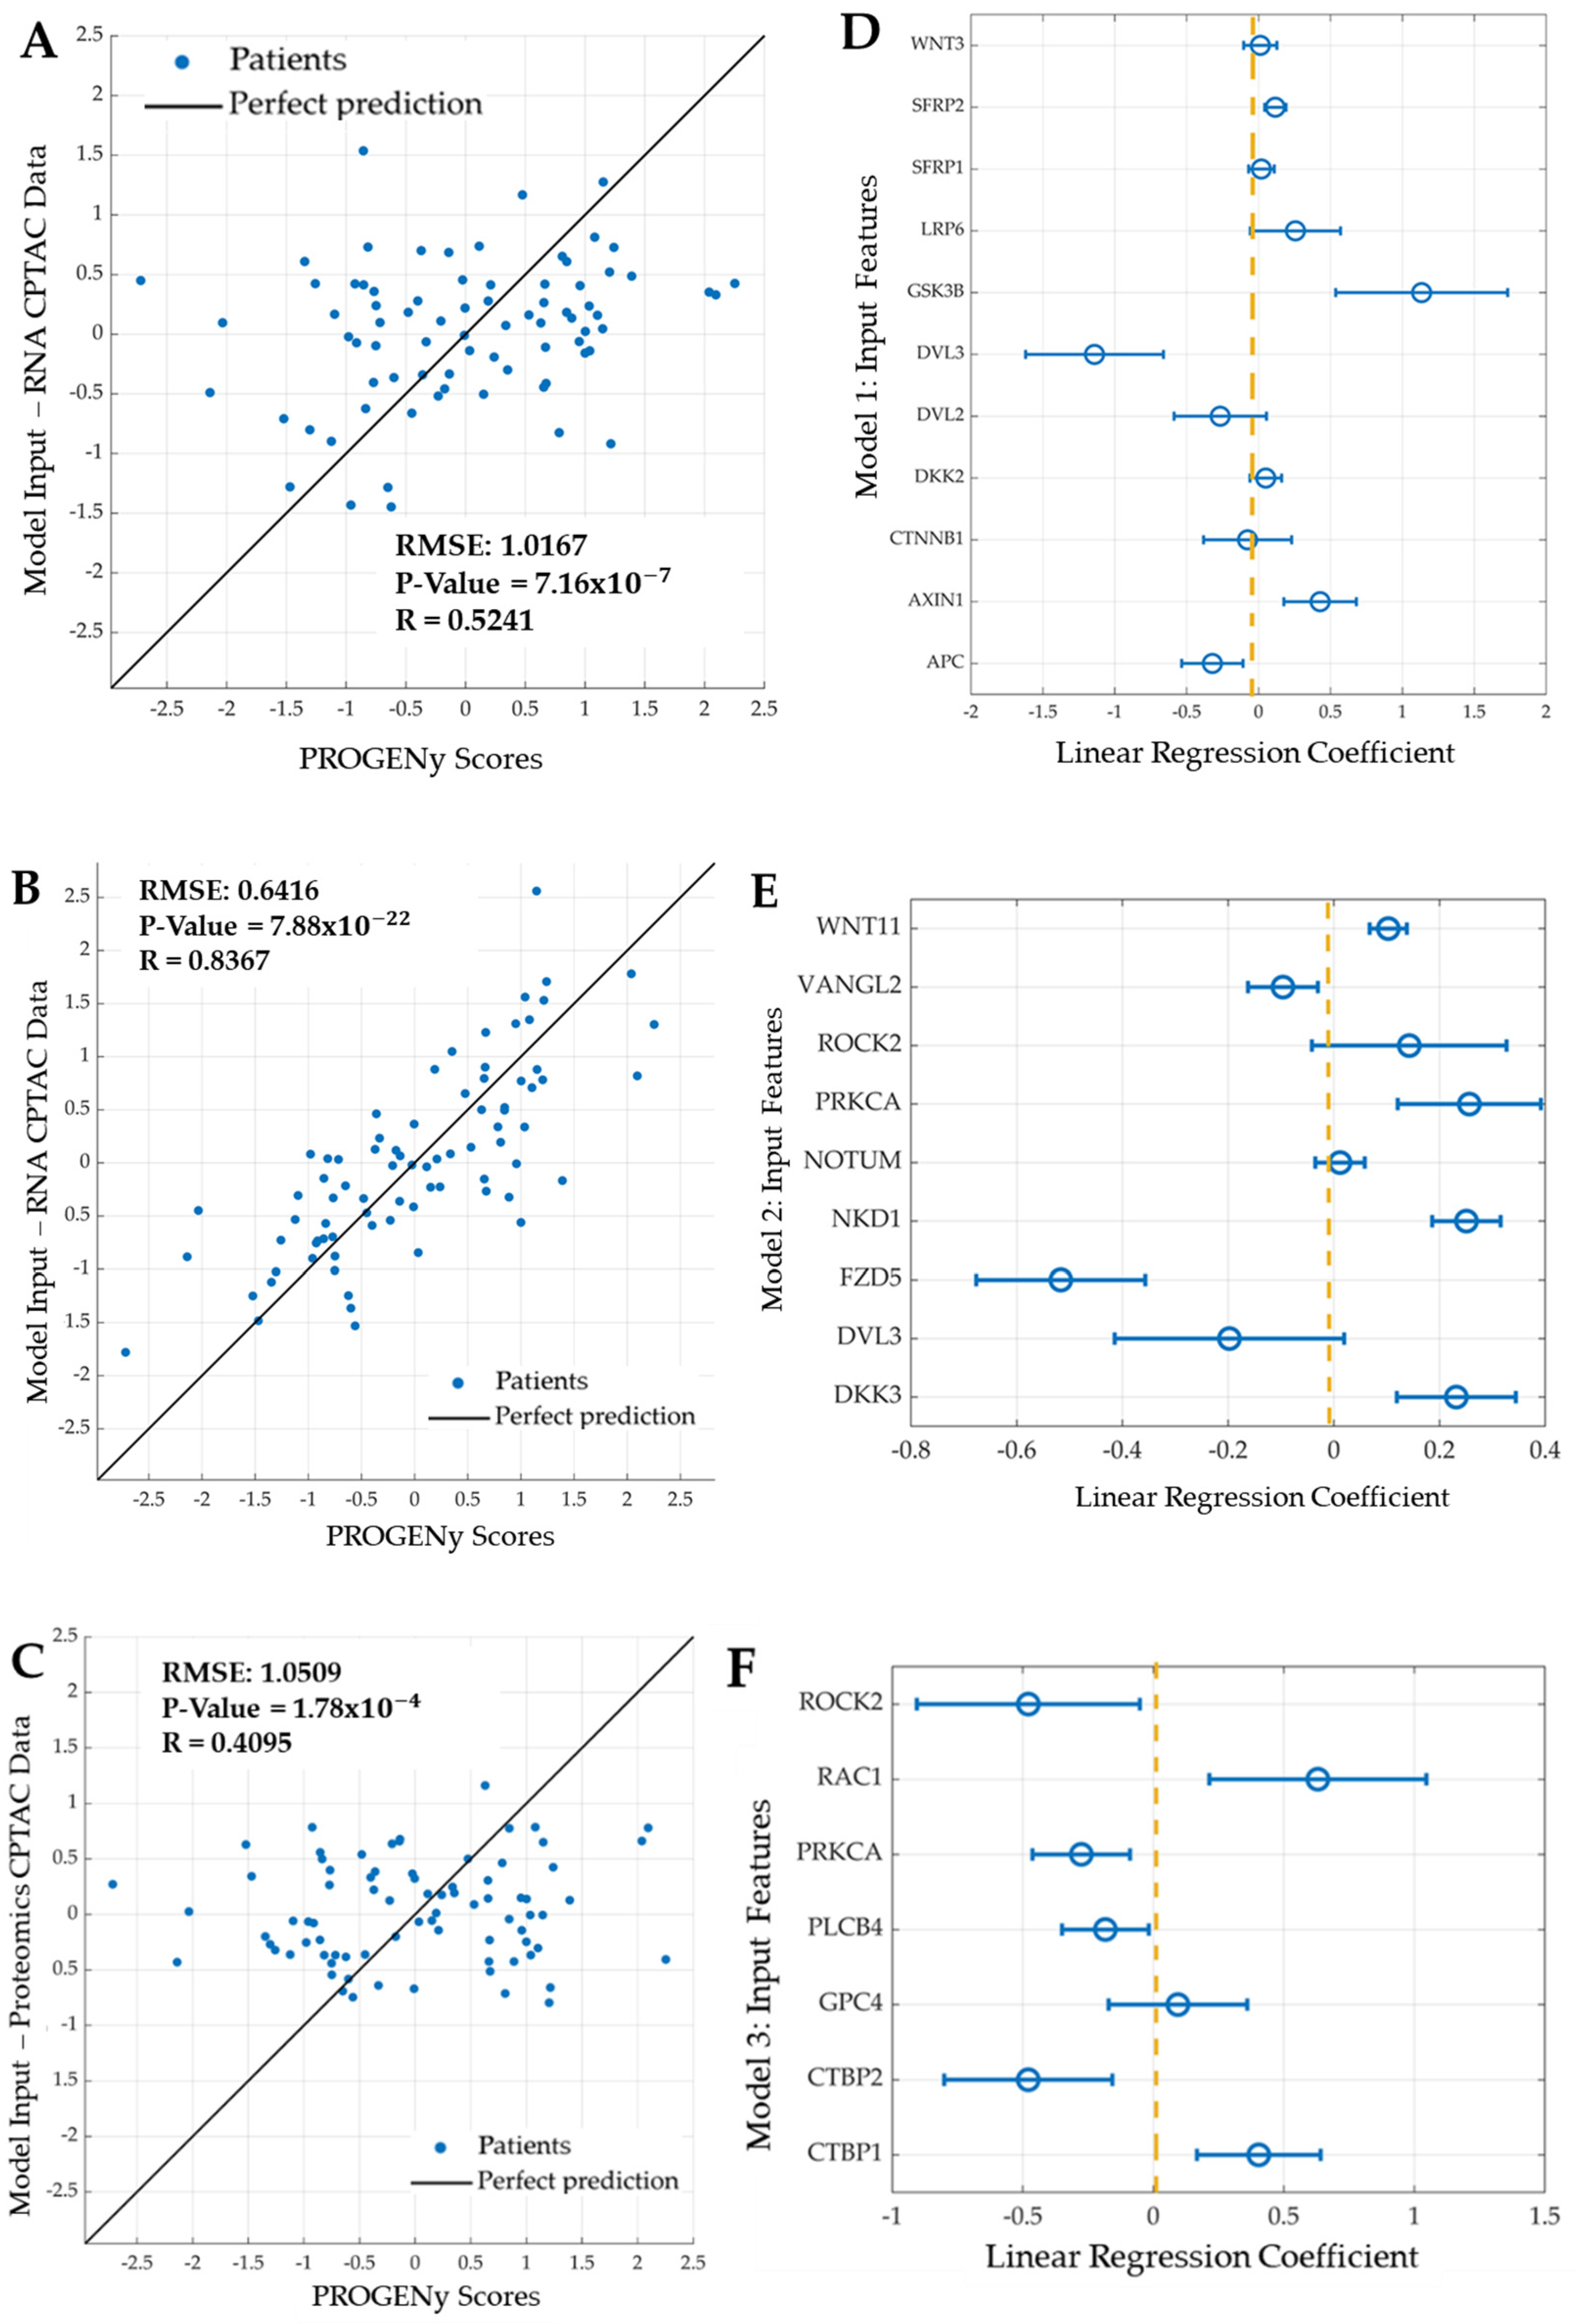
2.3. Developing Linear Regression Machine Learning Models

Having ascertained the significant genes, proteins, and pathways, we next sought to determine how well the expression of genes and proteins of a pathway can predict its activity scores. The results should give valuable insight into which candidate genes and proteins should be prioritised in follow-up studies focusing on constructing patient-specific mechanistic models with significant value. The WNT STN was the most significant pathway (Table 5, Figure 7); thus, we focused solely on it. Because there was a limited overlap between the mRNA and proteomics data in the TCGA legacy dataset (only five patients had data for both), we focused the analysis on the CPTAC (Clinical Proteomic Tumor Analysis Consortium) dataset. Both mRNA and proteomics data were available for the entire CPTAC cohort of 79 patients.
In total, three machine learning models were developed to predict the PROGENY pathway scores using different features as inputs. The features were the genes and proteins of the WNT pathway and their associated gene or protein expression values. To minimise the risk of overfitting, 10-fold cross-validation was used to build each model. The predictive power of each model was judged based on the root mean squared error (RMSE), the correlation coefficient (R), and the p-value. A p-value less than 0.05 was taken as significant for this field of study. The RMSE is an appropriate measure of predictive power for this study because model complexity was not an issue, and RMSE measures the differences between predicted and actual PROGENy values. There is no absolute threshold; however, lower values indicate a better overall fit of how accurately the model predicts the response. An acceptable range for the RSME values is difficult to define, but Model 1, consisting of the genes of the current mechanistic model, can act as a baseline benchmark. Notably, the predicted values of Model 2 show a much better correlation with the true values and a lower RMSE value compared to Model 1. (Figure 8B); thus, demonstrating a much better fit. We focus our analysis on three models:
  • Model 1: Features are eleven genes taken from the most recent WNT mechanistic model developed by Kogan et al.: APC, AXIN1, CTNNB1, DKK2, DVL3, GSK3B, LRP6, SFRP1, SFRP2, and WNT3.
  • Model 2: Features are the mRNA expression of nine genes: seven features selected using LASSO and the two most significant genes (DVL3, VANGL2): DKK3, FZD5, NKD1, NOTUM (notum, palmitoleoyl-protein carboxylesterase), WNT11, PRKCA, and ROCK2.
  • Model 3: Features are the protein expression of seven proteins; five identified using LASSO and the two most significant proteins (PRKCA, ROCK2): CTBP1 (c-terminal binding protein 1), CTBP2 (c-terminal binding protein 2), GPC4, PLCB4 (phospholipase c beta 4), and RAC1 (ras-related C3 botulinum toxin substrate 1).
Model 1 was developed based on the mechanistic WNT signalling pathway. The selected features were the eleven genes of the mechanistic models in the literature [27,28,29,30,31,32], using the mRNA expression data from the CPTAC dataset (Table 6). The gene DKK1 is typically found in the mechanistic WNT pathway; however, it was not available in the RNA CPTAC dataset; therefore, its paralogue, DKK2, replaced it [42]. Models 2 and 3 were developed using systematic feature selection based on the entire set of 119 WNT pathway genes. LASSO regression was used to identify the features based on the mRNA expression data (Model 2) or protein expression data (Model 3). To complete the model, the two most significant genes (Model 2) or proteins (Model 3) were also included as features. LASSO regression on the mRNA data of the 119 WNT network genes selected seven genes as features. Thus, Model 2 consisted of nine features: seven identified by LASSO plus the two most significant genes. LASSO regression on the protein data of the 27 proteins of the WNT network for which data were available selected five proteins as features. Thus, Model 3 consisted of seven features: five identified by LASSO plus the two most significant proteins.
How well can the mechanism-based, mRNA-based, and protein-based models predict the pathway scores? Model 1, based on the genes of the mechanistic models, serves as a benchmark and achieved a reasonable predictive power with a Spearman correlation coefficient of 0.5241, a p-value of 7.12 × 10 7 , and an RMSE of 1.0167. Model 2, based on LASSO identified genes from the canonical WNT pathway, resulting in a greater predictive power, compared to Model 1, with a Spearman correlation coefficient of 0.8367, a p-value of 7.88 × 10 22 , and an RMSE of 0.6416. Despite the smaller number of input features for Model 2, compared to Model 1, Model 2 evidentially has greater predictive power, shown by the higher p-value, correlation coefficient, and lower RMSE. Similarly to Model 2, Model 3 used LASSO to identify proteins from the canonical WNT pathway. In total, data for only 27 proteins were available due to missing data and imputation (see materials and methods). Model 3 is the least predictive model. The associated Spearman correlation coefficient, RMSE, and p-value were 0.4095, 1.0509, and 1.78 × 10 4 , respectively. Most features used in these machine learning models have nonzero regression coefficients (Figure 8D–F).

2.4. Summary

By incorporating the results from the event-free survival analysis, the PROGENy analysis, and the development of the linear regression machine learning models together, it is apparent that each finding paves the way to a valuable tool for predicting the heterogeneity of the WNT STN activity on an individual patient level. Concretely, each finding from each analysis builds sequentially upon another. The event-free survival analysis brings forth critical and novel features for the WNT pathway that have not yet been accounted for mechanistically. Interesting, from the PROGENy analysis, we found that the WNT signalling pathway was the most significant pathway associated with event-free patient survival. This finding solidifies the idea that there is a relationship between this pathway and patient survival that should be continued to be researched mechanistically. Finally, the motivation for using linear regression machine learning was particularly because it is an appropriate tool to predict WNT pathway activity from specified features (i.e., prognostic genes and proteins) on an induvial patient level. Precisely, the machine learning models additionally identified several features that were not only significantly associated with event-free patient survival, but also important for predicting the patient-specific WNT pathway activity scores. Thus, by incorporating such features into an updated mechanistic model of the canonical WNT STN activation, one would expect to better understand the patient-specific differences in the control of pathway activity, but also to relate pathway activity to clinical outcomes on the level of individual patients.

3. Discussion

Our experimental workflow employed numerous Kaplan–Meier survival scans, a PROGENy analysis, and developed three machine learning models based on mechanistic WNT pathway models and LASSO identified genes and proteins of the extant WNT network. The models can serve as a platform for improving current mechanistic models and WNT pathway activity-based patient stratification. Conversely, all models of the WNT signalling pathway to date have focussed on a few genes and proteins of the core pathway [27,28,29,30,31,32]. Building upon this work that describes the initial steps of WNT pathway activation, our work builds upon this by identifying new features and regression models that describe the heterogeneity of the WNT pathway activity scores across patients from two CRC cohorts [27]. We have also shown that the activity scores of the WNT pathway were the most significant in terms of the association to event-free patient survival compared to four other key pathways of CRC; the MAPK, PI3K, TGF-Beta, and p53 pathways.

3.1. Event-Free Survival Analysis

This study determined novel genes and proteins significantly associated with event-free survival in CRC across the major five CRC signalling pathways, WNT, PI3K-Akt, TP53, MAPK, and TGF-Beta. In total, 389 genes and 75 proteins were found to be significant across all signalling pathways from a sum of 872 genes and 284 proteins. A total of 59 of these features were significant in the WNT signalling pathway, and interestingly, only seven of these significant features, DVL3, DKK1, SFPR2, WNT3A, WNT3, SFPR1, and GSK3B, are found within previous mechanistic WNT models [27,28,29,30,31,32]. Thus, in order to build new and improved mechanistic models of the WNT pathway with the potential to fulfil the promise of precision medicine, future modelling should focus on these significant genes and proteins.
For the WNT signalling pathway, the number of significant genes determined from RNA sequencing was 53. The top two significant genes found were DVL3 and VANGL2. The most significant gene was DVL3, with a corresponding hazard ratio of 2.8158 and a p-value of   2.58 × 10 4 . WNT ligands bind to FZD receptors and the LRP5/6 co-receptor, which leads to the recruitment of cytosolic DVL3, then relays this signal to downstream signalling events that result in the translocation of ß-catenin to the nucleus and target gene expression. Thus, DVL is recruited by the receptor Frizzled and prevents the fundamental destruction of cytosolic β-catenin [43]. Previous studies demonstrated that a high expression of DVL3 in CRC acts as an unfavourable prognostic marker [44]. Additionally, Zhao et al. suggest that DVL3 is a key regulator in CRC chemoresistance and targeting it may be a potential strategy for CRC therapy [45]. Our study solidifies this further, as shown in the Kaplan–Meier curve in Figure 3, in which a high expression of DVL3 was associated with a lower event-free patient survival. VANGL2, the second most significant gene in the WNT signalling pathway, has a hazard ratio and p-value of 2.7692 and 1.08 × 10 3 , respectively. Studies show that VANGL2 can be activated by WNT through Frizzled receptors [46]. Furthermore, within the WNT pathway, six proteins were significantly associated with event-free patient survival. The most significant protein was PRKCA. High PRKCA protein expression correlated with longer event-free survival (Figure 5). Interestingly, the PRKCA protein was also important for explaining the WNT pathway activity scores in Model 3, with a significant negative regression coefficient (Figure 8), which is in line with the known function of PRKCA, which is to inhibit WNT signalling via several mechanisms, including the phosphorylation of β-catenin, and enhance CRC cell death, concretely fitting to the survival data presented in Figure 5 [47]. Together, these results suggest a model in which PRKCA exerts its positive effects on patient survival via repressing the WNT activity.
Finally, the results for the WNT pathway analysis identified several significant genes and proteins that were associated with event-free survival but have not yet been accounted for in current WNT mechanistic models. Most, if not all, models to date are based on a few intracellular and extracellular components of the core WNT pathway [27,28,29,30,31,32]. Focusing on describing the general mechanistic details of WNT pathway activation, these models were not intended to model patient specific differences and describe the WNT signalling heterogeneity across patients. In contrast, our analysis and machine learning models aimed at identifying genes and proteins with significant event-free survival associations and describing patient-specific differences of WNT pathway activation. In total, the remaining 52 significant features found in this study are not found in these mechanistic models. Thus, we have identified many genes that were associated with event-free survival and that constitute prime candidates to improve current WNT mechanistic models. These improved models could then be used for patient stratification and predicting response to therapy [9,33].

3.2. A PROGENy Analysis

The second part of this study consisted of a PROGENy pathway activity score analysis. There were several reasons why PROGENy and not classical GSEA was performed. One major reason PROGENy does not require predefined groups for comparisons, unlike GSEA, which determines whether a defined set of genes shows statistically significant, concurring differences between two groups, for example, normal and tumour tissue [14,48]. PROGENy, on the other hand, predicts specific pathway activity scores for each individual patient; thus, allowing us to build models that can explain these scores [35,49].
An advantage of the PROGENy analysis is that it reveals patient-specific differences, showing that different pathways are active in different patients (Figure 6). Interestingly, the PROGENy analysis did not reveal a striking hyperactivation of the WNT pathway (Figure 6); most values were found to be between 0 and 0.5 despite it being the main driving event in tumorigeneses within most CRC patients. This finding is explained by the fact that the pathway analysis is a differential analysis. PROGENy results are z-scores quantifying standardised (mean normalised and scaled) relative differences, yet all patients might have high WNT activity in absolute terms.
The results correlating the PROGENy pathway activity scores to patient event-free survival show that the WNT, PI3K, TGF-Beta, and MAPK pathways, when activated, were significantly associated with event-free patient survival. It is very interesting to note that the WNT signalling pathway was the most significant pathway associated with event-free patient survival. These results are in line with the literature, where high WNT pathway activation was associated with shorter survival [27,28,29,30,31,32]. The activation of the WNT pathway in CRC increases the levels of β-catenin within the cytosol, causing it to translocate into the nucleus and express WNT target genes that drive cell-proliferation [41]. How can the patient-specific differences of the WNT pathway activity be explained?

3.3. Development of Linear Regression Models

The final part of this study developed three linear regression machine learning models with the aim to predict the PROGENy WNT pathway activity scores. Current mechanistic models describe the pathway components and provide deterministic insights into how the WNT pathway is activated but neglect patient-specific differences [27,28,29,30,31,32]. Thus, combining machine learning that focuses on patient-specific differences with mechanistic models has great potential for building explainable machine learning models.
Overall, Model 2 was found as the most predictive model. In comparison, the RMSE of Model 2 was 0.3751 times smaller than Model 1. Five features were identified that were both prognostic of event-free patient survival and predictive of WNT pathway activity, including DVL3, PRKCA, VANGL2, GPC4, and ROCK2. Of these, DVL3 was the only feature found in the mechanistic model, Model 1. The finding also highlights a lack of features in current mechanistic models that can explain patient-specific differences. Concretely, solidifying the need to propose such a strategy to incorporate them. In particular, our work identified the four overlapping features above (PRKCA, VANGL2, GPC4, and ROCK2) that should be the focus of mechanistic modelling in the future. Machine learning, Model 2, accounting for such features, outperformed the current mechanistic model and can accurately predict the WNT pathway activity scores.
Interestingly, the protein PRKCA was found to be both significantly associated with event-free survival and a significant predictive feature of the WNT pathway activity score (Table 6). The results in Figure 8 show that most features used in the machine learning models have nonzero regression coefficients, in particular: DVL3, FZD5, RAC1, ROCK2, GSK3B, CTB2, CBT1, and PRKCA. These features provide valuable WNT network nodes to be included in future mechanistic models of the WNT network. The presented machine learning models incorporate patient specific significant features that describe pathway activity and can thus be termed “explainable”. Despite this, these prognostic features have not yet been accounted for in current WNT models. The finding that a LASSO-based machine learning model (Model 2) identified new features outperforms the current mechanistic model, and can accurately predict the WNT pathway activity scores, highlights the need to improve current mechanistic models by incorporating these features.

4. Conclusions

In conclusion, we developed machine learning models of the activity of the canonical WNT signalling pathway and incorporated significant genes and proteins that are associated with event-free patient survival. This model is a valuable tool for predicting the heterogeneity of WNT pathway activity on an individual patient level. In this study, we identified several features (DVL3, FZD5, RAC1, ROCK2, GSK3B, CTB2, CBT1, and PRKCA) that were not only significantly associated with event-free patient survival but also important for predicting the patient-specific WNT pathway activity scores. We expect that integrating these features into mechanistic models of WNT pathway activation in the future will not only help to better understand the patient-specific differences in the control of pathway activity but also to relate pathway activity to clinical outcomes on the level of individual patients.

5. Materials and Methods

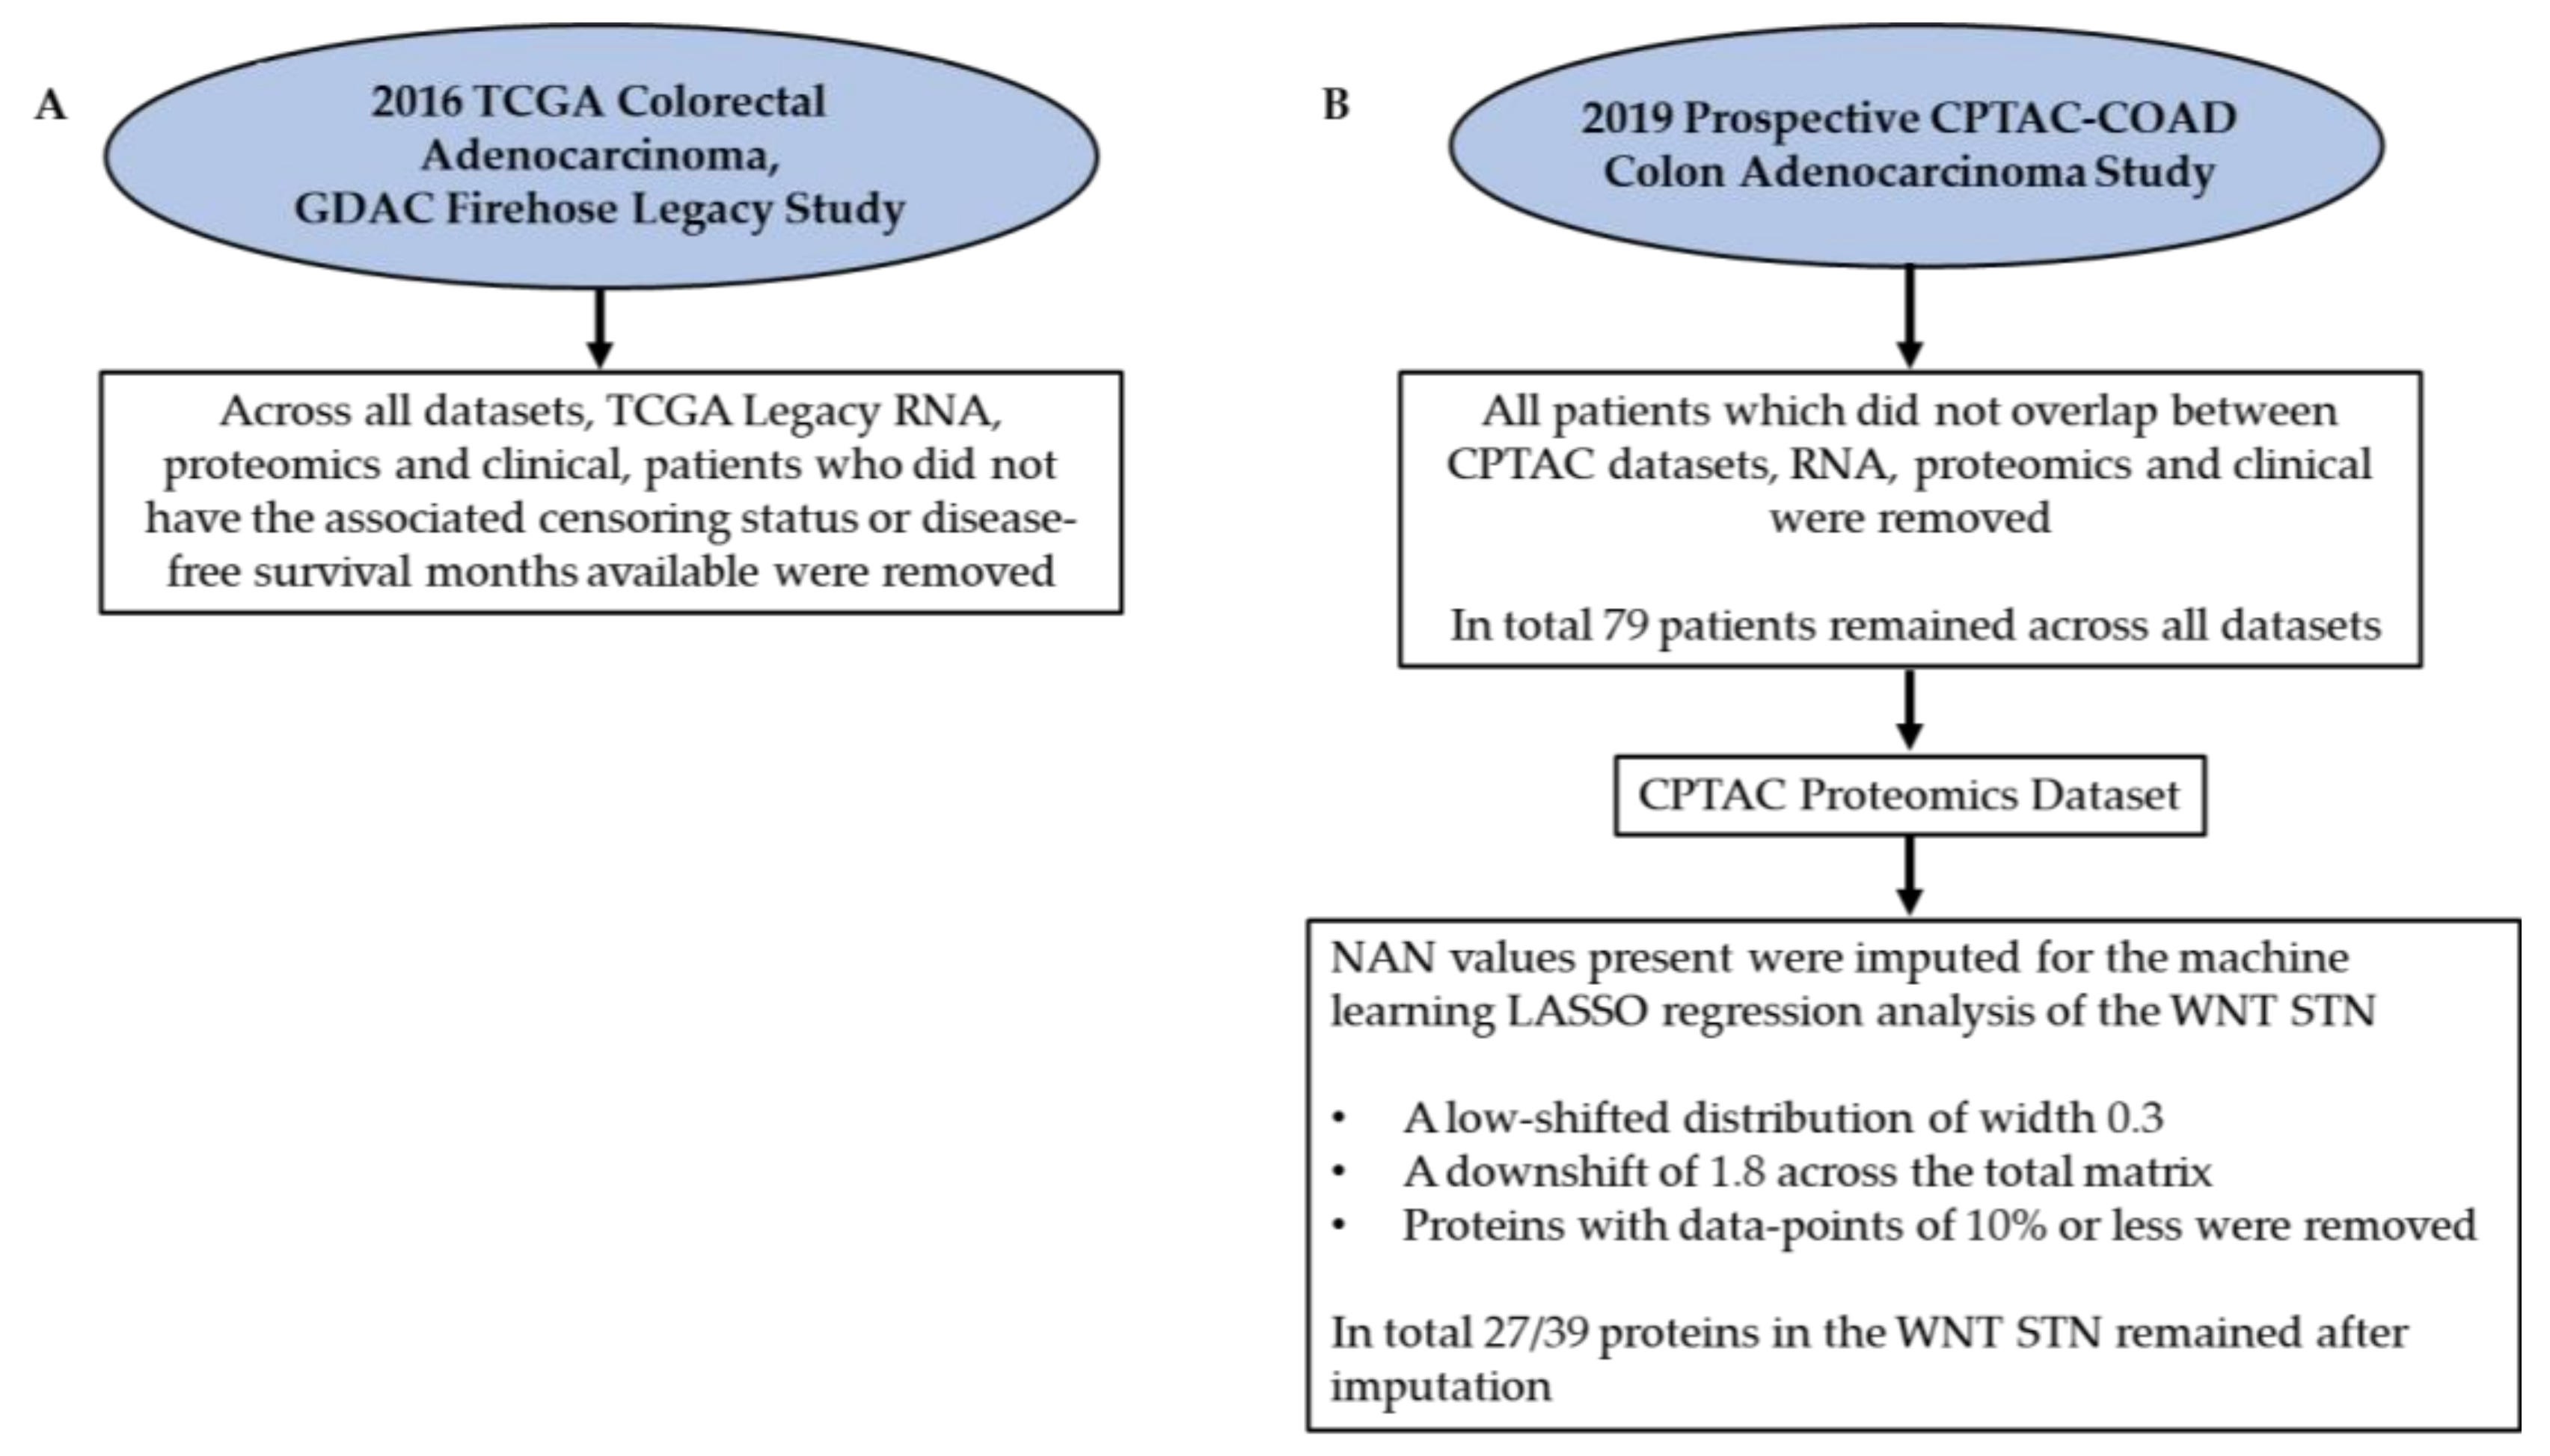
5.1. Data Acquisition from the Literature

All data used throughout this study was open-source data. The first datasets were from the 2016 TCGA Colorectal Adenocarcinoma, GDAC Firehose Legacy study, previously known as TCGA provisional. The datasets used for this study included Genomic from RNA sequencing (20,532 genes), proteomic from mass spectrometry (5562 proteins), and the associated clinical dataset [39,40]. The TCGA legacy datasets, due to the minimum overlap between patients, were only used to determine prognostic genes and proteins within such patients. Pre-processing across the datasets was performed before the survival analyses were complete. Across all datasets, patients who did not have the associated censoring status or disease-free survival months available were removed. The second set of data was from the 2019 prospective CPTAC-COAD colon adenocarcinoma studies, genomic from RNA sequencing (13,482 genes), proteomic from mass spectrometry (6422 proteins), and clinical datasets were all downloaded from LinkedOmics [39,40,50,51]. Minor pre-processing across the CPTAC datasets was performed before the following analyses were complete. The pre-processing included analysing the datasets, RNA, proteomics, and clinical to ensure that the same patients were overlapping across all and, if not, removing these patients. In total, 79 patients remained across all datasets. Additionally, for the CPTAC proteomics dataset, several NAN values were present. These values were imputed for the machine learning LASSO regression analysis of the WNT STN. This was achieved in the application Perseus using a low-shifted distribution of width 0.3 and a downshift of 1.8 across the total matrix [52]. Furthermore, proteins with data points of 10% or less were removed. In total, 27/39 proteins in the WNT STN remained after imputation. All datasets analysed and pre-processed for this study can be found in the supplementary data; consequently, Table 7 and Figure 9 represent key metrics and pre-processing steps for all datasets used.
The five critical CRC STNs used in this study stemmed from the literature [3,11,23]. The network databases WikiPathways, KEGG, and GSEA, were used to create a list of gene-sets for each pathway including WNT, PI3K-Akt, TP53, MAPK, and TGF-Beta [21,22,37,38,53,54,55,56,57,58,59,60,61,62]. Each gene-set consisted of every gene listed for each homo-sapiens STN pathway on WikiPathways. These gene-sets were then used as input scripts to determine which genes and proteins are prognostic and correlate to patient event-free survival. All gene sets are found in the supplementary data.

5.2. Kaplan–Meier Survival Analysis

The Kaplan–Meier survival analysis was simulated three times, the first to find the prognostic genes from RNA sequencing, the second to find the prognostic proteins from proteomics, both using the TCGA legacy datasets, and finally to determine the associations between PROGENy pathway activity scores and event-free survival using the RNA CPTAC dataset. The optimum cut-off for stratifying the patient populations into low and high groups was identified by scanning the group sizes from 10–90 to 90–10 percent splits, where 10–90 means that 10% of the patients were in the low group and 90% of the patients were in the high group and calculating the p-value for the overall event-free survival difference between the groups using a log-rank test with Yates’ correction. The cut-offs were based on the TCGA legacy datasets: RNA sequencing (329 patients) and proteomics (73 patients), and the CPTAC RNA dataset (79 patients). The inputs for the first two simulations were based on the gene or protein sets for each CRC STN identified above. The output was a Kaplan–Meier curve for the gene or protein expressed, indicating the number of patients in the high expression or low expression group with the corresponding statistical values apparent. The inputs for the final simulation were the PROGENy CRC pathway activity scores, and the output was 5 Kaplan–Meier curves for each CRC STN. The number of patients in the high activity or low activity group was identified with the corresponding statistical values. All statistical computations and Kaplan–Meier analyses were performed in MATLAB (version R2020b Update 5 (9.9.0. 1592791), The MathWorks, Inc., Natick, MA, USA) using the statistics toolbox and the log-rank (www.mathworks.com/matlabcentral/fileexchange/22317-logrank (accessed on 7 April 2021)) and kmplot (www.mathworks.com/matlabcentral/fileexchange/22293-kmplot (accessed on 7 April 2021)) functions from the MATLAB (version R2020b Update 5 (9.9.0. 1592791), The MathWorks, Inc., Natick, MA, USA) file exchange [63].

5.3. PROGENy Analysis

PROGENy is a machine learning based tool installed from Bioconductor as an RStudio package (RStudio Team (2020). RStudio: Integrated Development for R. RStudio, PBC, Boston, MA URL http://www.rstudio.com/) [35,49]. A PROGENy analysis was performed on the TCGA RNA sequencing legacy dataset to find a common core of CRC pathway activities. Despite PROGENy’s composition of 14-cancer relevant pathways, specifically for this study, only the CRC pathways were analysed in depth [35,49]. The available CRC pathways using PROGENy were PI3K, MAPK, TGF-Beta, WNT, and p53. The associated PROGENy CRC pathway activity scores for the entire TCGA legacy patient cohort is found in the supplementary data. PROGENy (version 1.12.0) was used in the study [35,49].

5.4. Developing Linear Regression Machine Learning Models

The three linear regression machine learning models developed in the study were performed in MATLAB using the regression learner app [64]. The three trained models were a variety of linear, stepwise linear, and robust linear regression models. Each model consisted of 79 observations, i.e., the entire CPTAC patient cohort. Cross-validation of 10-fold was used for each model. All models were developed solely from the CPTAC datasets from RNA and proteomics. The selected input features for the models were obtained through LASSO regression of both datasets. For both LASSO regression analyses, the lambda value with minimal mean squared error plus one standard deviation was applied. A threshold (p-value) of 0.05 was used to determine if a feature was significant. For the proteomics dataset, this resulted in 5/27 features (proteins) found to be significant, including CTBP1, CTBP2, PLCB4, PRKCA, and RAC1. Similarly, for the RNA sequencing dataset, 5/89 features (genes) were significant, DKK3, FZD5, NKD1, NOTUM, and WNT11. All associated datasets are found within the supplementary data.

Supplementary Materials

The following are available online at https://www.mdpi.com/article/10.3390/ijms22189970/s1.

Author Contributions

Conceptualisation, A.N. and D.F.; Data curation, A.N.; Formal analysis, A.N.; Funding acquisition, D.F.; Investigation, D.F.; Methodology, A.N.; Project administration, A.N.; Software, A.N.; Supervision, D.F.; Validation, D.F.; Visualisation, A.N.; Writing—original draft, A.N.; Writing—review and editing, A.N. and D.F. All authors have read and agreed to the published version of the manuscript.

Funding

This project has received funding from the UCD Ad Astra Fellowship No 64998 and the European Union’s Horizon 2020 research and innovation programme under grant agreement No 754923. The material presented and views expressed here are the responsibility of the author(s) only. The EU Commission takes no responsibility for any use made of the information set out.

Institutional Review Board Statement

Not applicable.

Informed Consent Statement

Not applicable.

Data Availability Statement

The first dataset supporting this study were from the 2016 TCGA Colorectal Adenocarcinoma, GDAC Firehose Legacy study, previously known as TCGA provisional (cBioPortal for Cancer Genomics. Available Online: https://www.cbioportal.org/study/summary?id=coadread_tcga (accessed on 1 March 2021)) [39,40]. The second and last dataset was from the 2019 prospective CPTAC-COAD colon adenocarcinoma studies. All data were downloaded from LinkedOmics. (Datasets for Colon adenocarcinoma: Prospective CPTAC-COAD. Available Online: http://linkedomics.org/cptac-colon/ (accessed on 8 April 2021)).

Conflicts of Interest

The authors declare no conflict of interest.

References

  1. Dekker, E.; Tanis, P.J.; Vleugels, J.L.A.; Kasi, P.M.; Wallace, M.B. Colorectal cancer. Lancet 2019, 394, 1467–1480. [Google Scholar] [CrossRef]
  2. Xie, Y.H.; Chen, Y.X.; Fang, J.Y. Comprehensive review of targeted therapy for colorectal cancer. In Signal Transduction and Targeted Therapy; Springer Nature: Basingstoke, UK, 2020; Volume 5, pp. 1–30. [Google Scholar] [CrossRef]
  3. Tyagi, A.; Sharma, A.K.; Damodaran, C. A Review on Notch Signaling and Colorectal Cancer. Cells 2020, 9, 1549. [Google Scholar] [CrossRef]
  4. Dienstmann, R.; Vermeulen, L.; Guinney, J.; Kopetz, S.; Tejpar, S.; Tabernero, J. Consensus molecular subtypes and the evolution of precision medicine in colorectal cancer. Nat. Rev. Cancer 2017, 17, 79–92. [Google Scholar] [CrossRef] [PubMed]
  5. Stintzing, S.; Wirapati, P.; Lenz, H.-J.; Neureiter, D.; von Weikersthal, L.F.; Decker, T.; Kiani, A.; Kaiser, F.; Al-Batran, S.; Heintges, T.; et al. Consensus molecular subgroups (CMS) of colorectal cancer (CRC) and first-line efficacy of FOLFIRI plus cetuximab or bevacizumab in the FIRE3 (AIO KRK-0306) trial. Ann. Oncol. 2019, 30, 1796–1803. [Google Scholar] [CrossRef] [PubMed] [Green Version]
  6. Okita, A.; Takahashi, S.; Ouchi, K.; Inoue, M.; Watanabe, M.; Endo, M.; Honda, H.; Yamada, Y.; Ishioka, C. Consensus molecular subtypes classification of colorectal cancer as a predictive factor for chemotherapeutic efficacy against metastatic colorectal cancer. Oncotarget 2018, 9, 18698–18711. [Google Scholar] [CrossRef] [PubMed]
  7. Mooi, J.; Wirapati, P.; Asher, R.; Lee, C.; Savas, P.S.; Price, T.; Townsend, A.; Hardingham, J.; Buchanan, D.; Williams, D.; et al. The prognostic impact of consensus molecular subtypes (CMS) and its predictive effects for bevacizumab benefit in metastatic colorectal cancer: Molecular analysis of the AGITG MAX clinical trial. Ann. Oncol. 2018, 29, 2240–2246. [Google Scholar] [CrossRef]
  8. Roelands, J.; Kuppen, P.J.K.; Vermeulen, L.; Maccalli, C.; Decock, J.; Wang, E.; Marincola, F.M.; Bedognetti, D.; Hendrickx, W. Immunogenomic classification of colorectal cancer and therapeutic implications. Int. J. Mol. Sci. 2017, 18, 2229. [Google Scholar] [CrossRef] [Green Version]
  9. Kolch, W.; Fey, D. Personalized computational models as biomarkers. J. Pers. Med. 2017, 7, 9. [Google Scholar] [CrossRef] [Green Version]
  10. Kolch, W.; Halasz, M.; Granovskaya, M.; Kholodenko, B.N. The dynamic control of signal transduction networks in cancer cells. Nat. Rev. Cancer 2015, 15, 515–527. [Google Scholar] [CrossRef]
  11. The Cancer Genome Atlas Network. Comprehensive molecular characterization of human colon and rectal cancer. Nature 2012, 487, 330–337. [Google Scholar] [CrossRef] [Green Version]
  12. McDonald, G.T.; Sullivan, R.; Paré, G.C.; Graham, C.H. Inhibition of phosphatidylinositol 3-kinase promotes tumor cell resistance to chemotherapeutic agents via a mechanism involving delay in cell cycle progression. Exp. Cell Res. 2010, 316, 3197–3206. [Google Scholar] [CrossRef]
  13. Temiz, T.K.; Altun, A.; Turgut, N.H.; Balcı, E.; Turgut, H.; Balcı, E. Investigation of the effects of drugs effective on PI3K-AKT signaling pathway in colorectal cancer alone and in combination Kolorektal kanserde PI3K-AKT sinyal yolağı üzerinden etki gösteren ilaçların tek başlarına ve kombinasyonlarının etkilerinin araştırılması. Cumhur. Med. J. 2014, 36, 167–177. [Google Scholar] [CrossRef] [Green Version]
  14. Subramanian, A.; Tamayo, P.; Mootha, V.K.; Mukherjee, S.; Ebert, B.L.; Gillette, M.A.; Paulovich, A.; Pomeroy, S.L.; Golub, T.R.; Lander, E.S.; et al. Gene set enrichment analysis: A knowledge-based approach for interpreting genome-wide expression profiles. Proc. Natl. Acad. Sci. USA 2005, 102, 15545–15550. [Google Scholar] [CrossRef] [PubMed] [Green Version]
  15. Xu, G.; Shi, Y. Apoptosis signaling pathways and lymphocyte homeostasis. Cell Res. 2007, 17, 759–771. [Google Scholar] [CrossRef] [PubMed] [Green Version]
  16. Cell Cycle Pathway|Aviva Systems Biology—Bio-Connect. Available online: https://www.bio-connect.nl/cell-cycle-pathway/cnt/page/4814 (accessed on 9 April 2021).
  17. Wang, X.W.; Zhang, Y.J. Targeting mTOR network in colorectal cancer therapy. World J. Gastroenterol. 2014, 20, 4178–4188. [Google Scholar] [CrossRef]
  18. Koveitypour, Z.; Panahi, F.; Vakilian, M.; Peymani, M.; Forootan, F.S.; Esfahani, M.H.N.; Ghaedi, K. Signaling pathways involved in colorectal cancer progression. In Cell and Bioscience; BioMed Central Ltd.: London, UK, 2019; Volume 9. [Google Scholar] [CrossRef] [Green Version]
  19. Previs, R.A.; Coleman, R.L.; Harris, A.L.; Sood, A.K. Molecular Pathways: Translational and Therapeutic Implications of the Notch Signaling Pathway in Cancer. Physiol. Behav. 2017, 176, 139–148. [Google Scholar] [CrossRef] [PubMed] [Green Version]
  20. Liao, W.; Li, G.; You, Y.; Wan, H.; Wu, Q.; Wang, C.; Lv, N. Antitumor activity of Notch-1 inhibition in human colorectal carcinoma cells. Oncol. Rep. 2018, 39, 1063–1071. [Google Scholar] [CrossRef] [PubMed] [Green Version]
  21. Goto, M.K.S. KEGG: Kyoto Encyclopedia of Genes and Genomes. In Nucleic Acids Research; Oxford University Press: Oxford, UK, 2000; Volume 28, pp. 27–30. [Google Scholar] [CrossRef]
  22. Kanehisa, M.; Goto, S.; Kawashima, S.; Nakaya, A. Thed KEGG databases at GenomeNet. Nucleic Acids Res. 2002, 30, 42–46. [Google Scholar] [CrossRef]
  23. Iurii, M. Genetics of colorectal cancer. J. Med. Life 2014, 7, 507–511. [Google Scholar]
  24. Polakis, P. Wnt signaling in cancer. Cold Spring Harb. Perspect. Biol. 2012, 4, a008052. [Google Scholar] [CrossRef] [Green Version]
  25. Zhan, T.; Rindtorff, N.; Boutros, M. Wnt signaling in cancer. Oncogene 2017, 36, 1461–1473. [Google Scholar] [CrossRef]
  26. Schatoff, E.M.; Leach, B.I.; Dow, L.E. Wnt Signaling and Colorectal Cancer. Curr. Color. Cancer Rep. 2017, 13, 101–110. [Google Scholar] [CrossRef] [PubMed] [Green Version]
  27. Kogan, Y.; Halevi-Tobias, K.E.; Hochman, G.; Baczmanska, A.K.; Leyns, L.; Agur, Z. A new validated mathematical model of the Wnt signalling pathway predicts effective combinational therapy by sFRP and Dkk. Biochem. J. 2012, 444, 115–125. [Google Scholar] [CrossRef] [Green Version]
  28. Wolf, B.K.J. Mathematical modelling of Wnt/β-catenin signalling. Biochem. Soc. Trans. 2010, 38, 1281–1285. [Google Scholar] [CrossRef] [Green Version]
  29. Lee, E.; Salic, A.; Krüger, R.; Heinrich, R.; Kirschner, M.W. The roles of APC and axin derived from experimental and theoretical analysis of the Wnt pathway. PLoS Biol. 2003, 1, e10. [Google Scholar] [CrossRef] [Green Version]
  30. Lee, M.; Chen, G.T.; Puttock, E.; Wang, K.; Edwards, R.A.; Waterman, M.L.; Lowengrub, J. Mathematical modeling links Wnt signaling to emergent patterns of metabolism in colon cancer. Mol. Syst. Biol. 2017, 13, 912. [Google Scholar] [CrossRef] [PubMed] [Green Version]
  31. Shukla, A.; Singh, T.R. Network-based approach to understand dynamic behaviour of Wnt signaling pathway regulatory elements in colorectal cancer. Netw. Modeling Anal. Health Inform. Bioinform. 2018, 7, ra130. [Google Scholar] [CrossRef]
  32. Heinrich, R. Mathematical modelling of the Wnt-pathway. Syst. Biol. 2005, 13, 259–275. [Google Scholar] [CrossRef]
  33. Fey, D.; Halasz, M.; Dreidax, D.; Kennedy, S.P.; Hastings, J.F.; Rauch, N.; Munoz, A.G.; Pilkington, R.; Fischer, M.; Westermann, F.; et al. Signaling pathway models as biomarkers: Patient-specific simulations of JNK activity predict the survival of neuroblastoma patients. Sci. Signal. 2015, 8, ra130. [Google Scholar] [CrossRef] [Green Version]
  34. Golumbeanu, M.; Yang, G.; Camponovo, F.; Stuckey, E.M.; Hamon, N.; Mondy, M.; Rees, S.; Chitnis, N.; Cameron, E.; Penny, M.A. Combining machine learning and mathematical models of disease dynamics to guide development of novel disease interventions. medRxiv 2021. [Google Scholar] [CrossRef]
  35. Schubert, M.; Klinger, B.; Klünemann, M.; Sieber, A.; Uhlitz, F.; Sauer, S.; Garnett, M.J.; Blüthgen, N.; Saez-Rodriguez, J. Perturbation-response genes reveal signaling footprints in cancer gene expression. Nat. Commun. 2018, 9, 20. [Google Scholar] [CrossRef] [Green Version]
  36. Holland, C.H.; Tanevski, J.; Perales-Patón, J.; Gleixner, J.; Kumar, M.P.; Mereu, E.; Joughin, B.A.; Stegle, O.; Lauffenburger, D.A.; Heyn, H.; et al. Robustness and applicability of transcription factor and pathway analysis tools on single-cell RNA-seq data. Genome Biol. 2020, 21, 1–19. [Google Scholar] [CrossRef] [Green Version]
  37. Kanehisa, M.; Furumichi, M.; Sato, Y.; Ishiguro-Watanabe, M.; Tanabe, M. KEGG: Integrating viruses and cellular organisms. Nucleic Acids Res. 2021, 49, D545–D551. [Google Scholar] [CrossRef]
  38. Kanehisa, M. Toward understanding the origin and evolution of cellular organisms. In Protein Science; Blackwell Publishing Ltd.: Hoboken, NJ, USA, 2019; Volume 28, pp. 1947–1951. [Google Scholar] [CrossRef]
  39. Cerami, E.; Gao, J.; Dogrusoz, U.; Gross, B.E.; Sumer, S.O.; Aksoy, B.A.; Jacobsen, A.; Byrne, C.J.; Heuer, M.L.; Larsson, E.; et al. The cBio Cancer Genomics Portal: An open platform for exploring multidimensional cancer genomics data. Cancer Discov. 2012, 2, 401–404. [Google Scholar] [CrossRef] [Green Version]
  40. Gao, J.; Aksoy, B.A.; Dogrusoz, U.; Dresdner, G.; Gross, B.; Sumer, S.O.; Sun, Y.; Jacobsen, A.; Sinha, R.; Larsson, E.; et al. Integrative analysis of complex cancer genomics and clinical profiles using the cBioPortal. Sci. Signal. 2013, 6, pl1. [Google Scholar] [CrossRef] [PubMed] [Green Version]
  41. Gao, C.; Xiao, G.; Hu, J. Regulation of Wnt/β-catenin signaling by posttranslational modifications. Cell Biosci. 2014, 4, 13. [Google Scholar] [CrossRef] [Green Version]
  42. Darras, S.; Fritzenwanker, J.H.; Uhlinger, K.R.; Farrelly, E.; Pani, A.M.; Hurley, I.A.; Norris, R.P.; Osovitz, M.; Terasaki, M.; Wu, M.; et al. Anteroposterior axis patterning by early canonical Wnt signaling during hemichordate development. PLoS Biol. 2018, 16, e2003698. [Google Scholar] [CrossRef] [PubMed] [Green Version]
  43. Gao, C.; Chen, Y.G. Dishevelled: The hub of Wnt signaling. Cell. Signal. 2010, 22, 717–727. [Google Scholar] [CrossRef]
  44. DVL3 Protein Expression Summary—The Human Protein Atlas. Available online: https://www.proteinatlas.org/ENSG00000161202-DVL3 (accessed on 12 April 2021).
  45. Zhao, Q.; Zhuang, K.; Han, K.; Tang, H.; Wang, Y.; Si, W.; Yang, Z. Silencing DVL3 defeats MTX resistance and attenuates stemness via Notch Signaling Pathway in colorectal cancer. Pathol. Res. Pract. 2020, 216, 152964. [Google Scholar] [CrossRef] [PubMed]
  46. Shafer, B.; Onishi, K.; Lo, C.; Colakoglu, G.; Zou, Y. Vangl2 Promotes Wnt/Planar Cell Polarity-like Signaling by Antagonizing Dvl1-Mediated Feedback Inhibition in Growth Cone Guidance. Dev. Cell 2011, 20, 177–191. [Google Scholar] [CrossRef] [Green Version]
  47. Dupasquier, S.; Blache, P.; Lasorsa, L.P.; Zhao, H.; Abraham, J.-D.; Haigh, J.J.; Ychou, M.; Prevostel, C. Modulating PKCα activity to target Wnt/β-catenin signaling in colon cancer. Cancers 2019, 11, 693. [Google Scholar] [CrossRef] [PubMed] [Green Version]
  48. Mootha, V.K.; Lindgren, C.M.; Eriksson, K.F.; Subramanian, A.; Sihag, S.; Lehar, J.; Puigserver, P.; Carlsson, E.; Ridderstrale, M.; Laurila, E.; et al. PGC-1α-responsive genes involved in oxidative phosphorylation are coordinately downregulated in human diabetes. Nat. Genet. 2003, 34, 267–273. [Google Scholar] [CrossRef]
  49. Holland, C.H.; Szalai, B.; Saez-Rodriguez, J. Transfer of regulatory knowledge from human to mouse for functional genomics analysis. Biochim. Biophys. Acta (BBA)—Gene Regul. Mech. 2019, 1863, 194431. [Google Scholar] [CrossRef] [PubMed]
  50. LinkedOmics: Data Download. Datasets for Colon Adenocarcinoma (Prospective CPTAC-COAD). Available online: http://linkedomics.org/cptac-colon/ (accessed on 8 April 2021).
  51. Vasaikar, S.; Huang, C.; Wang, X.; Petyuk, V.A.; Savage, S.R.; Wen, B.; Dou, Y.; Zhang, Y.; Shi, Z.; Arshad, O.A.; et al. Proteogenomic Analysis of Human Colon Cancer Reveals New Therapeutic Opportunities. Cell 2019, 177, 1035–1049. [Google Scholar] [CrossRef] [PubMed] [Green Version]
  52. Tyanova, S.; Temu, T.; Sinitcyn, P.; Carlson, A.; Hein, M.Y.; Geiger, T.; Mann, M.; Cox, J. The Perseus computational platform for comprehensive analysis of (prote)omics data. In Nature Methods; Nature Publishing Group: Berlin, Germany, 2016; Volume 13, pp. 731–740. [Google Scholar] [CrossRef]
  53. Nicioli da Silva, G.; Hanspers, K.; Pico, A.; Waagmeester, A. TP53 Network (Homo Sapiens)—WikiPathways. Available online: https://www.wikipathways.org/index.php/Pathway:WP1742 (accessed on 8 April 2021).
  54. Hanspers, K.; Riutta, A.; Willighagen, E. PI3K-Akt Signaling Pathway (Homo Sapiens)—WikiPathways. Available online: https://www.wikipathways.org/index.php/Pathway:WP4172 (accessed on 8 April 2021).
  55. Pandey, A.; Hansper, K.; Pico, A.; Salomonis, N. TGF-beta Signaling Pathway (Homo Sapiens)—WikiPathways. Available online: https://www.wikipathways.org/index.php/Pathway:WP366 (accessed on 8 April 2021).
  56. Lieberman, M.; Hanspers, K.; Pico, A.; Kelder, T. Wnt Signaling (Homo Sapiens)—WikiPathways. Available online: https://www.wikipathways.org/index.php/Pathway:WP428 (accessed on 8 April 2021).
  57. Martens, M.; Ammar, A.; Riutta, A.; Waagmeester, A.; Slenter, D.N.; Hanspers, K.; Miller, R.A.; Digles, D.; Lopes, E.N.; Ehrhart, F.; et al. WikiPathways: Connecting communities. Nucleic Acids Res. 2021, 49, 613–621. [Google Scholar] [CrossRef] [PubMed]
  58. Kelder, T.; Pico, A.R.; Hanspers, K.; van Iersel, M.P.; Evelo, C. Mining Biological Pathways Using WikiPathways Web Services. PLoS ONE 2009, 4, 6447. [Google Scholar] [CrossRef]
  59. Team Reactome; Miller, R. MTOR Signalling (Homo Sapiens)—WikiPathways. Available online: https://www.wikipathways.org/index.php/Pathway:WP3318 (accessed on 8 April 2021).
  60. Zambon, A.C.; Alexander, P.; Coort, S. Apoptosis (Homo Sapiens)—WikiPathways. Available online: https://www.wikipathways.org/index.php/Pathway:WP254 (accessed on 8 April 2021).
  61. Conklin, B.; Sach, I.C.; Coort, S.; Salomonis, N. Cell Cycle (Homo Sapiens)—WikiPathways. Available online: https://www.wikipathways.org/index.php/Pathway:WP179 (accessed on 8 April 2021).
  62. Burel, S.; Hanspers, K.; Pico, A. MAPK Signaling Pathway (Homo Sapiens)—WikiPathways. Available online: https://www.wikipathways.org/index.php/Pathway:WP382 (accessed on 8 April 2021).
  63. Giuseppe, C. Logrank—File Exchange—MATLAB Central. 2021. Available online: https://uk.mathworks.com/matlabcentral/fileexchange/22317-logrank (accessed on 7 April 2021).
  64. Regression Learner App—MATLAB & Simulink—MathWorks United Kingdom. Available online: https://uk.mathworks.com/help/stats/regression-learner-app.html (accessed on 9 April 2021).
Figure 1. Cascade of events in the WNT Signalling Pathway. Our approach is to combine critical features (genes forming the model) from the most recent mathematical model of the WNT STN, by Kogan et al., with adjustable machine learning models [27]. The schematic represents the initial steps of activation of the WNT pathway. WNT binds to FZD (frizzled), and the co-receptor LRP5/6 (low-density lipoprotein receptor-related protein 5/6), which is recruited in the vicinity of FZD receptors upon WNT binding. This binding prevents the formation of the whole destruction complex consisting of AXIN, APC, and GSK3β (Glycogen Synthase Kinase 3 Beta), thereby causing rising levels of β-catenin, β-catenin translocation into the nucleus, and expression of WNT target genes, CCND1 (Cyclin D1), MYC, MYCN, AXIN2, and FZD7 [27]. Using machine learning tools, such as PROGENy, the WNT pathway activity can be calculated for each individual patient by analysing their gene expression [35,36]. Created with BioRender.com.
Ijms 22 09970 g001
Figure 2. Significant genes in the WNT signalling pathway. Distribution of the p-value ( log 10 P) over the hazard ratio ( Log 2   fold change) from the genes analysed from the RNA Sequencing TCGA legacy dataset. Features were divided in two; significant and not significant, represented by the blue and yellow dots, respectively. Labels represent the gene names of some significant features. p-value cut-off used = 0.05. Log 2   fold change cut-off used = 0.5. Total number of features in WNT signalling pathway = 119. Total number of significant genes determined = 53.
Ijms 22 09970 g002
Figure 3. Kaplan–Meier curve of event-free survival for the most significant gene of each CRC STN. The most significant gene in each signalling pathway from the RNA Sequencing TCGA legacy dataset was (A) DVL3 for WNT STN, (B) EFNA1 for PI3K-Akt STN, (C) BCL2 for TP53 STN, (D) KRAS for MAPK STN, and (E) TERT for TGF-Beta STN. The patients were stratified into two groups according to the expression level of each feature. The optimal cut-off was determined using Kaplan–Meier scanning (see Methods). The groups are represented as high (orange line), and low (blue line), where n indicates the total number of patients in each group. For each group, the Kaplan–Meier curve of event-free survival was tested for statistically significant differences using a log-rank test. Log 2 HR = log base 2 of the hazard ratio. CI 95 %   = 95% Confidence Interval. P-val = p-value.
Ijms 22 09970 g003
Figure 4. Significant proteins in the WNT signalling pathway. Distribution of the p-value ( log 10 P) across the hazard ratio ( log 2   fold change) from the proteins analysed from proteomics TCGA legacy dataset. Features were divided into two; significant and not significant, represented by the blue and yellow dots, respectively. Labels represent the gene names of some significant features. p-value cut-off used = 0.05. Log 2   fold change cut-off used = 1. Total number of features in WNT signalling pathway = 119. Total number of significant proteomics determined = 6.
Ijms 22 09970 g004
Figure 5. Kaplan–Meier curve of event-free survival for the most significant protein, of each CRC STN. The most significant protein in each signalling pathway from the proteomics TCGA Firehose legacy dataset was (A) PRKCA for WNT STN, (B) PPP2R1B for PI3K-Akt STN, (C) BAX for TP53 STN, (D) STK3 for MAPK STN, and (E) SMAD2 for TGF-Beta STN. The patients were stratified into two groups according to the expression level of each feature. The optimal cut-off was determined using Kaplan–Meier scanning (see Methods). The groups are represented as high (orange line), and low (blue line), where n indicates the total number of patients in each group. For each group, the Kaplan–Meier curve of event-free survival was tested for statistically significant differences using a log-rank test. Log 2 HR = log base 2 of the hazard ratio. CI 95 %   = 95% Confidence Interval. P-val = p-value.
Ijms 22 09970 g005
Figure 6. PROGENy pathway activity scores from the RNA Sequencing expression dataset. Heatmap visualising the z-coefficients matrix for all features in each CRC signalling pathway for all 329 patients within the RNA sequencing TCGA legacy dataset cohort. The colourmap on the left indicates the activity score values ranging from 3–−3. The Euclidean distance metric was used to pass the pairwise distance between observations between both rows and columns. The complete linkage method was used to create the hierarchical cluster tree. Data were clustered along the columns of data, then along the rows of row-clustered data.
Ijms 22 09970 g006
Figure 7. Kaplan–Meier curves of event-free survival associated with CRC PROGENy pathway activity scores. Kaplan–Meier curves associated with PROGENy pathway activity scores for the signalling pathways (A) MAPK, (B) TGFß, (C) PI3K, (D) p53, and (E) WNT. The patients were stratified into two groups according to the expression level of each feature. The groups are represented as high (orange line) and low (blue line), where n indicates the total number of patients in each group. For each group, the Kaplan–Meier curve of event-free survival was tested for statistically significant differences using a log-rank test. Log 2 HR = log base 2 of the hazard ratio. CI 95 % = 95% Confidence Interval. P-val = p-value. RNA Sequencing data is from the TCGA legacy dataset.
Ijms 22 09970 g007
Figure 8. Linear regression machine learning models of the mechanistic and canonical WNT signalling pathways. Scatter plot visualising the correlation between the predicted score from (A) Model 1, using the 11 features of the mechanistic model (y-axis), and the PROGENy scores (x-axis). (B) Model 2, using the nine features of the canonical WNT model and significant genes (y-axis), and the PROGENy scores (x-axis). (C) Model 3, using the seven features of the canonical WNT model and significant proteins (y-axis), and the PROGENy scores (x-axis). Each blue dot represents 1 of 79 patients in the cohort. The black line indicates perfect predictions. “R” denotes the Pearson correlation coefficient, and “RMSE” is the root mean square error. The second row of figures represents the corresponding linear regression correlation coefficients for Models 1–3. Presented are the regression coefficients for the (D) Model 1, (E) Model 2, and (F) Model 3. The features used for each machine learning model are shown on the vertical axis, with the associated correlation coefficients shown on the horizontal axis. The blue dot represents the regression correlation coefficient, and the blue line (error bar) is the associated standard error. The dashed vertical yellow line represents the midline for the linear regression coefficients at 0.
Ijms 22 09970 g008
Figure 9. Pre-processing flow chart detailing all pre-processing steps completed prior to each analysis. Pre-processing flowchart for, (A) the 2016 TCGA Colorectal Adenocarcinoma, GDAC Firehose Legacy Study and (B) the 2019 Prospective CPTAC-COAD Colon Adenocarcinoma Study.
Ijms 22 09970 g009
Table 1. Critical CRC STNs and the associated key functions. Nine major CRC STNs, WNT, Apoptosis, PI3K-Akt, TP53, MAPK, TGF-Beta, Cell Cycle, mTOR, and Notch are located in the first column. The “features” column represents the number of features within each STN, i.e., the number of genes in each pathway. The correlated key functions of each pathway in CRC are briefly explained in the third column [12,13,14,15,16,17,18,19,20,21,22,23].
CRC Signalling PathwaysFeaturesKey Functions in Colorectal Cancer
WNT119Function: Normal activation leads to tumour growth in advanced CRC. This function depends on the amount of B-catenin in the cytoplasm
Cellular Activities: Cell fate specification, proliferation, migration, and asymmetric cell division
Activated: WNT signal or APC mutation
PI3K/Akt340Function: Oncogenic role in the initiation and progression of CRC
Inhibition: Reduction in CRC cell growth and increase in apoptosis
Cellular Activities: Cell growth, proliferation, differentiation, and migration
Activated: EGFR (epidermal growth factor receptor) Signalling
  • Akt is a downstream effector of PI3K, mediating effects on tumour growth and progression
MAPK252Function: Oncogenic role in CRC associated with tumour growth and disease progression
Cellular Activities: Cell growth, differentiation, and survival
TGFß135Function: Reduces colon epithelial cells proliferation and induces apoptosis and differentiation
Cellular Activities: Cell proliferation, differentiation, migration, apoptosis, and adhesion.
Activated: Binding of TGF-β ligands to type II TGF-β receptors
  • Tumour suppressor in the normal epithelium
  • Tumour promotor in the last stage of CRC
TP5338Function: Regulation of the cell cycle, DNA replication and apoptosis
Apoptosis87Function: Apoptotic cell death induction by two main pathways, intrinsic and extrinsic signalling
Resulting in the formation of a death-inducing signalling complex and an apoptosome
Cell Cycle122Function: Controls cell division
mTOR51Function: Regulation of cell growth and division
Cellular Activities: Cell growth, proliferation, and survival
Notch48Function: Promotes CRC through regulating the cell cycle and cell apoptosis by regulation of p21 and PUMA (p53 upregulated modulator of apoptosis) genes
Cellular Activities: Normal cell development, differentiation, proliferation, and apoptosis
Table 2. The top two significant genes across five CRC relevant signalling pathways from the TCGA Legacy dataset. A Kaplan–Meier estimate and log-rank test were used to compute the association between patient event-free survival and gene expressions. The associated hazard ratio, 95% confidence interval, p-value, mafdr (estimate positive false discovery rate for multiple hypothesis testing), and standard error are apparent. “Patient” indicates the number of patients for which data were available. The last column, “significant”, indicates the number of significant genes out of the total number of genes for this pathway. The fold change and p-value cut-off used were 0.5 and 0.05, respectively.
GenesHazard Ratio95% Confidence
Interval
p-ValuemafdrStandard
Error
PatientSignificant
(1) WNT53/119
DVL32.8158(1.6159–4.9066)2.58 × 10 4 1.37 × 10 2 0.2833329
VANGL22.7692(1.5039–5.0992)1.08 × 10 3 1.40 × 10 2 0.3115329
(2) PI3K-Akt159/340
EFNA13.2860(1.8496–5.8377)4.96 × 10 5 9.92 × 10 5 0.2932329
KRAS0.2853(0.1502–0.5418)1.27 × 10 4 1.26 × 10 4 0.3272329
(3) TP5311/38
BCL20.4610(0.2960–0.7179)6.12 × 10 4 0.00120.2260329
CDKN2A1.8156(1.1931–2.7629)5.36 × 10 3 0.00540.2142329
(4) MAPK113/252
KRAS0.2853(0.1502–0.5418)1.27 × 10 4 2.09 × 10 4 0.3272329
CACNA1I2.7685(1.6159–4.7432)2.10 × 10 4 2.09 × 10 4 0.2747313
(5) TGF-Beta53/135
TERT2.8734(1.6639–4.96201)1.53 × 10 4 3.05 × 10 4 0.2787328
TGFB1I12.2381(1.3807–3.6281)1.08 × 10 3 0.00110.2465329
Table 3. The top two significant proteins across five CRC relevant signalling pathways from the TCGA Legacy dataset. A Kaplan–Meier estimate and log-rank test were used to compute the Pearson correlation between patient event-free survival and protein expressions. The associated hazard ratio, 95% confidence interval, p-value, mafdr (estimate positive false discovery rate for multiple hypothesis testing), and standard error are apparent. “Patient” indicates the number of patients the corresponding protein was determined in. The last column, “significant”, in the format X/Y/Z lists the number of significant proteins in each STN (X), the number of genes within the pathway with available protein information (Y), and the total number of genes in the pathway (Z).
Genes Hazard Ratio95% Confidence Intervalsp-ValuemafdrStandard
Error
PatientSignificant
(1) WNT6/27/119
PRKCA0.1557(0.0490–0.4947)1.61 × 10 3 0.00360.589863
ROCK25.7810(1.9229–17.3789)1.78 × 10 3 0.00360.561671
(2) PI3K-Akt29/100/340
PPP2R1B6.8050(2.2113–20.9407)8.26 × 10 4 8.32 × 10 4 0.573573
EIF4E7.6285(2.3168–25.1176)8.32 × 10 4 8.32 × 10 4 0.608073
(3) TP532/5/38
BAX10.8648(3.3684–35.0445)6.54 × 10 5 1.30 × 10 4 0.597571
BID0.2650(0.0814–0.8616)2.73 × 10 2 0.02730.601667
(4) MAPK20/80/252
STK38.6543(2.4297–30.8245)8.69 × 10 4 0.00920.648165
PRKCA0.1557(0.0490–0.4947)1.61 × 10 3 0.00920.589863
(5) TGF-Beta15/71/135
SMAD210.4343(2.7196–40.0330)6.30 × 10 4 0.00130.686067
SPTBN15.8318(1.9510–17.4318)1.60 × 10 3 0.00160.558773
Table 4. Significant genes and proteins in the WNT signalling pathway from TCGA legacy datasets. (A) List of significant genes and their associated hazard ratio, p-value, and mafdr (estimate positive false discovery rate for multiple hypothesis testing). Hazard ratios smaller than one (between 0 and 1) indicate a negative association (decreased risk), hazard ratios of >1 indicate a positive association (increased risk). The last column, proteomics, indicates whether proteomics data for this gene were available. If yes, a Y is depicted. (B) List of significant proteins and their associated hazard ratio, p-value, and mafdr. Significant features highlighted in blue were found in published mechanistic models of the WNT pathway [27,28,29,30,31,32].
AGenesHazard Ratiop-ValuemafdrPatientProteomics
1DVL32.81582.58 × 10 4 1.37 × 10 2 329
2VANGL22.76931.08 × 10 3 1.40 × 10 2 329
3WNT62.31751.34 × 10 3 1.40 × 10 2 299
4TCF7L12.03241.35 × 10 3 1.40 × 10 2 329
5CER12.88711.42 × 10 3 1.40 × 10 2 147
6SOX172.10481.59 × 10 3 1.40 × 10 2 329
7NKD22.85981.85 × 10 3 1.40 × 10 2 329
8DKK11.97322.16 × 10 3 1.43 × 10 2 309
9SFRP21.85393.94 × 10 3 2.09 × 10 2 327Y
10PLCB12.94364.32 × 10 3 2.09 × 10 2 329
11PRICKLE11.82295.01 × 10 3 2.09 × 10 2 329
12MAPK80.54915.19 × 10 3 2.09 × 10 2 329Y
13PRICKLE21.81045.38 × 10 3 2.09 × 10 2 329
14MYC0.55355.53 × 10 3 2.09 × 10 2 329
15WIF12.46396.46 × 10 3 2.20 × 10 2 246
16CAMK2B1.99816.66 × 10 3 2.20 × 10 2 302
17WNT3A2.31377.09 × 10 3 2.21 × 10 2 243
18LEF11.97518.65 × 10 3 2.52 × 10 2 329
19RHOA0.47929.47 × 10 3 2.52 × 10 2 329Y
20MAPK101.72949.88 × 10 3 2.52 × 10 2 329
21CAMK2D0.55141.05 × 10 2 2.52 × 10 2 329Y
22WNT31.81411.06 × 10 2 2.52 × 10 2 328
23FZD81.89131.09 × 10 2 2.52 × 10 2 329
24SERPINF11.71161.14 × 10 2 2.52 × 10 2 329Y
25FZD11.72511.24 × 10 2 2.55 × 10 2 329
26NKD11.84801.25 × 10 2 2.55 × 10 2 329
27CXXC41.82902.62 × 10 2 1.34 × 10 2 318
28PPP3CA0.43352.62 × 10 2 1.39 × 10 2 329Y
29PLCB30.57722.74 × 10 2 1.50 × 10 2 329
30CSNK1A1L0.47102.74 × 10 2 1.55 × 10 2 321
31PLCB21.69553.46 × 10 2 2.10 × 10 2 329
32ROR21.65113.46 × 10 2 2.14 × 10 2 329
33PRKCB0.58883.46 × 10 2 2.15 × 10 2 329
34WNT20.54793.52 × 10 2 2.26 × 10 2 329
35SFRP11.63863.53 × 10 2 2.33 × 10 2 322
36WNT10A2.11703.69 × 10 2 2.56 × 10 2 328
37GSK3B1.63973.69 × 10 2 2.61 × 10 2 329Y
38FRAT10.61443.69 × 10 2 2.65 × 10 2 329
39SENP22.25353.84 × 10 2 2.92 × 10 2 329
40DKK41.74973.84 × 10 2 2.96 × 10 2 301
41CTNNBIP11.58383.84 × 10 2 2.97 × 10 2 329
42FZD72.04244.18 × 10 2 3.40 × 10 2 329
43WNT11.75334.18 × 10 2 3.46 × 10 2 244
44DKK21.81524.18 × 10 2 3.59 × 10 2 326
45WNT162.03674.18 × 10 2 3.62 × 10 2 276
46WNT2B0.64174.18 × 10 2 3.68 × 10 2 329
47NFATC41.57154.18 × 10 2 3.70 × 10 2 329
48NLK1.77844.23 × 10 2 3.83 × 10 2 329
49NOTUM1.57544.34 × 10 2 4.08 × 10 2 329
50CSNK2A30.48684.34 × 10 2 4.09 × 10 2 329
51WNT40.60604.82 × 10 2 4.64 × 10 2 329
52FZD50.65794.82 × 10 2 4.81 × 10 2 329
53DAAM11.70764.82 × 10 2 4.82 × 10 2 329
BProteinsHazard Ratiop-ValuemafdrPatient
1PRKCA0.15571.62 × 10 3 3.66 × 10 3 63
2ROCK25.78101.78 × 10 3 3.66 × 10 3 71
3CSNK2A15.68241.83 × 10 3 3.66 × 10 3 73
4LRP10.25942.62 × 10 2 3.93 × 10 2 72
5CSNK1A10.28463.71 × 10 2 4.46 × 10 2 72
6GPC40.25124.58 × 10 2 4.58 × 10 2 50
Table 5. The association between PROGENy pathway activity and patient event-free survival. PROGENy scores were analysed using Kaplan–Meier analysis and the log-rank test to obtain hazard ratios and p-values.
PathwayHazard Ratiop-Value
WNT1.97310.0013
PI3K0.57750.0276
TGFβ1.57920.0477
MAPK1.80580.0489
p530.59720.0687
Table 6. Overview of the significant genes and proteins and the linear regression machine learning models. (A) List of the top six significant features from RNA sequencing and proteomics from TCGA Legacy datasets. (B) Model 1: An overview of the features used for the Mechanistic WNT pathway model. Models 2 and 3: An overview of the features used for the canonical WNT pathway, from CPTAC RNA and proteomics datasets, respectively. The number of features used and associated RMSE for each model is listed in the first column. “RMSE” = root mean squared error. Significant features are highlighted in blue.
(A) Top Six Prognostic Genes and ProteinsFeatures
mRNA Sequencing
TCGA Legacy
DVL3
VANGL2
WNT6
TCF7L1
CER1
SOX17
Proteomics
TCGA Legacy
PRKCA
ROCK2
CSNK2A1
LRP1
CSNK1A1
GPC4
(B) Linear Regression ModelsFeatures
Model 1: Mechanistic Model
Model Input: CPTAC RNA
RMSE: 1.0167
11 Features
APC
AXIN1
CTNNB1
DKK2
DVL2
DVL3
GSK3B
LRP6
SFRP1
SFRP2
WNT3
Model 2: Canonical WNT model with top two prognostic genes and proteins
Model Input: CPTAC RNA
RMSE: 0.6416
9 Features
DKK3
FZD5
NKD1
NOTUM
WNT11
DVL3
PRKCA
ROCK2
VANGL2
Model 3: Canonical WNT model with top two prognostic proteins
Model Input: CPTAC proteomics
RMSE: 1.0509
7 Features
CTBP1
CTBP2
GPC4
PLCB4
PRKCA
RAC1
ROCK2
Table 7. Important key metrics of datasets and corresponding analyses performed for each dataset. The two studies used, TCGA Legacy and CPTAC, are located in the first column [39,40,50,51]. The “datasets” column represents the type of omic dataset used from the corresponding study in column one, with key metrics identified. The “analyses” column represents the type of analysis performed on each specified dataset. “RSEM” = RNA-sequencing by expectation-maximisation. “UQ” = upper quantile normalisation. “TMT” = tandem mass tag.
StudyDatasetsAnalyses
2016 TCGA Colorectal Adenocarcinoma, GDAC Firehose Legacy
1.
Genomic from RNA Sequencing
20,532 genes
Cohort of 329 patients
2.
Proteomic from Mass Spectrometry
5562 proteins
Cohort of 74 patients
3.
Corresponding Clinical Dataset
Event Free Survival
1.
Kaplan Meier Survival analysis for genes and proteins in pathways to find prognostic features
2.
PROGENy analysis on the TCGA RNA sequencing legacy dataset to find a common core of CRC pathway activities
2019 Prospective CPTAC-COAD Colon Adenocarcinoma
1.
Genomic from RNA Sequencing
RNA Expression (RSEM-UQ, Log2(Val+1))
13,482 genes
Cohort of 106 patients
2.
Proteomic from Mass Spectrometry
Protein Expression (TMT, Log2ratio)
6422 proteins
Cohort of 96 patients
3.
Corresponding Clinical Dataset
Cohort of 110 patients
79 patients analysed
Event Free Survival
1.
Determine the associations between PROGENy pathway activity scores and event free survival
2.
Linear Regression Machine Learning models to predict WNT pathway activity
Publisher’s Note: MDPI stays neutral with regard to jurisdictional claims in published maps and institutional affiliations.

