Article

Prognostic Impact and Functional Annotations of KIF11 and KIF14 Expression in Patients with Colorectal Cancer

by
Izabela Neska-Długosz
1,
Karolina Buchholz
1,2,
Justyna Durślewicz
1,
Maciej Gagat
2,
Dariusz Grzanka
1,
Krzysztof Tojek
3 and
Anna Klimaszewska-Wiśniewska
1,*
1
Department of Clinical Pathomorphology, Faculty of Medicine, Collegium Medicum in Bydgoszcz, Nicolaus Copernicus University in Torun, 85-094 Bydgoszcz, Poland
2
Department of Histology and Embryology, Faculty of Medicine, Collegium Medicum in Bydgoszcz, Nicolaus Copernicus University in Torun, 85-092 Bydgoszcz, Poland
3
Department of General, Colorectal and Oncological Surgery, Faculty of Medicine, Collegium Medicum in Bydgoszcz, Nicolaus Copernicus University in Torun, 85-168 Bydgoszcz, Poland
*
Author to whom correspondence should be addressed.
Int. J. Mol. Sci. 2021, 22(18), 9732; https://doi.org/10.3390/ijms22189732
Submission received: 28 July 2021 / Revised: 31 August 2021 / Accepted: 2 September 2021 / Published: 8 September 2021
(This article belongs to the Section Biochemistry)

Abstract

:
Genomic instability (GIN) has an important contribution to the pathology of colorectal cancer (CRC). Therefore, we selected mitosis and cytokinesis kinesins, KIF11 and KIF14, as factors of potential clinical and functional value in CRC, as their aberrant expression has been suspected to underlie GIN. We examined the expression and the prognostic and biological significance of KIF11 and KIF14 in CRC via in-house immunohistochemistry on tissue microarrays, public mRNA expression datasets, as well as bioinformatics tools. We found that KIF11 and KIF14 expression, at both the protein and mRNA level, was markedly altered in cancer tissues compared to respective controls, which was reflected in the clinical outcome of CRC patients. Specifically, we provide the first evidence that KIF11 protein and mRNA, KIF14 mRNA, as well as both proteins together, can significantly discriminate between CRC patients with better and worse overall survival independently of other relevant clinical risk factors. The negative prognostic factors for OS were high KIF11 protein, high KIF11 protein + low KIF14 protein, low KIF11 mRNA and low KIF14 mRNA. Functional enrichment analysis revealed that the gene sets related to the cell cycle, DNA replication, DNA repair and recombination, among others, were positively associated with KIF11 or KIF14 expression in CRC tissues. In TCGA cohort, the positive correlations between several measures related to GIN and the expression of KIFs were also demonstrated. In conclusion, our results suggest that CRC patients can be stratified into distinct risk categories by biological and molecular determinants, such as KIF11 and KIF14 expression and, mechanistically, this is likely attributable to their role in maintaining genome integrity.

1. Introduction

Colorectal cancer (CRC) is the third most commonly diagnosed malignancy and simultaneously the second leading cause of cancer death globally [1]. Its incidence depends on many variables, among which the most relevant are behavioral factors (including obesity, sedentary lifestyle, high intake of red meat, smoking and alcohol consumption) and loss of genomic stability leading to the accumulation of genetic and/or epigenetic alterations and consequently to the development of invasive cancer [2]. Several genomic instability (GIN)-associated genes presenting a significant contribution to CRC progression have been identified so far [3]. These findings resulted in improving the diagnosis process and devising effective personalized therapies that enabled some CRC patients to obtain clinical benefits [4,5,6]. Nevertheless, because CRC is a heterogeneous disease manifested by various driving mutations, there is a need for further research to find novel biomarkers and therapeutic targets. Therefore, based on the knowledge that tumorigenesis may be accompanied by genetic alterations leading to GIN, we selected kinesin family member 11 (KIF11) and kinesin family member 14 (KIF14) involved in the cell division as potential biomarkers of CRC, the impaired expression of which may be associated with CRC pathogenesis and/or shorter survival time of CRC patients.
Due to the above, the first stage of the present study was the immunohistochemical evaluation of KIF11 and KIF14 expression and distribution both in colorectal cancer specimens and nontumor adjacent tissues. The obtained protein expression data were used to assess the protein correlation, as well as to examine the expression levels with regards to clinicopathological variables and overall survival (OS) of CRC patients. The same analyses were performed based on the gene expression data sourced from The Cancer Genome Atlas (TCGA) and Genotype-Tissue Expression (GTEx) databases for colorectal cancer tumors and normal colon mucosa samples, respectively. Finally, a functional enrichment analysis based on the top 50 genes positively correlated with KIF11 or KIF14 was performed to predict biological functions and pathways related to KIF11 or KIF14 in CRC.

2. Results

2.1. Immunohistochemical Expression of KIF11 and KIF14 Proteins: Association with Clinicopathological Parameters

KIF11 labeling was cytoplasmic with occasional concurrent staining of the membrane (n = 4/86; 4.65%) in cancer cells and fully restricted to the cytoplasm in nontumor cells (Figure 1A–C). In the case of KIF14, tumor tissues demonstrated cytoplasmic labeling but accompanied by nuclear or membranous staining in some CRC samples (n = 28/86, 32.56% and n = 12/86, 13.95%, respectively). In nontumor tissues, it was primarily membranous-cytoplasmic immunoreactivity with simultaneous nuclear staining in several cases (n = 9/24; 37.5%; Figure 1D–F). Based on cut-off values established for KIF11 and KIF14, the positive expression of these proteins was found in 25 (29.07%) and 29 (33.72%) CRC cases, while regarding the control group, it was 4 (16.67%) and 16 (66.67%) cases, respectively. According to the above data, the expression level of KIF11 was significantly up-regulated in CRC tissues in comparison to the adjacent noncancerous tissues (p = 0.0002; Figure 2A) and down-regulated in the case of KIF14 (p < 0.001; Figure 2B).
The level of KIF11 expression did not demonstrate a statistically significant relationship with any examined clinicopathological features of CRC patients (p > 0.05; Table 1). In turn, the aberrant expression of KIF14 was markedly associated with vascular invasion (VI) in CRC samples (p = 0.01; Table 1). Apart from that, no relationships between KIF14 expression status and the remaining clinicopathological data, such as age, gender, grading, perineural invasion (PNI) as well as pT, pN and pM status were found (p > 0.05; Table 1). Furthermore, there was no significant correlation between KIF11 and KIF14 expression levels (r = 0.179; p = 0.099).

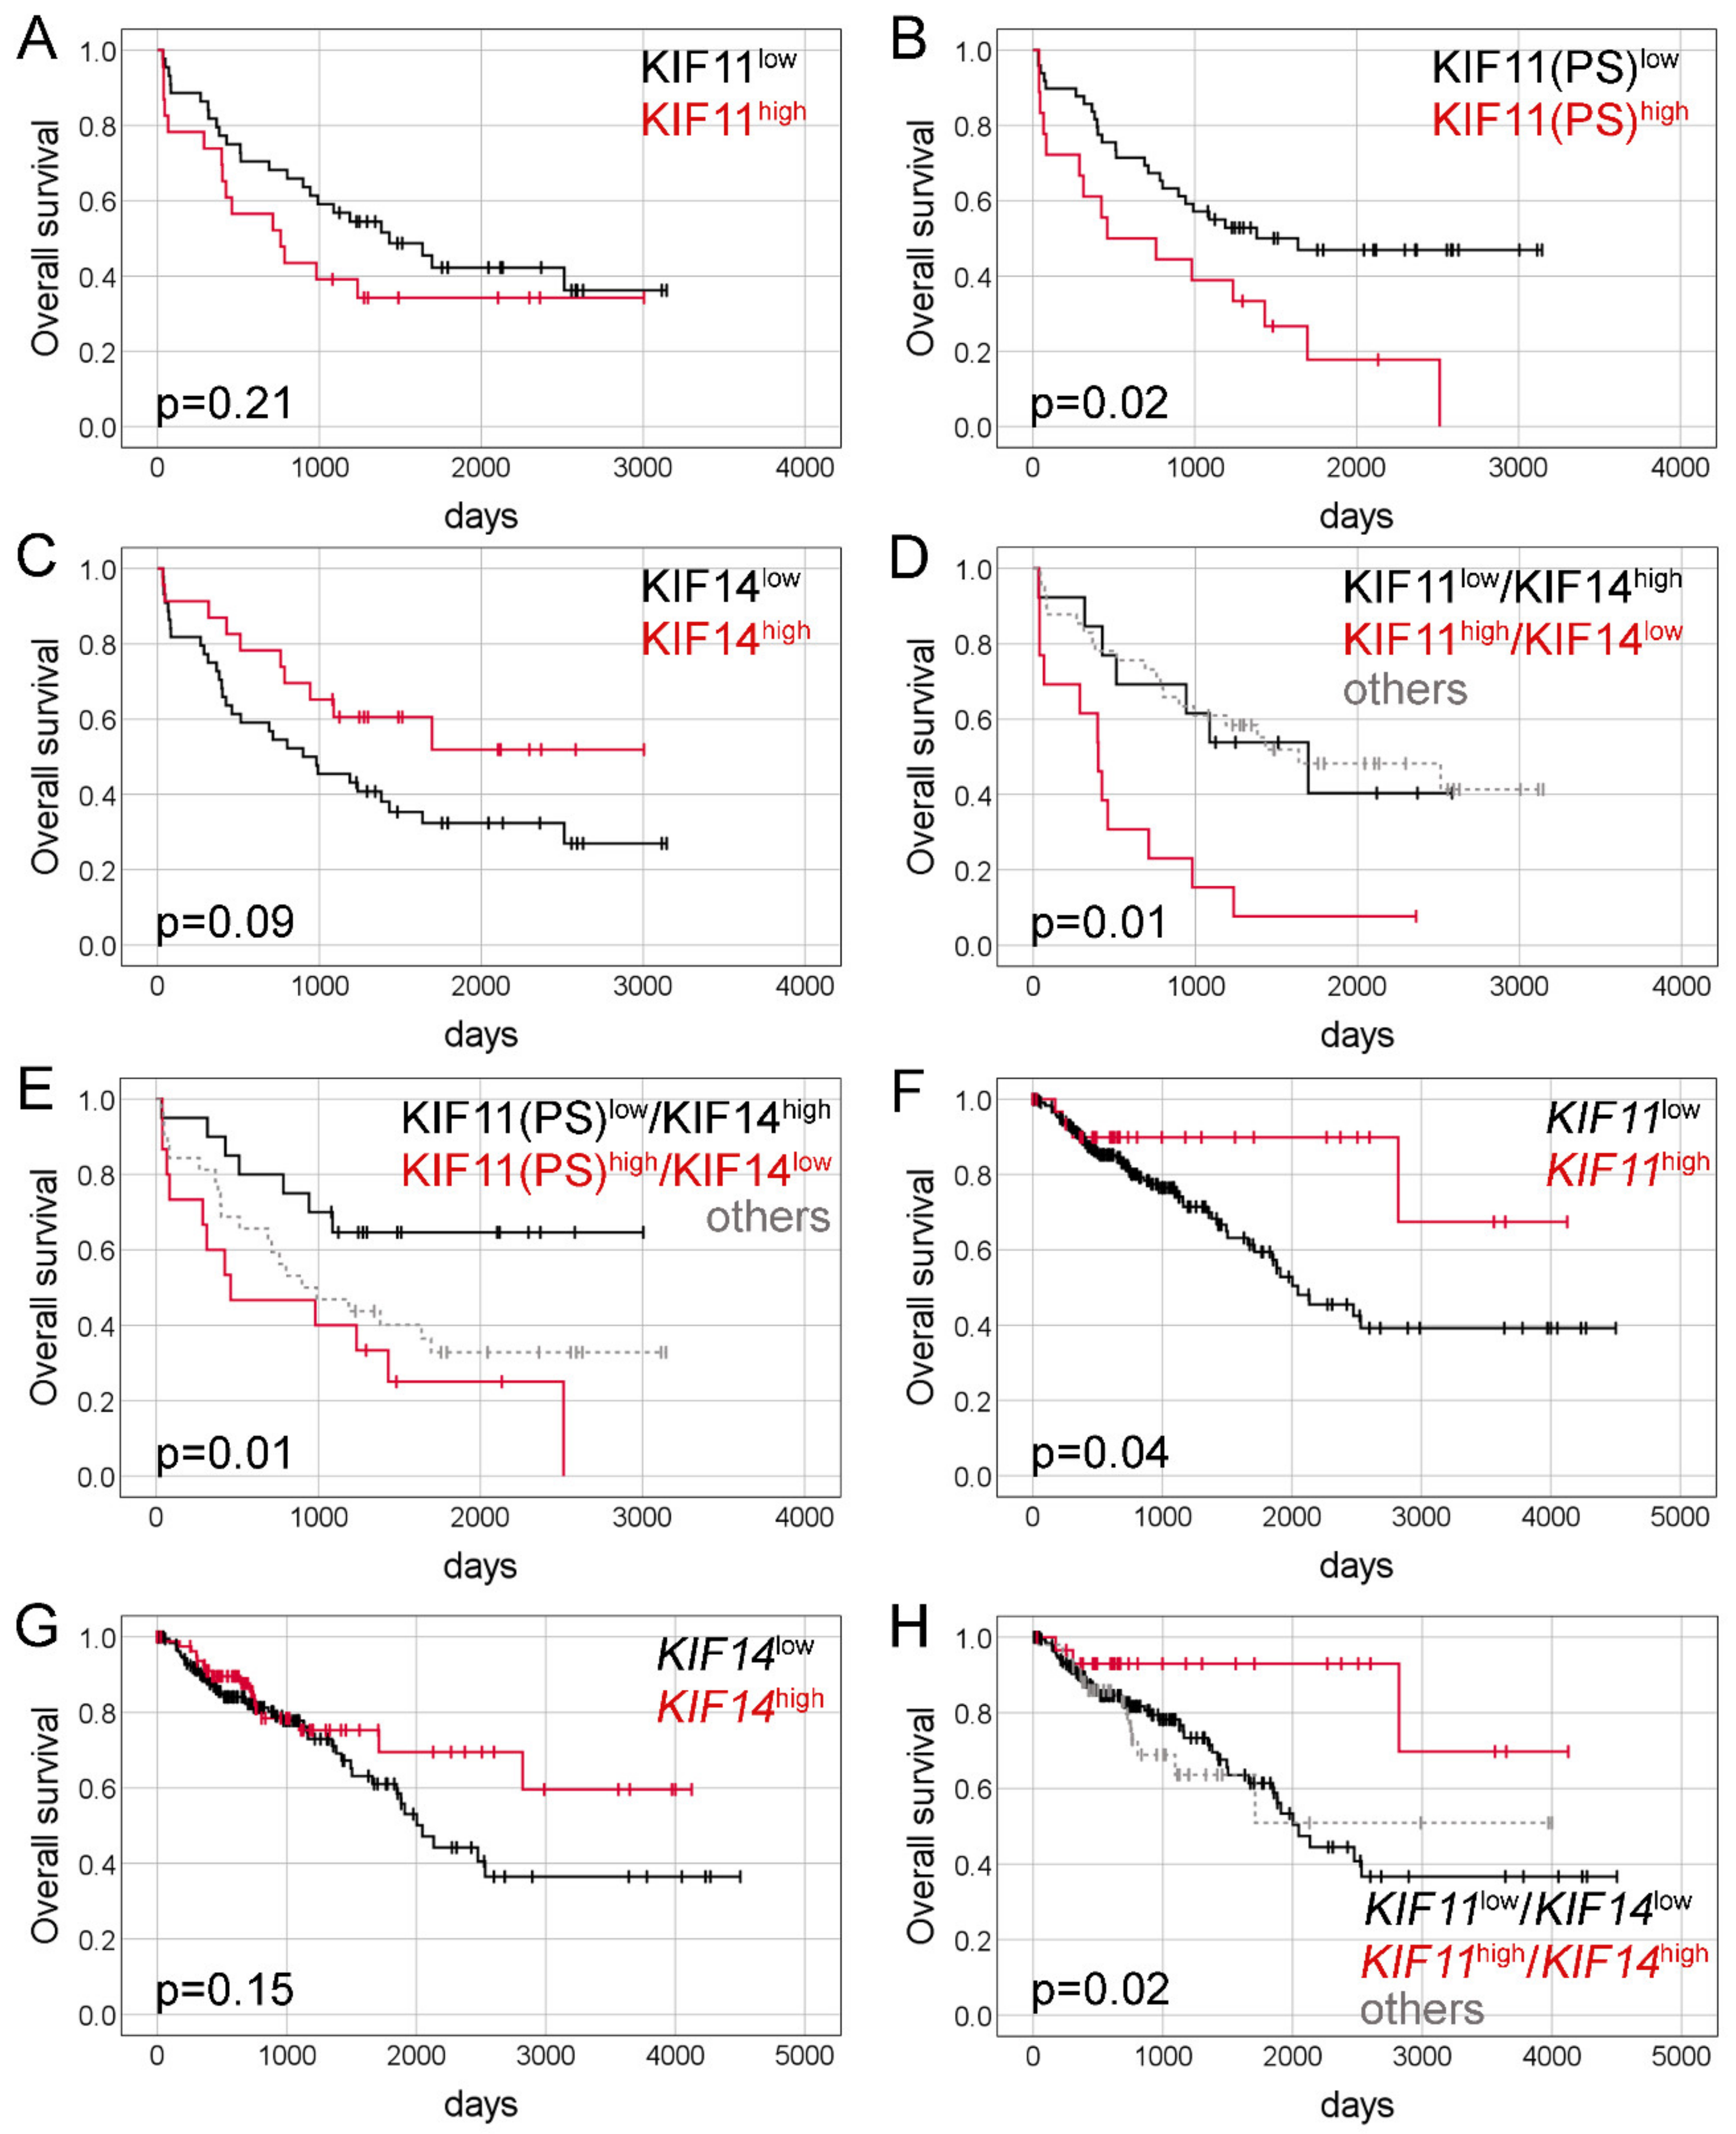
2.2. Immunohistochemical Expression of KIF11 and KIF14 Proteins: Association with Overall Survival

Kaplan-Meier survival analysis indicated that KIF11 expression by IRS score was not associated with OS time of CRC patients (p = 0.21; Figure 3A). The median survival time for the patients with a high and low level of KIF11 expression was 760 days and 1432 days, respectively. However, when PS (cut-point = 2.3) instead of IRS was taken as a measure of KIF11 expression, the same analysis demonstrated that CRC patients with KIF11 overexpression (n = 23) had markedly shorter OS time than those with KIF11 underexpression (459 days vs. 1637 days, p = 0.02; Figure 3B). In the case of KIF14, Kaplan-Meier estimation revealed that high expression of this protein was related to better OS, although this was not a significant association (not reached vs. 899 days, p = 0.09, Figure 3C). When both these markers were evaluated together, CRC patients who coexpressed KIF11 (IRS) at high level and KIF14 at low level had markedly shorter OS than those with the opposite expression pattern (400 days vs. 1696 days; p = 0.01; Figure 3D); a similar relationship was found when PS was used to measure KIF11 expression (459 days vs. not reached; p = 0.01; Figure 3E).
Univariate Cox analysis identified KIF11 PS (HR = 2.17, 95% CI 1.14–4.12; p = 0.02), KIF11(IRS)high/KIF14low (HR = 3.33, 95% CI 1.29–8.55; p = 0.01), KIF11(PS)high/KIF14low (HR = 3.29, 95% CI 1.29–8.37; p = 0.01), and pM status (HR = 3.27, 95% CI 1.64–6.53; p = 0.001) as significant prognostic variables for OS (Table 2). KIF14 expression (HR = 0.54, 95% CI 0.26–1.10; p = 0.09) trended towards a correlation with OS (Table 2). When examined in multivariate Cox analysis, KIF11 PS (adjusted HR = 2.41, 95% CI 1.10–5.28; p = 0.03), KIF11(IRS)high/KIF14low (adjusted HR = 3.91, 95% CI 1.13–13.54; p = 0.03), KIF11(PS)high/KIF14low (adjusted HR = 5.72, 95% CI 1.74–18.83; p = 0.004), and pM status (adjusted HR = 3.09, 95% CI 1.37–6.99; p = 0.007) persisted as independent prognostic factors for OS. Notably, as compared with established prognostic markers, as well as single expression of either proteins, combined KIF11 and KIF14 expression had the highest prognostic hazard ratio values in the multivariate analysis (Table 2). After correction for bias caused by the univariate analysis, tumor grade predicted OS independently of age at diagnosis, gender, pT, pN, pM and the study (adjusted HR = 3.62, 95% CI 1.14–11.53; p = 0.03; Table 2).

2.3. Expression of KIF11 and KIF14 Genes: Association with Clinicopathological Parameters

In silico analysis demonstrated that KIF11 and KIF14 expression levels were significantly up-regulated in CRC tumors in comparison to normal tissue samples (p < 0.0001 for both; Figure 2C,D), and their overexpression was observed in 33 (11.91%) and 83 (29.96%) of CRC cases, respectively. KIF11 expression was not significantly associated with any examined clinicopathological features (p > 0.05; Table 3). In turn, elevated KIF14 levels were more frequently detected in CRC patients with lymph node metastases (p = 0.045) than in those without cancer cells in lymph nodes (36.52% vs. 25.00%). Moreover, the prevalence of KIF14 overexpression was higher in stage III-IV tumors compared to I-II ones (38.14% vs. 23.33%; p = 0.01). No other relationships between the expression level of KIF14 and examined clinicopathological features, including age, gender, pT and pM status were found (p > 0.05; Table 3).
KIF11 and KIF14 expression levels were significantly correlated with each other (r = 0.76; p < 0.0001). There were also significant correlations between KIF11 and MSI MANTIS score (r = 0.18; p = 0.003), MSIsensor score (r = 0.19; p = 0.002), and mutation count (r = 0.22; p = 0.0003), whereas KIF14 was significantly associated with mutation count (r = 0.14; p = 0.02), marginally significantly with MSIsensor score (r = 0.12; p = 0.05), but not with MSI MANTIS score (r = 0.08; p = 0.19). Both KIF11 and KIF14 were significantly associated with MSH6 (r = 0.55; p < 0.0001; r = 0.57; p < 0.0001, respectively), MSH2 (r = 0.57; p < 0.0001; r = 0.50; p < 0.0001, respectively), MLH1 (r = 0.20; p = 0.001; r = 0.19; p = 0.002, respectively), and PMS2 (r = 0.20; p = 0.001; r = 0.32; p < 0.0001, respectively).

2.4. Expression of KIF11 and KIF14 Genes: Association with Overall Survival

Kaplan-Meier survival analysis demonstrated that high KIF11 expression was noticeably associated with better OS of CRC patients (not reached vs. 2047 days; p = 0.04; Figure 3F). Likewise, patients with overexpression of KIF14 tended to survive longer than those with its underexpression (not reached vs. 2047 days), although the survival difference was statistically insignificant (p = 0.15; Figure 3G). Moreover, CRC patients with simultaneous high expression of KIF11 and KIF14 had markedly better OS than those with low-level expression of both genes (not reached vs. 2047 days; p = 0.02; Figure 3H).
In the univariate Cox analysis, KIF11 (HR = 0.36, 95% CI 0.13–0.996; p = 0.049), combined KIF11/KIF14 expression (HR = 0.27, 95% CI 0.08-0.88; p = 0.03), tumor stage (HR = 2.60, 95% CI 1.55–4.35; p = 0.001) as well as pT (HR = 3.21, 95% CI 1.17–8.84; p = 0.02), pN (HR = 2.46, 95% CI 1.50–4.04; p < 0.0001), and pM status (HR = 4.21, 95% CI 2.34–7.56; p < 0.0001) were significantly correlated with OS (Table 4). Multivariate Cox proportional hazards models validated high KIF11 (adjusted HR = 0.32, 95% CI 0.11–0.89; p = 0.03) and KIF11+KIF14 (adjusted HR = 0.22, 95% CI 0.07–0.71; p = 0.01) as positive, and advanced tumor stage as negative, markers for OS (Table 4). Importantly, after correction for bias caused by the univariate analysis, elevated KIF14 expression (adjusted HR = 0.47, 95% CI 0.26–0.86; p = 0.02), as well as higher age, appeared as an independent positive or negative prognostic factor for OS, respectively (Table 4).

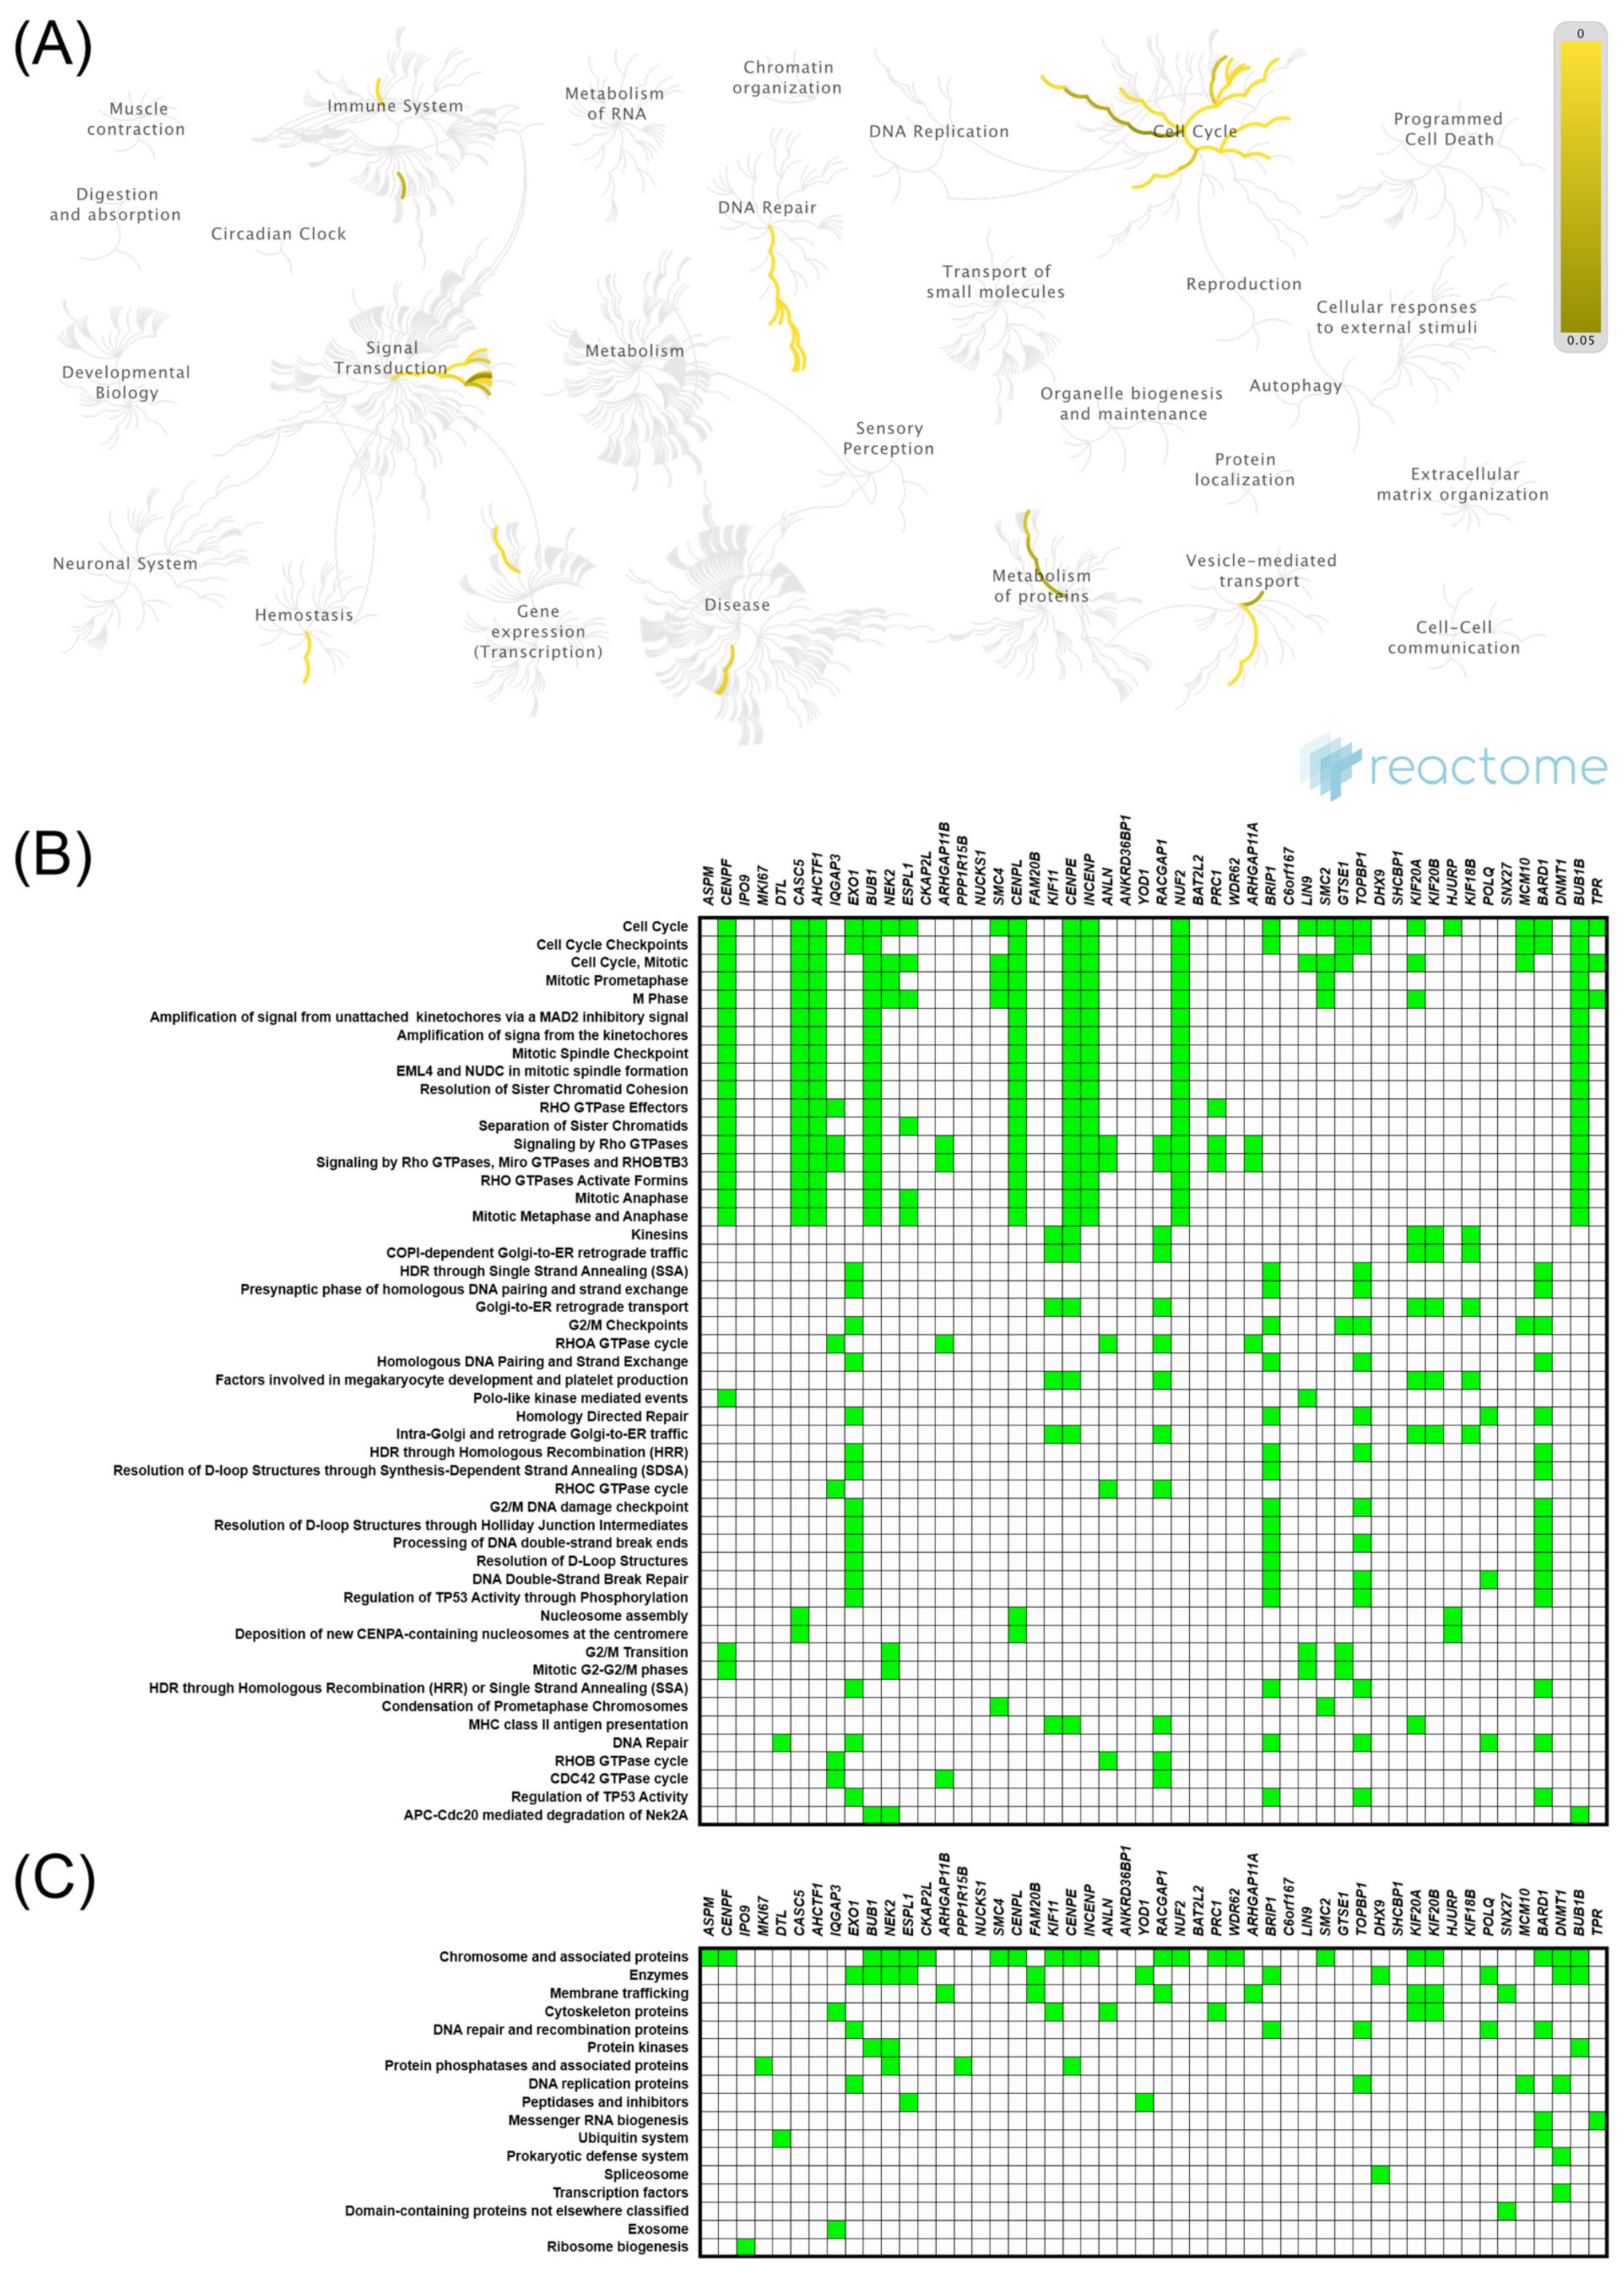
2.5. Expression of KIF11 and KIF14 Genes: Functional Enrichment Analysis

The top 50 genes that were positively correlated (upregulated DEGs; uDEGs) with KIF11 or KIF14 in colon cancer tissues were determined using TCGA dataset and the UALCAN web-based tool. Centrosomal Protein 55 (CEP55) and Rho GTPase activating protein 11A (ARHGAP11A) had the highest positive correlation with KIF11 (Spearman’s correlation coefficient r ≥ 0.80), whereas abnormal spindle-like microcephaly-associated protein (ASPM) and centromere protein F (CENPF) were the top positively correlated genes with KIF14 (r ≥ 0.85). Both KIFs were also strongly correlated with MKI67 (r ≥ 0.72). Correlation analysis of CRC patients enrolled from TCGA via the UCSC Xena database confirmed these correlations (KIF11 and CEP55: r = 0.84; p < 0.0001; KIF11 and ARHGAP11A: r = 0.77; p < 0.0001; KIF14 and ASPM: r = 0.90; p < 0.0001; KIF14 and CENPF: r = 0.89; p < 0.0001; KIF11 and MKI67: r = 0.78; p < 0.0001; KIF14 and MKI67: r = 0.74; p < 0.0001).
uDEGs were inputted into the STRING and Cytoscape, where the PPI networks were constructed, in which 50 nodes correlating with either KIF11 (Figure S1) or KIF14 (Figure S2) formed the networks with 937 or 454 edges, respectively (PPI enrichment p values < 1.0 × 10⁻¹⁶; local clustering coefficient 0.92 and 0.72). The hub genes in the PPI networks were obtained with the Cytoscape plugin cytoHubba, taking degree as a node ranking method. The top 10 hub genes in the KIF11-correlated network are displayed in Figure S1, of which CDK1 and BUB1 have the highest scores. Figure S2 comprises similar analysis for KIF14, whereby it is CENPE and BUB1B that are the hub genes in this network. Furthermore, we performed Reactome and KEGG BRITE enrichment analyses to predict the putative functions of KIF11 or KIF14. The Reactome Pathway hierarchy panels for the top 50 genes coexpressed with KIF11 or KIF14 are illustrated in Figure 4A and Figure 5A, respectively. Reactome pathway analysis for KIF11 showed that the co-upregulated genes were mainly involved in “cell cycle, mitotic”, “mitotic prometaphase”, “cell cycle checkpoints”, “resolution of sister chromatid cohesion”, “condensation of prometaphase chromosomes”, and “amplification of signal from the kinetochores” (Figure 4A,B). KEGG BRITE functional hierarchies for KIF11 showed that the coupregulated genes had the preponderance of genes representing “chromosome and associated proteins”, “enzymes”, “membrane trafficking proteins”, “protein kinases”, “DNA replication proteins”, “cytoskeleton proteins”, and “DNA repair and recombination proteins”, among others (Figure 4C). Similar results were obtained for KIF14, and details of these analyses are depicted in Figure 5.
GO function enrichment was performed with genes coexpressed with either KIF11 or KIF14 using the DAVID tool to analyze their possible activities in biological processes, molecular functions, and cellular components. In GO analysis for KIF11 and its coexpressed genes, the most enriched ontology terms were GO:0051301 (cell division; Figure 6A), GO:0030496 (midbody; Figure 6B), and GO:0003777 (microtubule motor activity; Figure 6C). Likewise, the enriched functional GO terms related to the KIF14-gene network included GO:0007067 (mitotic nuclear division; Figure 7A), GO:0005654 (nucleoplasm; Figure 7B), and GO:0008017 (microtubule binding; Figure 7C).

3. Discussion

Over the last few years, numerous studies aiming to identify novel biomarkers involved in colorectal cancer pathogenesis and progression have been carried out. Findings in this field focused scientists’ attention on genome instability, especially microsatellite and chromosome instability, as a crucial driving force in colorectal tumorigenesis, and consequently allowed establishment of several diagnostically and clinically valuable CRC biomarkers [3]. We considered that this research direction is justifiable and requires continuation. Therefore, based on the scientific literature [7,8,9,10,11], we chose mitosis and cytokinesis proteins, KIF11 and KIF14, as factors of potential diagnostic and prognostic value in CRC, since their aberrant expression has been suspected to underlie GIN. At first, we assessed the immunohistochemical expression of proteins in the context of selected clinicopathological traits and the overall survival of CRC patients. Thereafter, the same analyses were performed using KIF11 and KIF14 mRNA expression data retrieved from public sources. Finally, the genes coexpressed with KIF11 or KIF14 in colon adenocarcinoma were identified and functionally annotated.
KIF11 (also known as EG5) is a motor protein belonging to the kinesin-like protein family. It is responsible for spindle dynamics, as it takes part in chromosome positioning, centrosome separation, and bipolar spindle formation during mitosis [12,13]. KIF11 expression was found to be altered and associated with patient survival in numerous types of human cancer, which suggests its contribution to cancer development and progression [14,15,16,17,18]. Nevertheless, to our best knowledge, apart from the current report, only one research to date has presented a clinical value of KIF11 protein for survival stratification of CRC patients [19]. In that study, Imai et al. evaluated the immunoexpression of KIF11 in CRC tissues taking into account percentage score and, based on this, KIF11-positivity was reported to be more than twice as high compared to percentage positivity obtained by us (62% vs. 27%). However, they set the cut-off point at 10% of stained tumor cells, while our positivity threshold was set higher, at no less than 25%. Nevertheless, it should be emphasized that as the primary readout we decided to use the IRS score, which incorporates both intensity and proportion. This was because various staining intensities are frequently observed in clinical practice, and these may have a biological meaning. Indeed, our recent pancreatic cancer data on KIF11 has revealed that the IRS scoring system was more informative for prognosis than PS itself [20]. Importantly, in our studies, we avoided choosing arbitrary cut-off values for the interpretation of target protein expression, and therefore we adopted outcome data-derived method from the Evaluate Cutpoint software [21]. Nevertheless, we agree that the evaluation of immunoexpression in terms of the proportion of the positive staining cells seems adequate in CRC tissues, as in our series it was PS score and not IRS score that was significantly associated with patient prognosis. Specifically, we found that high KIF11 expression via proportion score may serve as a potential predictor of dismal survival rates in CRC, independently of age at diagnosis, gender, grade, and T, N, and M stages. This finding was in contrast to the study of Imai et al., who did not see any significant impact of KIF11 expression on the survival of CRC patients [19]. However, it fits well with the functional portrait of KIF11 in most tumor types studied to date [15,16,17,18,22]. Moreover, we did not find any correlations of either IRS score or PS score (Supplementary Table S1) with clinicopathological parameters of CRC patients, which further supports the independence of KIF11 expression from potential confounders. Contrary to our study, Imai et al. demonstrated a significant association of KIF11 expression via PS score with pT status and degree of cancer differentiation. Moreover, they showed that KIF11 overexpression was an early event in CRC pathogenesis, as it was detected both in low-grade and high-grade tumors with a similar high frequency. Our cohort of patients was characterized by a specific distribution of the clinicopathological data. It did not contain pT1 and G1 tumors, which was a limitation of the current study and, simultaneously, the probable reason why we could not verify correlations presented by Imai et al., as well as another explanation for the lower positivity rate of KIF11 expression among our cases. Finally, a distinct KIF11 staining pattern was observed between our CRC cohort and that of Imai et al. [19]. In our hands, the staining pattern for KIF11 was predominantly cytoplasmic, whereas Imai and coworkers observed mainly nuclear staining of CRC cells, likely due to the use of different antibodies. In turn, in agreement with our results, the cited authors showed that the mRNA levels of KIF11 were significantly upregulated in CRC tissues versus normal tissues. Similar results were reported by Zhou et al., who also revealed the clinicopathological relevance of KIF11 mRNA in CRC by showing that its high expression was intimately correlated with clinical parameters, such as T stage, TNM stage, Ki-67 status and vessel invasion [23]. As far as we are aware, the current report is, however, the first to present prognostic significance of KIF11 mRNA in CRC. Although we observed the same expression status for KIF11 protein and mRNA in CRC tissues (upregulation for both), they carried the opposite prognostic significance. Indeed, in contrast to KIF11 protein, high KIF11 mRNA was associated with noticeably better OS and constituted an independent predictor of improved OS in the TCGA cohort. This finding contradicts the reported poor prognosis of ovarian, pancreatic, breast or non-small cell lung cancer patients overexpressing KIF11 mRNA [20,24,25,26]. Nevertheless, given that protein levels equate more closely with function than mRNA levels [27], it is likely that elevated KIF11 expression is functionally linked to an adverse prognosis in CRC. In support of this notion, Imai et al. showed that knockdown of KIF11 in CRC and other gastrointestinal (GI) cancer cell lines significantly reduced the number and size of spheres formed by analyzed cells [19,28]. In the light of this and our protein data, it seems that KIF11 may produce a novel molecular target for colorectal cancer therapy.
KIF14 is a microtubule motor protein belonging to the kinesin-3 family that is known to play an essential role in cytokinesis during cell division through the internal motor domain with microtubule-dependent ATPase activity, but it is also involved in other biological processes such as proliferation, intracellular transport, and apoptosis [29,30,31]. KIF14 is called an oncogenic kinesin, and most reports have shown that it is overexpressed in numerous human cancers and correlated with a poor prognosis [32,33,34,35]. However, there are also studies implying the tumor-suppressive function of KIF14 in some tumors [20,36]; thus, its precise role may be tumor and/or context-dependent. Despite its importance, as far as we are aware, the current study is the first to investigate the clinical value of KIF14 protein in CRC patients. According to our results, and unlike the data published for other examined cancers, KIF14 protein expression was downregulated in CRC tissues compared to the adjacent noncancerous tissues. In turn, KIF14 mRNA expression was upregulated in tumors compared to normal tissues, which is in line with the previous reports on various cancers, including colorectal cancer [37,38,39,40,41,42]. A mismatch between mRNA and protein levels has been frequently observed and extensively debated in the literature [43,44]. It is widely accepted that mRNA expression correlates too weakly with protein expression for it to be a reliable predictor of protein expression [45], supporting the importance of profiling mRNA levels in parallel to protein abundance and degradation rates [46]. This has been particularly demonstrated with transcription factors, signaling genes, chromatin modifying genes, and genes with cell-cycle-specific functions, which are known to have unstable mRNA and unstable protein [43]. Consistent with its primary role in cell division, KIF14 would be expected to have a negative correlation between mRNA and protein. Furthermore, even though CRC has been shown to be enriched for negative correlations between protein and mRNA expression patterns [47], there is still a need to validate whether indeed protein and mRNA levels of KIF14 are discordantly expressed in CRC tissues, whereby both measurements should be performed simultaneously in the same cases.
Notably, in our Kaplan-Meier analysis, a certain trend towards the association between KIF14 status and OS in patients with CRC was revealed. In the multivariate Cox model, accounting for additional covariates, the strength of the association increased and was statistically significant. Thus, the present investigation identified KIF14 expression as an independent favorable prognostic factor, although it was not reflected in the other report demonstrating that KIF14 gene expression did not affect the survival of CRC patients [42]. Contrary to the TCGA cohort used in the present study, the cited research was carried out on a relatively small cohort group of patients with little ethnic diversity, and cut-off values for high and low gene expression were established using different methods, which may explain the divergent results. In our study, a suggestive association between KIF14 expression and better overall survival of CRC patients was found also at the protein level. The current study may simply have been underpowered to observe a significant impact of KIF14 protein, because of the relatively small number of cases in our cohort. Therefore, our results await replication in future studies with expanded sample sizes.
Having established clinical significance of KIF11 and KIF14 in CRC, we performed the Reactome Pathway, GO terms enrichment, and KEGG BRITE of genes coexpressed with them to predict the biological processes of the KIFs in the pathology of these tumors. Recent experimental research has suggested that the aberrant expression of KIF11 (either upregulation [48] or silencing [23,49]), may be a pathogenic event contributing to cancer development and/or progression through genomic instability. KIF11 was also identified as chromosome instability (CIN) gene in HCT116 colorectal cancer cell line [49]. Hence, it is not unexpected that the gene sets related to the cell cycle, DNA replication, DNA repair and recombination, among others, were positively associated with KIF11 expression in CRC tissues of the TCGA cohort, since dysregulation of these processes is considered the main sources of GIN [50,51]. Using this resource, we explored several measures related to genomic instability, including the MSI MANTIS score [52], MSIsensor score [53], and mutation count, and found their positive correlations with KIF11 expression. Furthermore, KIF11 was positively associated with the expression of mismatch repair (MMR) genes—MSH6, MSH2, MLH1, and PMS2, as well as the MKI67 gene (coding for proliferation marker Ki-67), which is in agreement with the observations that development of GIN is paralleled by the upregulation of MMR genes and overlaps with the proliferative activity of tumor cells [54,55,56]. Given that mRNA levels of KIF11 and KIF14 were positively and strongly correlated with each other in CRC tissues, the functional and pathway analysis for KIF14 allowed us to capture similar underlying biological processes as for KIF11, including the cell cycle; hence, the associated molecular components were e.g., chromosome-associated proteins. This seems consistent with the premise that GIN is possibly assisted by aberrant KIF14 expression, which is supported by both experimental [30] and clinical (noncolorectal) [57,58] data. Therefore, we suggest that the marked differences in the survival outcome of CRC patients are at least partially based on genome instability, which occurs due to the failures of the genome stability pathways, of which KIF11 and KIF14 seem to be important players. Although GIN is a fundamental phenomenon of almost all human cancers, the exact role of these comprehensive processes at each stage of tumorigenesis is still obscure [59]. However, it is becoming clear that in some contexts, and depending on the level of genomic damage, GIN may either drive tumor progression or suppression [60]. Simultaneously, given that excessive CIN is lethal, tumors may select for alterations that antagonize the effects of excessive chromosome segregation errors, and increased genome stability can be selected to aid tumor growth [61]. Future works are, therefore, needed for a precise understanding of the molecular mechanisms underlying the prognostic effect of KIF11 and KIF14 in CRC.
This study has several limitations. The first is the source and nature of datasets, as our protein and mRNA data were not collected in single experiments on the same samples, and both datasets have a retrospective nature. The second is the lack of experimental verification. Even if the prognostic relevance of KIF11 and KIF14 for CRC was established, and underlying biological processes were predicted, the deep molecular mechanisms remained unknown. Moreover, missing values were present in our retrospective cohort study, which could reduce a statistical power of the study and the representativeness of the samples. Thus, further investigations are required to evaluate the model performance based on a larger cohort with complete data.

4. Materials and Methods

4.1. Tissue Material and Clinicopathological Data

The research was performed on formalin-fixed paraffin-embedded (FFPE) tissue samples including 86 CRC tumors and 24 adjacent noncancerous mucosa specimens collected from patients undergoing colectomy due to adenocarcinoma between 2010 to 2017, constituting the archival tissue collection of the Department of Clinical Pathomorphology, Collegium Medicum in Bydgoszcz, Nicolaus Copernicus University in Toruń (Poland). The clinical stages of all CRC tumors were reexamined according to the TNM 8th edition classification of the American Joint Committee on Cancer (AJCC) criteria [62]. A part of this cohort was previously described [63]. The study protocol was approved by the Bioethics Committee at Collegium Medicum in Bydgoszcz of Nicolaus Copernicus University in Toruń (no. 337/2018).

4.2. Survival Data

Of 86 CRC patients, 19 were excluded from survival analysis because of the lack of survival data or due to postoperative death occurring within 30 days after surgery. Finally, survival analysis was performed using survival data of 67 CRC patients. OS was defined as the time from resection until all-cause death or until the last follow-up date. The median OS time was 1188 days, while the median follow-up time was 2104 days.

4.3. Immunohistochemical Analysis

Tissue microarrays (TMAs) construction and then immunohistochemical staining of slides with tissuecores were performed as previously described [63]. For the majority of cases, four 2.0 mm cores were sampled from different tumor areas. For several cases (n = 7 and 6), a single 2-mm tissue core per donor tissue was used. Evaluation of KIF11 and KIF14 protein expression was carried out using the primary antibodies including rabbit polyclonal anti-KIF11 (1:500, 32 min; cat. no: PA5-82394, Thermo Fisher Scientific, Waltham, MA, USA) and rabbit polyclonal anti-KIF14 (1:150, 30 min; cat. no: HPA038061, Sigma-Aldrich, St. Louis, MO, USA), respectively. Thereafter, antigen-antibody complexes were visualized with the EnVision FLEX+ System (Dako, Agilent Technologies, Santa Clara, CA, USA) according to the manufacturer’s instructions. The semiquantitative assessment of the protein expression level was performed by two pathologists (IND, DG) at 20× original objective magnification. The staining score was based on the modified Remmele and Stegner scale (IRS; 0–12) [64] obtained by multiplying the percentage of positively stained cells/tissue area (PS; 0 < 5%; 1 = 5–24%; 2 = 25–49%, 3 = 50–74%; 4 ≥ 75%) and intensity of staining (IS; 0—negative, 1—weak, 2—moderate, 3—strong) for both KIF11 and KIF14. The cutoff points allowing segregation of immunoexpression levels of selected proteins into low and high were determined using the cutp function of the Evaluate Cutpoints application [21] and were 3.3 for KIF11 and 5.5 for KIF14. Scores below these values were interpreted as negative (low expression), whereas equal or above were defined as positive (high expression). Cases with the coexpression of KIF11high and KIF14low were analyzed against those with the opposite expression pattern (KIF11low/KIF14high), whereas ‘others’ defined cases expressing either both proteins at high levels, or both at low levels (KIF11high/KIF14high, KIF11low/KIF14low).

4.4. In Silico Analysis

Data including KIF11 and KIF14 expression levels of 277 CRC tumors and 303 noncancerous colon mucosa samples were downloaded from the TCGA and Genotype-Tissue Expression (GTEx) databases via UCSC Xena Browser (http://xena.ucsc.edu/, accessed on 22 June 2021) [65], whereas clinicopathological characteristics of CRC patients were obtained from the TCGA database using www.cBioPortal.org, accessed on 22 June 2021. KIF11 and KIF14 expression data were normalized by DESeq2 normalization and then divided into two groups based on the cut-off points determined with the Evaluate Cutpoints application [21]. Values lower than 11.81 for KIF11 and 9.63 for KIF14 indicated negative expression of examined genes, while values equal or higher than established cut-off points were interpreted as positive. Cases with the coexpression of high levels of KIF11 and KIF14 were analyzed against those with the opposite expression profile (KIF11low/KIF14low), whereas “others” defined cases where only one gene was highly expressed (KIF11high/KIF14low, KIF11low/KIF14high). To identify prognostic factors for OS (median OS = 2475 days) in the TCGA cohort, a survival analysis based on data available for 271 CRC patients was performed. In addition, the top 50 genes positively correlated with KIF11 or KIF14 in colon adenocarcinoma were analyzed using the UALCAN web portal (http://ualcan.path.uab.edu/, accessed on 22 June 2021) [66] and TCGA dataset. Pathway analysis and visualization were performed using the Reactome pathway database (https://reactome.org, accessed on 22 June 2021) [67], while the Kyoto Encyclopedia of Genes and Genomes (KEGG) BRITE (https://www.genome.jp/kegg/brite.html, accessed on 22 June 2021) was used to examine functional hierarchies of KIF11 or KIF14 and the top 50 coexpressed genes. The STRING database (https://string-db.org, accessed on 30 August 2021) [68] and Cytoscape tool [69] were utilized to construct a protein-protein interaction network (PPI) of the top 50 genes coexpressed with either KIF11 or KIF14. To find the Gene Ontology (GO) categories (cellular component (CC), biological process (BP) and molecular function (MF)) shared by KIF11- or KIF14-correlated genes, the Database for Annotation, Visualization and Integrated Discovery (DAVID; https://david.ncifcrf.gov, accessed on 30 August 2021) [70] was used.

4.5. Statistical Analysis

Statistical analysis was performed with GraphPad Prism (v8.0; GraphPad Software, San Diego, CA, USA) and SPSS software packages (v26.0, IBM Corporation, Armonk, NY, USA). Data normality was evaluated using the Shapiro Wilk test. Comparative analysis was carried out with the Mann-Whitney test for continuous variables and the Chi-squared or Fisher’s exact tests for categorical variables. The correlations between the expression of KIF11 and KIF14 were evaluated by utilizing the Spearman correlation coefficient. Survival curves were prepared with the Kaplan Meier estimation and compared by the Mantel-Cox log-rank test. To estimate the hazard ratios (HR) with 95% confidence intervals (CI), univariate and multivariate survival analyses were performed by the Cox proportional hazards model. The variables with amounts of missing data over 20% (PNI, VI) were not considered for the model. Details on missing data are depicted in Supplementary Table S2. For the in-house cohort, adjustment variables included age at diagnosis (continuous variable), gender (male vs. female), tumor grade (intermediate vs. high), pT (T1-T2 vs. T3-T4), pN (N0 vs. N1-N2), pM (absent vs. present), and the study. For multivariate survival analysis of in silico data, covariates were age at diagnosis (continuous variable), gender (male vs. female), tumor grade (low and intermediate vs. high), and stage (I-II vs. III-IV). Due to the strong correlation noted between KIF11 and KIF14 mRNA expression levels, two separate multivariate models for these transcripts were built. A p value < 0.05 was considered statistically significant.

5. Conclusions

In conclusion, our results suggest that CRC patients can be stratified into distinct risk categories not only by established clinicopathological factors but also by biological and molecular determinants such as KIF11 and KIF14 expression. Mechanistically, this is likely attributable to their role in maintaining genome integrity.

Supplementary Materials

The following are available online at https://www.mdpi.com/article/10.3390/ijms22189732/s1.

Author Contributions

Conceptualization: D.G., I.N.-D., A.K.-W. and K.T.; writing—original draft preparation: K.B., I.N.-D. and A.K.-W.; formal analysis: K.B., M.G. and A.K.-W.; visualization: K.B., M.G., A.K.-W.; staining evaluation: D.G. and I.N.-D.; investigation: J.D. and I.N.-D.; methodology: J.D.; project administration: A.K.-W.; writing—review and editing: D.G., A.K.-W.; funding acquisition: D.G. and K.T. All authors have read and agreed to the published version of the manuscript.

Funding

The study was supported by grant no. ZES.WL.4.2021 Faculty of Medicine, Ludwik Rydygier Collegium Medicum in Bydgoszcz, Nicolaus Copernicus University in Toruń.

Institutional Review Board Statement

The study was conducted according to the guidelines of the Declaration of Helsinki, and approved by the Ethics Committee of Collegium Medicum in Bydgoszcz, Nicolaus Copernicus University in Toruń (KB 337/2018; 24 April 2018).

Informed Consent Statement

Patient consent was waived due to the retrospective nature of the study. Requirement for informed consent was waived by the Ethics Committee of Collegium Medicum in Bydgoszcz, Nicolaus Copernicus University in Toruń.

Data Availability Statement

Publicly available datasets were analyzed in this study. These data can be found here: http://www.cbioportal.org/study/summary?id=paad_tcga_pan_can_atlas_2018 (accessed on 25 May 2021); https://xenabrowser.net (accessed on 25 May 2021), http://ualcan.path.uab.edu/ (accessed on 22 June 2021); https://string-db.org, accessed on 30 August 2021; https://david.ncifcrf.gov, accessed on 30 August 2021. Our own data presented in this study are available on request from the corresponding author. The data are not publicly available due to ethical restrictions.

Conflicts of Interest

The authors declare no conflict of interest.

References

  1. Sung, H.; Ferlay, J.; Siegel, R.L.; Laversanne, M.; Soerjomataram, I.; Jemal, A.; Bray, F. Global Cancer Statistics 2020: GLOBOCAN Estimates of Incidence and Mortality Worldwide for 36 Cancers in 185 Countries. CA Cancer J. Clin. 2021, 71, 209–249. [Google Scholar] [CrossRef]
  2. Rawla, P.; Sunkara, T.; Barsouk, A. Epidemiology of Colorectal Cancer: Incidence, Mortality, Survival, and Risk Factors. Prz. Gastroenterol. 2019, 14, 89–103. [Google Scholar] [CrossRef]
  3. Nguyen, L.H.; Goel, A.; Chung, D.C. Pathways of Colorectal Carcinogenesis. Gastroenterology 2020, 158, 291–302. [Google Scholar] [CrossRef] [PubMed]
  4. Westdorp, H.; Fennemann, F.L.; Weren, R.D.A.; Bisseling, T.M.; Ligtenberg, M.J.L.; Figdor, C.G.; Schreibelt, G.; Hoogerbrugge, N.; Wimmers, F.; de Vries, I.J.M. Opportunities for Immunotherapy in Microsatellite Instable Colorectal Cancer. Cancer Immunol. Immunother. 2016, 65, 1249–1259. [Google Scholar] [CrossRef] [Green Version]
  5. Afrăsânie, V.-A.; Marinca, M.V.; Alexa-Stratulat, T.; Gafton, B.; Păduraru, M.; Adavidoaiei, A.M.; Miron, L.; Rusu, C. KRAS, NRAS, BRAF, HER2 and Microsatellite Instability in Metastatic Colorectal Cancer—Practical Implications for the Clinician. Radiol. Oncol. 2019, 53, 265–274. [Google Scholar] [CrossRef] [PubMed] [Green Version]
  6. Chang, L.; Chang, M.; Chang, H.M.; Chang, F. Expending Role of Microsatellite Instability in Diagnosis and Treatment of Colorectal Cancers. J. Gastrointest. Cancer 2017, 48, 305–313. [Google Scholar] [CrossRef] [Green Version]
  7. Ding, X.; Duan, H.; Luo, H. Identification of Core Gene Expression Signature and Key Pathways in Colorectal Cancer. Front. Genet. 2020, 11, 45. [Google Scholar] [CrossRef] [Green Version]
  8. Pirim, D. Integrative Analyses of Molecular Pathways and Key Candidate Biomarkers Associated with Colorectal Cancer. Cancer Biomark. 2020, 27, 555–568. [Google Scholar] [CrossRef]
  9. Cai, Z.; Wei, Y.; Chen, S.; Gong, Y.; Fu, Y.; Dai, X.; Zhou, Y.; Yang, H.; Tang, L.; Liu, H. Screening and Identification of Key Biomarkers in Alimentary Tract Cancers: A Bioinformatic Analysis. Cancer Biomark. 2020, 29, 221–233. [Google Scholar] [CrossRef] [PubMed]
  10. Castillo, A.; Morse, H.C.; Godfrey, V.L.; Naeem, R.; Justice, M.J. Overexpression of Eg5 Causes Genomic Instability and Tumor Formation in Mice. Cancer Res. 2007, 67, 10138–10147. [Google Scholar] [CrossRef] [Green Version]
  11. Sishtla, K.; Pitt, N.; Shadmand, M.; O’Hare, M.N.; Sulaiman, R.S.; Sinn, A.L.; Condon, K.; Pollok, K.E.; Sandusky, G.E.; Corson, T.W. Observations on Spontaneous Tumor Formation in Mice Overexpressing Mitotic Kinesin Kif14. Sci. Rep. 2018, 8, 16152. [Google Scholar] [CrossRef] [PubMed] [Green Version]
  12. Zhu, C.; Zhao, J.; Bibikova, M.; Leverson, J.D.; Bossy-Wetzel, E.; Fan, J.-B.; Abraham, R.T.; Jiang, W. Functional Analysis of Human Microtubule-Based Motor Proteins, the Kinesins and Dyneins, in Mitosis/Cytokinesis Using RNA Interference. Mol. Biol. Cell 2005, 16, 3187–3199. [Google Scholar] [CrossRef] [PubMed] [Green Version]
  13. Rapley, J.; Nicolàs, M.; Groen, A.; Regué, L.; Bertran, M.T.; Caelles, C.; Avruch, J.; Roig, J. The NIMA-Family Kinase Nek6 Phosphorylates the Kinesin Eg5 at a Novel Site Necessary for Mitotic Spindle Formation. J. Cell Sci. 2008, 121, 3912–3921. [Google Scholar] [CrossRef] [PubMed] [Green Version]
  14. Daigo, K.; Takano, A.; Thang, P.M.; Yoshitake, Y.; Shinohara, M.; Tohnai, I.; Murakami, Y.; Maegawa, J.; Daigo, Y. Characterization of KIF11 as a Novel Prognostic Biomarker and Therapeutic Target for Oral Cancer. Int. J. Oncol. 2018, 52, 155–165. [Google Scholar] [CrossRef] [Green Version]
  15. Pei, Y.-Y.; Li, G.-C.; Ran, J.; Wei, F.-X. Kinesin Family Member 11 Contributes to the Progression and Prognosis of Human Breast Cancer. Oncol. Lett. 2017, 14, 6618–6626. [Google Scholar] [CrossRef] [Green Version]
  16. Liu, J.; Tian, Y.; Yi, L.; Gao, Z.; Lou, M.; Yuan, K. High KIF11 Expression Is Associated with Poor Outcome of NSCLC. Tumori J. 2021, 300891620988342. [Google Scholar] [CrossRef]
  17. Liu, C.; Zhou, N.; Li, J.; Kong, J.; Guan, X.; Wang, X. Eg5 Overexpression Is Predictive of Poor Prognosis in Hepatocellular Carcinoma Patients. Dis. Markers 2017, 2017, 2176460. [Google Scholar] [CrossRef] [Green Version]
  18. Jin, Q.; Dai, Y.; Wang, Y.; Zhang, S.; Liu, G. High Kinesin Family Member 11 Expression Predicts Poor Prognosis in Patients with Clear Cell Renal Cell Carcinoma. J. Clin. Pathol. 2019, 72, 354–362. [Google Scholar] [CrossRef] [Green Version]
  19. Imai, T.; Oue, N.; Sentani, K.; Sakamoto, N.; Uraoka, N.; Egi, H.; Hinoi, T.; Ohdan, H.; Yoshida, K.; Yasui, W. KIF11 Is Required for Spheroid Formation by Oesophageal and Colorectal Cancer Cells. Anticancer Res. 2017, 37, 47–55. [Google Scholar] [CrossRef] [Green Version]
  20. Klimaszewska-Wiśniewska, A.; Neska-Długosz, I.; Buchholz, K.; Durślewicz, J.; Grzanka, D.; Kasperska, A.; Antosik, P.; Zabrzyński, J.; Grzanka, A.; Gagat, M. Prognostic Significance of KIF11 and KIF14 Expression in Pancreatic Adenocarcinoma. Cancers 2021, 13, 3017. [Google Scholar] [CrossRef]
  21. Ogłuszka, M.; Orzechowska, M.; Jędroszka, D.; Witas, P.; Bednarek, A.K. Evaluate Cutpoints: Adaptable Continuous Data Distribution System for Determining Survival in Kaplan-Meier Estimator. Comput. Methods Programs Biomed. 2019, 177, 133–139. [Google Scholar] [CrossRef]
  22. Sun, P.; Cao, X.; Liu, Y.; Jia, L. Eg5 High Expression Predicts Dismal Prognosis in Epithelial Ovarian Cancer. Blood Genom. 2019, 3, 145–151. [Google Scholar] [CrossRef]
  23. Zhou, Y.; Yang, L.; Xiong, L.; Wang, K.; Hou, X.; Li, Q.; Kong, F.; Liu, X.; He, J. KIF11 Is Upregulated in Colorectal Cancer and Silencing of It Impairs Tumor Growth and Sensitizes Colorectal Cancer Cells to Oxaliplatin via P53/GSK3β Signaling. J. Cancer 2021, 12, 3741–3753. [Google Scholar] [CrossRef]
  24. Zhang, L.; Sun, L.; Zhang, B.; Chen, L. Identification of Differentially Expressed Genes (DEGs) Relevant to Prognosis of Ovarian Cancer by Use of Integrated Bioinformatics Analysis and Validation by Immunohistochemistry Assay. Med. Sci. Monit. 2019, 25, 9902–9912. [Google Scholar] [CrossRef] [PubMed]
  25. Li, T.-F.; Zeng, H.-J.; Shan, Z.; Ye, R.-Y.; Cheang, T.-Y.; Zhang, Y.-J.; Lu, S.-H.; Zhang, Q.; Shao, N.; Lin, Y. Overexpression of Kinesin Superfamily Members as Prognostic Biomarkers of Breast Cancer. Cancer Cell Int. 2020, 20, 123. [Google Scholar] [CrossRef] [Green Version]
  26. Schneider, M.A.; Christopoulos, P.; Muley, T.; Warth, A.; Klingmueller, U.; Thomas, M.; Herth, F.J.F.; Dienemann, H.; Mueller, N.S.; Theis, F.; et al. AURKA, DLGAP5, TPX2, KIF11 and CKAP5: Five Specific Mitosis-Associated Genes Correlate with Poor Prognosis for Non-Small Cell Lung Cancer Patients. Int. J. Oncol. 2017, 50, 365–372. [Google Scholar] [CrossRef] [PubMed] [Green Version]
  27. Greenbaum, D.; Colangelo, C.; Williams, K.; Gerstein, M. Comparing Protein Abundance and MRNA Expression Levels on a Genomic Scale. Genome Biol. 2003, 4, 117. [Google Scholar] [CrossRef] [Green Version]
  28. Imai, T.; Oue, N.; Nishioka, M.; Mukai, S.; Oshima, T.; Sakamoto, N.; Sentani, K.; Matsusaki, K.; Yoshida, K.; Yasui, W. Overexpression of KIF11 in Gastric Cancer with Intestinal Mucin Phenotype. Pathobiology 2017, 84, 16–24. [Google Scholar] [CrossRef] [PubMed]
  29. Singel, S.M.; Cornelius, C.; Zaganjor, E.; Batten, K.; Sarode, V.R.; Buckley, D.L.; Peng, Y.; John, G.B.; Li, H.C.; Sadeghi, N.; et al. KIF14 Promotes AKT Phosphorylation and Contributes to Chemoresistance in Triple-Negative Breast Cancer. Neoplasia 2014, 16, 247–256.e2. [Google Scholar] [CrossRef] [Green Version]
  30. Carleton, M.; Mao, M.; Biery, M.; Warrener, P.; Kim, S.; Buser, C.; Marshall, C.G.; Fernandes, C.; Annis, J.; Linsley, P.S. RNA Interference-Mediated Silencing of Mitotic Kinesin KIF14 Disrupts Cell Cycle Progression and Induces Cytokinesis Failure. Mol. Cell. Biol. 2006, 26, 3853–3863. [Google Scholar] [CrossRef] [Green Version]
  31. Nakagawa, T.; Tanaka, Y.; Matsuoka, E.; Kondo, S.; Okada, Y.; Noda, Y.; Kanai, Y.; Hirokawa, N. Identification and Classification of 16 New Kinesin Superfamily (KIF) Proteins in Mouse Genome. Proc. Natl. Acad. Sci. USA 1997, 94, 9654–9659. [Google Scholar] [CrossRef] [Green Version]
  32. Yang, Z.; Li, C.; Yan, C.; Li, J.; Yan, M.; Liu, B.; Zhu, Z.; Wu, Y.; Gu, Q. KIF14 Promotes Tumor Progression and Metastasis and Is an Independent Predictor of Poor Prognosis in Human Gastric Cancer. Biochim. Biophys. Acta Mol. Basis Dis. 2019, 1865, 181–192. [Google Scholar] [CrossRef] [PubMed]
  33. Zhang, Y.; Yuan, Y.; Liang, P.; Zhang, Z.; Guo, X.; Xia, L.; Zhao, Y.; Shu, X.-S.; Sun, S.; Ying, Y.; et al. Overexpression of a Novel Candidate Oncogene KIF14 Correlates with Tumor Progression and Poor Prognosis in Prostate Cancer. Oncotarget 2017, 8, 45459–45469. [Google Scholar] [CrossRef] [PubMed] [Green Version]
  34. Wang, Q.; Wang, L.; Li, D.; Deng, J.; Zhao, Z.; He, S.; Zhang, Y.; Tu, Y. Kinesin Family Member 14 Is a Candidate Prognostic Marker for Outcome of Glioma Patients. Cancer Epidemiol. 2013, 37, 79–84. [Google Scholar] [CrossRef]
  35. Qiu, H.-L.; Deng, S.-Z.; Li, C.; Tian, Z.-N.; Song, X.-Q.; Yao, G.-D.; Geng, J.-S. High Expression of KIF14 Is Associated with Poor Prognosis in Patients with Epithelial Ovarian Cancer. Eur. Rev. Med. Pharmacol. Sci. 2017, 21, 239–245. [Google Scholar] [PubMed]
  36. Hung, P.-F.; Hong, T.-M.; Hsu, Y.-C.; Chen, H.-Y.; Chang, Y.-L.; Wu, C.-T.; Chang, G.-C.; Jou, Y.-S.; Pan, S.-H.; Yang, P.-C. The Motor Protein KIF14 Inhibits Tumor Growth and Cancer Metastasis in Lung Adenocarcinoma. PLoS ONE 2013, 8, e61664. [Google Scholar] [CrossRef] [Green Version]
  37. Corson, T.W.; Gallie, B.L. KIF14 MRNA Expression Is a Predictor of Grade and Outcome in Breast Cancer. Int. J. Cancer 2006, 119, 1088–1094. [Google Scholar] [CrossRef] [PubMed]
  38. Corson, T.W.; Zhu, C.Q.; Lau, S.K.; Shepherd, F.A.; Tsao, M.-S.; Gallie, B.L. KIF14 Messenger RNA Expression Is Independently Prognostic for Outcome in Lung Cancer. Clin. Cancer Res. 2007, 13, 3229–3234. [Google Scholar] [CrossRef] [Green Version]
  39. Thériault, B.L.; Pajovic, S.; Bernardini, M.Q.; Shaw, P.A.; Gallie, B.L. Kinesin Family Member 14: An Independent Prognostic Marker and Potential Therapeutic Target for Ovarian Cancer. Int. J. Cancer 2012, 130, 1844–1854. [Google Scholar] [CrossRef]
  40. Li, X.; Huang, W.; Huang, W.; Wei, T.; Zhu, W.; Chen, G.; Zhang, J. Kinesin Family Members KIF2C/4A/10/11/14/18B/20A/23 Predict Poor Prognosis and Promote Cell Proliferation in Hepatocellular Carcinoma. Am. J. Transl. Res. 2020, 12, 1614–1639. [Google Scholar]
  41. Wang, Z.-Z.; Yang, J.; Jiang, B.-H.; Di, J.-B.; Gao, P.; Peng, L.; Su, X.-Q. KIF14 Promotes Cell Proliferation via Activation of Akt and Is Directly Targeted by MiR-200c in Colorectal Cancer. Int. J. Oncol. 2018, 53, 1939–1952. [Google Scholar] [CrossRef] [Green Version]
  42. Hanicinec, V.; Brynychova, V.; Rosendorf, J.; Palek, R.; Liska, V.; Oliverius, M.; Kala, Z.; Mohelnikova-Duchonova, B.; Krus, I.; Soucek, P. Gene Expression of Cytokinesis Regulators PRC1, KIF14 and CIT Has No Prognostic Role in Colorectal and Pancreatic Cancer. Oncol. Lett. 2021, 22, 598. [Google Scholar] [CrossRef]
  43. Kendrick, N. A Gene’s MRNA Level Does Not Usually Predict Its Protein Level. Available online: https://kendricklabs.com/wp-content/uploads/2016/08/WP1_mRNAvsProtein_KendrickLabs.pdf (accessed on 19 April 2021).
  44. Vogel, C.; Marcotte, E.M. Insights into the Regulation of Protein Abundance from Proteomic and Transcriptomic Analyses. Nat. Rev. Genet. 2012, 13, 227–232. [Google Scholar] [CrossRef]
  45. Wang, D. Discrepancy between MRNA and Protein Abundance: Insight from Information Retrieval Process in Computers. Comput. Biol. Chem. 2008, 32, 462–468. [Google Scholar] [CrossRef] [Green Version]
  46. Aviner, R.; Shenoy, A.; Elroy-Stein, O.; Geiger, T. Uncovering Hidden Layers of Cell Cycle Regulation through Integrative Multi-Omic Analysis. PLoS Genet. 2015, 11, e1005554. [Google Scholar] [CrossRef]
  47. Zhang, B.; Wang, J.; Wang, X.; Zhu, J.; Liu, Q.; Shi, Z.; Chambers, M.C.; Zimmerman, L.J.; Shaddox, K.F.; Kim, S.; et al. Proteogenomic Characterization of Human Colon and Rectal Cancer. Nature 2014, 513, 382–387. [Google Scholar] [CrossRef] [Green Version]
  48. Liu, M.; Wang, X.; Yang, Y.; Li, D.; Ren, H.; Zhu, Q.; Chen, Q.; Han, S.; Hao, J.; Zhou, J. Ectopic Expression of the Microtubule-Dependent Motor Protein Eg5 Promotes Pancreatic Tumourigenesis. J. Pathol. 2010, 221, 221–228. [Google Scholar] [CrossRef] [PubMed]
  49. Asbaghi, Y.; Thompson, L.L.; Lichtensztejn, Z.; McManus, K.J. KIF11 Silencing and Inhibition Induces Chromosome Instability That May Contribute to Cancer. Genes Chromosomes Cancer 2017, 56, 668–680. [Google Scholar] [CrossRef] [PubMed]
  50. Soca-Chafre, G.; Montiel-Dávalos, A.; Rosa-Velázquez, I.A.D.L.; Caro-Sánchez, C.H.S.; Peña-Nieves, A.; Arrieta, O. Multiple Molecular Targets Associated with Genomic Instability in Lung Cancer. Int. J. Genom. 2019, 2019, 9584504. [Google Scholar] [CrossRef]
  51. Kolinjivadi, A.M.; Chong, S.T.; Ngeow, J. Molecular Connections between Circadian Rhythm and Genome Maintenance Pathways. Endocr. Relat. Cancer 2021, 28, R55–R66. [Google Scholar] [CrossRef] [PubMed]
  52. Kautto, E.A.; Bonneville, R.; Miya, J.; Yu, L.; Krook, M.A.; Reeser, J.W.; Roychowdhury, S. Performance Evaluation for Rapid Detection of Pan-Cancer Microsatellite Instability with MANTIS. Oncotarget 2017, 8, 7452–7463. [Google Scholar] [CrossRef] [Green Version]
  53. Niu, B.; Ye, K.; Zhang, Q.; Lu, C.; Xie, M.; McLellan, M.D.; Wendl, M.C.; Ding, L. MSIsensor: Microsatellite Instability Detection Using Paired Tumor-Normal Sequence Data. Bioinformatics 2014, 30, 1015–1016. [Google Scholar] [CrossRef] [PubMed] [Green Version]
  54. Chakraborty, U.; Dinh, T.A.; Alani, E. Genomic Instability Promoted by Overexpression of Mismatch Repair Factors in Yeast: A Model for Understanding Cancer Progression. Genetics 2018, 209, 439–456. [Google Scholar] [CrossRef] [Green Version]
  55. Wilczak, W.; Rashed, S.; Hube-Magg, C.; Kluth, M.; Simon, R.; Büscheck, F.; Clauditz, T.S.; Grupp, K.; Minner, S.; Tsourlakis, M.C.; et al. Up-Regulation of Mismatch Repair Genes MSH6, PMS2 and MLH1 Parallels Development of Genetic Instability and Is Linked to Tumor Aggressiveness and Early PSA Recurrence in Prostate Cancer. Carcinogenesis 2017, 38, 19–27. [Google Scholar] [CrossRef] [PubMed]
  56. Norris, A.M.; Woodruff, R.D.; D’Agostino, R.B.; Clodfelter, J.E.; Scarpinato, K.D. Elevated Levels of the Mismatch Repair Protein PMS2 Are Associated with Prostate Cancer. Prostate 2007, 67, 214–225. [Google Scholar] [CrossRef]
  57. Biermann, J.; Nemes, S.; Parris, T.Z.; Engqvist, H.; Werner Rönnerman, E.; Kovács, A.; Karlsson, P.; Helou, K. A 17-Marker Panel for Global Genomic Instability in Breast Cancer. Genomics 2020, 112, 1151–1161. [Google Scholar] [CrossRef]
  58. Madhavan, J.; Coral, K.; Mallikarjuna, K.; Corson, T.W.; Amit, N.; Khetan, V.; George, R.; Biswas, J.; Gallie, B.L.; Kumaramanickavel, G. High Expression of KIF14 in Retinoblastoma: Association with Older Age at Diagnosis. Investig. Ophthalmol. Vis. Sci. 2007, 48, 4901–4906. [Google Scholar] [CrossRef] [PubMed] [Green Version]
  59. Moon, J.J.; Lu, A.; Moon, C. Role of Genomic Instability in Human Carcinogenesis. Exp. Biol. Med. 2019, 244, 227–240. [Google Scholar] [CrossRef] [Green Version]
  60. Weaver, B.A.A.; Silk, A.D.; Montagna, C.; Verdier-Pinard, P.; Cleveland, D.W. Aneuploidy Acts Both Oncogenically and as a Tumor Suppressor. Cancer Cell 2007, 11, 25–36. [Google Scholar] [CrossRef] [PubMed] [Green Version]
  61. Levine, M.S.; Holland, A.J. The Impact of Mitotic Errors on Cell Proliferation and Tumorigenesis. Genes Dev. 2018, 32, 620–638. [Google Scholar] [CrossRef] [Green Version]
  62. Amin, M.B.; Greene, F.L.; Edge, S.B.; Compton, C.C.; Gershenwald, J.E.; Brookland, R.K.; Meyer, L.; Gress, D.M.; Byrd, D.R.; Winchester, D.P. The Eighth Edition AJCC Cancer Staging Manual: Continuing to Build a Bridge from a Population-Based to a More “Personalized” Approach to Cancer Staging. CA Cancer J. Clin. 2017, 67, 93–99. [Google Scholar] [CrossRef] [PubMed]
  63. Gzil, A.; Zarębska, I.; Jaworski, D.; Antosik, P.; Durślewicz, J.; Maciejewska, J.; Domanowska, E.; Skoczylas-Makowska, N.; Ahmadi, N.; Grzanka, D.; et al. The Prognostic Value of Leucine-Rich Repeat-Containing G-Protein (Lgr5) and Its Impact on Clinicopathological Features of Colorectal Cancer. J. Cancer Res. Clin. Oncol. 2020, 146, 2547–2557. [Google Scholar] [CrossRef]
  64. Remmele, W.; Stegner, H.E. Recommendation for uniform definition of an immunoreactive score (IRS) for immunohistochemical estrogen receptor detection (ER-ICA) in breast cancer tissue. Pathologe 1987, 8, 138–140. [Google Scholar]
  65. Goldman, M.J.; Craft, B.; Hastie, M.; Repečka, K.; McDade, F.; Kamath, A.; Banerjee, A.; Luo, Y.; Rogers, D.; Brooks, A.N.; et al. Visualizing and Interpreting Cancer Genomics Data via the Xena Platform. Nat. Biotechnol. 2020, 38, 675–678. [Google Scholar] [CrossRef] [PubMed]
  66. Chandrashekar, D.S.; Bashel, B.; Balasubramanya, S.A.H.; Creighton, C.J.; Ponce-Rodriguez, I.; Chakravarthi, B.V.S.K.; Varambally, S. UALCAN: A Portal for Facilitating Tumor Subgroup Gene Expression and Survival Analyses. Neoplasia 2017, 19, 649–658. [Google Scholar] [CrossRef] [PubMed]
  67. Jassal, B.; Matthews, L.; Viteri, G.; Gong, C.; Lorente, P.; Fabregat, A.; Sidiropoulos, K.; Cook, J.; Gillespie, M.; Haw, R.; et al. The Reactome Pathway Knowledgebase. Nucleic Acids Res. 2020, 48, D498–D503. [Google Scholar] [CrossRef] [PubMed]
  68. Szklarczyk, D.; Morris, J.H.; Cook, H.; Kuhn, M.; Wyder, S.; Simonovic, M.; Santos, A.; Doncheva, N.T.; Roth, A.; Bork, P.; et al. The STRING Database in 2017: Quality-Controlled Protein-Protein Association Networks, Made Broadly Accessible. Nucleic Acids Res. 2017, 45, D362–D368. [Google Scholar] [CrossRef]
  69. Shannon, P.; Markiel, A.; Ozier, O.; Baliga, N.S.; Wang, J.T.; Ramage, D.; Amin, N.; Schwikowski, B.; Ideker, T. Cytoscape: A Software Environment for Integrated Models of Biomolecular Interaction Networks. Genome Res. 2003, 13, 2498–2504. [Google Scholar] [CrossRef]
  70. Huang, D.W.; Sherman, B.T.; Lempicki, R.A. Systematic and Integrative Analysis of Large Gene Lists Using DAVID Bioinformatics Resources. Nat. Protoc. 2009, 4, 44–57. [Google Scholar] [CrossRef]
Figure 1. Representative photographs showing immunohistochemical expression of KIF11 (AC) and KIF14 (DF) in colorectal cancer (CRC) and adjacent tissue (control). KIF11 staining in control tissue (A); weak staining (B) and strong staining (C) for KIF11 in CRC; KIF14 staining in control tissue (D); weak staining (E) and strong staining (F) for KIF11 in CRC. Original magnification 20×.
Ijms 22 09732 g001
Figure 2. Protein and mRNA expression of KIF11 and KIF14 in colorectal cancer. KIF11 (A) and KIF14 (B) protein expression levels in CRC tumors compared to noncancerous adjacent tissues; KIF11 (C) and KIF14 (D) mRNA expression levels in CRC tumors compared to normal tissues. The error bars present the range from minimum to maximum values of data. Asterisks (*) indicate statistically significant differences (p < 0.05).
Ijms 22 09732 g002
Figure 3. Kaplan-Meier curves presenting the overall survival of CRC patients depending on KIF11 protein expression (A); KIF11 protein expression assessed based on PS values (B); KIF14 protein expression (C); combined KIF11 (IRS)/KIF14 protein expression (D); combined KIF11(PS)/KIF14 protein expression (E); KIF11 mRNA expression (F); KIF14 mRNA expression (G) and combined KIF11/KIF14 mRNA expression (H).
Ijms 22 09732 g003
Figure 4. Functional enrichment analysis based on the TCGA dataset and UALCAN web tool. The top 50 genes and reactome pathways positively correlated with KIF11 expression (A,B); BRITE functional hierarchies for the top 50 genes that were co-upregulated with KIF11 (C).
Ijms 22 09732 g004
Figure 5. Functional enrichment analysis based on the TCGA dataset and UALCAN web tool. The top 50 genes and reactome pathways positively correlated with KIF14 expression (A,B); BRITE functional hierarchies for the top 50 genes that were co-upregulated with KIF14 (C).
Ijms 22 09732 g005
Figure 6. DAVID functional GO analysis of biological processes (A; BP), cellular components (B; CC), and molecular functions (C; MF). The top 10 GO terms for BP, CC and 7 GO terms for MF are presented for genes co-upregulated with KIF11. The p value was calculated and sorted with −log10(p value).
Ijms 22 09732 g006
Figure 7. DAVID functional GO analysis of (A) biological processes (BP), (B) cellular components (CC), and (C) molecular functions (MF). The top 10 GO terms for BP, CC and 7 GO terms for MF are presented for genes co-upregulated with KIF14. The p value was calculated and sorted with −log10(p value).
Ijms 22 09732 g007
Table 1. Association of KIF11 and KIF14 protein expression in colorectal cancer with patient characteristics.
Clinicopathological
Feature
n (%)
n = 86
KIF11 Expressionp ValueKIF14 Expressionp Value
Low
n = 61
High
n = 25
Low
n = 57
High
n = 29
Age (years)
≤6538 (44.19)29 (76.32)9 (23.68)0.3527 (71.05)11 (28.95)0.49
>6548 (55.81)32 (66.67)16 (33.33)30 (62.50)18 (37.50)
Gender
Male49 (56.98)33 (67.35)16 (32.65)0.4835 (71.43)14 (28.57)0.26
Female37 (43.02)28 (75.68)9 (24.32)22 (59.46)15 (40.54)
Grading
G276 (91.57)54 (71.05)22 (28.95)>0.9950 (65.79)26 (34.21)>0.99
G37 (8.43)5 (71.43)2 (28.57)5 (71.43)2 (28.57)
pT status
T213 (15.12)10 (76.92)3 (23.08)0.679 (69.23)4 (30.77)0.68
T360 (69.77)42 (70.00)18 (30.00)38 (63.33)22 (36.67)
T413 (15.12)9 (69.23)4 (30.77)10 (76.92)3 (23.08)
pN status
N033 (40.74)25 (75.76)8 (24.24)0.6220 (60.61)13 (39.39)0.48
N1-N248 (59.26)33 (68.75)15 (31.25)33 (68.75)15 (31.25)
pM status
M042 (52.50)29 (69.05)13 (30.95)>0.9927 (64.29)15 (35.71)>0.99
M138 (47.50)27 (71.05)11 (28.95)25 (65.79)13 (34.21)
VI
Absent24 (60.00)16 (66.67)8 (33.33)0.539 (37.50)15 (62.50)0.01
Present16 (40.00)9 (56.25)7 (43.75)13 (81.25)3 (18.75)
PNI
Absent25 (89.29)14 (56.00)11 (44.00)0.2612 (48.00)13 (52.00)>0.99
Present3 (10.71)3 (100.00)0 (0.00)2 (66.67)1 (33.33)
Abbreviations: VI—vascular invasion, PNI—perineural invasion. Significant p-value (p < 0.05) is marked in bold.
Table 2. Univariate and multivariate Cox proportional hazards models for OS of our cohort of CRC patients.
VariableUnivariate CoxMultivariate Cox:
KIF11(PS) and KIF14
Multivariate Cox:
KIF11(IRS)/KIF14
Multivariate Cox:
KIF11(PS)/KIF14
HR95%CIpHR95%CIpHR95%CIpHR95%CIp
LowerUpperLowerUpperlowerupperLowerUpper
KIF11 (IRS)1.510.792.870.21------------
KIF11 (PS)2.171.144.120.022.411.105.280.03--------
KIF140.540.261.100.090.430.171.110.08--------
KIF11(IRS)low/KIF14highRef.----Ref.----
KIF11(IRS)high/KIF14low3.331.298.550.01----3.911.1313.540.03----
Others0.910.392.150.84----1.280.433.820.66----
KIF11(PS)low/KIF14highRef.--------Ref.
KIF11(PS)high/KIF14low3.291.298.370.01--------5.721.7418.830.004
Others2.180.925.130.08--------2.580.927.190.07
age1.000.971.030.831.020.991.060.181.010.981.050.481.020.991.060.17
gender1.060.571.990.851.850.844.060.131.810.774.230.171.860.854.080.12
grade2.310.806.640.123.621.1411.530.033.150.999.990.053.681.1511.760.03
pT2.140.845.470.110.830.262.650.750.950.303.020.920.850.272.700.78
pN1.770.903.480.101.570.703.540.281.160.472.840.751.580.703.550.27
pM3.271.646.530.0013.091.376.990.0072.801.226.400.023.031.356.800.007
Abbreviations: CI—confidence interval, CRC—colorectal cancer, HR—hazard ratio, IRS—immunoreactive score, OS—overall survival, PS—immunopercentage. “-” indicates variable was not included in multivariate Cox analysis. Significant p-values (p < 0.05) are indicated in bold.
Table 3. Association of KIF11 and KIF14 transcript expression in colorectal cancer with patient characteristics.
Clinicopathological Featuren (%)
n = 277
KIF11 Expressionp ValueKIF14 Expressionp Value
Low
n = 244
High
n = 33
Low
n = 194
High
n = 83
Age (years)
≤65129 (46.91)114 (88.37)15 (11.63)>0.9991 (70.54)38 (29.46)>0.99
>65146 (53.09)128 (87.67)18 (12.33)102 (69.86)44 (30.14)
Gender
Male150 (54.55)136 (90.67)14 (9.33)0.14103 (68.67)47 (31.33)0.60
Female125 (45.45)106 (84.80)19 (15.20)90 (72.00)35 (28.00)
pT status
T16 (2.18)6 (100.00)0 (0.00)0.364 (66.67)2 (33.33)0.34
T243 (15.64)38 (88.37)5 (11.63)34 (79.07)9 (20.93)
T3188 (68.36)166 (88.30)22 (11.70)132 (70.21)56 (29.79)
T438 (13.82)32 (84.21)6 (15.79)23 (60.53)15 (39.47)
pN status
N0160 (58.18)143 (89.38)17 (10.63)0.45120 (75.00)40 (25.00)0.045
N1-N2115 (41.82)99 (86.09)16 (13.91)73 (63.48)42 (36.52)
pM status
M0185 (83.33)162 (87.57)23 (12.43)0.27130 (70.27)55 (29.73)0.84
M137 (16.67)35 (94.59)2 (5.41)25 (67.57)12 (32.43)
TNM stage
I-II150 (55.97)133 (88.67)17 (11.33)0.58115 (76.67)35 (23.33)0.01
III-IV118 (44.03)102 (86.44)16 (13.56)73 (61.86)45 (38.14)
Significant p-values (p < 0.05) are marked in bold.
Table 4. Univariate and multivariate Cox proportional hazards models for OS of TCGA cohort of CRC patients.
VariableUnivariate AnalysisMultivariate Analysis: KIF11Multivariate Analysis: KIF14Multivariate Analysis: KIF11/KIF14
HR95% CIpHR95%CIpHR95%CIpHR95%CIp
LowerUpperLowerUpperLowerUpperLowerUpper
KIF110.360.130.9960.0490.320.110.890.03--------
KIF140.660.381.170.16----0.470.260.860.02----
KIF11low/KIF14lowRef.--------Ref.
KIF11high/KIF14high0.270.080.880.03--------0.220.070.710.01
Others1.100.601.990.77--------0.740.391.410.36
age1.020.9981.040.081.031.0041.050.021.031.011.050.0041.031.011.050.01
gender1.430.872.350.161.300.762.200.341.380.812.350.241.360.802.330.26
pT3.211.178.840.02------------
pN2.461.504.04<0.0001------------
pM4.212.347.56<0.0001------------
stage2.601.554.35<0.00013.371.965.77<0.00013.832.186.73<0.00013.652.086.41<0.0001
Abbreviations: CI—confidence interval, CRC—colorectal cancer, HR—hazard ratio, OS—overall survival. “-” indicates variable was not included in multivariate Cox analysis. Significant p-values (p < 0.05) are indicated in bold.
Publisher’s Note: MDPI stays neutral with regard to jurisdictional claims in published maps and institutional affiliations.

