Article

Biotransformation of the Phenolic Constituents from Licorice and Cytotoxicity Evaluation of Their Metabolites

College of Pharmacy, Chonnam National University, Gwangju 61186, Korea
*
Author to whom correspondence should be addressed.
Int. J. Mol. Sci. 2021, 22(18), 10109; https://doi.org/10.3390/ijms221810109
Submission received: 3 September 2021 / Revised: 16 September 2021 / Accepted: 16 September 2021 / Published: 18 September 2021

Abstract

:
Biotransformation of four bioactive phenolic constituents from licorice, namely licoisoflavanone (1), glycyrrhisoflavone (2), echinatin (3), and isobavachalcone (4), was performed by the selected fungal strain Aspergillus niger KCCM 60332, leading to the isolation of seventeen metabolites (521). Structures of the isolated compounds were determined on the basis of extensive spectroscopic methods, twelve of which (57, 1017 and 19) have been previously undescribed. A series of reactions including hydroxylation, hydrogenation, epoxidation, hydrolysis, reduction, cyclization, and alkylation was observed in the biotransformation process. All compounds were tested for their cytotoxic activities against three different human cancer cell lines including A375P, MCF-7, and HT-29. Compounds 1 and 12 exhibited most considerable cytotoxic activities against all the cell lines investigated, while compounds 2 and 4 were moderately cytotoxic. These findings will contribute to expanding the chemical diversity of phenolic compounds, and compounds 1 and 12 may serve as leads for the development of potential cancer chemopreventive agents.

Graphical Abstract

1. Introduction

Biotransformation can be defined as a specific modification (or modifications) of a chemical compound to a product with structural similarity by means of biological catalysts. A biological catalyst can be a whole microorganism or its enzyme, or other organisms [1,2,3,4]. Microorganisms can catalyze various reactions including hydroxylation, dehydrogenation, methylation, etc., to modify the chemical structure of a bioactive substrate resulting in the formation of metabolites which maintain the core structure of the substrate [5,6,7]. Biotransformation using microorganisms has advantages over conventional chemical synthesis due to its environmental acceptability, stereo- and regio-selectivity, and mild conditions [8]. It could be used as an alternative to chemical synthesis for generation and optimization of lead compounds in drug discovery and development [9]. Moreover, microorganisms possess the capability to mimic mammalian metabolism as their expression of enzymes that are homologous to phase I and II xenobiotic-metabolizing enzymes such as cytochrome P450 monooxygenases, UDP-glucuronosyltransferases, aryl sulfotransferases, and glutathione S-transferases [10,11,12].
Licorice is one of the most popular medicinal plants that has been used as a remedy for cough, gastric ulcer, inflammation, abdominal pain, cardiovascular diseases, and cancer since ancient time [13]. The major constituent glycyrrhizin and its aglycone glycyrrhetinic acid are also used in modern medicine. On the other hand, the phenolic constituents of licorice have been implicated in health-beneficial effects, particularly in stomach ulcers. It has been reported that the phenolic constituents of licorice have pharmacological effects for health [14]. However, little is known on the biotransformation and cytotoxicity of these health promoting phenolic compounds.
In this study, two licorice isoflavonoids licoisoflavanone (1) and glycyrrhisoflavone (2) were isolated from licorice, and two licorice chalcones echinatin (3) and isobavachalcone (4) were synthesized. To expand the diversity of phenolic compounds, 14 were subject to biotransformation. Twelve new (57, 1017 and 19) and five known (8, 9, 18, 20 and 21) metabolites were identified and their structures were characterized by spectroscopic methods. All the compounds were evaluated for their cytotoxic activities against human cancer cell lines A375P, A549 and MCF-7.

2. Results and Discussion

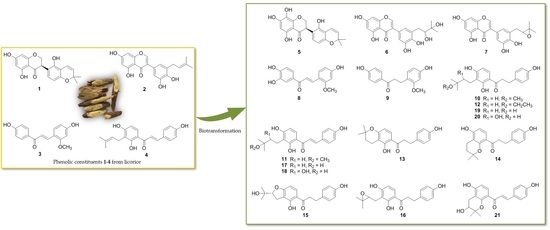
2.1. Biotransformation of Two Isoflavonoids, Licoisoflavanone (1) and Glycyrrhisoflavone (2) with A. niger KCCM 60332

Biotransformation of licoisoflavanone (1) by the selected fungal strain A. niger KCCM 60332 produced one new hydroxylated metabolite 5. Biotransformation of glycyrrhisoflavone (2) furnished one new dihydroxylated (6) and one new epoxidized (7) metabolites (Figure 1).
Compound 5 was obtained as a pale yellow amorphous powder. Its molecular formula was determined as C20H18O7 by an [M + Na]+ peak at m/z 393.0953 (calcd for C20H18O7Na, 393.0950) based on its HRESIMS spectrum, indicating that one oxygen atom was inserted into compound 1. The 1H-NMR spectrum of 5 demonstrated eight one-proton signals (δH 6.91, 6.69, 6.34, 5.99, 5.68, 4.65, 4.53 and 4.23) and two methyl (δH 1.40) signals (Table 1). The 13C-NMR spectrum exhibited signals for twenty carbons. Except for the absence of one phenolic proton signal at C-8 and the presence of one downfield-shifted carbon signal at δc 125.3 in 5, the 1H- and 13C-NMR data of 5 closely resembled those of 1 [15]. The mono-hydroxylation took place at C-8 based on the correlations from H-6 (δH 5.99) to C-5 (δc 156.0), C-7 (δc 157.0), and C-8 (δc 125.3) in the HMBC spectrum of 5. The absolute configuration of 5 was determined to be R by the observation of positive Cotton effect at the range between 280 and 350 nm in the CD spectrum of 5 (Figure S15) [16]. Thus, structure of compound 5 was established as (3R)-5,7,8,2’-tetrahydroxy-6”,6”-dimethyl-(2”,3”:4’,3’)-pyranoflavanone.
Compound 6 was obtained as a yellow amorphous powder. HRESIMS of 6 showed an [M + Na]+ peak at m/z 411.1060 (calcd for C20H20O8Na, 411.1056) which established its molecular formula as C20H20O8 which corresponds to a dihydroxylated metabolite of 2. The 1H- and 13C-NMR spectral data revealed twenty carbon signals consisting of two methyl groups, one methylene, six methines, ten quaternary carbons, and one carbonyl quaternary carbon. There were no olefinic proton signals of the prenyl moiety in the 1H-NMR spectrum of 6. Moreover, the HMBC spectrum showed correlations between the two methyl protons (δH 1.25) and the two oxygen-bearing carbons at δC 79.2 and 72.5 indicating the dihydroxylation took place at the olefinic double bond of the prenyl group. On the basis of these evidences, structure of compound 6 was elucidated as 5,7,3′,4′-tetrahydroxy-5′-(2,3-dihydroxy-3-methylbutyl)isoflavone.
Compound 7 was obtained as a yellow amorphous powder. The HRESIMS spectrum of 7 exhibited an [M + Na]+ peak at m/z 393.0951 (calcd for C20H18O7Na, 393.0950), which suggested a molecular formula of C20H18O7 corresponding to an epoxidized metabolite of 2. It showed 1H- and 13C-NMR spectral features closely related to those of 6. Compared with the NMR spectral data of compound 2, compound 7 exhibited the absence of olefinic proton signals belonging to the prenyl group. Meanwhile, presence of one oxygen-bearing methine carbon signal at δc 69.2 corresponding with the proton signal at δH 3.79 and one oxygen-bearing quaternary carbon signal at δc 77.4 were observed based on the HSQC and HMBC correlations. These results suggested that the olefinic double bond of the prenyl group was epoxidized. Thus, the structure of 7 was elucidated as 5,7,3′,4′-tetrahydroxy-5′-(2-epoxy-3-methylbutyl)isoflavone.

2.2. Biotransformation of Two Chalcones, Echinatin (3) and Isobavachalcone (4) with A. niger KCCM 60332

Biotransformation of echinatin (3) furnished two known metabolites 8 and 9. Biotransformation of isobavachalcone (4) afforded twelve metabolites 1021, of which 1017 and 19 were determined to be structurally new (Figure 2).
Compounds 8 and 9 were obtained as a pale yellow amorphous powder and a yellow amorphous powder, respectively. Their structures were elucidated as (E)-1-(3,4-dihydroxyphenyl)-3-(4-hydroxy-2-methoxyphenyl)-prop-2-en-1-one (8) and loureirin C (9) by comparing their 1H-NMR data (Figures S26 and S27) with those in the literatures [17,18].
Compound 10 was acquired as a pale yellow amorphous powder. Its molecular formula of C21H26O5 was established by an [M + Na]+ peak at m/z 381.1678 (calcd C21H26O5Na, 381.1678), which is consistent with 9 degrees of unsaturation. The UV spectrum showed absorption maxima at 220 and 285 nm. The 13C-NMR data of 10 showed resonances for twenty-one carbon atoms comprising a typical carbonyl carbon, twelve phenolic carbons, four methylene and three methyl carbons, and one oxygenated quaternary carbon (Table 2). Its 1H-NMR data exhibited four aromatic proton signals of ring B constituting an AA’XX’ spin system at δH 7.04 (2H, d, J = 8.6 Hz) and 6.66 (2H, d, J = 8.6 Hz); two aromatic proton signals of ring A constituting an AX spin system at δH 7.63 (1H, d, J = 8.9 Hz) and 6.41 (1H, d, J = 8.9 Hz); two coupled methylene proton signals at δH 3.17 (2H, t, J = 7.6 Hz) and 2.81 (2H, t, J = 7.6 Hz) together with one H-bonded hydroxyl proton signal at δH 13.13 (2′-OH). Moreover, the 1H-NMR data displayed characteristic signals for a 3-hydroxy-3-methylbutyl moiety at δH 2.50 (2H, m), 1.52 (2H, m), and 1.12 (6H, s), and a three-proton singlet signal for a methoxyl moiety at δH 3.13 (3H, s). These spectroscopic features of 10 enabled the assignment of the skeleton as 4,2′,4′-trihydroxy-α,β-dihydrochalcone linked with the 3-hydroxy-3-methylbutyl and methoxyl substituents. These inferences were further confirmed by combined analysis of HSQC, HMBC, and COSY spectral data (Figure 3). HMBC correlations were used to confirm the locations of the two substituents. From HMBC correlation of H-2″ (δH 1.52) to C-3′ (δc 115.2), the 3-hydroxy-3-methylbutyl group was assigned to C-3′. The methoxyl group was deduced to be at C-3″ from the HMBC correlation of H-1′′′ (δH 3.13) to C-3″ (δc 73.9). According to the above data analysis, compound 10 was elucidated as 4,2′,4′-trihydroxy-3′-(3-O-methyl-3-methylbutyl)dihydrochalcone.
Compound 11, obtained as a yellow amorphous powder, possessed a molecular formula of C21H24O5 as deduced from its HRESIMS peak [M + Na]+ at m/z 379.1519 (calcd C21H24O5Na, 379.1521), which lacks two proton atoms compared with that of 4. The UV spectrum showed characteristic chalcone absorption maxima at 365 nm. In accordance with the UV spectrum, the H-bonded hydroxyl proton resonance at δH 14.05 and the carbonyl carbon resonance at δC 192.6 were consistent with a 2′-hydroxychalcone [19]. The 1H- and 13C-NMR spectroscopic data for 11 were similar to those of 10 except for new resonances at δH 7.71 and δc 143.6 and 117.3 (Table 2). In the HSQC spectrum, the resonance at δH 7.71 showed correlations with the two new resonances at δc 143.6 and 117.3 suggesting the presence of an olefinic double bond. In the HMBC spectrum, the new resonance at δH 7.71 showed correlations with resonances at δc 191.1 (C=O), 131.0 (C-2,6), 112.0 (C-1′), indicating the presence of an α,β-olefinic group. Thus, the structure of compound 11 was assigned 4,2′,4′-trihydroxy-3′-(3-O-methyl-3-methylbutyl)chalcone.
Compound 12 was obtained as a pale yellow amorphous powder. HRESIMS analysis showed the [M + Na]+ peak at m/z 395.1833 which was in accord with the molecular formula C22H28O5. By comparing the NMR data of 12 with those of 10, it was found that the NMR data of 12 were identical to those of 10 except for the additional ethoxyl proton signals at δH 3.56 (2H, q, J = 7.0 Hz) and 1.29 (3H, t, J = 7.0 Hz) (Table 2). It was suggested that the methoxyl group belonging to the 3-methoxy-3-methylbutyl substituent in 10 was replaced by an ethoxyl group in 12. This deduction was consistent with the difference in molecular ion masses [Δm/z = 14.0155 mmu (CH2)]. HMBC correlations between the protons at δH 3.56 (H-1′′′) and 1.29 (H-2′′′) and the carbon at δc 76.3 (C-3′′) confirmed the attachment of the ethoxyl group at C-3′′ (Figure 3). Therefore, compound 12 was assigned 4,2′,4′-trihydroxy-3′-(3-O-ethyl-3-methylbutyl)dihydrochalcone.
Compound 13 was obtained as a pale yellow amorphous powder. The HRESIMS of 13 displayed an [M + Na]+ peak at m/z 349.1416 which was consistent with the molecular formula C20H22O4, indicating 10 indices of hydrogen deficiency. UV spectrum showed absorption maxima at 220 and 286 nm. Comparison of its NMR spectroscopic data with those of 10 indicated that 13 have a similar structure but with a 2,2-dimethyldihydropyran ring in the case of 13 (Table 2). On the basis of the HMBC correlation from H-5′ to C-3′′ together with the presence of the intramolecular H-bonded hydroxyl proton signal at δH 13.17 (2′-OH), it was confirmed that the additional 2,2-dimethyldihydropyran ring was fused to ring A via C-3′ and C-4′ positions. Compound 13 was therefore characterized as 4,2′-dihydroxy-(2,2-dimethyl-3,4-dihydropyran)-(5″,6″:3′,4′)dihydrochalcone.
Compound 14, isolated as a pale yellow amorphous powder, showed a sodium adduct molecular ion peak at m/z 349.1415 in the HRESIMS corresponding to the molecular formula C20H22O4, which was the same as that of 13. The overall NMR data of 14 showed analogous structural features to those of 13 except for the absence of an H-bonded hydroxyl proton resonance in the lower field (Table 3). These data suggested that the 2,2-dimethyldihydropyran ring was fused to C-2′ and C-3′ positions of 14. Supportive evidence for this deduction was provided by the up-field shifted carbon resonance at δC 155.2 (C-2′) after combined analysis of its HSQC and HMBC data. Moreover, the NMR data of 6 were in good accordance with those of deoxydihydroxanthoangelol H in which a methoxyl group was attached at C-4′ instead of a hydroxyl group in 6 [20]. Thus, the structure of 14 was assigned 4,4′-dihydroxy-(2,2-dimethyl-3,4-dihydropyran)-(5″,6″:3′,2′)dihydrochalcone.
Compound 15, an optically active compound ( [ α ] D 20 −52.2), was obtained as a pale yellow amorphous powder. Its molecular formula was defined as C20H22O5 by the HRESIMS peak [M + Na]+ at m/z 365.1364 (calcd C20H22O5Na, 365.1365). The 1H- and 13C-NMR spectroscopic data (Table 3) in conjunction with HSQC and HMBC experiments delineated the presence of twenty carbon atoms consisting of the following functional groups: two methyl, three methylene, seven methine, and seven quaternary and a carbonyl carbons (Table 3). In the 1H-NMR spectrum, resemblance of the resonance signals between compounds 15 and 10 suggested that both have the same skeleton of α,β-dihydrochalcone. Meanwhile, the 1H-NMR spectrum of 15 obviously showed characteristic signals for a 2-(1-methyl-1-hydroxyethyl)dihydrofuran ring fused to an aromatic ring at δH 3.04 (t, J = 8.8 Hz, 2H, H-1″), 4.71 (d, J = 8.8 Hz, 1H, H-2″), 1.13 (s, 3H, H-4″), and 1.12 (s, 3H, H-5″) [21]. Analysis of the HMBC correlations revealed that the ring was fused at C-3′ and C-4′ positions in ring A by the correlations from the H-1″ (δH 3.04) and H-2″ (δH 4.71) to C-3′ (δC 113.3) and C-4′ (δC 166.8). The absolute configuration at C-2′′ was proposed as R by comparison of the specific rotation of 15 with those of coryaurone A ( [ α ] D 25 −44.9) [22], artonitidin A ( [ α ] D 20 −25.7) [23], and anodendroic acid ( [ α ] D 25 +42.0) [24]. Taken together, compound 15 was elucidated to be (2″R)-4,2′-dihydroxy-[2-(1-hydroxy-1-methyl)- 2,3-dihydrofuran]-(4″,5″:3′,4′)dihydrochalcone.
Compound 16 was isolated as a pale yellow amorphous powder. HRESIMS indicated a molecular formula of C20H22O5, according to its sodium adduct ion peak at m/z 365.1366 with 10 indices of hydrogen deficiency. Analysis of the 1H- and 13C-NMR data of 16 exhibited signal patterns closely resembling to those of 10, indicating that compound 16 has a skeleton of 4,2′,4′-trihydroxydihydrochalcone. Whereas, the substituent attached to C-3′ position was found to be different, as the 1H-NMR data of 16 revealed signals for a 2,3-epoxy-3-methylbutyl group instead of a 3-methoxy-3-methylbutyl group in 10. The attachment of the 2,3-epoxy-3-methylbutyl group was further confirmed to be at C-3′ on the basis of the HMBC correlations from H-1′′ (δH 2.78 and 2.46) and H-2′′ (δH 3.67) to C-3′ (δC 107.8). Accordingly, compound 16 was elucidated as 4,2′,4′-trihydroxy-3′-(2,3-epoxy-3-methylbutyl)dihydrochalcone.
Compound 17, obtained as a yellow amorphous powder, had a molecular formula of C20H22O5 according to its sodium adduct ion peak at m/z 365.1365 ([M + Na]+, calcd for C20H22O5Na, 365.1365) with 10 degrees of unsaturation. The UV absorption of 17 displayed absorption maxima at 370 nm typical of a chalcone. The 1H- and 13C-NMR spectra of 17 were remarkably similar to those of 11, except for the resonances for a methyl group at C-1′′′ position (Table 2 and Table 3). The HMBC correlations from H-1′′ (δH 2.57) and H-2′′ (δH 1.50) to C-3′ (δC 115.8) confirmed the 3-hydroxy-3-methylbutyl group to be attached at C-3′ on the skeleton of 4,2′,4′-trihydroxychalcone. Thus, compound 17 was characterized as 4,2′,4′-trihydroxy-3′-(3-hydroxy-3-methylbutyl)chalcone.
Compound 19 was obtained as a pale yellow amorphous powder. Its molecular formula was established as C20H24O5 by its HRESIMS data ([M + Na]+, calcd for C20H24O5Na, 367.1521). Comparison of the 1H- and 13C-NMR data of 19 and 10 revealed that the resonance signals for the methyl group at C-1′′′ of 10 were absent in 19, suggesting the isoprene unit at C-3′ of 19 was a 3-hydroxy-3-methylbutyl moiety (Table 2 and Table 3). The connectivity of 3-hydroxy-3-methylbutyl moiety at C-3′ was further secured by the HMBC correlations from H-1′′ (δH 2.54) and H-2′′ (δH 1.47) to C-3′ (δC 115.6). Compound 19 was therefore identified as 4,2′,4′-trihydroxy-3′-(3-hydroxy-3-methylbutyl)dihyrochalcone.
Structures of three other known compounds were identified as brosimacutin M (18) [25], brosimacutin H (20) [26], and bavachromanol (21) [27,28] by comparing their spectral data with those reported in the literatures (Figures S74–S76). However, absolute configuration of their hydroxyl groups remained undetermined due to the limited quantities of the isolates. Further study may be necessary to determine the absolute configuration in compounds 18, 20, and 21.

2.3. Proposed Metabolic Pathways of Isobavachalcone (4) Catalyzed by A. niger KCCM 60332

Biotransformation of isobavachalcone (4) by the selected fungal strain A. niger produced metabolites 1021 through hydrogenation, epoxidation, hydrolysis, reduction, cyclization, and alkylation (Figure 4). The prenyl substituent and α,β-double bond were the major sites for biotransformation by A. niger.
Regarding the metabolic relationships of these metabolites, 22 was proposed as a potential intermediate which could not be unambiguously identified in this study. The proposed intermediate 22 could be rationalized by initial epoxidation of the prenyl group at C-3′′. Further reductive cleavage or hydrolysis of the epoxide intermediate led to the generation of metabolites 17 or 18, respectively. Moreover, O-methylation of the hydroxyl group at C-3′′ in 17 could form 11. Meanwhile, a spontaneous intramolecular attack of the neighboring oxygen atom at C-2′ in 22 could lead to the metabolite 21. Hydrogenation of the α,β-double bonds in 22, 17, 18, and 11 could produce their corresponding hydrogenated metabolites 16, 19, 20, and 10, respectively. Metabolites 16 and 19 could be considered as intermediates to produce the rest of the metabolites. In the case of 16, a spontaneous intramolecular attack of the neighboring oxygen atom at C-4′ could result in the opening of epoxide ring to form its respective metabolite 15. In the case of 19, similarly, intramolecular cyclization of the prenyl group by the neighboring hydroxyl group at C-2′ or C-4′ could form a 2,2-dimethyldihydropyran moiety in 14 (pathway b) or 13 (pathway a). Additionally, metabolite 12 could be formed by O-ethylation of the hydroxyl group at C-3′′ of 19.

2.4. Cytotoxicity Evaluation

The parent compounds 14 and all isolated metabolites 521 were evaluated for in vitro cytotoxic potential against human cancer cell lines A375P, HT-29, and MCF-7 using modified MTT method [29]. The results are presented on Table 4. Noteworthily, compounds 1 and 12 showed the strongest cytotoxic activities against human cancer cell lines A375P, A549, and MCF-7 with IC50 values ranging from 4.4 to 10.1 μM, while compounds 2 and 4 were moderately cytotoxic.

3. Materials and Methods

3.1. General Experimental Procedures

Optical rotations were recorded with a 343 Plus polarimeter (Perkin Elmer, Waltham, MA, USA). UV spectra were recorded on a V-530 spectrophotometer (JASCO, Tokyo, Japan). IR spectra were obtained on a Frontier FT-IR/NIR spectrometer (PerkinElmer, Waltham, MA, USA). CD spectra were recorded on a JASCO J-815 CD spectrometer (JASCO, Tokyo, Japan). NMR experiments were recorded using an Avance III 400 spectrometer (Bruker, Fällanden, Switzerland) and Varian Unity INOVA 500 and 600 spectrometers (Varian, Palo Alto, CA, USA) with TMS as the internal standard. HRESIMS were determined on Waters Synapt G2 QTOF (Waters, Manchester, UK). TLC was carried out on Merck silica gel F254-precoated glass plates. Chromatography was performed on a Waters 1525 Binary HPLC pump connected to a 996 Photodiode Array (PDA) detector using Isco Allsphere ODS-2 (10 μm, 10 × 250 mm) and Zorbax SB-C8 (5 μm, 4.6 × 150 mm) columns with methanol (solvent A) and water (solvent B).
4′-Dihydroxyacetophenone, 2,4-dihydroxybenzaldehyde, 2′,4′-dihydroxyacetophenone, and 4-hydroxybenzaldehyde were purchased from Tokyo Chemical Industry Co., Ltd. Demethylzeylasteral (DZ) used as a reference standard in the bioassays was purchased from Biopurify Phytochemicals, Ltd. All the ingredients for microbial media including D-glucose, peptone, malt extract, yeast extract, and potato dextrose medium were purchased from Becton, Dickinson and Co.

3.2. Plant Material

The roots and rhizomes of licorice (Glycyrrhiza inflata) were purchased from the herbal market Sehwadang (Gwangju, Korea) in March 2018, which were identified by Dae Hyo Pharmacy Co., Ltd. (Suwon, Korea).

3.3. Extraction and Isolation of Substrates 1 and 2

The dried plant material (2.5 kg) was powdered and extracted with 95% EtOH (7.5 L × 3) and was dispersed in water and successively extracted with n-hexane, CH2Cl2, EtOAc and n-BuOH. The CH2Cl2 extract (50 g) was separated by column chromatography eluted with CHCl3: MeOH to obtain fractions C1–C20. Fraction C11 was further separated by HPLC to yield compound 1 (30 mg), and fraction C15 was further separated by HPLC to yield compound 2 (45 mg). The structures of 1 and 2 were confirmed by comparison of their 1H-NMR data with those previously reported [15,30].
Licoisoflavanone (1): 1H NMR (CD3OD, 400 MHz, δ in ppm, J in Hz) δ 6.87 (1H, d, J = 8.3, H-6′), 6.66 (1H, d, J = 10.0, H-1″), 6.32 (1H, d, J = 8.3, H-5′), 5.89 (1H, d, J = 2.2, H-6), 5.88 (1H, d, J = 2.2, H-8), 5.66 (1H, d, J = 10.0, H-2″), 4.58 (1H, t, J = 10.2, H-2a), 4.44 (1H, dd, J = 10.2, 5.4, H-2b), 4.20 (1H, dd, J = 10.2, 5.4, H-3), 1.38 (6H, s, H-4″,5″).
Glycyrrhisoflavone (2): 1H NMR (CD3OD, 400 MHz, δ in ppm, J in Hz) δ 7.96 (1H, s, H-2), 6.87 (1H, s, H-6′), 6.71 (1H, s, H-2′), 6.30 (1H, s, H-8), 6.19 (1H, s, H-6), 5.34 (1H, m, H-2″), 3.35 (2H, d, J = 7.3, H-1″), 1.72 (6H, s, H-4″,5″).

3.4. Synthesis of Substrates 3 and 4

Echinatin (3) and isobavachalcone (4) were synthesized for biotransformation due to their low yield from natural sources. Briefly, echinatin (3) was synthesized through acid-mediated Claisen-Schmidt condensation using 2,4-dihydroxybenzaldehyde with 4′-hydroxyacetophenone as starting materials (Scheme S1) [31]. Isobavachalcone (4) was synthesized through Claisen-Schmidt condensation using 4-hydroxybenzaldehyde with 2′,4′-dihydroxyacetophenone as starting materials (Scheme S2) [32]. Structures of the final products 3 and 4 were confirmed by comparing their spectroscopic data with those reported in the literatures [33,34].
Echinatin (3): 1H-NMR (CD3OD, 400 MHz, δ in ppm, J in Hz) δ 8.03 (1H, d, J = 15.6, H-α), 7.97 (2H, d, J = 8.8, H-2′,6′), 7.62 (1H, d, J = 15.6, H-α), 7.61 (1H, d, J = 8.5, H-6), 6.89 (2H, d, J = 8.8, H-3′,5′), 6.47 (1H, d, J = 2.2, H-3), 6.44 (1H, dd, J = 8.5, 2.2, H-5), 3.89 (3H, s, 2-OMe).
Isobavachalcone (4): 1H-NMR (CD3OD, 400 MHz, δ in ppm, J in Hz) δ 7.84 (1H, d, J = 8.9, H-6′), 7.78 (1H, s, J = 15.4, H-β), 7.64 (1H, d, J = 15.4, H-α), 7.62 (2H, d, J = 8.6, H-2,6), 6.85 (2H, d, J= 8.6, H-3,5), 6.43 (1H, d, J = 8.9, H-5′), 5.23 (1H, m, H-2′′), 3.33 (2H, overlapped, H-1′′), 1.78 (3H, s, H-4′′), 1.66 (3H, s, H-5′′).

3.5. Microorganisms and Screening for Biostransformation

All the microorganisms were obtained from the Korean Collection for Type Cultures (KCTC, Daejeon, Korea) and Korean Culture Center of Microorganisms (KCCM, Seoul, Korea). The strains used for preliminary screening are as follows: Absidia coerulea KCTC 6936, Aspergillus niger KCCM 60332, Aspergillus oryzae KCCM 60345, Hormoconis resinae KCTC 6966, Mortierella ramanniana var. angulispora KCTC 6137, Penicillium chrysogenum KCTC 6933, Pichia pastoris KCTC 7190, Tremella mesenterica KCTC 7131.
Fermentation experiments were performed in three types of media. A. coerulea, A. niger, A. oryzae, P. chrysogenum were incubated on malt medium (malt extract 20 g/L, D-glucose 20 g/L, peptone 1 g/L). H. resinae, M. ramanniana var. angulispora, P. pastoris were cultured on potato sucrose medium (potato dextrose 24 g/L and sucrose 20 g/L). T. mesenterica was cultured on yeast-malt medium (D-glucose 10 g/L, peptone 5 g/L, malt extract 3 g/L, and yeast extract 3 g/L).
Biotransformation was carried out according to the two-stage procedure [35]. In the screening studies, the actively growing microbial cultures were incubated in 250 mL flasks containing 50 mL of media with gentle agitation (200 rpm) at 25 °C in a temperature-controlled shaking incubator. Ethanol solution (20 mg/mL, 50 μL) of the substrate 1, 2, 3, or 4 was added to each flask 24 h after inoculation. And further incubation was performed under the same condition for six days. Two controls were used for biotransformation in this study, i.e., culture controls consisting of microorganisms growing in the culture media without substrates, and substrate controls consisting of culture media and substrates incubated without microorganisms. General sampling and TLC monitoring were performed on Merck silica gel F254-precoated glass plates. A. niger was identified as the most potent strain to metabolize 14 and therefore selected for scale-up fermentation.

3.6. Scale-up Fermentation, Extraction, and Isolation of Metabolites 521

For scale-up fermentation, A. niger was incubated in 500 mL Erlenmeyer flasks containing 150 mL of media. After a further 24 h incubation, the ethanol solution (20 mg/mL, 150 μL) of each substrate (1, 2, 3, or 4) was evenly distributed to each flask containing stage II cultures (Table 5).
After incubation, the liquid cultures of 1, 2, 3, or 4 were extracted three times with equal volumes of EtOAc, and the organic layer was collected and concentrated at reduced pressure.
The organic extract of 1 incubated with A. niger was subject to HPLC with a gradient solvent system of 45% MeOH to 67% MeOH to afford 5 (4.5 mg, tR = 50.3 min) at a flow rate of 2.0 mL/min.
The organic extract of 2 incubated with A. niger was subject to HPLC with a gradient solvent system of 55% MeOH to 69% MeOH to afford 6 (3.2 mg, tR = 14.2 min) and 7 (2.0 mg, tR = 16.2 min) at a flow rate of 2.0 mL/min.
The organic extract of 3 incubated with A. niger was subject to HPLC with a gradient solvent system of 45% MeOH to 72% MeOH to afford 8 (5.0 mg, tR = 27.1 min), 9 (2.5 mg, tR = 31.2 min).
The organic extract of 4 incubated with A. niger was subject to HPLC with a gradient solvent system of 50% MeOH to 90% MeOH to furnish nine fractions (Fr. A-I) and 13 (1.9 mg, tR = 50.3 min) at a flow rate of 2.0 mL/min. Fr. G, H, or I was further separated on HPLC eluting with a gradient solvent system from 60% MeOH to 84% MeOH to yield 10 (1.7 mg, tR = 19.3 min), 11 (2.8 mg, tR = 14.6 min), and 12 (3.6 mg, tR = 16.6 min), respectively. Fr. D was purified by HPLC with an isocratic solvent system of 65% MeOH to yield 14 (3.3 mg, tR = 20.0 min). Fr. E was further purified by HPLC with an isocratic solvent system of 65% MeOH to yield 15 (3.6 mg, tR = 18.6 min) and 16 (3.7 mg, tR = 19.4 min). Fr. F was further purified on HPLC eluting with an isocratic solvent system of 58% MeOH to yield 17 (2.8 mg, tR = 16.5 min). Fr. C was subject to HPLC with a gradient solvent system from 54% MeOH to 60% MeOH to yield 18 (2.2 mg, tR = 16.7 min) and 19 (2.7 mg, tR = 20.1 min). Fr. A was purified by HPLC with an isocratic solvent system of 55% MeOH to yield 20 (2.1 mg, tR = 7.9 min). Fr. B was purified by HPLC with an isocratic solvent system of 62% MeOH to yield 21 (1.9 mg, tR = 14.0 min).

3.7. Spectroscopic Data of Metabolites 521

3.7.1. Spectroscopic Data of the New Compounds 57, 1017, and 19

  • Compound 5
Yellow amorphous powder; [ α ] D 20 +3.1 (c 0.10, MeOH); UV (MeOH) λmax (log ε): 293 (1.25) nm; IR νmax: 3438, 2991, 2865, 1650, 1514, 1094 cm−1; HRESIMS m/z: 393.0953 [M + Na]+ (calcd for C20H18O7Na, 393.0950); 1H- and 13C-NMR data (see Table 1).
2.
Compound 6
Yellow amorphous powder; [ α ] D 20 −8.3 (c 0.10, MeOH); UV (MeOH) λmax (log ε): 262 (1.08) nm; IR νmax: 3321, 2931, 2607, 1741, 1522, 1098 cm−1; HRESIMS m/z: 411.1060 [M + Na]+ (calcd for C20H20O8Na, 411.1056); 1H- and 13C-NMR data (see Table 1).
3.
Compound 7
Yellow amorphous powder; [ α ] D 20 +5.5 (c 0.10, MeOH); UV (MeOH) λmax (log ε): 262 (0.90) nm; IR νmax: 3431, 2922, 2858, 1651, 1512, 1187, 1078 cm−1; HRESIMS m/z: 393.0951 [M + Na]+ (calcd for C20H18O7Na, 393.0950); 1H- and 13C-NMR data (see Table 1).
4.
Compound 10
Pale yellow amorphous powder; UV (MeOH) λmax (log ε) 220 (1.25), 285 (0.98) nm; IR νmax 3278, 2938, 1614, 1515, 1438, 1225, 1098, 812 cm−1; HRESIMS m/z 381.1678 [M + Na]+ (calcd for C21H26O5Na, 381.1678; 1H- and 13C-NMR data (see Table 2).
5.
Compound 11
Yellow amorphous powder; UV (MeOH) λmax (log ε) 365 (1.38) nm; IR νmax 3322, 2947, 1635, 1450, 1236, 1109, 1017 cm−1; HRESIMS m/z 379.1519 [M + Na]+ (calcd for C21H24O5Na, 379.1521); 1H- and 13C-NMR data (see Table 2).
6.
Compound 12
Pale yellow amorphous powder; UV (MeOH) λmax (log ε) 220 (1.32), 286 (0.90), 326 (sh) nm; IR νmax 3365, 2933, 1618, 1516, 1437, 1226, 805 cm−1; HRESIMS m/z 395.1833 [M + Na]+ (calcd for C22H28O5Na, 395.1834); 1H- and 13C-NMR data (see Table 2).
7.
Compound 13
Pale yellow amorphous powder; UV (MeOH) λmax (log ε) 220 (1.83), 286 (1.41), 327 (sh) nm; IR νmax 3393, 2925, 1598, 1516, 1418, 1372, 1218, 1110 cm−1; HRESIMS m/z 349.1416 [M + Na]+ (calcd for C20H22O4Na, 349.1416; 1H- and 13C-NMR data (see Table 2).
8.
Compound 14
Pale yellow amorphous powder; UV (MeOH) λmax (log ε) 222 (1.31), 280 (0.86), 313 (sh) nm; IR νmax 3300, 2922, 1584, 1515, 1440, 1371, 1218, 1158, 1050 cm−1; HRESIMS m/z 349.1415 [M + Na]+ (calcd for C20H22O4Na, 349.1416); 1H- and 13C-NMR data (see Table 3).
9.
Compound 15
Pale yellow amorphous powder; [ α ] D 25 −52.2 (c 0.5, MeOH); UV (MeOH) λmax (log ε) 214 (1.44), 294 (0.87) nm; IR νmax 3288, 2976, 1614, 1516, 1439, 1370, 1220, 1096, 1054 cm−1; HRESIMS m/z 365.1364 [M + Na]+ (calcd for C20H22O5Na, 365.1365); 1H- and 13C-NMR data (see Table 3).
10.
Compound 16
Pale yellow amorphous powder; [ α ] D 25 −11.0 (c 0.8, MeOH); UV (MeOH) λmax (log ε) 215 (1.78), 286 (1.14), 324 (sh) nm; IR νmax 3358, 2933, 1616, 1516, 1371, 1218, 1108, 803 cm−1; HRESIMS m/z 365.1366 [M + Na]+ (calcd for C20H22O5Na, 365.1365); 1H- and 13C-NMR data (see Table 3).
11.
Compound 17
Yellow amorphous powder; UV (MeOH) λmax (log ε) 370 (1.13) nm; IR νmax 3358, 2933, 1616, 1516, 1371, 1218, 1108, 803 cm−1; HRESIMS m/z 365.1365 [M + Na]+ (calcd for C20H22O5Na, 365.1365); 1H- and 13C-NMR data (see Table 3).
12.
Compound 19
Yellow amorphous powder; UV (MeOH) λmax (log ε) 220 (1.32), 286 (1.02), 324 (sh) nm; IR νmax 3269, 2971, 1615, 1516, 1442, 1370, 1228, 1099, 1051 cm−1; HRESIMS m/z 367.1521 [M + Na]+ (calcd for C20H24O5Na, 367.1521); 1H- and 13C-NMR data (see Table 3).

3.7.2. 1H-NMR Data of the Compounds 8, 9, 18, 20, and 21

  • Compound 8
1H-NMR (CD3OD, 400 MHz, δ in ppm, J in Hz) δ 8.00 (1H, d, J = 15.7, H-α), 7.60 (1H, d, J = 15.7, H-β), 7.59 (1H, d, J = 8.4, H-6), 7.52 (1H, dd, J = 8.2, 2.0, H-6′), 7.49 (1H, d, J = 2.0, H-2′), 6.87 (1H, d, J = 8.2, H-5′), 6.48 (1H, d, J = 2.1, H-3), 6.46 (1H, dd, J = 8.4, 2.1, H-5), 3.89 (3H, s, OMe).
2.
Compound 9
1H-NMR (CD3OD, 400 MHz, δ in ppm, J in Hz) δ 7.87 (2H, d, J = 8.8, H-2′,6′), 6.93 (1H, d, J = 8.2, H-6), 6.83 (2H, d, J = 8.8, H-3′,5′), 6.39 (1H, d, J = 2.2, H-3), 6.29 (1H, d, J = 8.2, 2.2, H-5), 3.77 (3H, s, OMe), 3.10 (2H, d, J = 7.4, H-α), 2.85 (2H, t, J = 7.4, H-β).
3.
Compound 18
1H-NMR (DMSO-d6, 400 MHz, δ in ppm, J in Hz) δ 14.28 (OH), 7.94 (1H, d, J = 9.1, H-6′), 7.74~7.67 (4H, overlapped, H-α,β,2,6), 6.84 (2H, d, J = 8.5, H-3,5), 6.31 (1H, d, J = 9.1, H-5′), 3.40 (1H, dd, J = 9.7, 2.1, H-2″), 2.91 (1H, dd, J = 13.5, 2.1, H-1″a), 2.47 (1H, overlapped, H-1″b), 1.11 (3H, s, H-4″), 1.10 (3H, s, H-5″).
4.
Compound 20
1H-NMR (DMSO-d6, 400 MHz, δ in ppm, J in Hz) δ 13.27 (OH), 7.62 (1H, d, J = 9.1, H-6′), 7.06 (2H, d, J = 7.9, H-2,6), 6.67 (2H, d, J = 7.9, H-3,5), 6.30 (1H, d, J = 9.1, H-5′), 3.39 (1H, overlapped, H-2″), 3.15 (2H, t, J = 7.5, H-α), 2.86 (1H, m, H-1″a), 2.81 (2H, t, J = 7.5, H-β), 2.47 (1H, overlapped, H-1″b), 1.09 (6H, s, H-4″,5″).
5.
Compound 21
1H-NMR (DMSO-d6, 400 MHz, δ in ppm, J in Hz) δ 7.50 (2H, d, J = 8.9, H-2,6), 7.48 (1H, d, J = 15.8, H-β), 7.42 (1H, d, J = 15.8, H-α), 7.39 (1H, d, J = 8.6, H-6′), 6.82 (2H, d, J = 8.6, H-3,5), 6.44 (1H, d, J = 8.6, H-5′), 3.68 (1H, m, H-2″), 2.80 (1H, dd, J = 17.2, 5.4, H-1″a), 2.43 (1H, dd, J = 17.2, 7.5, H-1″b), 1.33 (3H, s, H-4″), 1.24 (3H, s, H-5″).

3.8. Cytotoxicity Assay

Tested compound solutions were prepared in DMSO and stored as stock solution at 4 °C. Upon dilution into culture medium, the final DMSO concentration was below 1% (v/v), a concentration without effect on cell replication. The human cancer cell lines consisted of human melanoma (A375P), human colorectal adenocarcinoma (HT-29), and breast adenocarcinoma (MCF-7). All cell lines were cultured in Dulbecco’s modified Eagle’s medium (DMEM) with 5% fetal bovine serum (FBS), 100 U/mL penicillin and 100 μg/mL streptomycin in a humidified incubator at 37 °C with 5% CO2. The cells were plated into 96-well plates at approximately 5000 cells per well suspended in 100 μL medium. After being cultivated for 24 h, the culture medium was removed, and serial dilutions of the test compounds were treated into each well containing cells in duplicates. After being cultivated for 48 h, the culture medium was removed and 100 μL of MTT solution (0.5 mg/mL) was added to each well and incubated for another 4 h. Following dissolving the MTT formazan crystals, absorbance of the plates was read on a microplate reader at 490 nm for measuring the reduction of the tetrazolium salt MTT (3-(4,5-dimethylthiazol-2-yl)-2,5-diphenyltetrazolium bromide) by metabolically active cells. Demethylzeylasteral (DZ) was used as a positive control. IC50 values were calculated and are presented in the Table 4.

4. Conclusions

Biotransformation of licoisoflavanone (1), glycyrrhisoflavone (2), echinatin (3), and isobavachalcone (4) by the filamentous fungus A. niger furnished twelve new (57, 1017 and 19) and five known (8, 9, 18, 20 and 21) metabolites. Compounds 1 and 12 showed most considerable cytotoxic activities against all human cancer cell lines investigated including A375P, MCF-7, and HT-29.
A. niger is a filamentous ascomycete fungus that is ubiquitous in soils, plants, animals, and even in marine environments [36]. Investigations focused on microbial biotransformation of bioactive compounds revealed that A. niger has been considered as a potential biocatalyst for the modification of chemicals to identify undescribed derivatives or chemical intermediates [37,38]. In this study, A. niger demonstrated its ability to catalyze various reactions for isoflavonoids and chalcones including hydroxylation, hydrogenation, epoxidation, hydrolysis, reduction, cyclization, and alkylation reactions. It’s worth noting that the metabolic routes were affected by the presence or absence of a linear prenyl group in the substrates. In the presence of a linear prenyl group in substrates 2 and 4, metabolism preferentially took place on the prenyl group by A. niger. Conversely, metabolism took place on ring A or α,β-double bond in substrates 1 and 3 which lack linear prenyl groups. It is hypothesized that presence of the linear prenyl group may be given a higher priority in the regioselectivity rendered by A. niger.
In traditional herbal medicine and oriental clinical practice, licorice has been used as a potential anti-cancer or cancer chemopreventive natural agent [39]. Biological investigations have revealed that licorice extracts show different cytotoxic activities [40,41,42,43]. However, most studies on the effective constituents responsible for these bioactivities are focused on the major compounds such as glycyrrhizin, isoangustone A, glabridin, liquiritigenin, isoliquiritigenin, and licochalcone A [44,45,46,47]. Little is known on the biological effects of the phenolic compounds that have been isolated from licorice. In this study, comparative evaluation on the cytotoxicity of the licorice constituents (14) and their metabolites (521) has been conducted to investigate structure-cytotoxic activity relationship using three human cancer cell lines A375P, HT-29 and MCF-7. Compound 1 showed potent cytotoxic activities, with IC50 values ranging from 7.5 to 9.2 μM against the three cancer cell lines tested. However, its metabolite 5 was inactive, indicating that introduction of the hydroxyl group at C-8 of licoisoflavanone could decrease its cytotoxic activity. Meanwhile, compound 2 showed moderate cytotoxic activity whereas its metabolites 6 and 7 were inactive, suggesting that the prenyl group at C-5′ position could improve the cytotoxic activities instead of the 2,3-dihydroxy-3-methylbutyl or 2,3-epoxy-3-methylbutyl groups. On the other hand, metabolite 8 showed improved cytotoxic activities compared with its parent compound 3, indicating the importance of the hydroxyl group at C-3′ position for retrochalcone. Noteworthily, metabolite 12 showed more potent cytotoxic activities than its parent compound 4 against A375P, HT-29 and MCF-7 cancer cell lines with IC50 values ranging from 4.4 to 10.1 μM. Whereas other metabolites (10, 11, and 1321) exhibited reduced cytotoxic activities compared with 4 against the three cell lines tested.
These results generate new ideas for the investigation of cytotoxic constituents from licorice and provide a potential value for the development of more potent inhibitors of tumor promotion.

Supplementary Materials

The following are available online at https://www.mdpi.com/article/10.3390/ijms221810109/s1.

Author Contributions

Conceptualization, I.-S.L.; methodology, Y.X. and I.-S.L.; validation, Y.X.; formal analysis, I.-S.L.; investigation, Y.X., F.H. and I.-S.L.; resources, Y.X.; data curation, Y.X. and F.H.; writing-original draft preparation, Y.X.; writing-review and editing, I.-S.L. and F.H.; visualization, Y.X.; supervision, I.-S.L.; project administration, I.-S.L.; funding acquisition, I.-S.L. and Y.X. All authors have read and agreed to the published version of the manuscript.

Funding

This research was supported by the Basic Science Research Program through the National Research Foundation of Korea (NRF), funded by the Ministry of Education (NRF-2019R1I1A3A01043084 and NRF-2021R1I1A1A01056116).

Data Availability Statement

Not applicable.

Acknowledgments

The authors are grateful for the NMR and IR experimental supports of the Center for Research Facilities, Chonnam National University, as well as for the NMR and HRESIMS experimental supports of Korea Basic Science Institute (KBSI). We thank Gwangju Branch of Korea Basic Science Institute (KBSI) for running NMR experiments.

Conflicts of Interest

The authors declare no conflict of interest.

References

  1. Lilly, M.D. Advances in biotransformation processes. Chem. Eng. Sci. 1994, 49, 151–159. [Google Scholar] [CrossRef]
  2. Hegazy, M.E.F.; Mohamed, T.A.; ElShamy, A.I.; Abou-El-Hamd, H.; Mahalel, U.A.; Reda, E.H.; Shaheen, A.M.; Tawfik, W.A.; Shahat, A.A.; Shams, K.A.; et al. Microbial biotransformation as a tool for drug development based on natural products from mevalonic acid pathway: A review. J. Adv. Res. 2015, 6, 17–33. [Google Scholar] [CrossRef] [PubMed] [Green Version]
  3. Haque, S.; Singh, V.; Katiyar, D.; Khan, M.T.A.; Tripathi, V.; El Enshasy, H.; Pasupuleti, M.; Mishra, B.N. Biotransformation of newly synthesized coumarin derivatives by Candida albicans as potential antibacterial, antioxidant and cytotoxic agents. Process Biochem. 2019, 87, 138–144. [Google Scholar]
  4. Shanu-Wilson, J.; Evans, L.; Wrigley, S.; Steele, J.; Atherton, J.; Boer, J. Biotransformation: Impact and application of metabolism in drug discovery. ACS Med. Chem. Lett. 2020, 11, 2087–2107. [Google Scholar] [CrossRef] [PubMed]
  5. Han, F.; Lee, I.-S. Microbial transformation of bavachin by Absidia coerulea. Phytochem. Lett. 2016, 18, 136–139. [Google Scholar] [CrossRef]
  6. Dou, F.; Wang, Z.; Li, G.; Dun, B. Microbial transformation of flavonoids by Isaria fumosorosea ACCC 37814. Molecules 2019, 24, 1028. [Google Scholar] [CrossRef] [PubMed] [Green Version]
  7. Chokchaisiri, R.; Chaichompoo, W.; Sukcharoen, O.; Suksamrarn, A.; Ganranoo, L. Microbial transformation of isocoronarin D by Cunninghamella echinulata NRRL 1386. Nat. Prod. Res. 2019, 33, 2890–2896. [Google Scholar] [CrossRef]
  8. Pervaiz, I.; Ahmad, S.; Madni, M.; Ahmad, H.; Khaliq, F. Microbial biotransformation: A tool for drug designing. Appl. Biochem. Microbiol. 2013, 49, 437–450. [Google Scholar] [CrossRef]
  9. Liu, J.-H.; Yu, B.-Y. Biotransformation of bioactive natural products for pharmaceutical lead compounds. Curr. Org. Chem. 2010, 14, 1400–1406. [Google Scholar] [CrossRef]
  10. Salter, R.; Beshore, D.C.; Colletti, S.L.; Evans, L.; Gong, Y.; Helmy, R.; Liu, Y.; Maciolek, C.M.; Martin, G.; Pajkovic, N. Microbial biotransformation-an important tool for the study of drug metabolism. Xenobiotica 2019, 49, 877–886. [Google Scholar] [CrossRef]
  11. Ma, Y.; Sun, P.; Zhao, Y.; Wang, K.; Chang, X.; Bai, Y.; Zhang, D.; Yang, L. A microbial transformation model for simulating mammal metabolism of artemisinin. Molecules 2019, 24, 315. [Google Scholar] [CrossRef] [Green Version]
  12. Murphy, C.D. Drug metabolism in microorganisms. Biotechnol. Lett. 2015, 37, 19–28. [Google Scholar] [CrossRef]
  13. Hosseinzadeh, H.; Nassiri-Asl, M. Pharmacological effects of Glycyrrhiza spp. and its bioactive constituents: Update and review. Phytother. Res. 2015, 29, 1868–1886. [Google Scholar] [CrossRef]
  14. Ji, S.; Li, Z.; Song, W.; Wang, Y.; Liang, W.; Li, K.; Tang, S.; Wang, Q.; Qiao, X.; Zhou, D. Bioactive constituents of Glycyrrhiza uralensis (licorice): Discovery of the effective components of a traditional herbal medicine. J. Nat. Prod. 2016, 79, 281–292. [Google Scholar] [CrossRef]
  15. McKee, T.C.; Bokesch, H.R.; McCormick, J.L.; Rashid, M.A.; Spielvogel, D.; Gustafson, K.R.; Alavanja, M.M.; Cardellina, J.H.; Boyd, M.R. Isolation and characterization of new anti-HIV and cytotoxic leads from plants, marine, and microbial organisms. J. Nat. Prod. 1997, 60, 431–438. [Google Scholar] [CrossRef] [PubMed]
  16. Won, D.-H.; Shin, B.-K.; Han, J.-H. Synthesis and the absolute configurations of isoflavanone enantiomers. J. Appl. Biol. Chem. 2008, 51, 17–19. [Google Scholar] [CrossRef] [Green Version]
  17. Tangdenpaisal, K.; Songthammawat, P.; Akkarasereenon, K.; Chuayboonsong, K.; Ruchirawat, S.; Ploypradith, P. Total synthesis of palodesangren B trimethyl ether and D dimethyl ether via a late-stage formation of 2H-pyran-2-one of the tetrahydrobenzo[c]pyranochromenone core. J. Org. Chem. 2019, 84, 13410–13429. [Google Scholar] [CrossRef] [PubMed]
  18. Meksuriyen, D.; Cordell, G.A. Retrodihydrochalcones from Dracaena loureiri. J. Nat. Prod. 1988, 51, 1129–1135. [Google Scholar] [CrossRef]
  19. Abegaz, B.M.; Ngadjui, B.T.; Dongo, E.; Ngameni, B.; Nindi, M.N.; Bezabih, M. Chalcones and other constituents of Dorstenia prorepens and Dorstenia zenkeri. Phytochemistry 2002, 59, 877–883. [Google Scholar] [CrossRef]
  20. Akihisa, T.; Tokuda, H.; Hasegawa, D.; Ukiya, M.; Kimura, Y.; Enjo, F.; Suzuki, T.; Nishino, H. Chalcones and other compounds from the exudates of Angelica keiskei and their cancer chemopreventive effects. J. Nat. Prod. 2006, 69, 38–42. [Google Scholar] [CrossRef]
  21. Torres, S.L.; Arruda, M.S.P.; Arruda, A.C.; Müller, A.H.; Silva, S.C. Flavonoids from Brosimum acutifolium. Phytochemistry 2000, 53, 1047–1050. [Google Scholar] [CrossRef]
  22. Won, T.H.; Song, I.-H.; Kim, K.-H.; Yang, W.-Y.; Lee, S.K.; Oh, D.-C.; Oh, W.-K.; Oh, K.-B.; Shin, J. Bioactive metabolites from the fruits of Psoralea corylifolia. J. Nat. Prod. 2015, 78, 666–673. [Google Scholar] [CrossRef] [PubMed]
  23. Zhao, T.; Yan, G.R.; Pan, S.L.; Wang, H.Y.; Hou, A.J. New Isoprenylated 2-arylbenzofurans and pancreatic lipase inhibitory constituents from Artocarpus nitidus. Chem. Biodivers. 2009, 6, 2209–2216. [Google Scholar] [CrossRef]
  24. Zhao, M.-B.; Zhou, S.-X.; Zhang, Q.-Y.; Wei, W.-F.; Li, M.-H.; Xing, J.-Y.; Jiang, Y.; Tu, P.-F. Prenylated benzoic acid derivatives from the stem of Euodia lepta. Nat. Prod. Res. 2017, 31, 1589–1593. [Google Scholar] [CrossRef] [PubMed]
  25. Takashima, J.; Komiyama, K.; Ishiyama, H.; Kobayashi, J.i.; Ohsaki, A. Brosimacutins JM, four new flavonoids from Brosimum acutifolium and their cytotoxic activity. Planta Med. 2005, 71, 654–658. [Google Scholar] [CrossRef] [PubMed]
  26. Takashima, J.; Ohsaki, A. Brosimacutins A-I, nine new flavonoids from Brosimum acutifolium. J. Nat. Prod. 2002, 65, 1843–1847. [Google Scholar] [CrossRef]
  27. Suri, J.; Gupta, G.; Dhar, K.; Atal, C. Bavachromanol: A new chalcone from the seeds of Psoralea corylifolia. Phytochemistry 1980, 19, 336–337. [Google Scholar] [CrossRef]
  28. Shah, P.A.; Wiemer, D.F. Synthesis of bavachromanol from resorcinol via a tandem cationic cascade/EAS sequence. Tetrahedron Lett. 2018, 59, 1363–1365. [Google Scholar] [CrossRef]
  29. Mosmann, T. Rapid colorimetric assay for cellular growth and survival: Application to proliferation and cytotoxicity assays. J. Immunol. Methods 1983, 65, 55–63. [Google Scholar] [CrossRef]
  30. Jiang, M.; Zhao, S.; Yang, S.; Lin, X.; He, X.; Wei, X.; Song, Q.; Li, R.; Fu, C.; Zhang, J. An “essential herbal medicine”-licorice: A review of phytochemicals and its effects in combination preparations. J. Ethnopharmacol. 2020, 249, 112439. [Google Scholar] [CrossRef]
  31. Chung, W.T.; Lee, S.H.; Dai Kim, J.; Sung, N.S.; Hwang, B.; Lee, S.Y.; Yu, C.Y.; Lee, H.Y. Effect of the extracts from Glycyrrhiza uralensis Fisch on the growth characteristics of human cell lines: Anti-tumor and immune activation activities. Cytotechnology 2001, 37, 55–64. [Google Scholar] [CrossRef] [PubMed]
  32. Lee, C.K.; Park, K.K.; Lim, S.S.; Park, J.H.Y.; Chung, W.Y. Effects of the licorice extract against tumor growth and cisplatin-induced toxicity in a mouse xenograft model of colon cancer. Biol. Pharm. Bull. 2007, 30, 2191–2195. [Google Scholar] [CrossRef] [Green Version]
  33. Rathi, S.; Suthar, M.; Patel, P.; Bhaskar, V.; Rajgor, N. In-vitro cytotoxic screening of Glycyrrhiza glabra L. (Fabaceae): A natural anticancer drug. J. Young Pharm. 2009, 1, 239. [Google Scholar] [CrossRef] [Green Version]
  34. Fukuchi, K.; Okudaira, N.; Adachi, K.; Odai-Ide, R.; Watanabe, S.; Ohno, H.; Yamamoto, M.; Kanamoto, T.; Terakubo, S.; Nakashima, H. Antiviral and antitumor activity of licorice root extracts. In Vivo 2016, 30, 777–785. [Google Scholar] [CrossRef] [PubMed] [Green Version]
  35. Wang, G.; Hiramoto, K.; Ma, N.; Yoshikawa, N.; Ohnishi, S.; Murata, M.; Kawanishi, S. Glycyrrhizin attenuates carcinogenesis by inhibiting the inflammatory response in a murine model of colorectal cancer. Int. J. Mol. Sci. 2021, 22, 2609. [Google Scholar] [CrossRef] [PubMed]
  36. Perfect, J.R.; Cox, G.M.; Lee, J.Y.; Kauffman, C.A.; De Repentigny, L.; Chapman, S.W.; Morrison, V.A.; Pappas, P.; Hiemenz, J.W.; Stevens, D.A.; et al. The impact of culture isolation of Aspergillus species: A hospital-based survey of aspergillosis. Clin. Infect. Dis. 2001, 33, 1824–1833. [Google Scholar] [CrossRef] [Green Version]
  37. Chen, G.; Song, Y.; Ge, H.; Ren, J.; Yang, X.; Li, J. Biotransformation of 20(S)-protopanaxatriol by Aspergillus niger and the cytotoxicity of the resulting metabolites. Phytochem. Lett. 2015, 11, 111–115. [Google Scholar] [CrossRef]
  38. Parshikov, I.A.; Woodling, K.A.; Sutherland, J.B. Biotransformations of organic compounds mediated by cultures of Aspergillus niger. Appl. Microbiol. Biotechnol. 2015, 99, 6971–6986. [Google Scholar] [CrossRef]
  39. Liu, Y.; Xie, S.; Wang, Y.; Luo, K.; Wang, Y.; Cai, Y. Liquiritigenin inhibits tumor growth and vascularization in a mouse model of HeLa cells. Molecules 2012, 17, 7206–7216. [Google Scholar] [CrossRef] [Green Version]
  40. Bode, A.M.; Dong, Z. Chemopreventive effectsof licorice and its components. Curr. Pharmacol. Rep. 2015, 1, 60–71. [Google Scholar] [CrossRef] [Green Version]
  41. Tang, Z.-H.; Li, T.; Tong, Y.-G.; Chen, X.-J.; Chen, X.-P.; Wang, Y.-T.; Lu, J.-J. A systematic review of the anticancer properties of compounds isolated from licorice (Gancao). Planta Med. 2015, 81, 1670–1687. [Google Scholar] [CrossRef] [Green Version]
  42. Hatano, T.; Kagawa, H.; Yasuhara, T.; Okuda, T. Two new flavonoids and other constituents in licorice root: Their relative astringency and radical scavenging effects. Chem. Pharm. Bull. 1988, 36, 2090–2097. [Google Scholar] [CrossRef] [Green Version]
  43. Wang, Z.; Cao, Y.; Paudel, S.; Yoon, G.; Cheon, S.H. Concise synthesis of licochalcone C and its regioisomer, licochalcone H. Arch. Pharm. Res. 2013, 36, 1432–1436. [Google Scholar] [CrossRef]
  44. Grealis, J.P.; Müller-Bunz, H.; Ortin, Y.; Casey, M.; McGlinchey, M.J. Synthesis of isobavachalcone and some organometallic derivatives. Eur. J. Org. Chem. 2013, 2, 332–347. [Google Scholar] [CrossRef]
  45. Hou, S.-S.; Chen, S.-Y.; Yang, M.-Z.; Li, X.-M.; Lu, D.-Y.; Zhang, J.; Chen, L. Isolation and identification of echinatin from cultured cells of Glycyrrhiza uralensis. J. Integr. Plant Biol. 1993, 35, 567–571. [Google Scholar]
  46. Pistelli, L.; Spera, K.; Flamini, G.; Mele, S.; Morelli, I. Isoflavonoids and chalcones from Anthyllis hermanniae. Phytochemistry 1996, 42, 1455–1458. [Google Scholar] [CrossRef]
  47. Smith, R.V.; Rosazza, J.P. Microbial models of mammalian metabolism. J. Pharm. Sci. 1975, 64, 1737–1759. [Google Scholar] [CrossRef] [PubMed]
Figure 1. Compounds 57 obtained by biotransformation of 1 and 2 with A. niger. Selected HMBC correlations (1H→13C) of compounds 57 are indicated by arrows.
Ijms 22 10109 g001
Figure 2. Compounds 821 obtained by biotransformation of 3 and 4 with A. niger.
Ijms 22 10109 g002
Figure 3. Selected HMBC (1H→13C) and COSY (1H−1H) correlations of compounds 10 and 12.
Ijms 22 10109 g003
Figure 4. Proposed metabolic pathways of 4 catalyzed by A. niger. Pathways a and b, represented by the arrows in red and blue respectively, are proposed as the two routes to form a new ring in compound 19. * Compound 22 is proposed as an intermediate which could not be unambiguously identified in this study.
Ijms 22 10109 g004
Table 1. 1H- and 13C-NMR data for 57 in CD3OD.
No.567
C/HδH a (J/Hz)δC bδH a (J/Hz)δC bδH a (J/Hz)δC b
24.65 t (8.3)70.58.04 s153.58.03 s153.6
34.53 dd
(10.0, 5.4)
4.23 dd
(10.0, 5.4)
46.9 127.2 123.3
4 197.9 180.9 180.8
5 156.0 162.4 162.4
65.99 s95.46.22 d (2.1)98.76.22 d (2.0)98.8
7 157.0 164.6 164.5
8 125.36.34 d (2.1)93.46.33 d (2.0)93.5
9 149.2 158.3 158.3
10 102.0 104.9 104.9
1′ 115.7 123.6 122.7
2′ 150.76.81 d (2.1)122.36.75 d (2.1)120.8
3′ 110.9 143.9 141.2
4′ 153.3 145.1 145.3
5′6.34 d (8.3)108.5 122.0 120.6
6′6.91 d (8.3)129.36.92 d (2.1)114.26.86 s113.8
1″6.69 d (10.0)116.62.97 dd (14.0, 1.9)
2.68 dd (14.0, 10.2)
32.83.03 dd (16.7, 5.4)
2.74 dd (16.7, 7.3)
30.7
2″5.68 d (10.0)129.13.65 dd (10.2, 1.9)79.23.79 m69.2
3″ 75.1 72.5 77.4
4″1.40 s26.51.25 s24.31.39 s24.4
5″1.40 s26.41.25 s23.61.31 s19.6
Assignments were achieved based on HSQC and HMBC. J values (Hz) are given in parentheses. a 400 MHz. b 100 MHz.
Table 2. 1H- and 13C-NMR data for 1013.
No.10 a11 a12 b13 b
C/HδH c (J/Hz)δC dδH c (J/Hz)δC dδH c (J/Hz)δC dδH c (J/Hz)δC d
α3.17 t (7.6)38.97.71 s117.33.18 t (7.4)40.03.17 t (7.4)39.9
β2.81 t (7.6)29.37.71 s143.62.97 t (7.4)29.92.97 t (7.4)29.9
C=O 203.9 191.1 204.0 203.9
1 131.0 125.6 133.2 133.3
2,67.04 d (8.6)129.27.73 d (8.6)131.07.10 d (8.2)129.67.11 d (8.3)129.6
3,56.66 d (8.6)115.06.84 d (8.6)115.96.77 d (8.2)115.56.77 d (8.3)115.5
4 155.5 160.5 154.2 154.1
1′ 111.5 112.0 112.8 112.3
2′ 162.3 163.7 162.3 163.0
3′ 115.2 115.4 116.8 109.3
4′13.13 s (OH)162.314.05 s (OH)163.713.10 s (OH)162.613.17 s (OH)160.8
5′6.41 d (8.9)107.86.47 d (8.9)107.96.41 d (8.9)108.76.32 d (9.0)109.3
6′7.63 d (8.9)129.87.97 d (8.9)129.57.53 d (8.9)129.67.51 d (9.0)128.9
1″2.50
(overlay)
16.62.53 m16.72.74 t (6.8)15.52.69 t (6.8)16.4
2″1.52 m37.41.55 m37.41.77 t (6.8)41.61.81 t (6.8)32.0
3″ 73.9 73.9 76.3 75.9
4″1.12 s25.01.14 s25.01.21 s24.71.34 s26.8
5″1.12 s25.01.14 s25.01.21 s24.71.34 s26.8
1′′′3.13 s48.43.15 s48.43.56 q (7.0)57.6
2′′′ 1.29 t (7.0)15.6
Assignments were achieved based on HSQC and HMBC. J values (Hz) are given in parentheses. a Data were acquired in DMSO-d6. b Data were acquired in CDCl3. c 500 MHz. d 125 MHz.
Table 3. 1H- and 13C-NMR data for 1417 and 19 in DMSO-d6.
No.1415161719
C/HδH a (J/Hz)δC bδH a (J/Hz)δC bδH a (J/Hz)δC bδH a (J/Hz)δC bδH a (J/Hz)δC b
α3.12 t (7.3)44.93.23 t (7.7)39.53.23 t (7.1)39.07.72 s117.53.17 t (7.7)38.9
β2.75 t (7.3)29.52.82 t (7.7)29.22.82 t (7.1)29.17.72 s143.62.81 t (7.7)29.3
C=O 198.6 204.6 204.6 191.1 203.8
1 131.7 130.9 130.8 125.7 131.0
2,67.00 d (8.1)128.97.06 d (8.0)129.27.06 d (8.3)129.17.74 d (8.0)131.17.06 d (8.2)129.2
3,56.66 d (8.1)115.06.67 d (8.0)115.16.67 d (8.3)115.06.84 d (8.0)125.76.67 d (8.2)115.0
4 155.3 155.6 155.5 160.4 155.5
1′ 118.2 113.7 112.0 112.0 111.4
2′ 155.2 159.4 162.1 163.8 162.3
3′ 108.1 113.3 107.8 115.8 115.6
4′ 161.212.80 s (OH)166.813.18 s (OH)159.314.06 s (OH)163.813.13 s (OH)162.3
5′6.40 d (8.6)107.06.41 d (8.7)101.76.34 d (8.9)108.56.43 d (9.0)108.06.40 d (8.8)107.9
6′7.38 d (8.6)129.17.81 d (8.7)132.97.73 d (8.9)129.77.98 d (9.0)129.57.63 d (8.8)129.7
1″2.55 t (6.7)17.03.04 d (8.8)26.52.78 dd (17.0, 5.1)
2.46 dd (17.0, 7.0)
25.22.57 m17.52.54 m17.4
2″1.76 t (6.7)31.14.71 t (8.8)91.23.67 t (5.1)67.01.50 m42.31.47 m42.3
3″ 74.7 70.1 78.4 69.0 69.0
4″1.29 s26.51.13 s25.81.27 s25.21.14 s29.21.13 s29.1
5″1.29 s26.51.12 s24.81.20 s20.91.14 s29.21.13 s29.1
Assignments were achieved based on HSQC and HMBC. J values (Hz) are given in parentheses. a 400 MHz. b 100 MHz.
Table 4. Cytotoxic activities of compounds 14 and their metabolites 521 a.
CompoundIC50 ± SD (μM)CompoundIC50 ± SD (μM)
A375PHT-29MCF-7A375PHT-29MCF-7
18.09 ± 0.357.54 ± 0.709.20 ± 0.13124.35 ± 0.355.77 ± 0.2810.07 ± 1.11
225.48 ± 1.5325.98 ± 0.7226.99 ± 0.771327.38 ± 0.6760.15 ± 1.1533.87 ± 1.80
3>100>100>1001431.90 ± 1.2777.65 ± 1.3347.43 ± 1.91
45.21 ± 0.3921.34 ± 1.4020.94 ± 0.191566.57 ± 1.91>100>100
5>100>100>1001628.91 ± 1.99>10082.77 ± 1.82
6>100>100>1001742.98 ± 0.62>10043.58 ± 1.39
7>100>100>1001870.05 ± 1.27>100>100
829.41 ± 1.8657.17 ± 4.2859.44 ± 0.391921.92 ± 2.2670.39 ± 1.5368.26 ± 2.28
9>100>100>1002057.60 ± 0.67>10085.25 ± 1.51
1014.20 ± 0.4073.39 ± 0.4847.23 ± 1.0721>100>100>100
1129.38 ± 0.59>10061.75 ± 1.57DZ2.10 ± 0.0610.13 ± 0.272.33 ± 0.05
a Results are expressed as the mean values of three experiments ± SD; Demethylzeylasteral (DZ) was used as a positive control.
Table 5. Scale-up fermentation of substrates with A. niger.
SubstrateSubstrate Amount (mg/Flask)Number of FlasksTotal Extract Amount (g)
1380.22
23130.47
33150.54
43361.36
Publisher’s Note: MDPI stays neutral with regard to jurisdictional claims in published maps and institutional affiliations.

