
Transcriptomic Analysis of the Differential Nephrotoxicity of Diverse Brominated Flame Retardants in Rat and Human Renal Cells

 ,
,  and
and
Abstract
:1. Introduction
2. Results
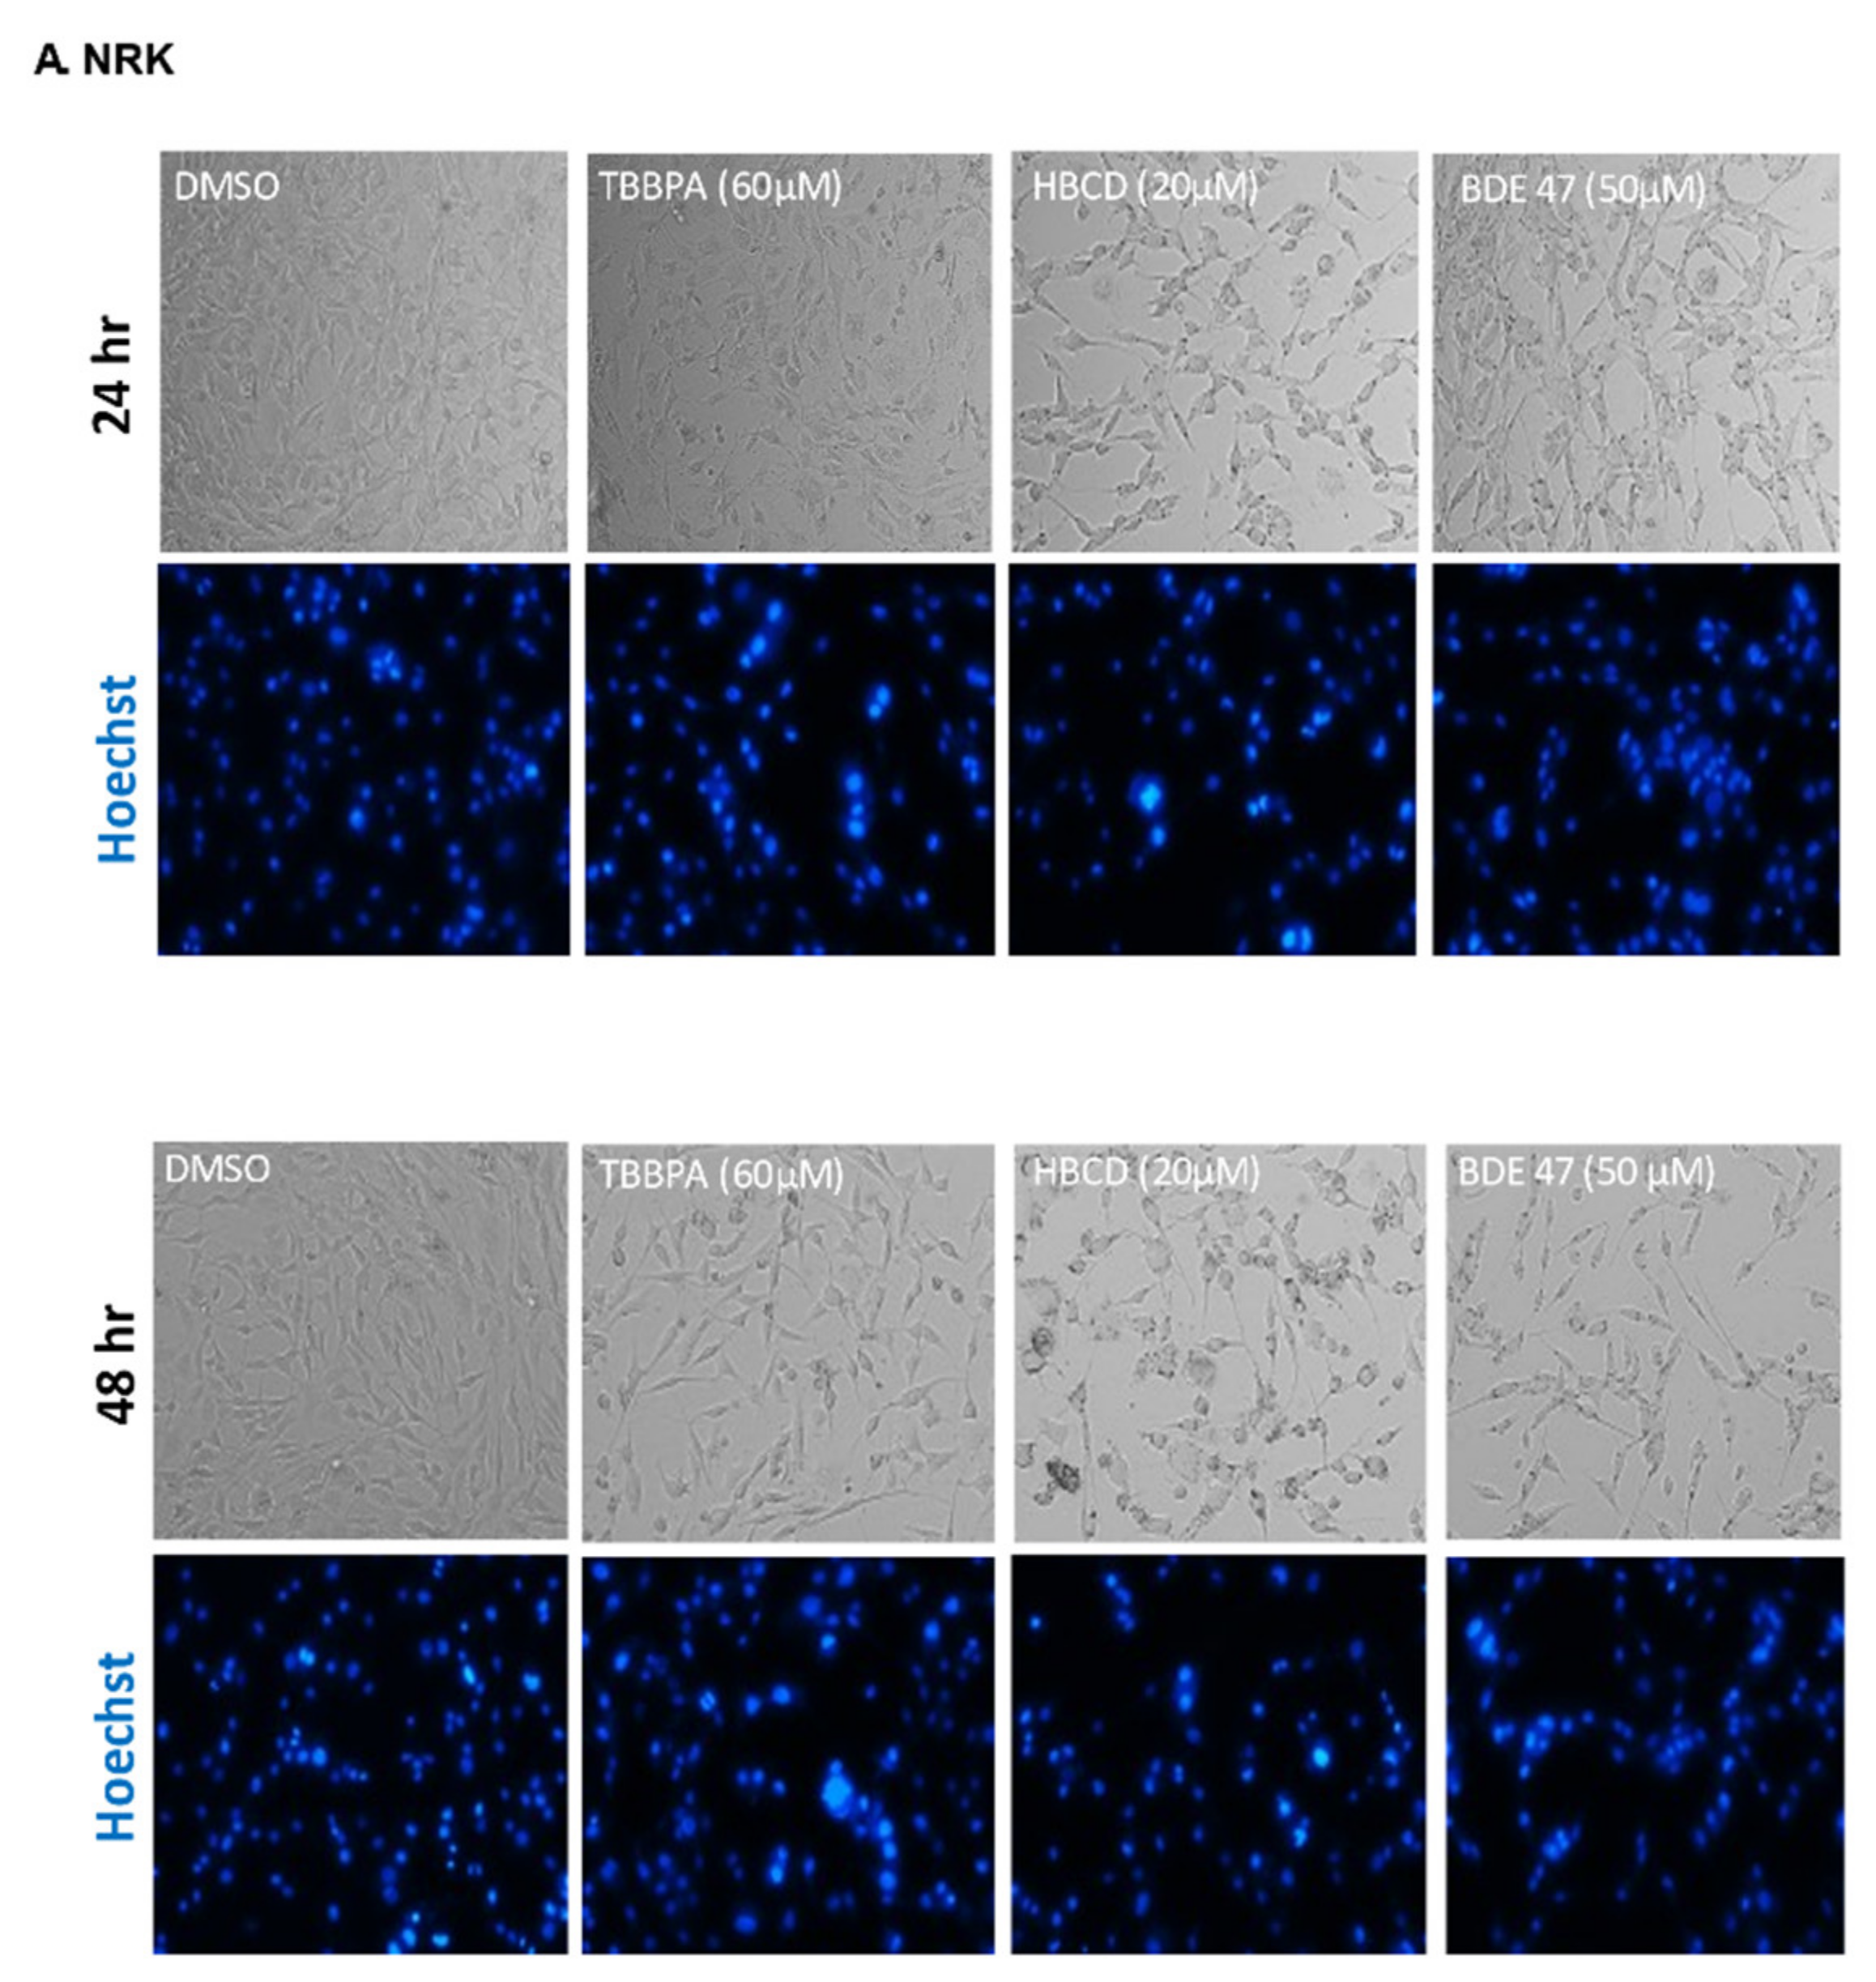
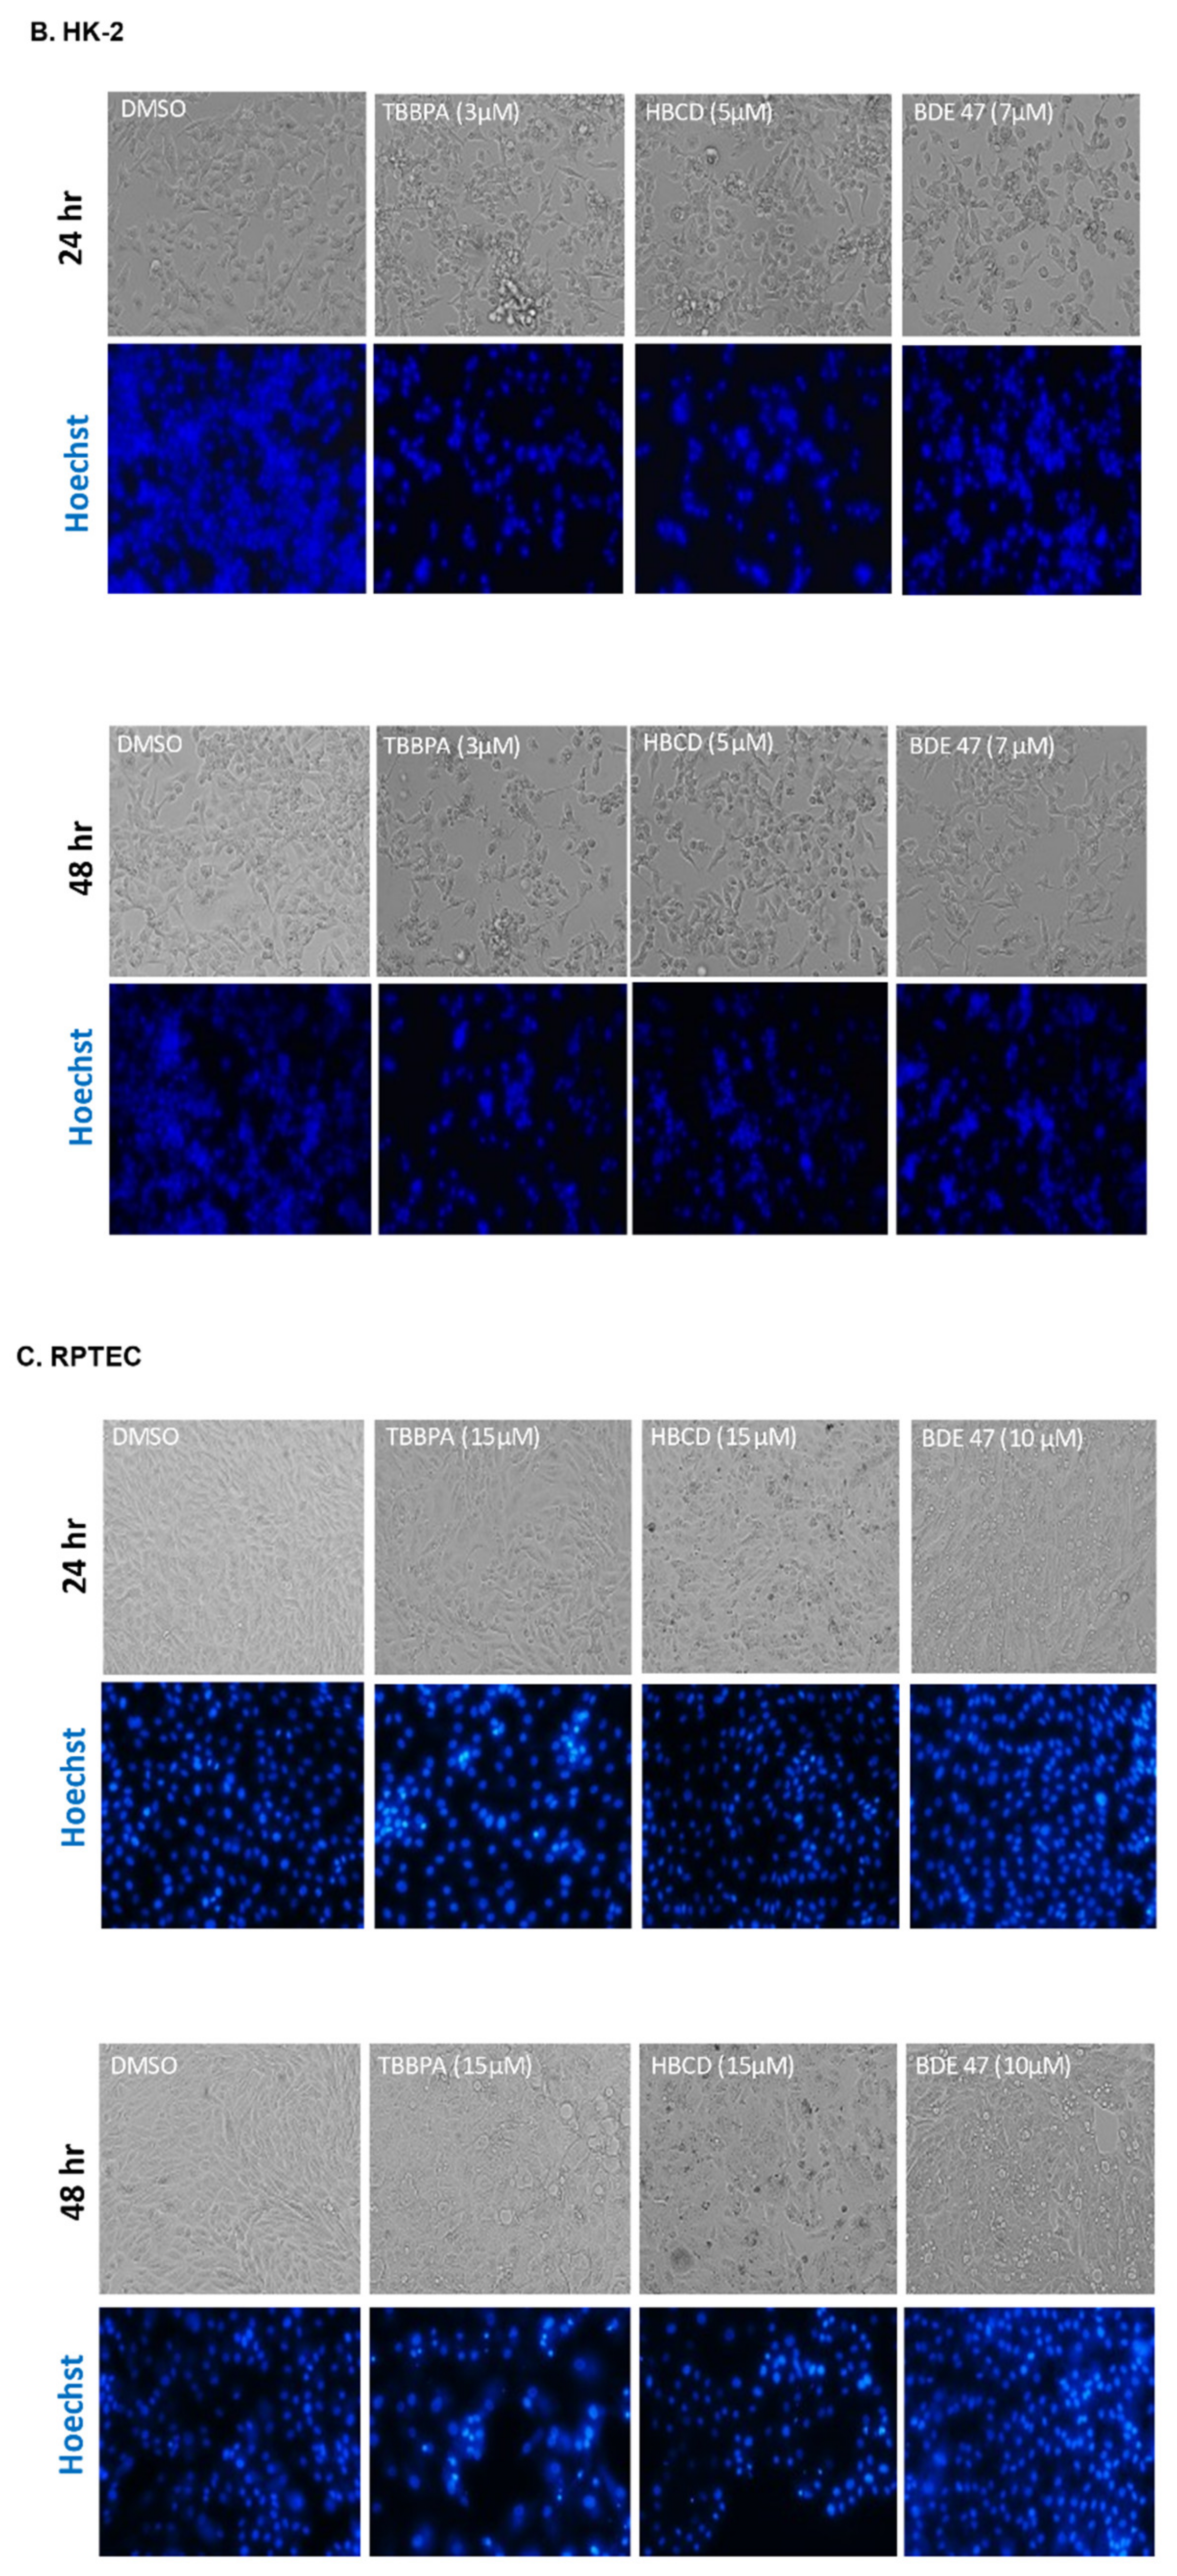
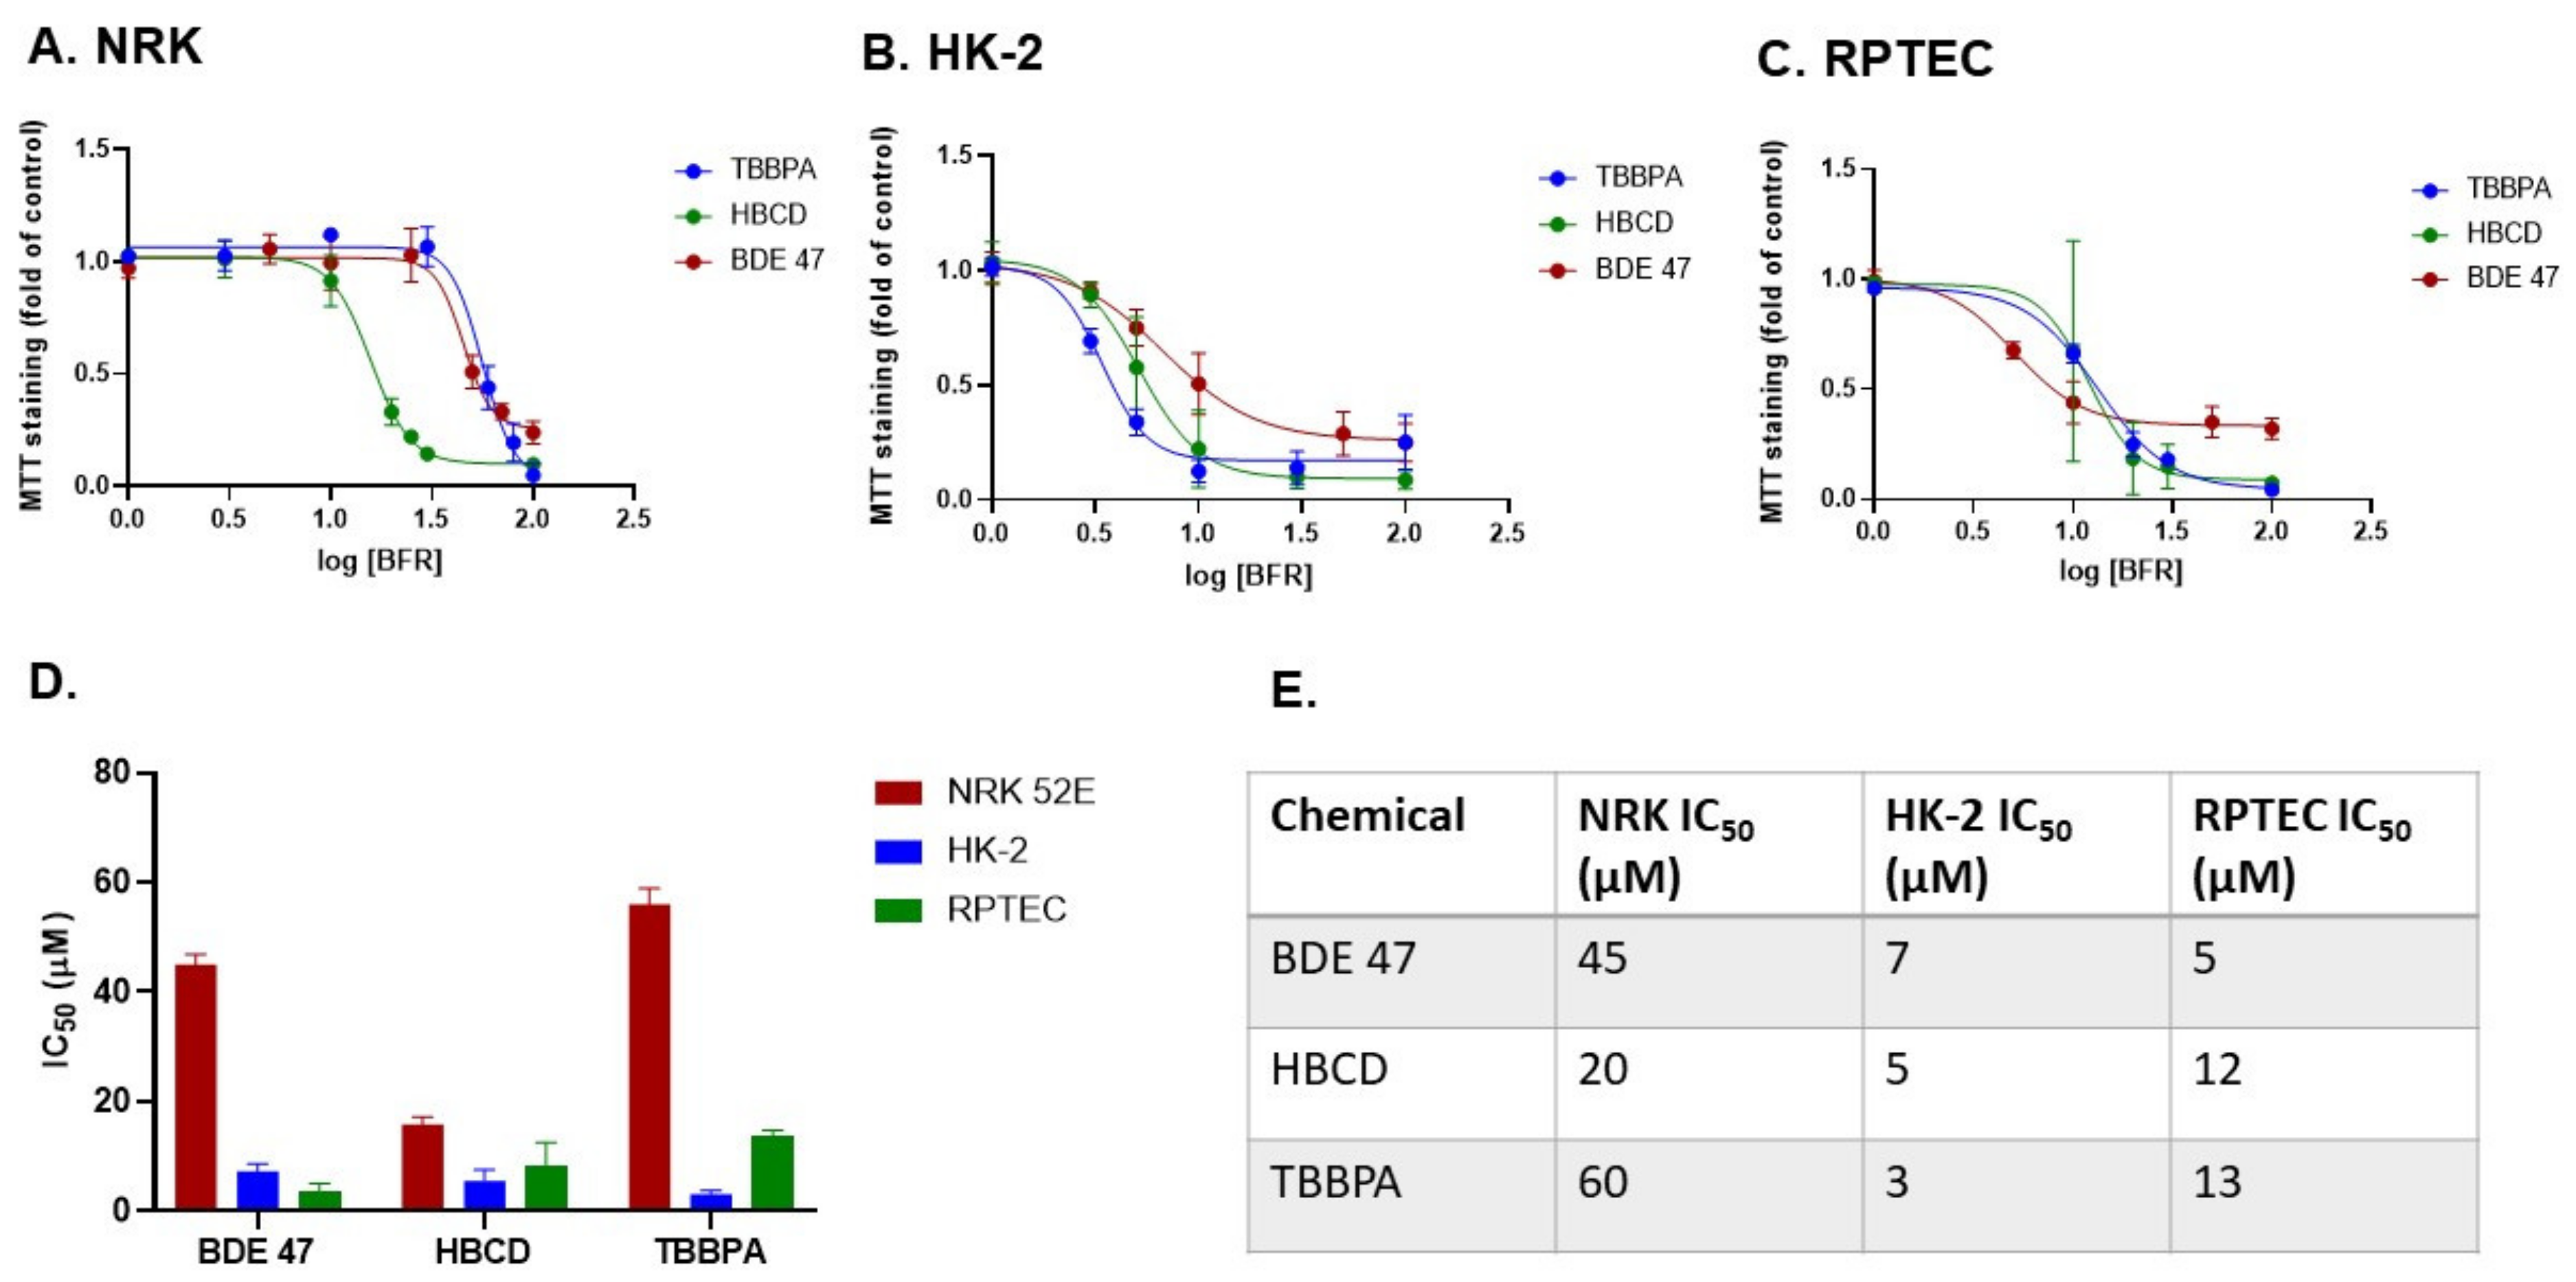
2.1. Dose and Cell Line-Dependent Toxicity of BFRs in Rat and Human Renal Epithelial Cells
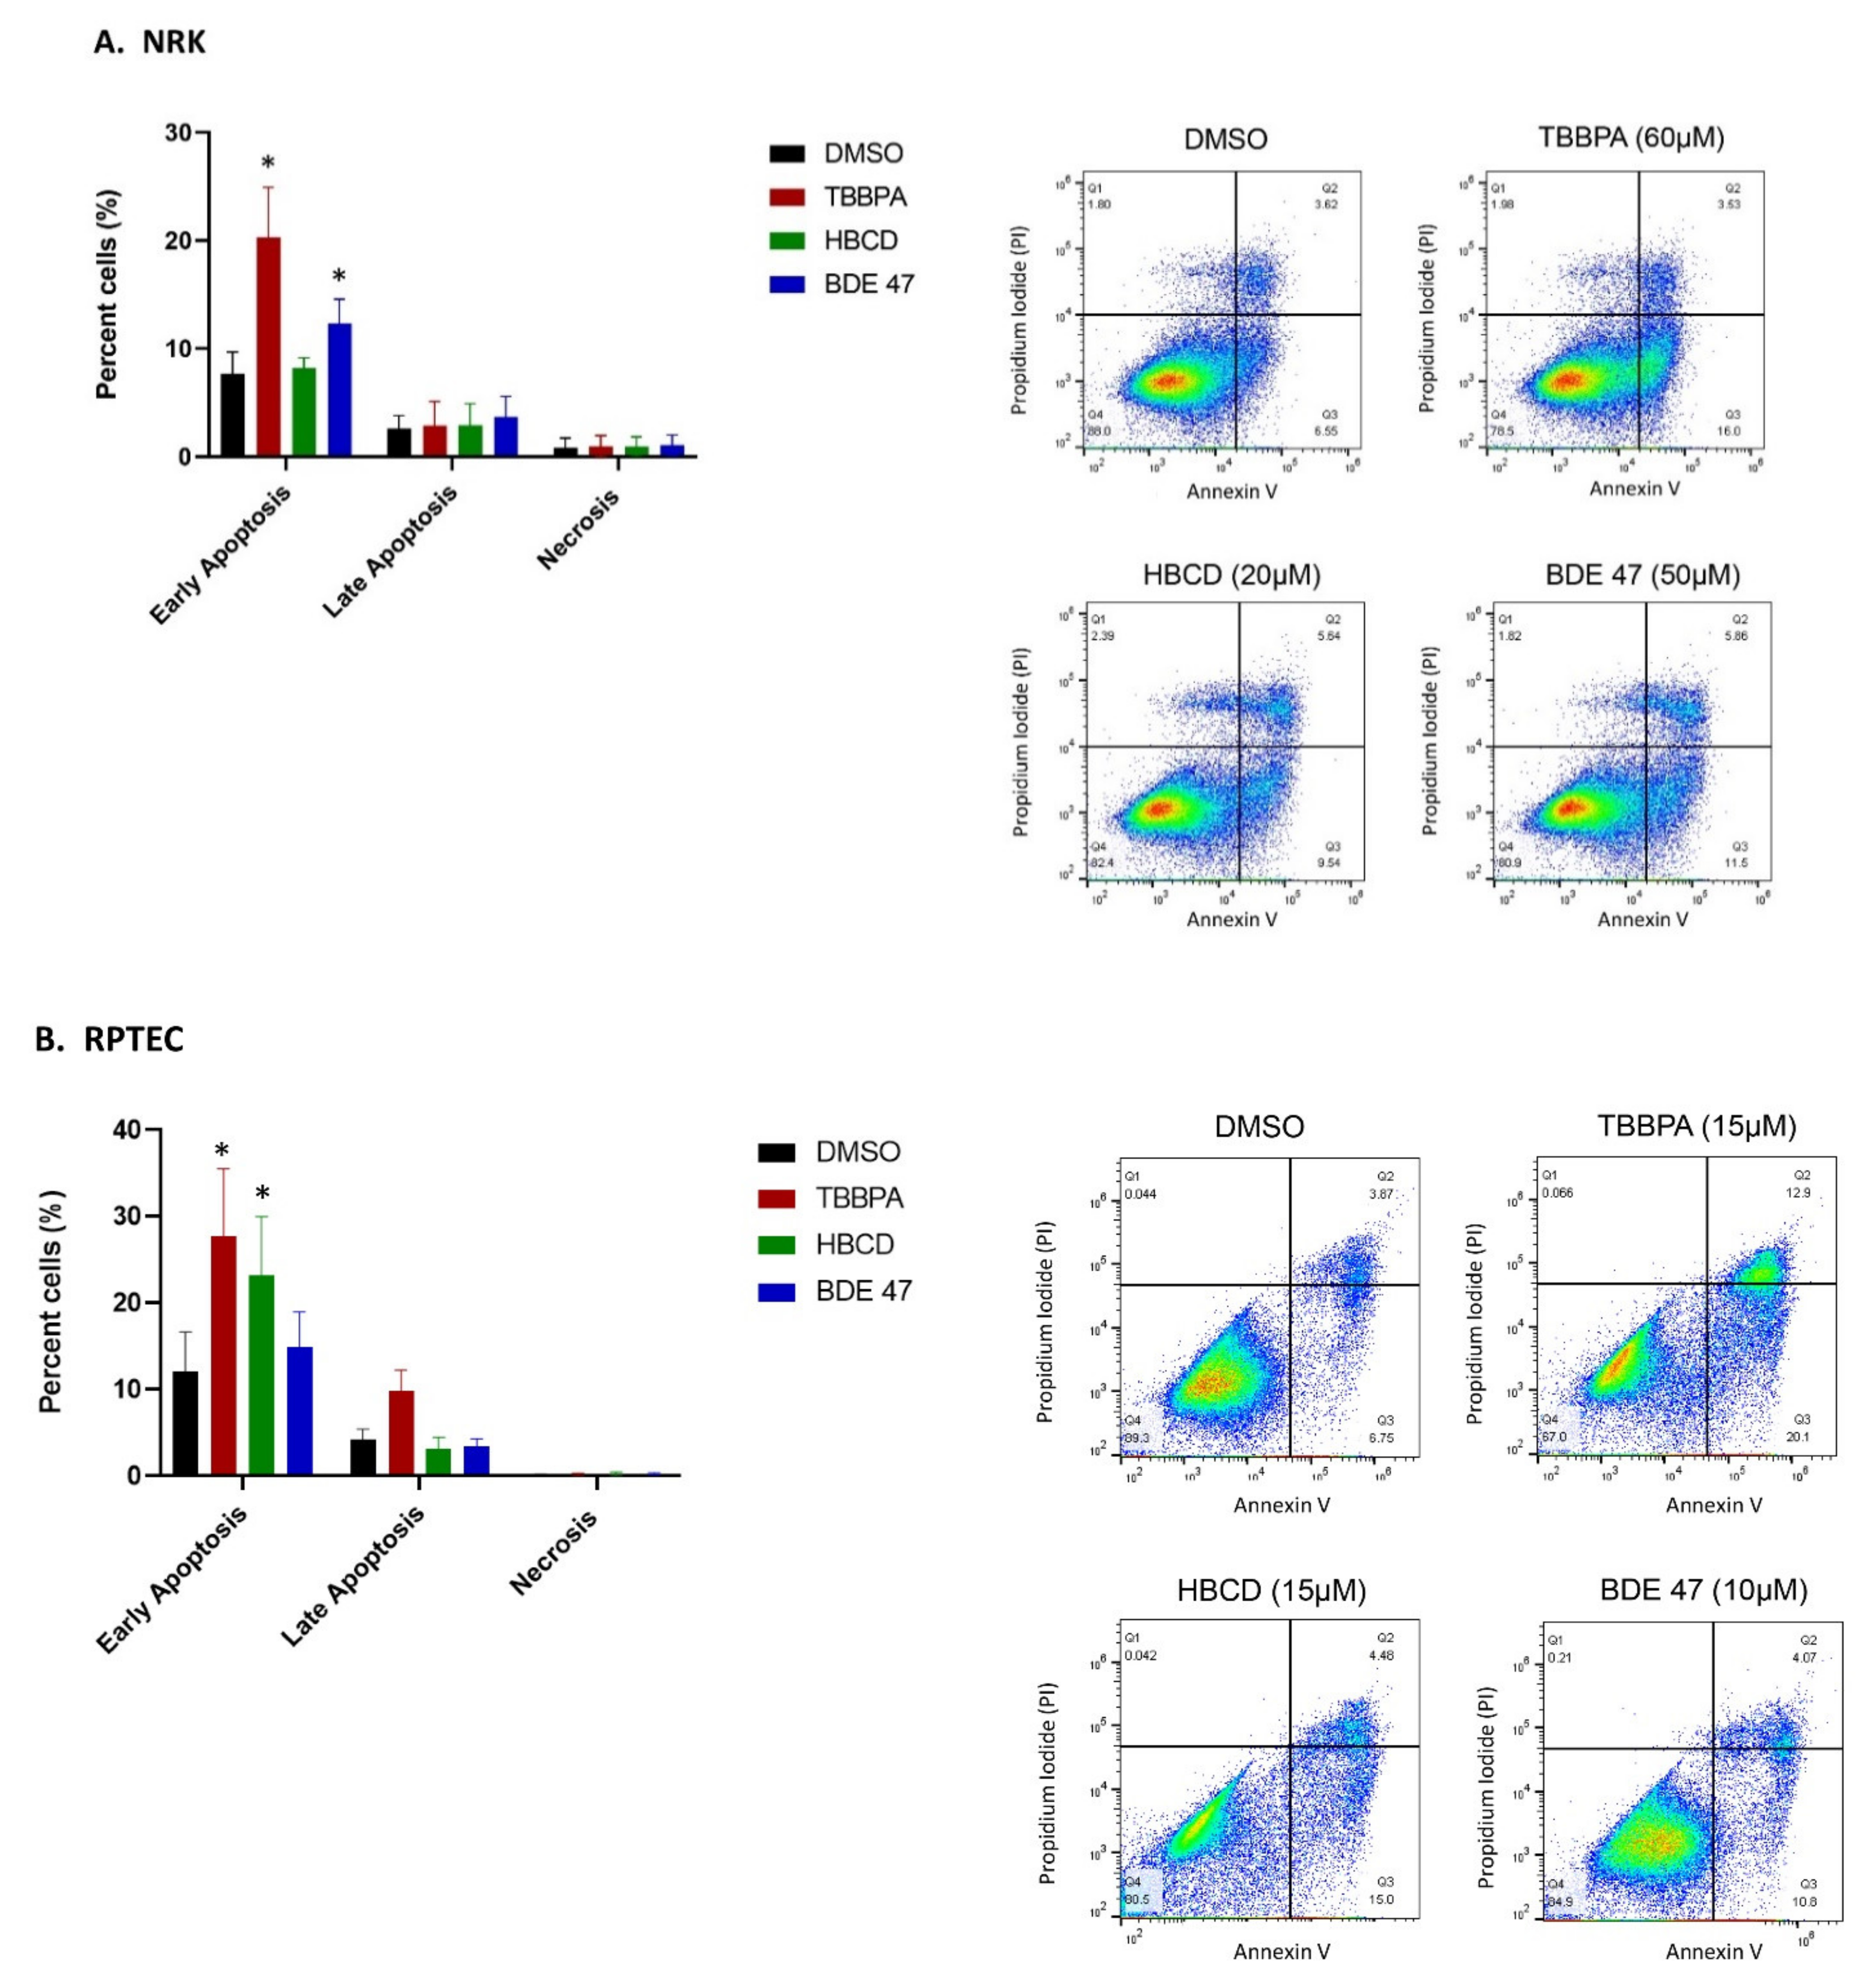
2.2. Effect of BFRs on Apoptosis
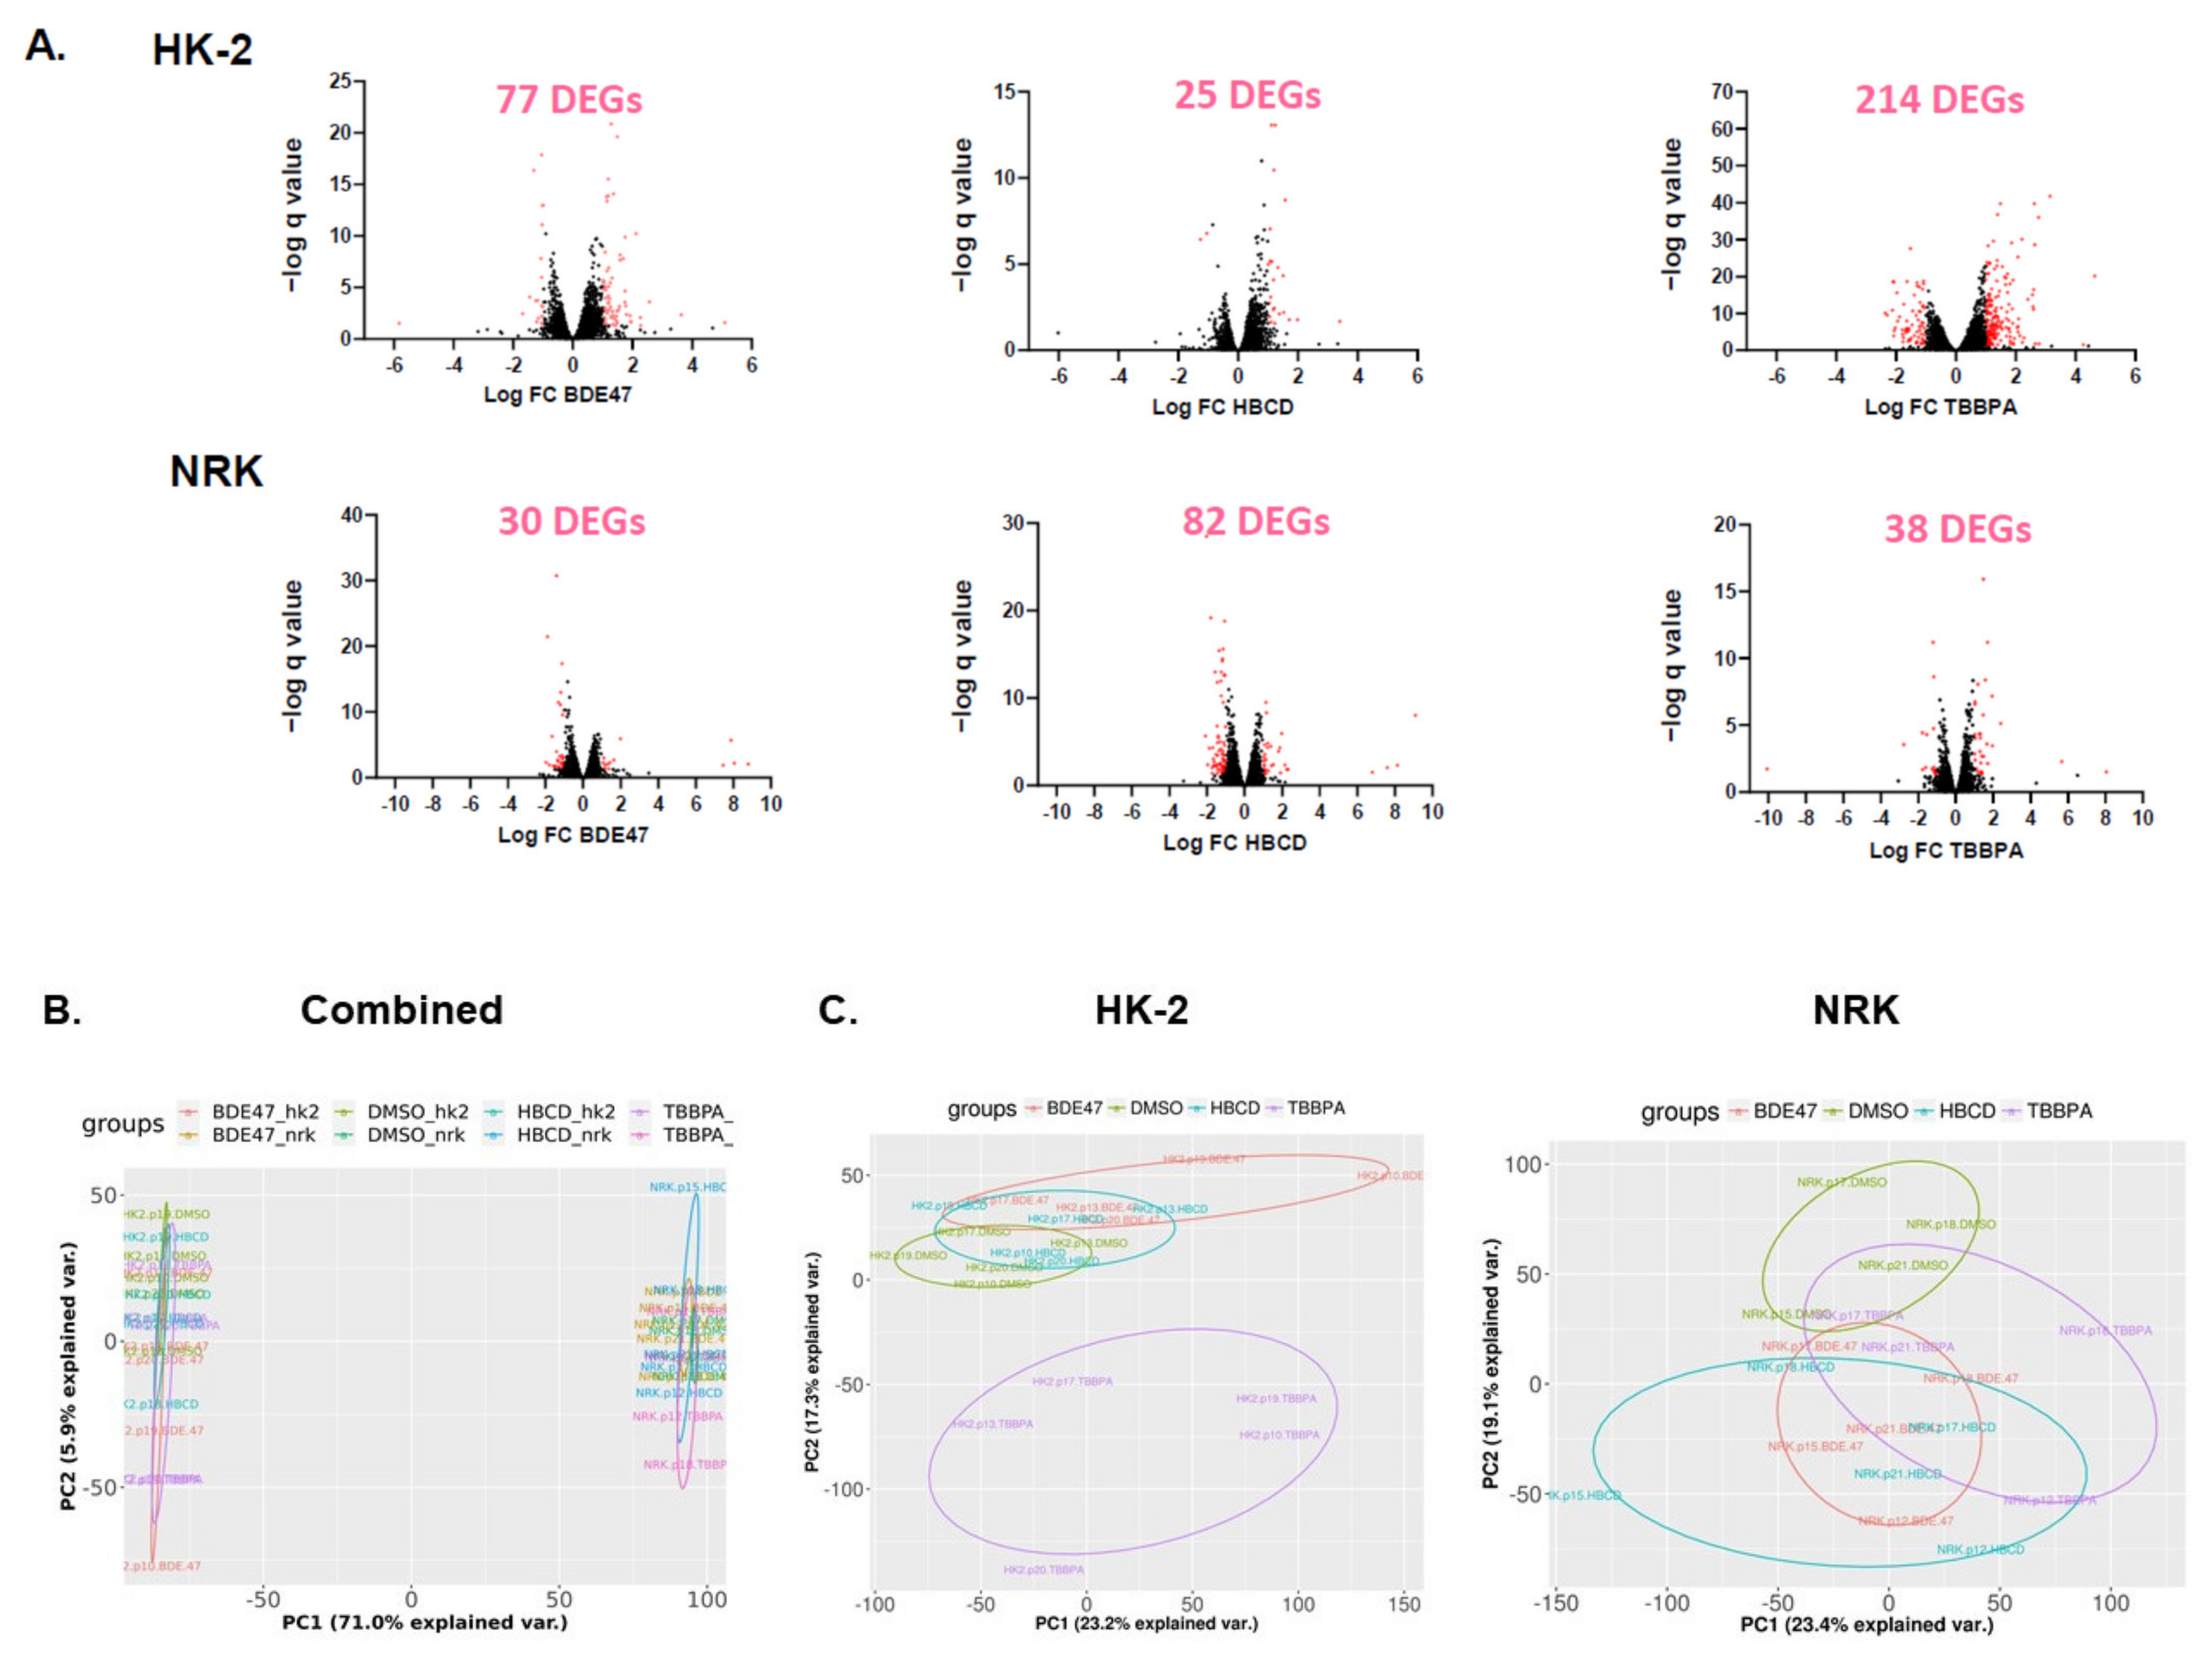
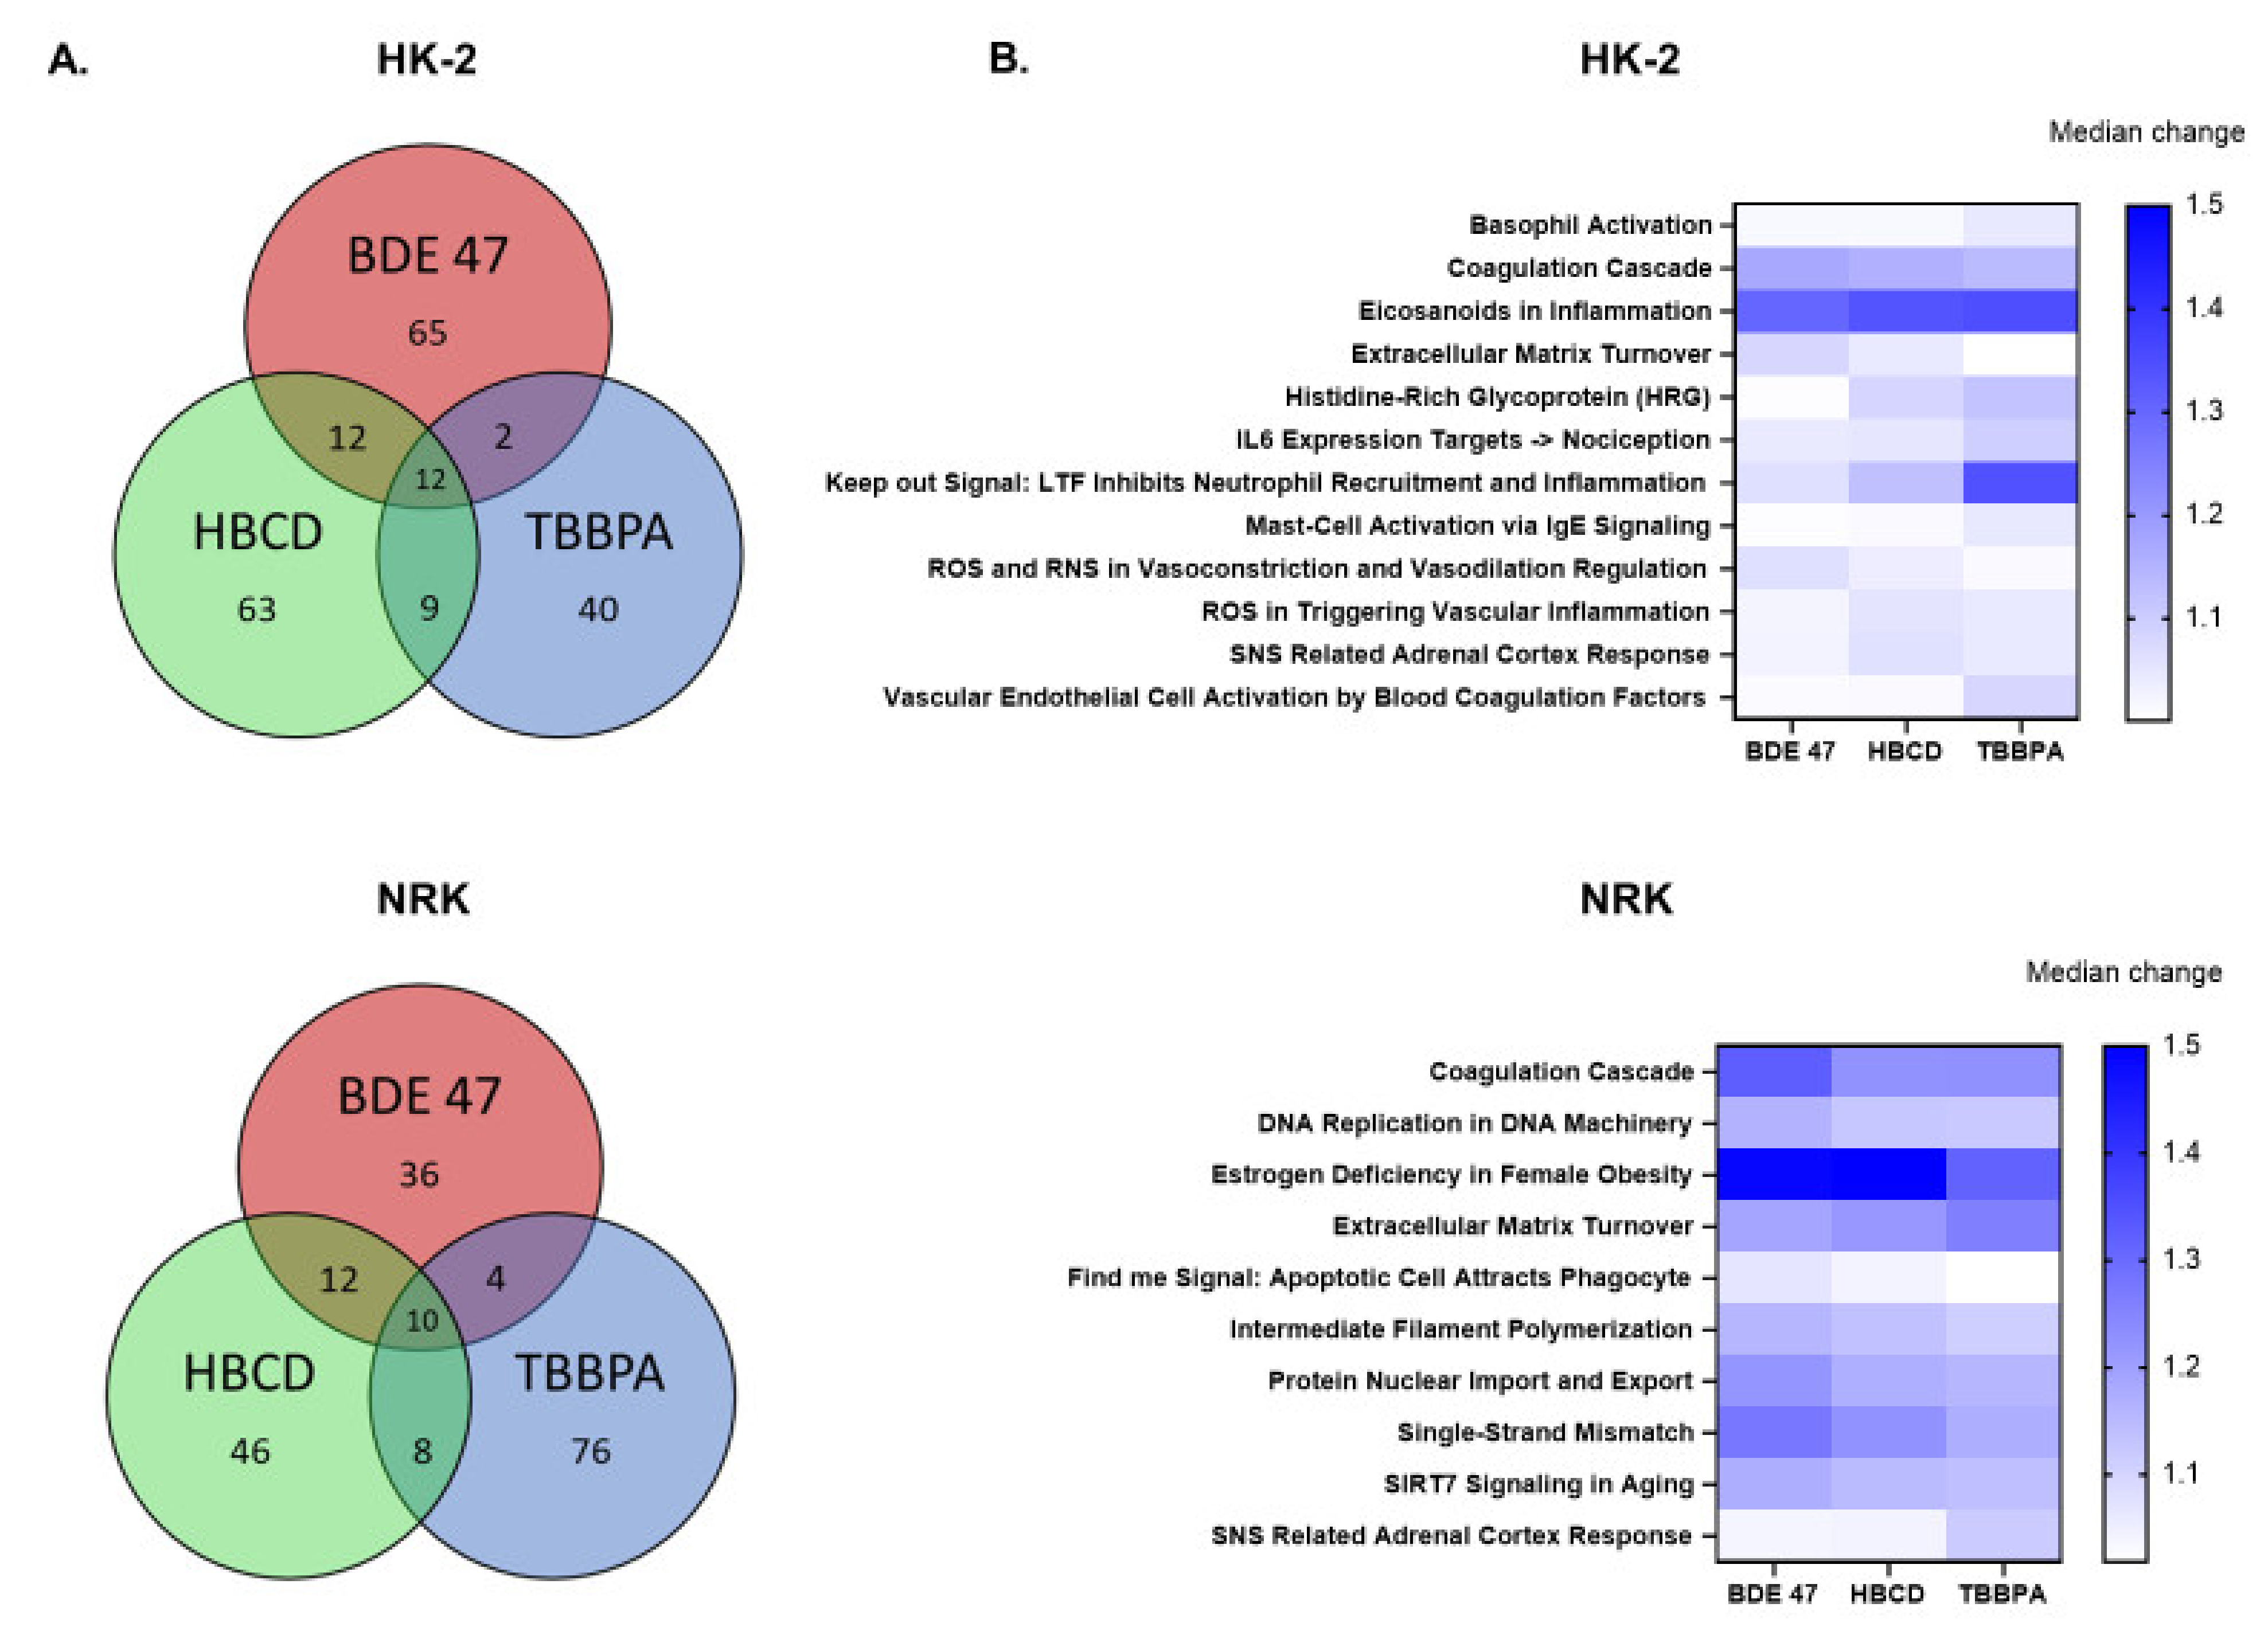
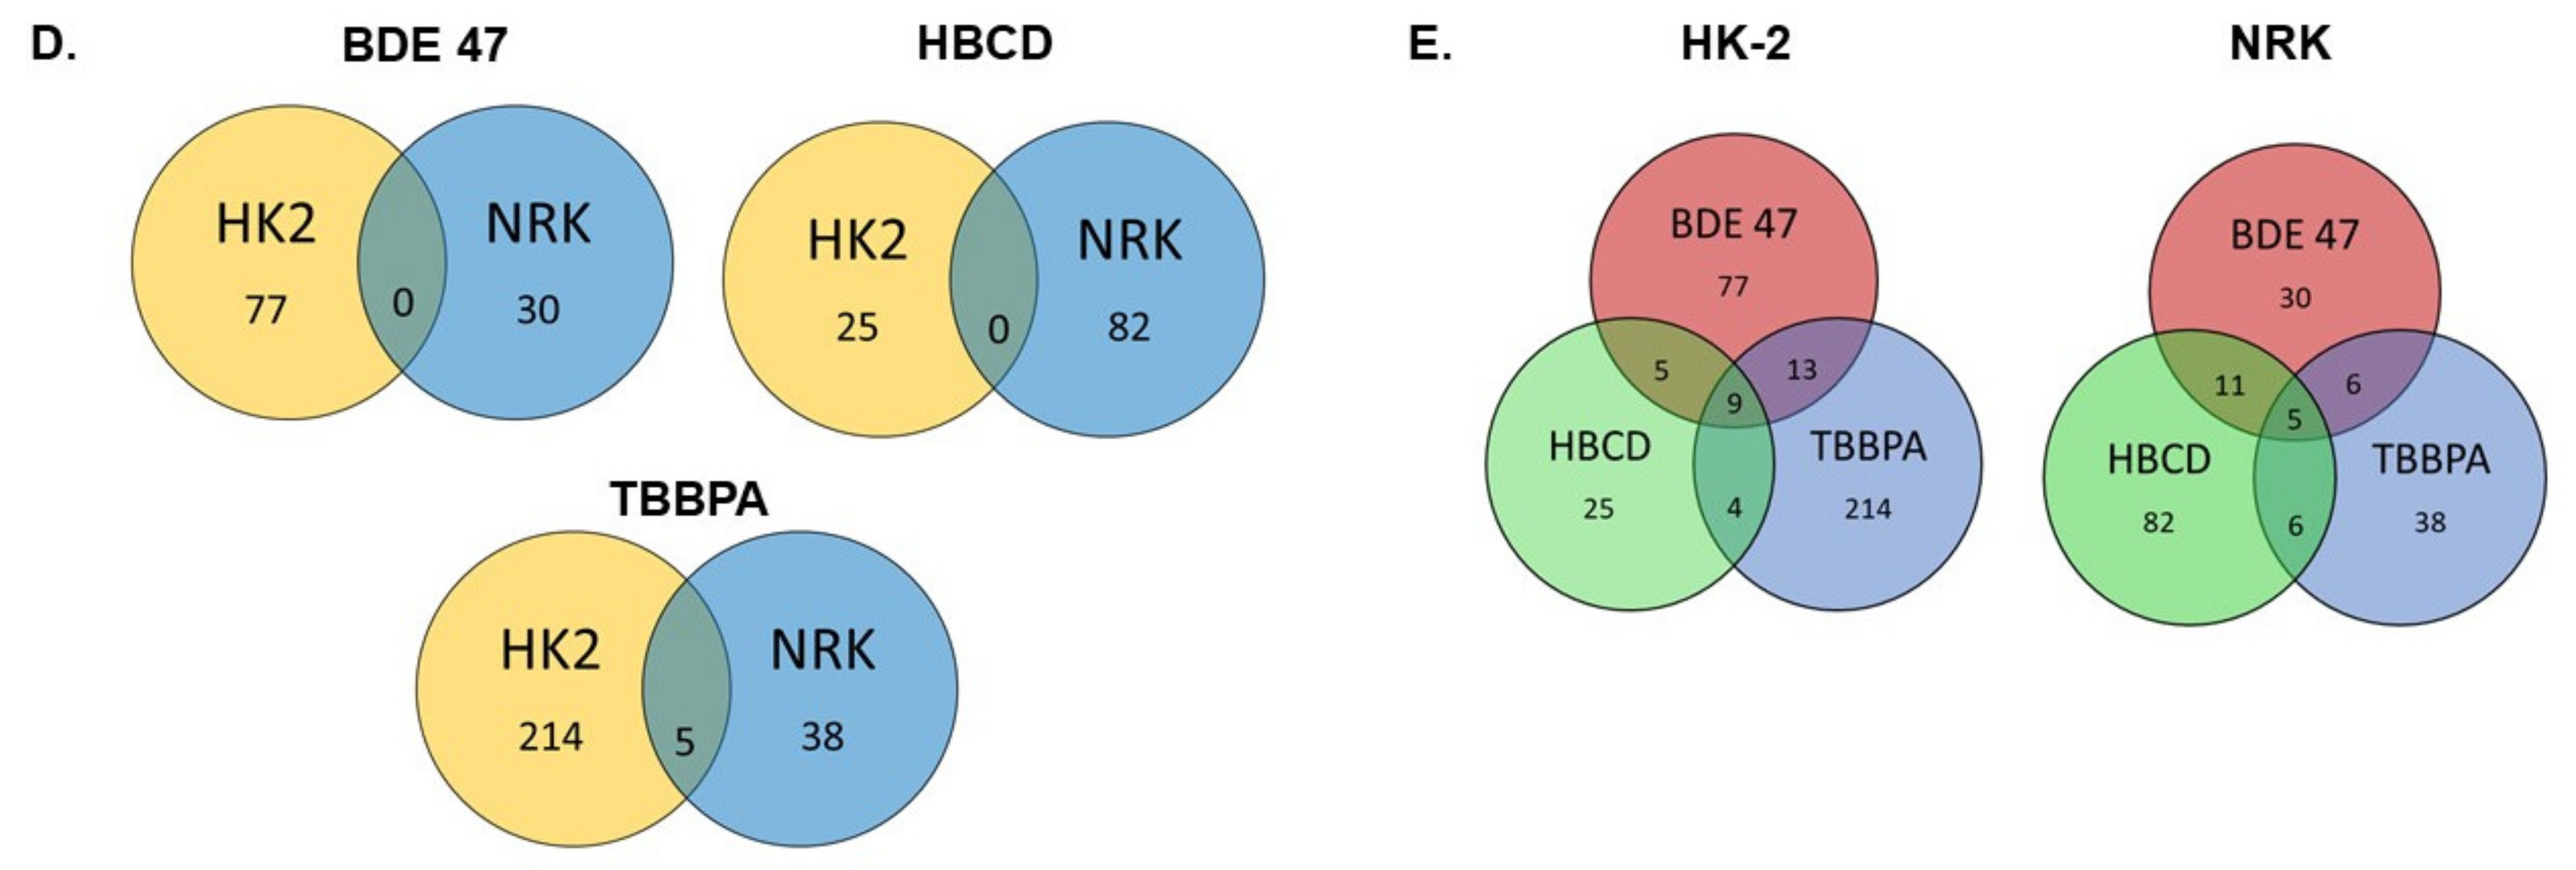
2.3. Effect of BFRs on RNA Sequencing and Differential Gene Expression Analysis
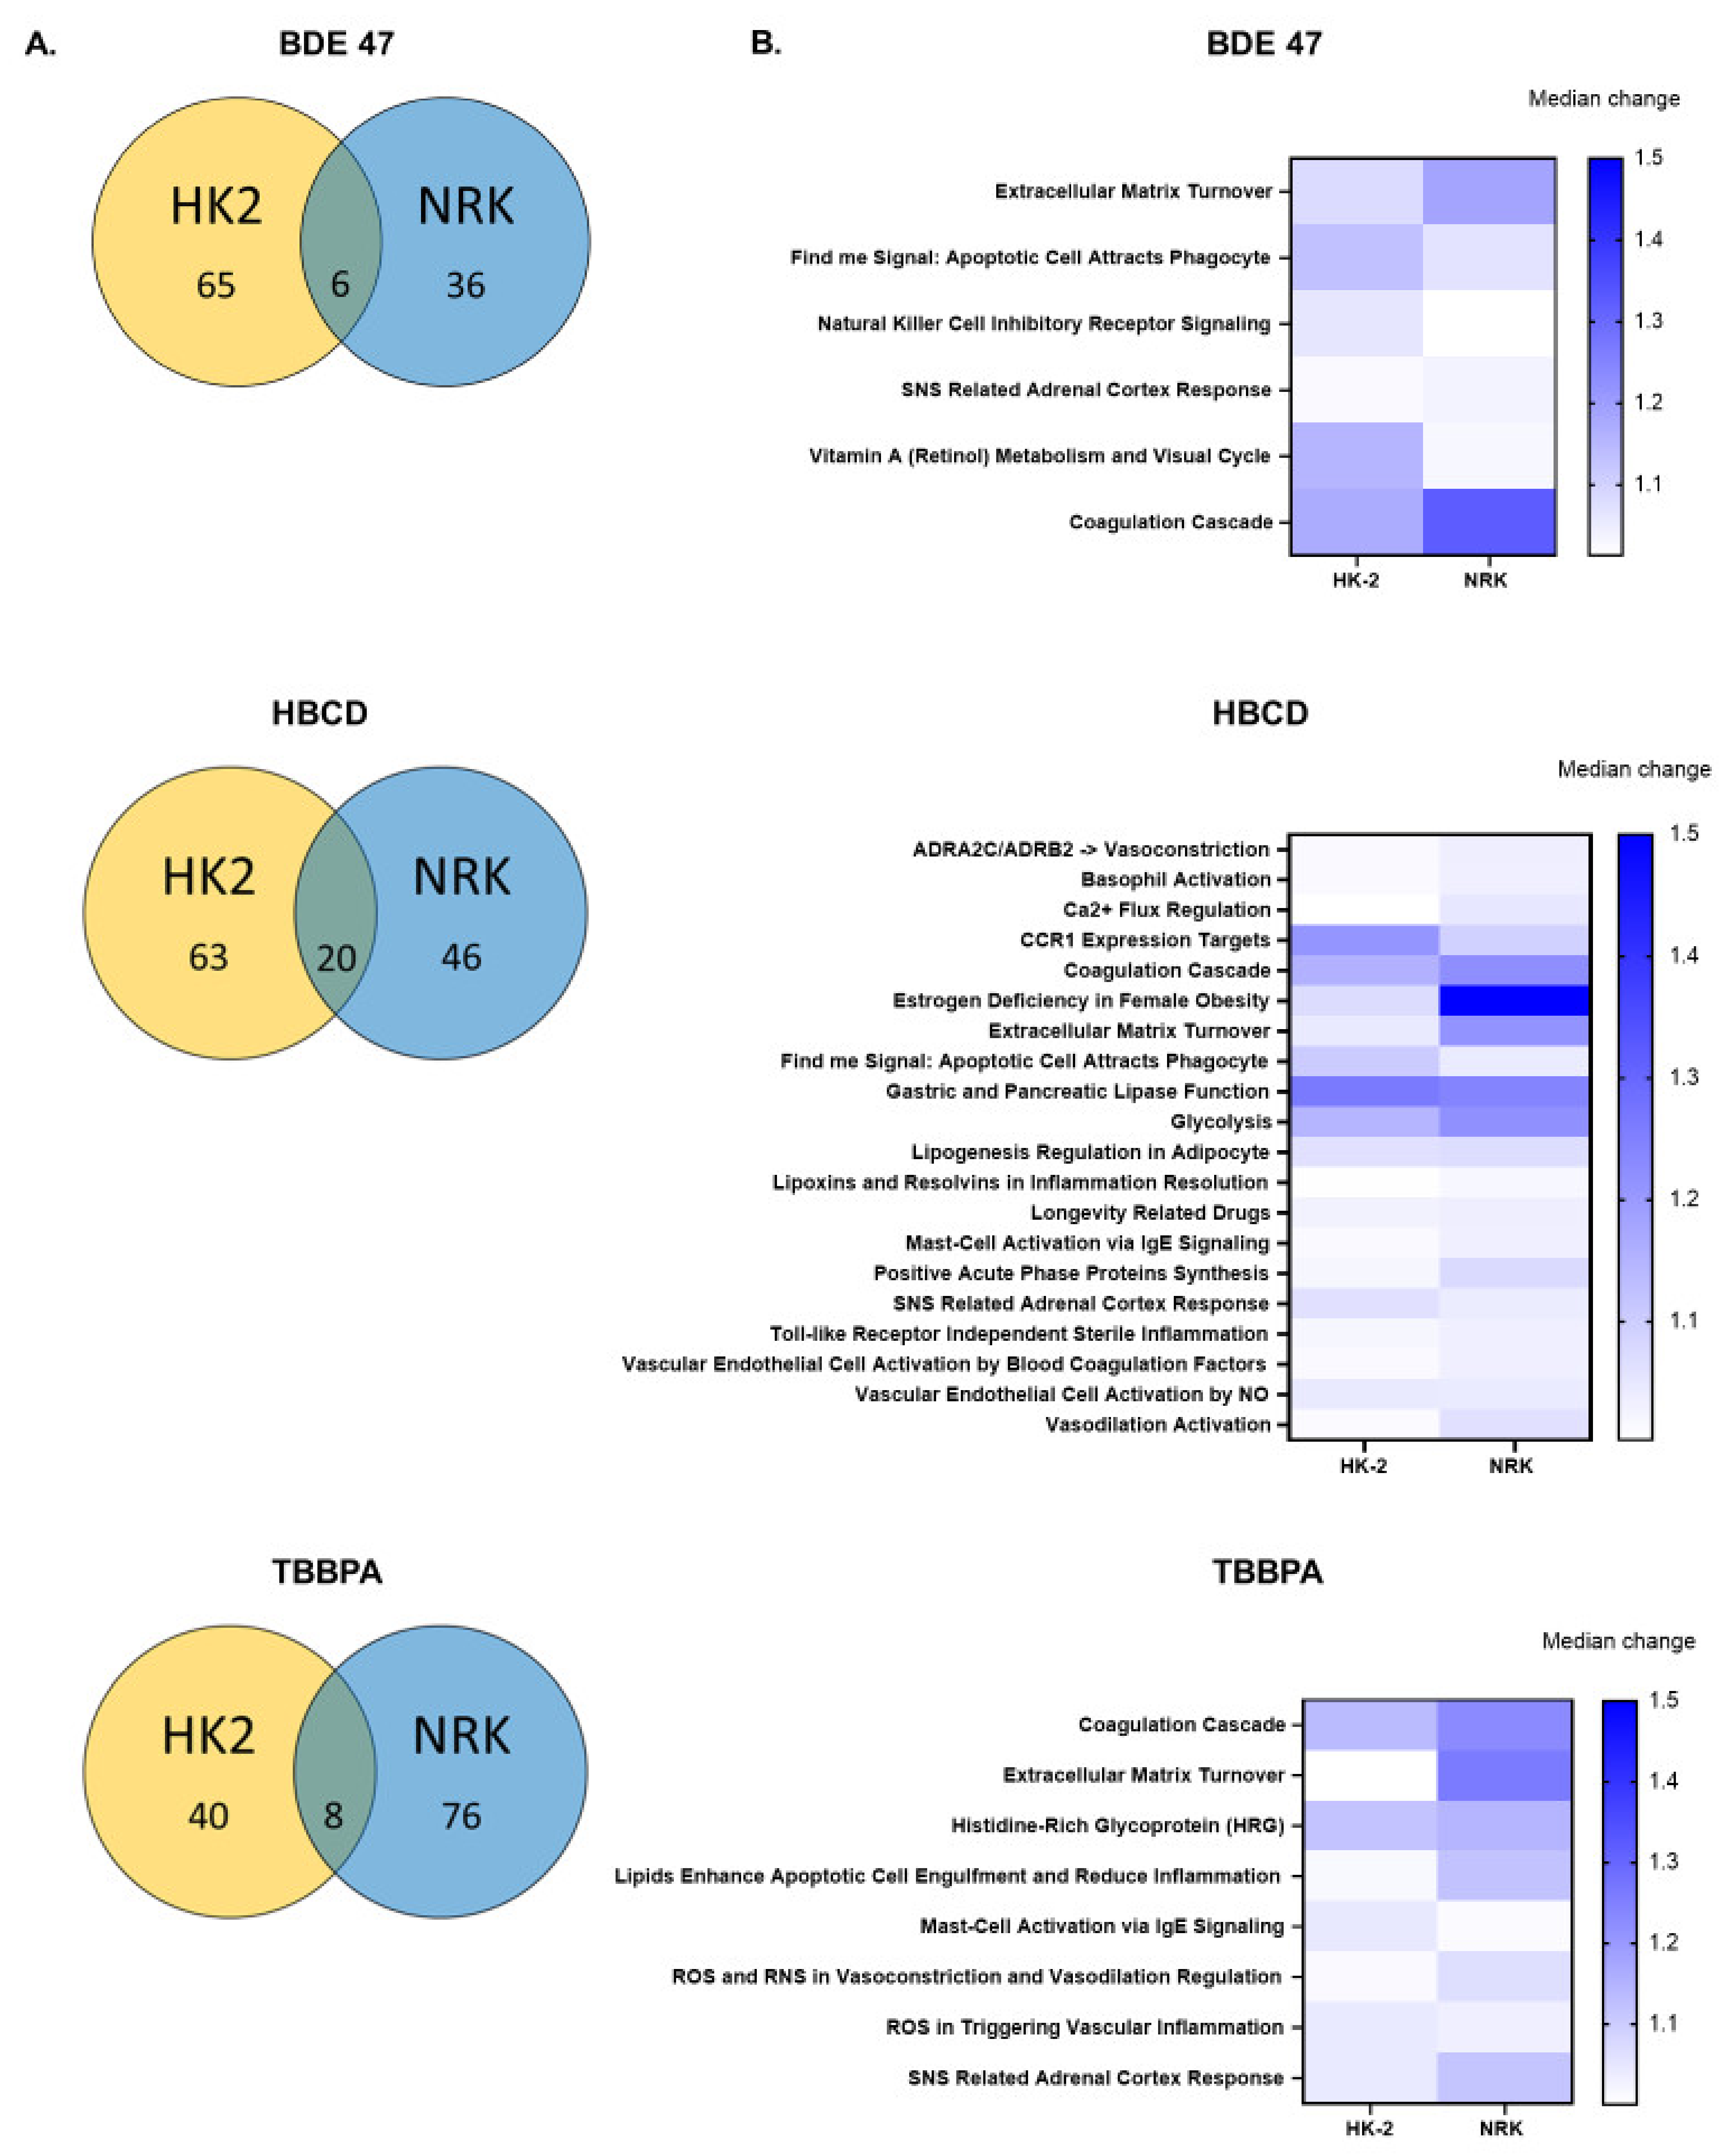
2.4. Effect of BFRs on Gene Set Enrichment
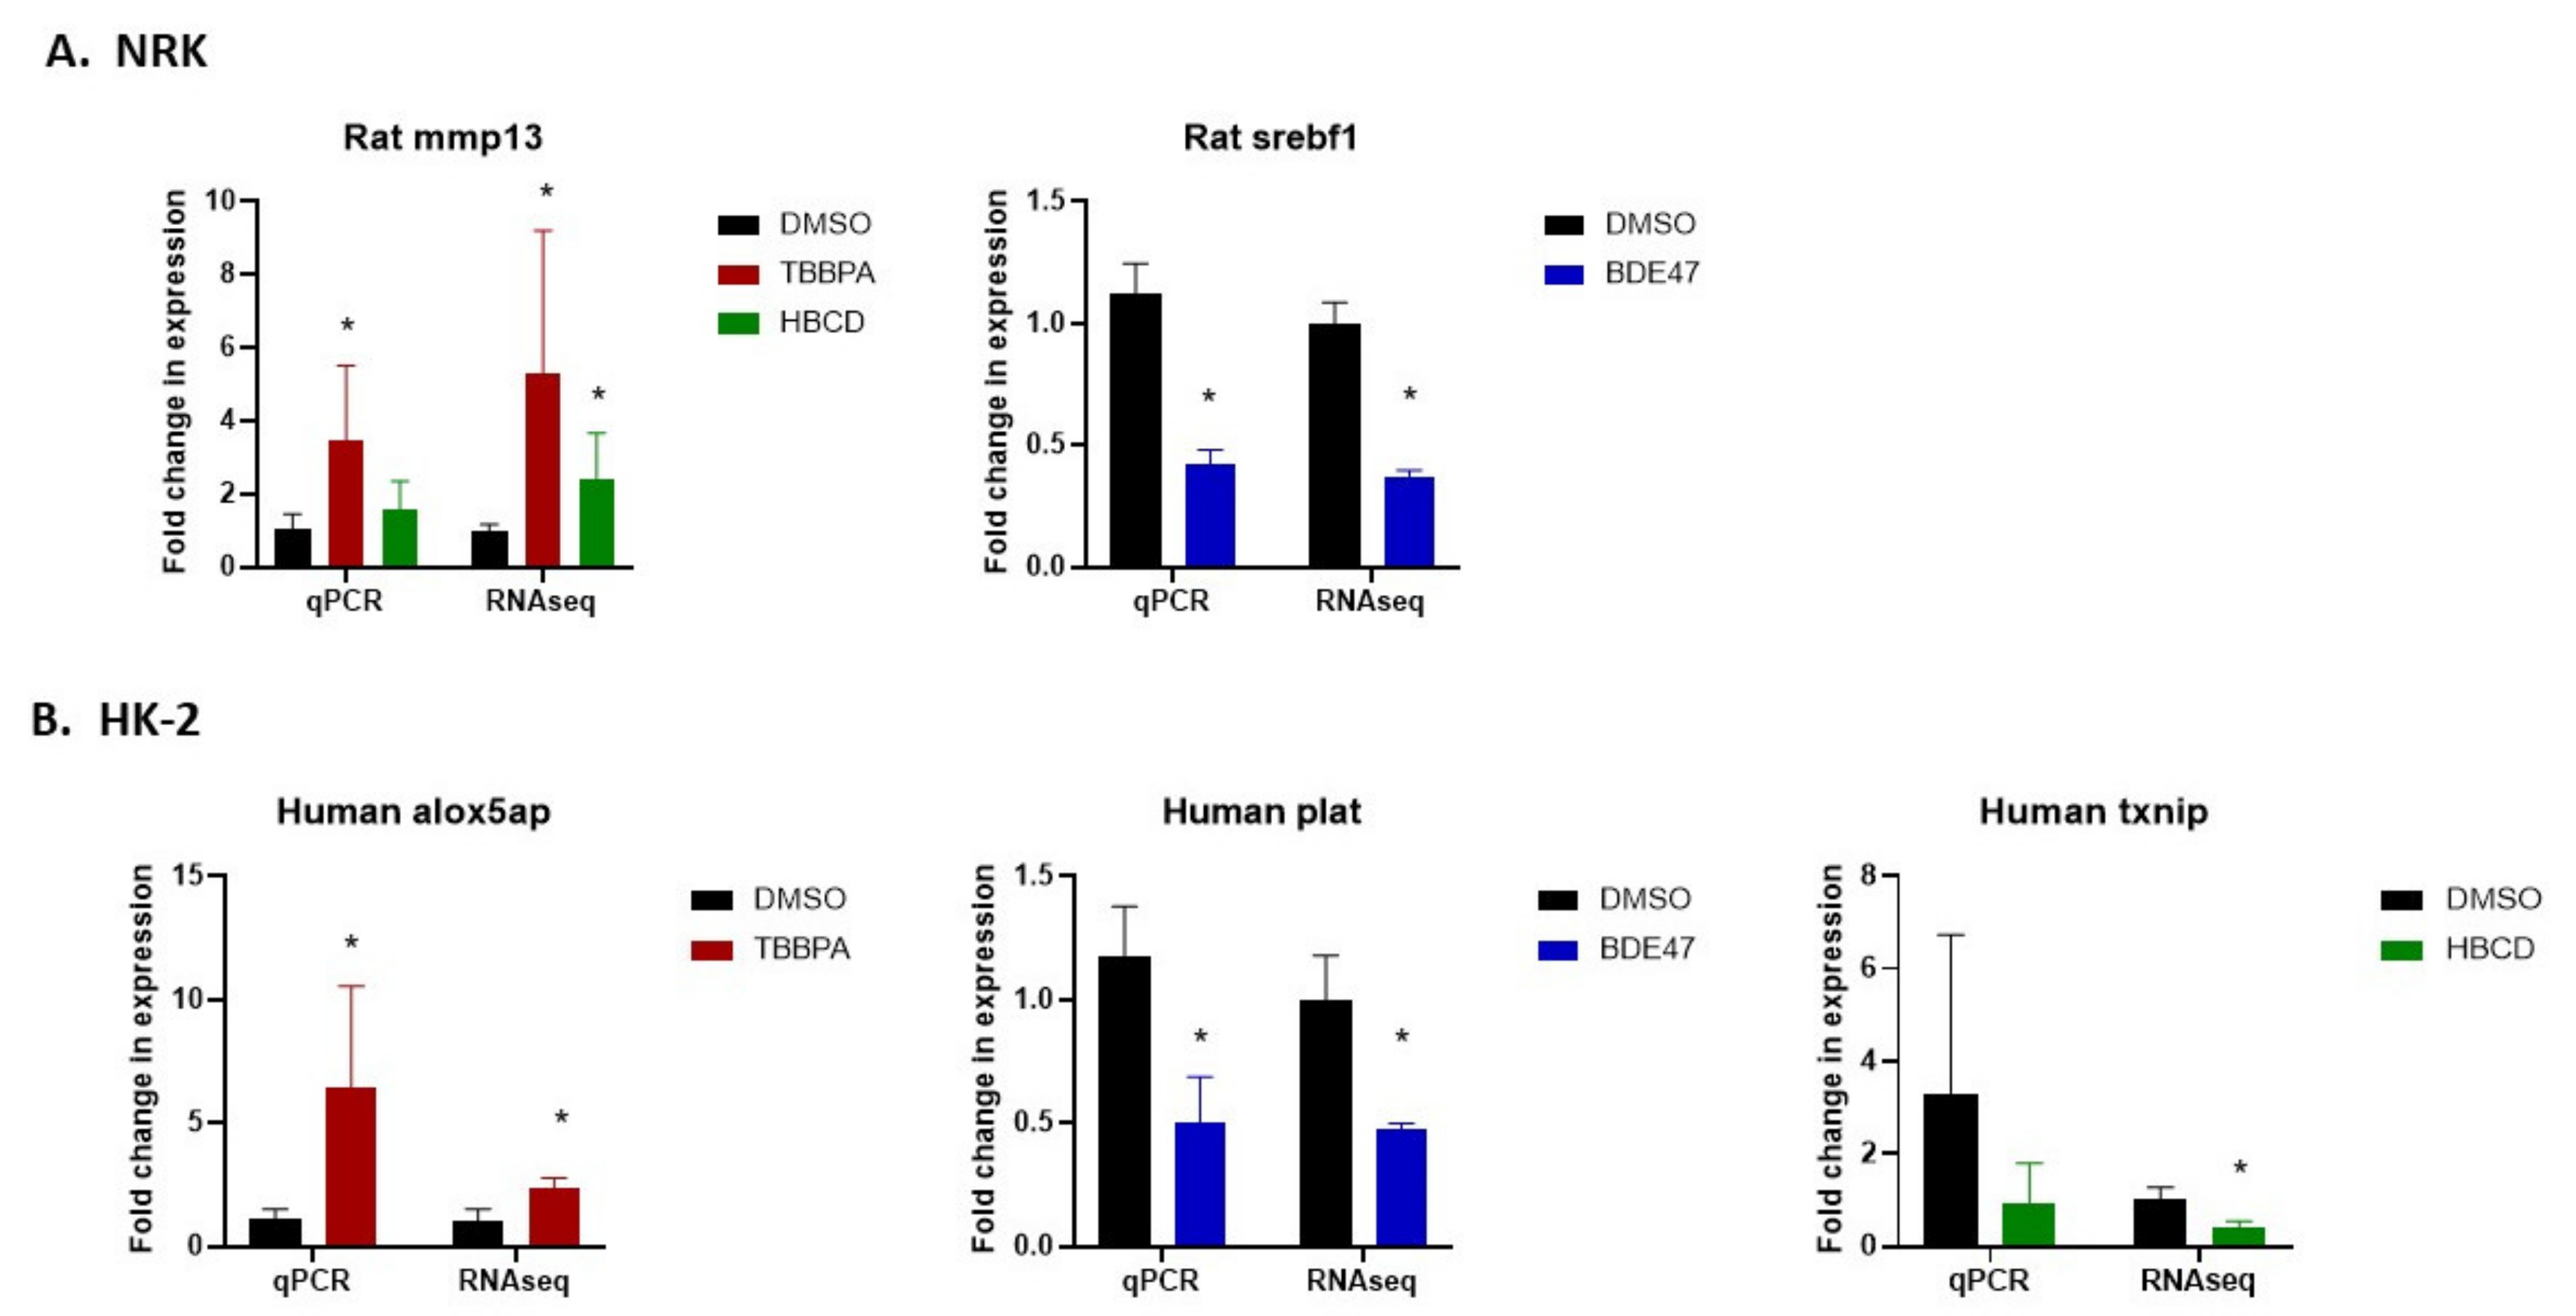
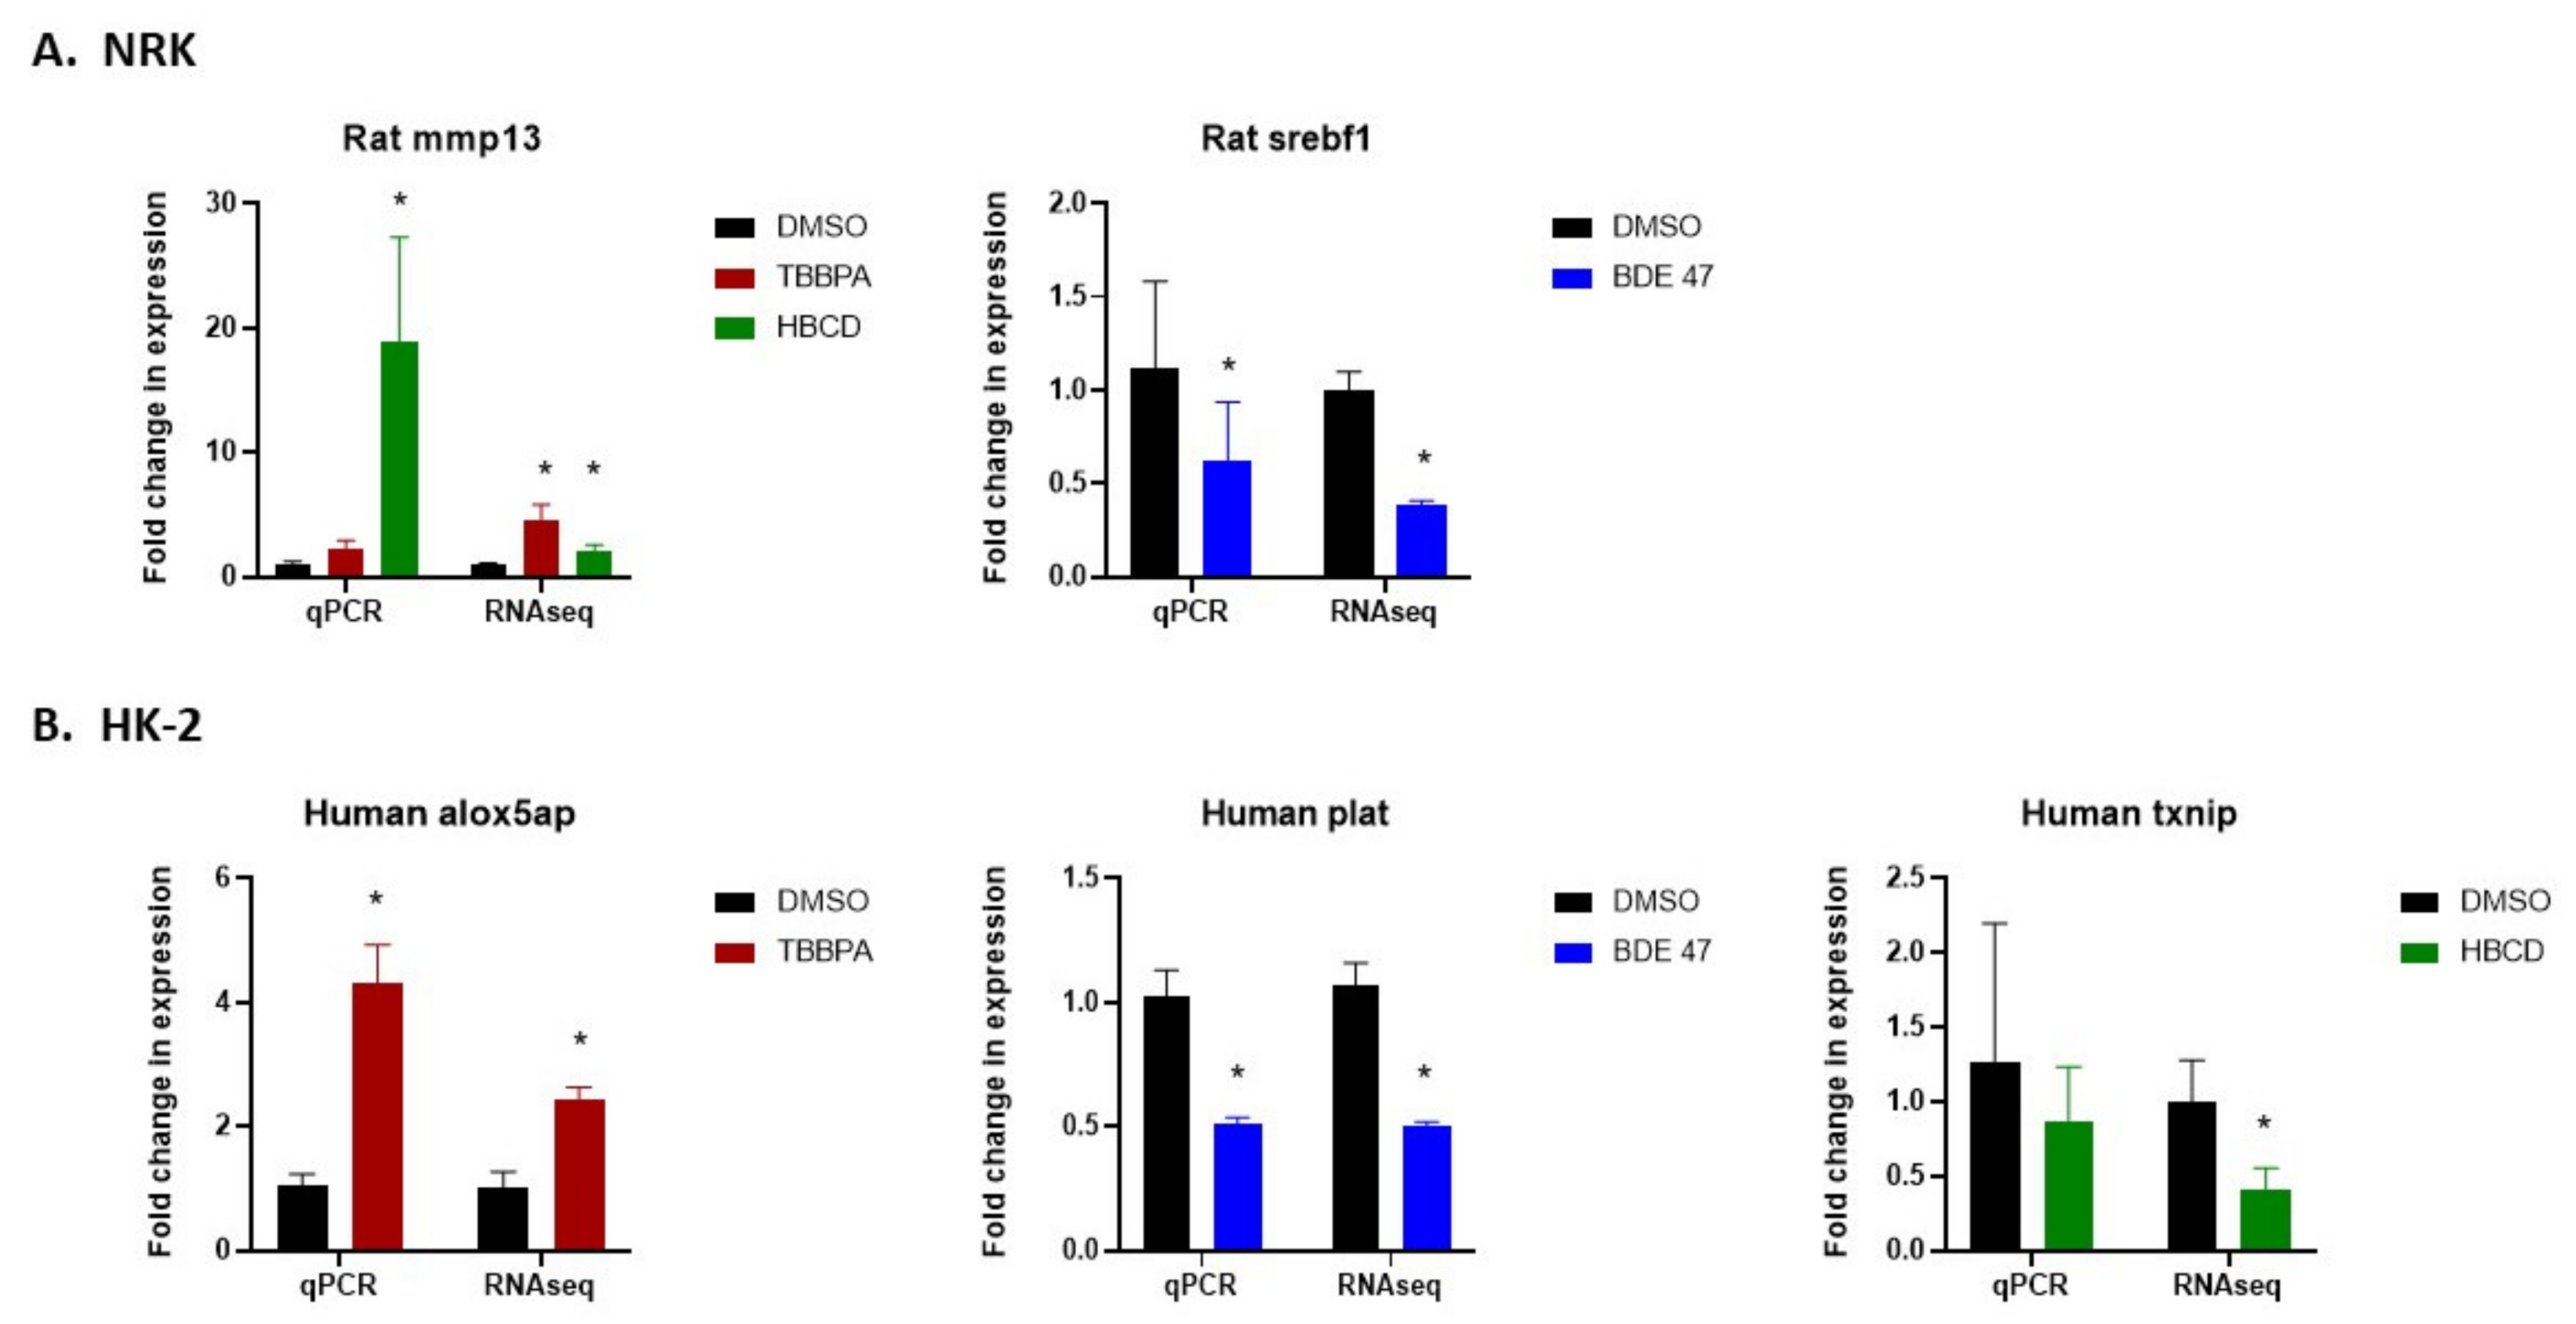
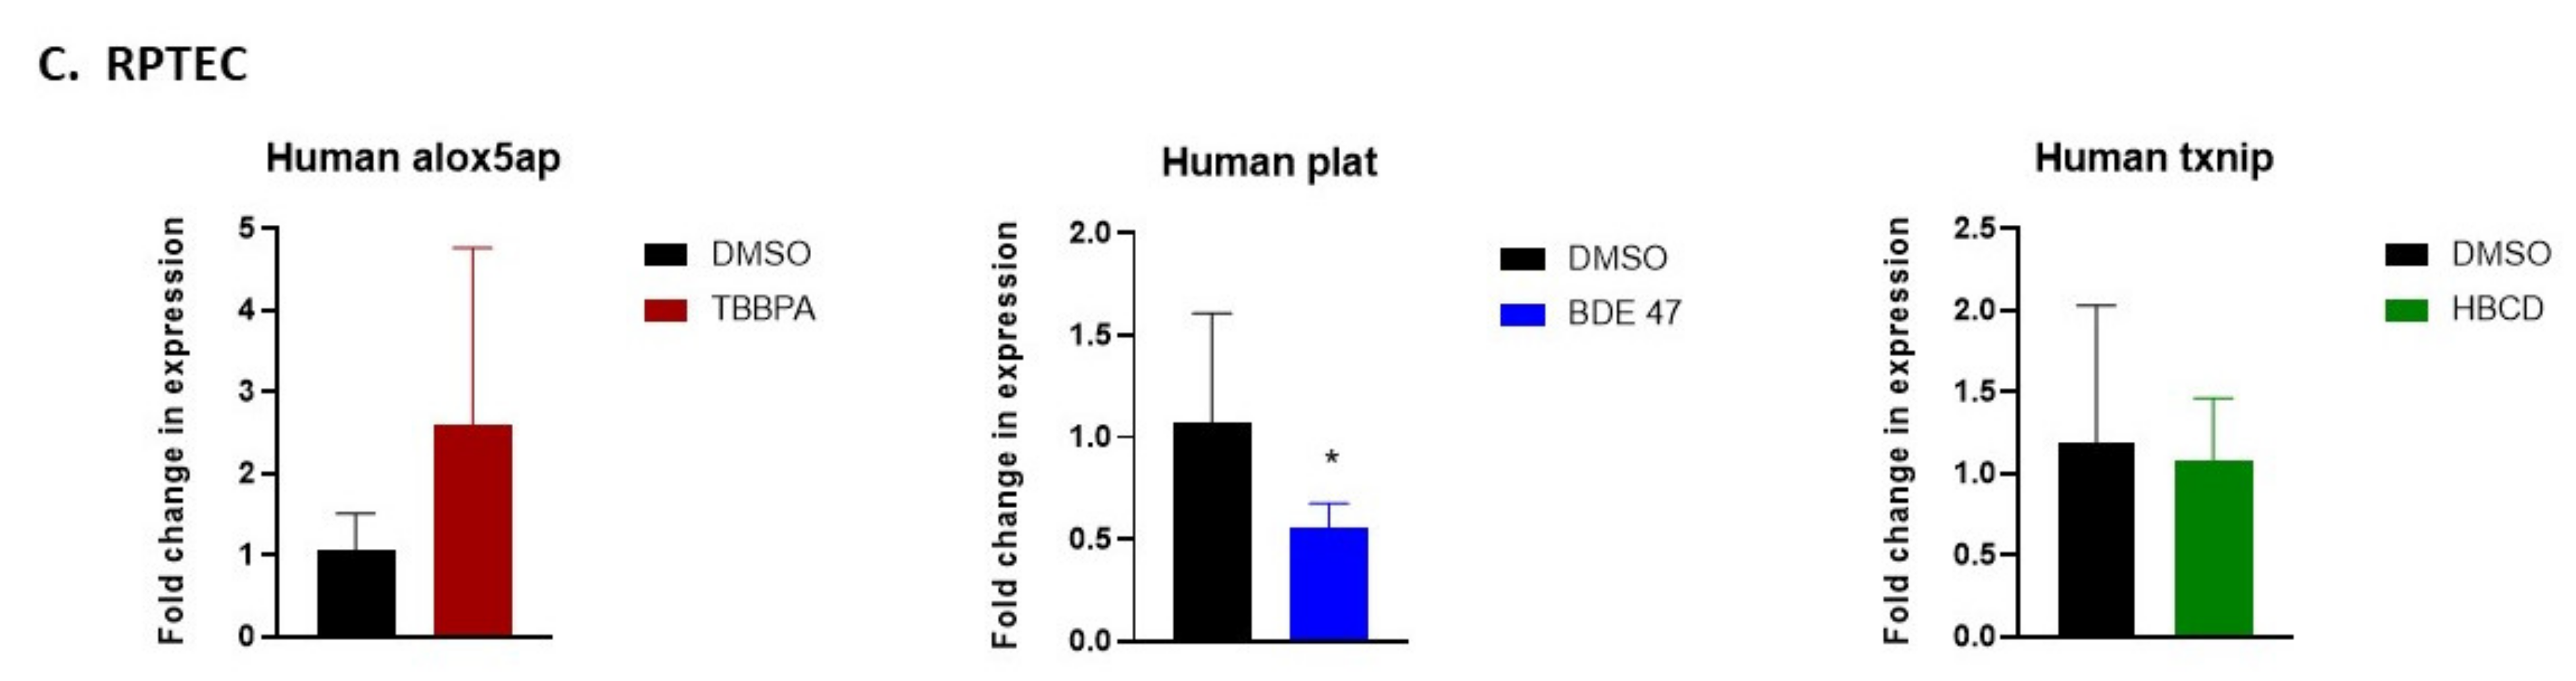
2.5. Validation of RNASeq by Quantitative Real-Time Polymerase Chain Reaction (qRT-PCR)
3. Discussion
4. Materials and Methods
4.1. Chemicals and Reagents
4.2. Cell Culture and Treatment with BFRs
4.3. MTT Assay and Calculation of IC50 Values
4.4. Cell and Nuclear Morphology
4.5. Measurement of Cell Death via Annexin V and PI Staining
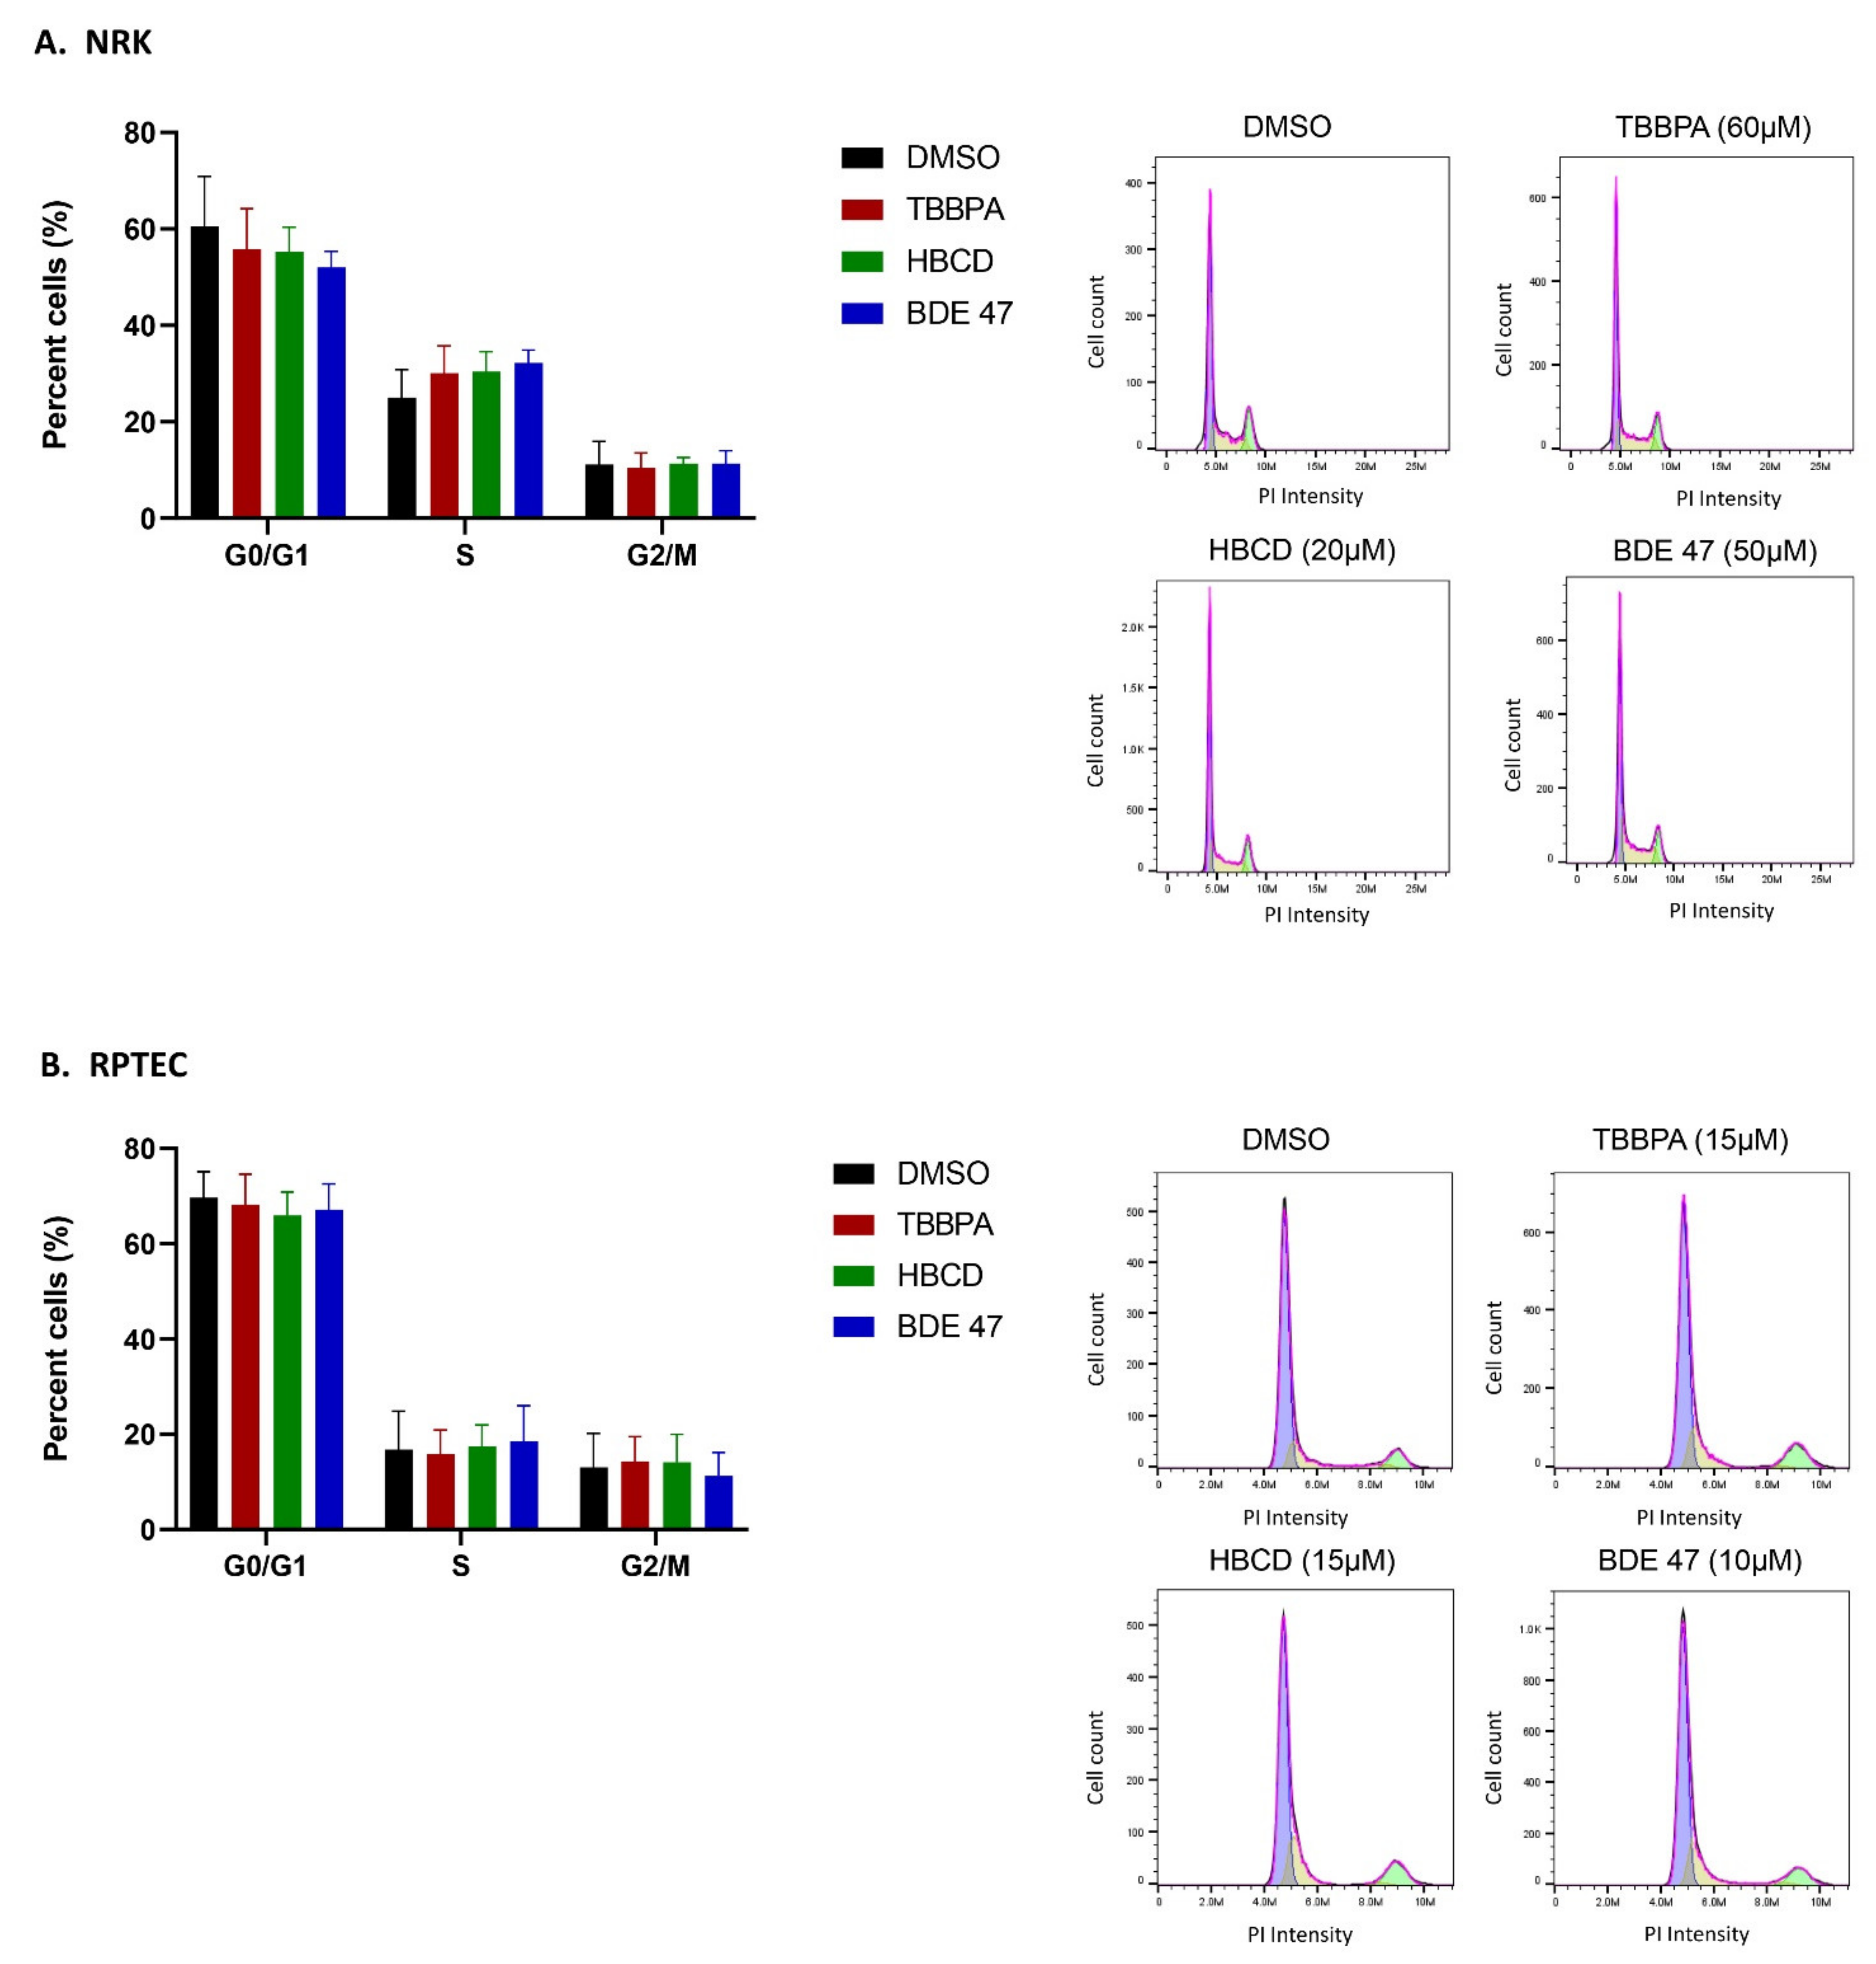
4.6. Cell Cycle Analysis via Propidium Iodide Staining
4.7. RNA Isolation, Sequencing, and Bioinformatic Analysis
4.8. Validation via qRT-PCR
4.9. Statistical Analysis
5. Conclusions
Supplementary Materials
Author Contributions
Funding
Institutional Review Board Statement
Informed Consent Statement
Data Availability Statement
Acknowledgments
Conflicts of Interest
References
- Boucher, B.A.; Ennis, J.K.; Tsirlin, D.; Harris, S.A. A global database of polybrominated diphenyl ether flame retardant congeners in foods and supplements. J. Food Compos. Anal. 2018, 69, 171–188. [Google Scholar] [CrossRef]
- Malliari, E.; Kalantzi, O.-I. Children’s exposure to brominated flame retardants in indoor environments—A review. Environ. Int. 2017, 108, 146–169. [Google Scholar] [CrossRef]
- Fromme, H.; Becher, G.; Hilger, B.; Völkel, W. Brominated flame retardants—Exposure and risk assessment for the general population. Int. J. Hyg. Environ. Health 2016, 219, 1–23. [Google Scholar] [CrossRef]
- Dodson, R.E.; Perovich, L.J.; Covaci, A.; van den Eede, N.; Ionas, A.C.; Dirtu, A.C.; Brody, J.G.; Rudel, R.A. After the PBDE Phase-Out: A Broad Suite of Flame Retardants in Repeat House Dust Samples from California. Environ. Sci. Technol. 2012, 46, 13056–13066. [Google Scholar] [CrossRef]
- Prasada, R.S.; Kodavanti, T.E.; Stoker, S.E.F. Chapter 38-Brominated Flame Retardants. In Reproductive and Developmental Toxicology, 2nd ed.; Gupta, R.C., Ed.; Academic Press: Cambridge, MA, USA, 2017; pp. 681–710. [Google Scholar]
- Kay, K. Polybrominated biphenyls (PBB) environmental contamination in Michigan, 1973–1976. Environ. Res. 1977, 13, 74–93. [Google Scholar] [CrossRef]
- Blum, A.; Gold, M.; Ames, B.; Jones, F.; Hett, E.; Dougherty, R.; Horning, E.; Dzidic, I.; Carroll, D.; Stillwell, R.; et al. Children absorb tris-BP flame retardant from sleepwear: Urine contains the mutagenic metabolite, 2,3-dibromopropanol. Science 1978, 201, 1020–1023. [Google Scholar] [CrossRef] [Green Version]
- Betts, K.S. Rapidly rising PBDE levels in North America. Environ. Sci. Technol. 2002, 36, 50A–52A. [Google Scholar] [CrossRef] [Green Version]
- Norén, K.; Meironyté, D. Certain organochlorine and organobromine contaminants in Swedish human milk in perspective of past 20–30 years. Chemosphere 2000, 40, 1111–1123. [Google Scholar] [CrossRef]
- Ernest, S.R.; Wade, M.; Lalancette, C.; Ma, Y.-Q.; Berger, R.G.; Robaire, B.; Hales, B.F. Effects of Chronic Exposure to an Environmentally Relevant Mixture of Brominated Flame Retardants on the Reproductive and Thyroid System in Adult Male Rats. Toxicol. Sci. 2012, 127, 496–507. [Google Scholar] [CrossRef]
- Yang, W.; Fu, J.; Wang, T.; Liu, H.; Wang, Y.; Zhou, Q.; Jiang, G. Alterations of endogenous metabolites in urine of rats exposed to decabromodiphenyl ether using metabonomic approaches. J. Environ. Sci. 2014, 26, 900–908. [Google Scholar] [CrossRef]
- Gannon, A.; Nunnikhoven, A.; Liston, V.; Rawn, D.; Pantazopoulos, P.; Fine, J.; Caldwell, D.; Bondy, G.; Curran, I. Rat strain response differences upon exposure to technical or alpha hexabromocyclododecane. Food Chem. Toxicol. 2019, 130, 284–307. [Google Scholar] [CrossRef] [PubMed]
- National Toxicology Program. NTP Technical Report on the Toxicology Studies of Tetrabromobisphenol A (CASRN 79-94-7) in F344/NTac Rats and B6C3F1/N Mice and Toxicology and Carcinogenesis Studies of Tetrabromobisphenol A in Wistar Han [Crl: WI (Han)] Rats and B6C3F1/N Mice (Gavage Studies); National Toxicology Program Public Health Service U.S. Department of Health and Human Services: Research Triangle Park, NC, USA, 2014. [Google Scholar]
- Fukuda, N.; Ito, Y.; Yamaguchi, M.; Mitumori, K.; Koizumi, M.; Hasegawa, R.; Kamata, E.; Ema, M. Unexpected nephrotoxicity induced by tetrabromobisphenol A in newborn rats. Toxicol. Lett. 2004, 150, 145–155. [Google Scholar] [CrossRef] [PubMed]
- Tada, Y.; Fujitani, T.; Yano, N.; Takahashi, H.; Yuzawa, K.; Ando, H.; Kubo, Y.; Nagasawa, A.; Ogata, A.; Kamimura, H. Effects of tetrabromobisphenol A, brominated flame retardant, in ICR mice after prenatal and postnatal exposure. Food Chem. Toxicol. 2006, 44, 1408–1413. [Google Scholar] [CrossRef] [PubMed]
- Milovanovic, V.; Buha, A.; Matović, V.; Curcic, M.; Vucinic, S.; Nakano, T.; Antonijevic, B. Oxidative stress and renal toxicity after subacute exposure to decabrominated diphenyl ether in Wistar rats. Environ. Sci. Pollut. Res. 2018, 25, 7223–7230. [Google Scholar] [CrossRef]
- Albina, M.L.; Alonso, V.; Linares, V.; Bellés, M.; Sirvent, J.J.; Domingo, J.L.; Sánchez, D.J. Effects of exposure to BDE-99 on oxidative status of liver and kidney in adult rats. Toxicology 2010, 271, 51–56. [Google Scholar] [CrossRef]
- Choi, J.-S.; Lee, Y.-J.; Kim, T.-H.; Lim, H.-J.; Ahn, M.-Y.; Kwack, S.-J.; Kang, T.-S.; Park, K.-L.; Lee, J.-W.; Kim, N.-D.; et al. Molecular Mechanism of Tetrabromobisphenol A (TBBPA)-induced Target Organ Toxicity in Sprague-Dawley Male Rats. Toxicol. Res. 2011, 27, 61–70. [Google Scholar] [CrossRef] [PubMed] [Green Version]
- Abrha, A.; Suvorov, A. Transcriptomic Analysis of Gonadal Adipose Tissue in Male Mice Exposed Perinatally to 2,2′,4,4′-Tetrabromodiphenyl Ether (BDE-47). Toxics 2018, 6, 21. [Google Scholar] [CrossRef] [Green Version]
- Wu, S.; Zhu, Z.; Chen, J.; Wu, M.; Qiu, L. Transcriptomic analyses of human bronchial epithelial cells BEAS-2B exposed to brominated flame retardant (tetrabromobisphenol A). Environ. Toxicol. 2019, 34, 742–752. [Google Scholar] [CrossRef]
- Chen, J.; Tanguay, R.L.; Xiao, Y.; Haggard, D.; Ge, X.; Jia, Y.; Zheng, Y.; Dong, Q.; Huang, C.; Lin, K. TBBPA exposure during a sensitive developmental window produces neurobehavioral changes in larval zebrafish. Environ. Pollut. 2016, 216, 53–63. [Google Scholar] [CrossRef]
- Farmahin, R.; Gannon, A.M.; Gagné, R.; Rowan-Carroll, A.; Kuo, B.; Williams, A.; Curran, I.; Yauk, C.L. Hepatic transcriptional dose-response analysis of male and female Fischer rats exposed to hexabromocyclododecane. Food Chem. Toxicol. 2019, 133, 110262. [Google Scholar] [CrossRef]
- Reffatto, V.; Rasinger, J.D.; Carroll, T.S.; Ganay, T.; Lundebye, A.-K.; Sekler, I.; Hershfinkel, M.; Hogstrand, C. Parallel in vivo and in vitro transcriptomics analysis reveals calcium and zinc signalling in the brain as sensitive targets of HBCD neurotoxicity. Arch. Toxicol. 2018, 92, 1189–1203. [Google Scholar] [CrossRef] [PubMed] [Green Version]
- Park, H.-R.; Loch-Caruso, R. Protective effect of (±)α-tocopherol on brominated diphenyl ether-47-stimulated prostaglandin pathways in human extravillous trophoblasts in vitro. Toxicol. Vitr. 2015, 29, 1309–1318. [Google Scholar] [CrossRef] [PubMed] [Green Version]
- Park, H.-R.; Kamau, P.W.; Korte, C.; Loch-Caruso, R. Tetrabromobisphenol A activates inflammatory pathways in human first trimester extravillous trophoblasts in vitro. Reprod. Toxicol. 2014, 50, 154–162. [Google Scholar] [CrossRef] [PubMed] [Green Version]
- Yang, C.; Wong, C.M.; Wei, J.; Chung, A.C.; Cai, Z. The brominated flame retardant BDE 47 upregulates purine metabolism and mitochondrial respiration to promote adipocyte differentiation. Sci. Total. Environ. 2018, 644, 1312–1322. [Google Scholar] [CrossRef]
- Wang, D.; Yan, J.; Teng, M.; Yan, S.; Zhou, Z.; Zhu, W. In utero and lactational exposure to BDE-47 promotes obesity development in mouse offspring fed a high-fat diet: Impaired lipid metabolism and intestinal dysbiosis. Arch. Toxicol. 2018, 92, 1847–1860. [Google Scholar] [CrossRef]
- Sales, L.B.; Kamstra, J.; Cenijn, P.; van Rijt, L.; Hamers, T.; Legler, J. Effects of endocrine disrupting chemicals on in vitro global DNA methylation and adipocyte differentiation. Toxicol. Vitr. 2013, 27, 1634–1643. [Google Scholar] [CrossRef]
- Yanagisawa, R.; Koike, E.; Win-Shwe, T.-T.; Yamamoto, M.; Takano, H. Impaired Lipid and Glucose Homeostasis in Hexabromocyclododecane-Exposed Mice Fed a High-Fat Diet. Environ. Heal. Perspect. 2014, 122, 277–283. [Google Scholar] [CrossRef] [Green Version]
- Xie, X.; Yu, C.; Ren, Q.; Wen, Q.; Zhao, C.; Tang, Y.; Du, Y. Exposure to HBCD promotes adipogenesis both in vitro and in vivo by interfering with Wnt6 expression. Sci. Total. Environ. 2020, 705, 135917. [Google Scholar] [CrossRef]
- Riu, A.; Mccollum, C.W.; Pinto, C.L.; Grimaldi, M.; Hillenweck, A.; Perdu, E.; Zalko, D.; Bernard, L.; Laudet, V.; Balaguer, P.; et al. Halogenated Bisphenol-A Analogs Act as Obesogens in Zebrafish Larvae (Danio rerio). Toxicol. Sci. 2014, 139, 48–58. [Google Scholar] [CrossRef]
- Liu, Q.S.; Sun, Z.; Ren, X.-M.; Ren, Z.; Liu, A.; Zhang, J.; Zhou, Q.; Jiang, G. Chemical Structure-Related Adipogenic Effects of Tetrabromobisphenol A and Its Analogues on 3T3-L1 Preadipocytes. Environ. Sci. Technol. 2020, 54, 6262–6271. [Google Scholar] [CrossRef]
- Chappell, V.A.; Janesick, A.; Blumberg, B.; Fenton, S.E. Tetrabromobisphenol-A Promotes Early Adipogenesis and Lipogenesis in 3T3-L1 Cells. Toxicol. Sci. 2018, 166, 332–344. [Google Scholar] [CrossRef]
- Krivoshiev, B.V.; Dardenne, F.; Covaci, A.; Blust, R.; Husson, S.J. Assessing in-vitro estrogenic effects of currently-used flame retardants. Toxicol. Vitr. 2016, 33, 153–162. [Google Scholar] [CrossRef]
- Hamers, T.; Kamstra, J.; Sonneveld, E.; Murk, A.J.; Kester, M.H.A.; Andersson, P.L.; Legler, J.; Brouwer, A. In Vitro Profiling of the Endocrine-Disrupting Potency of Brominated Flame Retardants. Toxicol. Sci. 2006, 92, 157–173. [Google Scholar] [CrossRef] [Green Version]
- Kitamura, S.; Suzuki, T.; Sanoh, S.; Kohta, R.; Jinno, N.; Sugihara, K.; Yoshihara, S.; Fujimoto, N.; Watanabe, H.; Ohta, S. Comparative Study of the Endocrine-Disrupting Activity of Bisphenol A and 19 Related Compounds. Toxicol. Sci. 2005, 84, 249–259. [Google Scholar] [CrossRef]
- Kamstra, J.; Hruba, E.; Blumberg, B.; Janesick, A.; Mandrup, S.; Hamers, T.; Legler, J. Transcriptional and Epigenetic Mechanisms Underlying Enhanced in Vitro Adipocyte Differentiation by the Brominated Flame Retardant BDE-47. Environ. Sci. Technol. 2014, 48, 4110–4119. [Google Scholar] [CrossRef] [PubMed]
- Ihunnah, C.A.; Wada, T.; Philips, B.J.; Ravuri, S.K.; Gibbs, R.B.; Kirisci, L.; Rubin, J.P.; Marra, K.G.; Xie, W. Estrogen Sulfotransferase/SULT1E1 Promotes Human Adipogenesis. Mol. Cell. Biol. 2014, 34, 1682–1694. [Google Scholar] [CrossRef] [PubMed] [Green Version]
- McCormick, J.M.; Paiva, M.S.; Haggblom, M.; Cooper, K.R.; White, L.A. Embryonic exposure to tetrabromobisphenol A and its metabolites, bisphenol A and tetrabromobisphenol A dimethyl ether disrupts normal zebrafish (Danio rerio) development and matrix metalloproteinase expression. Aquat. Toxicol. 2010, 100, 255–262. [Google Scholar] [CrossRef] [Green Version]
- Lee, G.H.; Jin, S.W.; Kim, S.J.; Pham, T.H.; Choi, J.H.; Jeong, H.G. Tetrabromobisphenol A Induces MMP-9 Expression via NADPH Oxidase and the activation of ROS, MAPK, and Akt Pathways in Human Breast Cancer MCF-7 Cells. Toxicol. Res. 2019, 35, 93–101. [Google Scholar] [CrossRef] [PubMed]
- Park, H.-R.; Elkin, E.R.; Castillo-Castrejon, M.; Loch-Caruso, R. Brominated diphenyl ether-47 differentially regulates cellular migration and invasion in a human first trimester trophoblast cell line. Reprod. Toxicol. 2020, 93, 191–198. [Google Scholar] [CrossRef] [PubMed]
- Tian, P.-C.; Wang, H.-L.; Chen, G.-H.; Luo, Q.; Chen, Z.; Wang, Y.; Liu, Y.-F. 2,2′,4,4′-Tetrabromodiphenyl ether promotes human neuroblastoma SH-SY5Y cells migration via the GPER/PI3K/Akt signal pathway. Hum. Exp. Toxicol. 2016, 35, 124–134. [Google Scholar] [CrossRef]
- Roelofs, M.J.; Berg, M.V.D.; Bovee, T.F.; Piersma, A.H.; Duursen, M.B. Structural bisphenol analogues differentially target steroidogenesis in murine MA-10 Leydig cells as well as the glucocorticoid receptor. Toxicology 2015, 329, 10–20. [Google Scholar] [CrossRef]
- Afshinnia, F.; Zeng, L.; Byun, J.; Wernisch, S.; Deo, R.; Chen, J.; Hamm, L.; Miller, E.R.; Rhee, E.P.; Fischer, M.J.; et al. Elevated lipoxygenase and cytochrome P450 products predict progression of chronic kidney disease. Nephrol. Dial. Transplant. 2020, 35, 303–312. [Google Scholar] [CrossRef]
- Fijałkowski, M.; Stępniewska, J.; Domański, M.; Ciechanowski, K.; Golembiewska, E. The role of eicosanoids in renal diseases—potential therapeutic possibilities. Acta Biochim. Pol. 2018, 65, 479–486. [Google Scholar] [CrossRef] [Green Version]
- Wang, T.; Fu, X.; Chen, Q.; Patra, J.K.; Wang, D.; Wang, Z.; Gai, Z. Arachidonic Acid Metabolism and Kidney Inflammation. Int. J. Mol. Sci. 2019, 20, 3683. [Google Scholar] [CrossRef] [Green Version]
- Parrish, A.R. Matrix Metalloproteinases in Kidney Disease: Role in Pathogenesis and Potential as a Therapeutic Target. Prog. Mol. Biol. Transl. Sci. 2017, 148, 31–65. [Google Scholar]
- Zakiyanov, O.; Kalousová, M.; Zima, T.; Tesař, V. Matrix Metalloproteinases in Renal Diseases: A Critical Appraisal. Kidney Blood Press. Res. 2019, 44, 298–330. [Google Scholar] [CrossRef]
- Sampieri, C.L.; A Orozco-Ortega, R. Matrix metalloproteinases and tissue inhibitors of metalloproteinases in chronic kidney disease and acute kidney injury: A systematic review of the literature. Hippokratia 2018, 22, 99–104. [Google Scholar]
- Xu, T.-Y.; Zhang, Y.; Li, Y.; Zhu, D.-L.; Gao, P.-J. The association of serum inflammatory biomarkers with chronic kidney disease in hypertensive patients. Ren. Fail. 2014, 36, 666–672. [Google Scholar] [CrossRef] [PubMed] [Green Version]
- Rodríguez-Sánchez, E.; García, J.A.N.; Aceves-Ripoll, J.; Álvarez-Llamas, G.; Segura, J.; Barderas, M.G.; Ruilope, L.M.; Ruiz-Hurtado, G. Association between renal dysfunction and metalloproteinase (MMP)-9 activity in hypertensive patients. Nefrología (Engl. Ed.) 2019, 39, 184–191. [Google Scholar] [CrossRef]
- Pulido-Olmo, H.; García-Prieto, C.F.; Alvarez-Llamas, G.; Barderas, M.G.; Vivanco, F.; Aranguez, I.; Somoza, B.; Segura, J.; Kreutz, R.; Fernandez-Alfonso, M.S.; et al. Role of matrix metalloproteinase-9 in chronic kidney disease: A new biomarker of resistant albuminuria. Clin. Sci. 2016, 130, 525–538. [Google Scholar] [CrossRef] [PubMed]
- Wu, S.; Yuan, H.; Zhou, Y.; Long, Z.; Peng, Y.; Peng, F. Thromboelastography-based assessment of coagulation function in patients with chronic kidney disease and the risk factors of hypercoagulability. Nan Fang Yi Ke Da Xue Xue Bao = J. South. Med. Univ. 2020, 40, 556–561. [Google Scholar]
- Huang, M.-J.; Wei, R.-B.; Wang, Y.; Su, T.-Y.; Di, P.; Li, Q.-P.; Yang, X.; Li, P.; Chen, X.-M. Blood coagulation system in patients with chronic kidney disease: A prospective observational study. BMJ Open 2017, 7, e014294. [Google Scholar] [CrossRef] [Green Version]
- Madhusudhan, T.; Kerlin, B.; Isermann, B. The emerging role of coagulation proteases in kidney disease. Nat. Rev. Nephrol. 2016, 12, 94–109. [Google Scholar] [CrossRef] [Green Version]
- Hu, K.; WMMars, Y.L.i.u. Novel actions of tissue-type plasminogen activator in chronic kidney disease: A paradigm shift. Front. Biosci. A J. Virtual Libr. 2008, 13, 5174. [Google Scholar] [CrossRef] [PubMed] [Green Version]
- Bolger, A.M.; Lohse, M.; Usadel, B. Trimmomatic: A flexible trimmer for Illumina sequence data. Bioinformatics 2014, 30, 2114–2120. [Google Scholar] [CrossRef] [Green Version]
- Langmead, B.; Trapnell, C.; Pop, M.; Salzberg, S.L. Ultrafast and memory-efficient alignment of short DNA sequences to the human genome. Genome Biol. 2009, 10, 1–10. [Google Scholar] [CrossRef] [Green Version]
- Li, B.; Dewey, C.N. RSEM: Accurate transcript quantification from RNA-Seq data with or without a reference genome. BMC Bioinform. 2011, 12, 323. [Google Scholar] [CrossRef] [Green Version]
- Robinson, M.D.; McCarthy, D.J.; Smyth, G.K. edgeR: A Bioconductor package for differential expression analysis of digital gene expression data. Bioinformatics 2009, 26, 139–140. [Google Scholar] [CrossRef] [PubMed] [Green Version]


| Name | Chemical Structure |
|---|---|
| 2,2’,4,4’-Tetrabromodiphenyl ether | 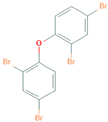 |
| 1,2,5,6,9,10-Hexabromocyclododecane | 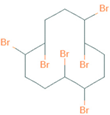 |
| 3,3’,5,5’-Tetrabromobisphenol A | 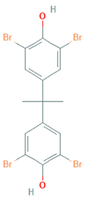 |
| Gene Name | Species | Forward Sequence | Reverse Sequence |
|---|---|---|---|
| Alox5ap | Mouse | TCACCCTCATCAGCGTGGTC | CATCTACGCAGTTCTGGTTGGC |
| Human | CCGGAACACTTGCCTTTGAGC | CAAACGCAGCAGGAACTTGGC | |
| β-actin | Rat | ACAACCTTCTTGCAGCTCCTCC | TGACCCATACCCACCATCACAC |
| Mouse | TATAAAACCCGGCGGCGCAA | TCGTCATCCATGGCGAACTGG | |
| Human | AGCTCACCATGGATGATGATATCGC | ATAGGAATCCTTCTGACCCATGCC | |
| Gapdh | Rat | CAGTGCCAGCCTCGTCTCATA | ACTGTGCCGTTGAACTTGCC |
| Human | CTCCTGTTCGACAGTCAGCC | GCCCAATACGACCAAATCCGT | |
| Mmp 13 | Rat | GCATACGAGCATCCATCCCG | AAGAGGGTCTTCCCCGTGTC |
| Mouse | TCCCTAGGTCTGGATCACTCC | TTAGGGTTGGGGTCTTCATCG | |
| Plat | Mouse | TGCAGGAACTCAAGAGCTCAG | TTTCTTCTGTGTCCCGAGAGTG |
| Human | GTCTTCGTTTCGCCCAGCCA | CGGTTGCTTCTGAGCACAGGG | |
| Srebf1 | Rat | GCTGCAGGAAACTGAGAGACC | TGGGCTGGATTCCACCTTTC |
| Txnip | Human | GCAGTGCAAACAGACTTCGG | CATCTCATTCTCACCTGTTGGC |
Publisher’s Note: MDPI stays neutral with regard to jurisdictional claims in published maps and institutional affiliations. |
© 2021 by the authors. Licensee MDPI, Basel, Switzerland. This article is an open access article distributed under the terms and conditions of the Creative Commons Attribution (CC BY) license (https://creativecommons.org/licenses/by/4.0/).
Share and Cite
Barnett, L.M.A.; Kramer, N.E.; Buerger, A.N.; Love, D.H.; Bisesi, J.H., Jr.; Cummings, B.S. Transcriptomic Analysis of the Differential Nephrotoxicity of Diverse Brominated Flame Retardants in Rat and Human Renal Cells. Int. J. Mol. Sci. 2021, 22, 10044. https://doi.org/10.3390/ijms221810044
Barnett LMA, Kramer NE, Buerger AN, Love DH, Bisesi JH Jr., Cummings BS. Transcriptomic Analysis of the Differential Nephrotoxicity of Diverse Brominated Flame Retardants in Rat and Human Renal Cells. International Journal of Molecular Sciences. 2021; 22(18):10044. https://doi.org/10.3390/ijms221810044
Chicago/Turabian StyleBarnett, Lillie Marie A., Naomi E. Kramer, Amanda N. Buerger, Deirdre H. Love, Joseph H. Bisesi, Jr., and Brian S. Cummings. 2021. "Transcriptomic Analysis of the Differential Nephrotoxicity of Diverse Brominated Flame Retardants in Rat and Human Renal Cells" International Journal of Molecular Sciences 22, no. 18: 10044. https://doi.org/10.3390/ijms221810044
APA StyleBarnett, L. M. A., Kramer, N. E., Buerger, A. N., Love, D. H., Bisesi, J. H., Jr., & Cummings, B. S. (2021). Transcriptomic Analysis of the Differential Nephrotoxicity of Diverse Brominated Flame Retardants in Rat and Human Renal Cells. International Journal of Molecular Sciences, 22(18), 10044. https://doi.org/10.3390/ijms221810044