Article

Gibberellins Inhibit Flavonoid Biosynthesis and Promote Nitrogen Metabolism in Medicago truncatula

1
Institute of Animal Sciences, Chinese Academy of Agricultural Sciences, Beijing 100193, China
2
Key Laboratory of Animal Nutrition and Feed Science in South China, Ministry of Agriculture and Rural Affairs, Guangdong Key Laboratory of Animal Breeding and Nutrition, Institute of Animal Science, Guangdong Academy of Agricultural Sciences, Guangzhou 510640, China
3
Inner Mongolia Academy of Agricultural and Animal Husbandry Sciences, Hohhot 010000, China
*
Author to whom correspondence should be addressed.
These authors contributed equally to this work.
Int. J. Mol. Sci. 2021, 22(17), 9291; https://doi.org/10.3390/ijms22179291
Submission received: 27 July 2021 / Revised: 21 August 2021 / Accepted: 23 August 2021 / Published: 27 August 2021
(This article belongs to the Section Molecular Plant Sciences)

Abstract

:
Bioactive gibberellic acids (GAs) are diterpenoid plant hormones that are biosynthesized through complex pathways and control various aspects of growth and development. Although GA biosynthesis has been intensively studied, the downstream metabolic pathways regulated by GAs have remained largely unexplored. We investigated Tnt1 retrotransposon insertion mutant lines of Medicago truncatula with a dwarf phenotype by forward and reverse genetics screening and phylogenetic, molecular, biochemical, proteomic and metabolomic analyses. Three Tnt1 retrotransposon insertion mutant lines of the gibberellin 3-beta-dioxygenase 1 gene (GA3ox1) with a dwarf phenotype were identified, in which the synthesis of GAs (GA3 and GA4) was inhibited. Phenotypic analysis revealed that plant height, root and petiole length of ga3ox1 mutants were shorter than those of the wild type (Medicago truncatula ecotype R108). Leaf size was also much smaller in ga3ox1 mutants than that in wild-type R108, which is probably due to cell-size diminution instead of a decrease in cell number. Proteomic and metabolomic analyses of ga3ox1/R108 leaves revealed that in the ga3ox1 mutant, flavonoid isoflavonoid biosynthesis was significantly up-regulated, while nitrogen metabolism was down-regulated. Additionally, we further demonstrated that flavonoid and isoflavonoid biosynthesis was induced by prohexadione calcium, an inhibitor of GA3ox enzyme, and inhibited by exogenous GA3. In contrast, nitrogen metabolism was promoted by exogenous GA3 but inhibited by prohexadione calcium. The results of this study further demonstrated that GAs play critical roles in positively regulating nitrogen metabolism and transport and negatively regulating flavonoid biosynthesis through GA-mediated signaling pathways in leaves.

1. Introduction

Plant hormones, through endogenous biosynthesis and signal transduction in plants, perform complex physiological functions at very low concentrations. Plant hormones play important roles in plant developmental and physiological processes, such as morphogenesis, growth, metabolism, etc. [1]. Gibberellic acids (GAs), a diterpenoid plant hormone, play an important role in various processes in the whole life cycle of plants, including seed germination, hypocotyl and stem elongation, leaf expansion, trichome development, flowering time, flower development and fruit development [2,3].
GA biosynthesis can be divided into three stages, which occur in three independent cell regions [3,4,5]. The first stage is the production of ent-kaurene from geranylgeranyl diphosphate (GGDP) catalyzed by ent-copalyl diphosphate synthase (CPS) and ent-kaurene synthase (KS). It has been shown that these two key enzymes catalyzing this reaction are located in the plastid, indicating that the first stage occurs in the plastid [6,7]. The second stage mainly consists of two steps. First, ent-kaurene oxidase (KO) catalyzes the formation of ent-kaurenoic acid, which occurs mainly in the plastid membrane. Then, ent-kaurenoic acid is catalyzed to GA12 by ent-kaurenoic acid oxidase (KAO) in the endoplasmic reticulum [7]. In the third and last stage, which occurs in the nucleus and cytoplasm [8], bioactive GAs (including GA1, GA3, GA4 and GA7) are synthesized from the precursor GA12 and catalyzed by the oxidases GA20ox and GA3ox [3]. Furthermore, as a key enzyme in GA synthesis, GA3ox1 is responsible for catalyzing GA9/GA20 to generate GA4/GA1.
Among more than 130 GAs discovered to date, both 13-OH and 13-H GAs frequently coexist in the same tissue, including GA4, GA1 (also known as 13-OH GA4), GA7 and GA3 (also known as 13-OH GA7) are common bioactive GAs in flowering plants. Although bioactivity of GA1 (a 13-OH GA) is lower than GA4 (a 13-H GA) in plants [9], the predominant bioactive form depends on plant species [10]. Furthermore, endogenous bioactive GA levels are also regulated by deactivation. Gibberellin 2-oxidase (GA2ox) encodes a 2-oxoglutarate-dependent dioxygenase (2ODD) and converts bioactive and intermediate forms of GAs to their inactive forms by 2β-hydroxylation [11]. Mutants defective in GA deactivation are taller than WT plants, including cyp714d1/eui of rice [12], slender of pea (Psga2ox1) [13], cyp714a1/cyp714a2 of Arabidopsis [14] and an Arabidopsis ga2ox quintuple mutant [15]. In addition, CYP714B1 and CYP714B2, two cytochrome P450 genes encoding GA 13-oxidase, were previously identified to be responsible for converting GA12 into GA53 (13-OH GA12) in rice. Moreover, CYP714B1 and CYP714B2 play a role in fine-tuning plant growth by decreasing GA bioactivity, and that they also participate in GA homeostasis [16]. Similarly, CYP72A9, a cytochrome P450 gene encoding an active GA 13-hydroxylase, was identified to be responsible for catalyzing the conversion of 13-H GAs to the corresponding 13-OH GAs in Arabidopsis [17]. Further investigation demonstrated that over-expression of CYP72A9 or CYP714B1/CYP714B2 resulted in the reduction of GA4, whereas the level of GA1 was increased, and the transgene lines finally exhibited a semi-dwarfism phenotype.
GA-deficient mutants of genes involved at early (ga1-3 mutants), intermediate (kao1 kao2 mutants) and late-stage (ga20ox1 ga20ox2 ga20ox3 and ga3ox1 ga3ox2 mutants) of the GA biosynthesis pathway show typical GA-deficient phenotypes such as severe dwarfism and late flowering [18]. Over past decades, GA3ox has been isolated and cloned from Arabidopsis [19], alfalfa [20], aspen tree [21], Medicago truncatula [22], pea [13], pumpkin [23], rice [24], tobacco [25] and wheat [26]. Structural analysis of the protein encoded by ga3ox showed that it contains a Fe2+ ion domain and a 2-oxoglutarate-dependent dioxygenase (2ODD) conserved domain [27]. GA3ox plays a role in regulating seed germination, stem elongation, leaf development, flowering and fruiting by controlling the generation of active GAs [3,4]. The generation of bioactive GAs catalyzed by GA3ox is regulated through a complex regulatory process, involving internal hormonal homeostasis (including signal pathway, hormone level, etc.) and external environmental factors (including light, temperature and other factors) to control plant growth by influencing the transcription level and spatiotemporal expression mode of the GA3ox gene.
Besides GA biosynthesis and metabolism, the GA signaling transduction pathway is also tightly regulated during plant growth and development, such as root nodulation. Recently, the influence of gibberellin on the regulation of nodulation and nitrogen fixation in legumes has been emerged, which further broadened the biological function of gibberellin. Early literature demonstrated that gibberellin is required to promote nodule organogenesis; the absence of gibberellin led to the decrease of nodule number and the abnormal development of nodules [28,29]. Subsequent studies showed that gibberellin concentration at a high or low level was not conducive to the occurrence of nodules [29]. In addition, a dual role for GA during infection thread formation and nodule development was validated, suggesting that gibberellin promotes nodule organogenesis and inhibits the formulation of an infection thread [30,31]. Further analysis showed that gibberellin played a role in maintaining the size and activity of the nodule, but it could inhibit the formation of the number of nodules [32]. Furthermore, the CRISPR/Cas9-mediated deletion mutation of MtGA2ox10 inhibited nodule formation and retarded nodule development, while over-expression of MtGA2ox10 increased infection thread formation but inhibition of nodule development, which further demonstrated that gibberellin positively regulated the development of nodule and reduced the formation of the nodule by inhibiting the formation of an infection thread [33]. More recently, the restriction of rhizobial development and the decrease of nitrogen fixation efficiency were observed in gibberellin-deficient pea na mutants [34].
Although the regulatory molecular mechanism of plant morphogenesis by GAs has been partly elucidated, the role of gibberellin in regulating downstream metabolic pathways needs to be further revealed. Relevant researches have shown that the application of orthogonal analytical methods, such as two-dimensional (2D) gel electrophoresis, liquid chromatography-mass spectrometry (LC-MS) and gas chromatography-mass spectrometry (GC–MS) can not only result in more overall coverage of biological systems but can also generate complementary datasets that can be interpreted through ontological and correlation analyses [35]. In the current study, proteomics based on iTRAQ labeling and metabolomics based on high-performance liquid chromatography-mass spectrometry (HPLC-MS) of wild-type R108 and ga3ox1 mutant leaves were carried out simultaneously to elucidate physiological change and metabolic adaption. To further investigate the potential downstream metabolic pathway of gibberellin regulation, andprovide new ideas for the exploration of new functions of gibberellin in legumes.

2. Results

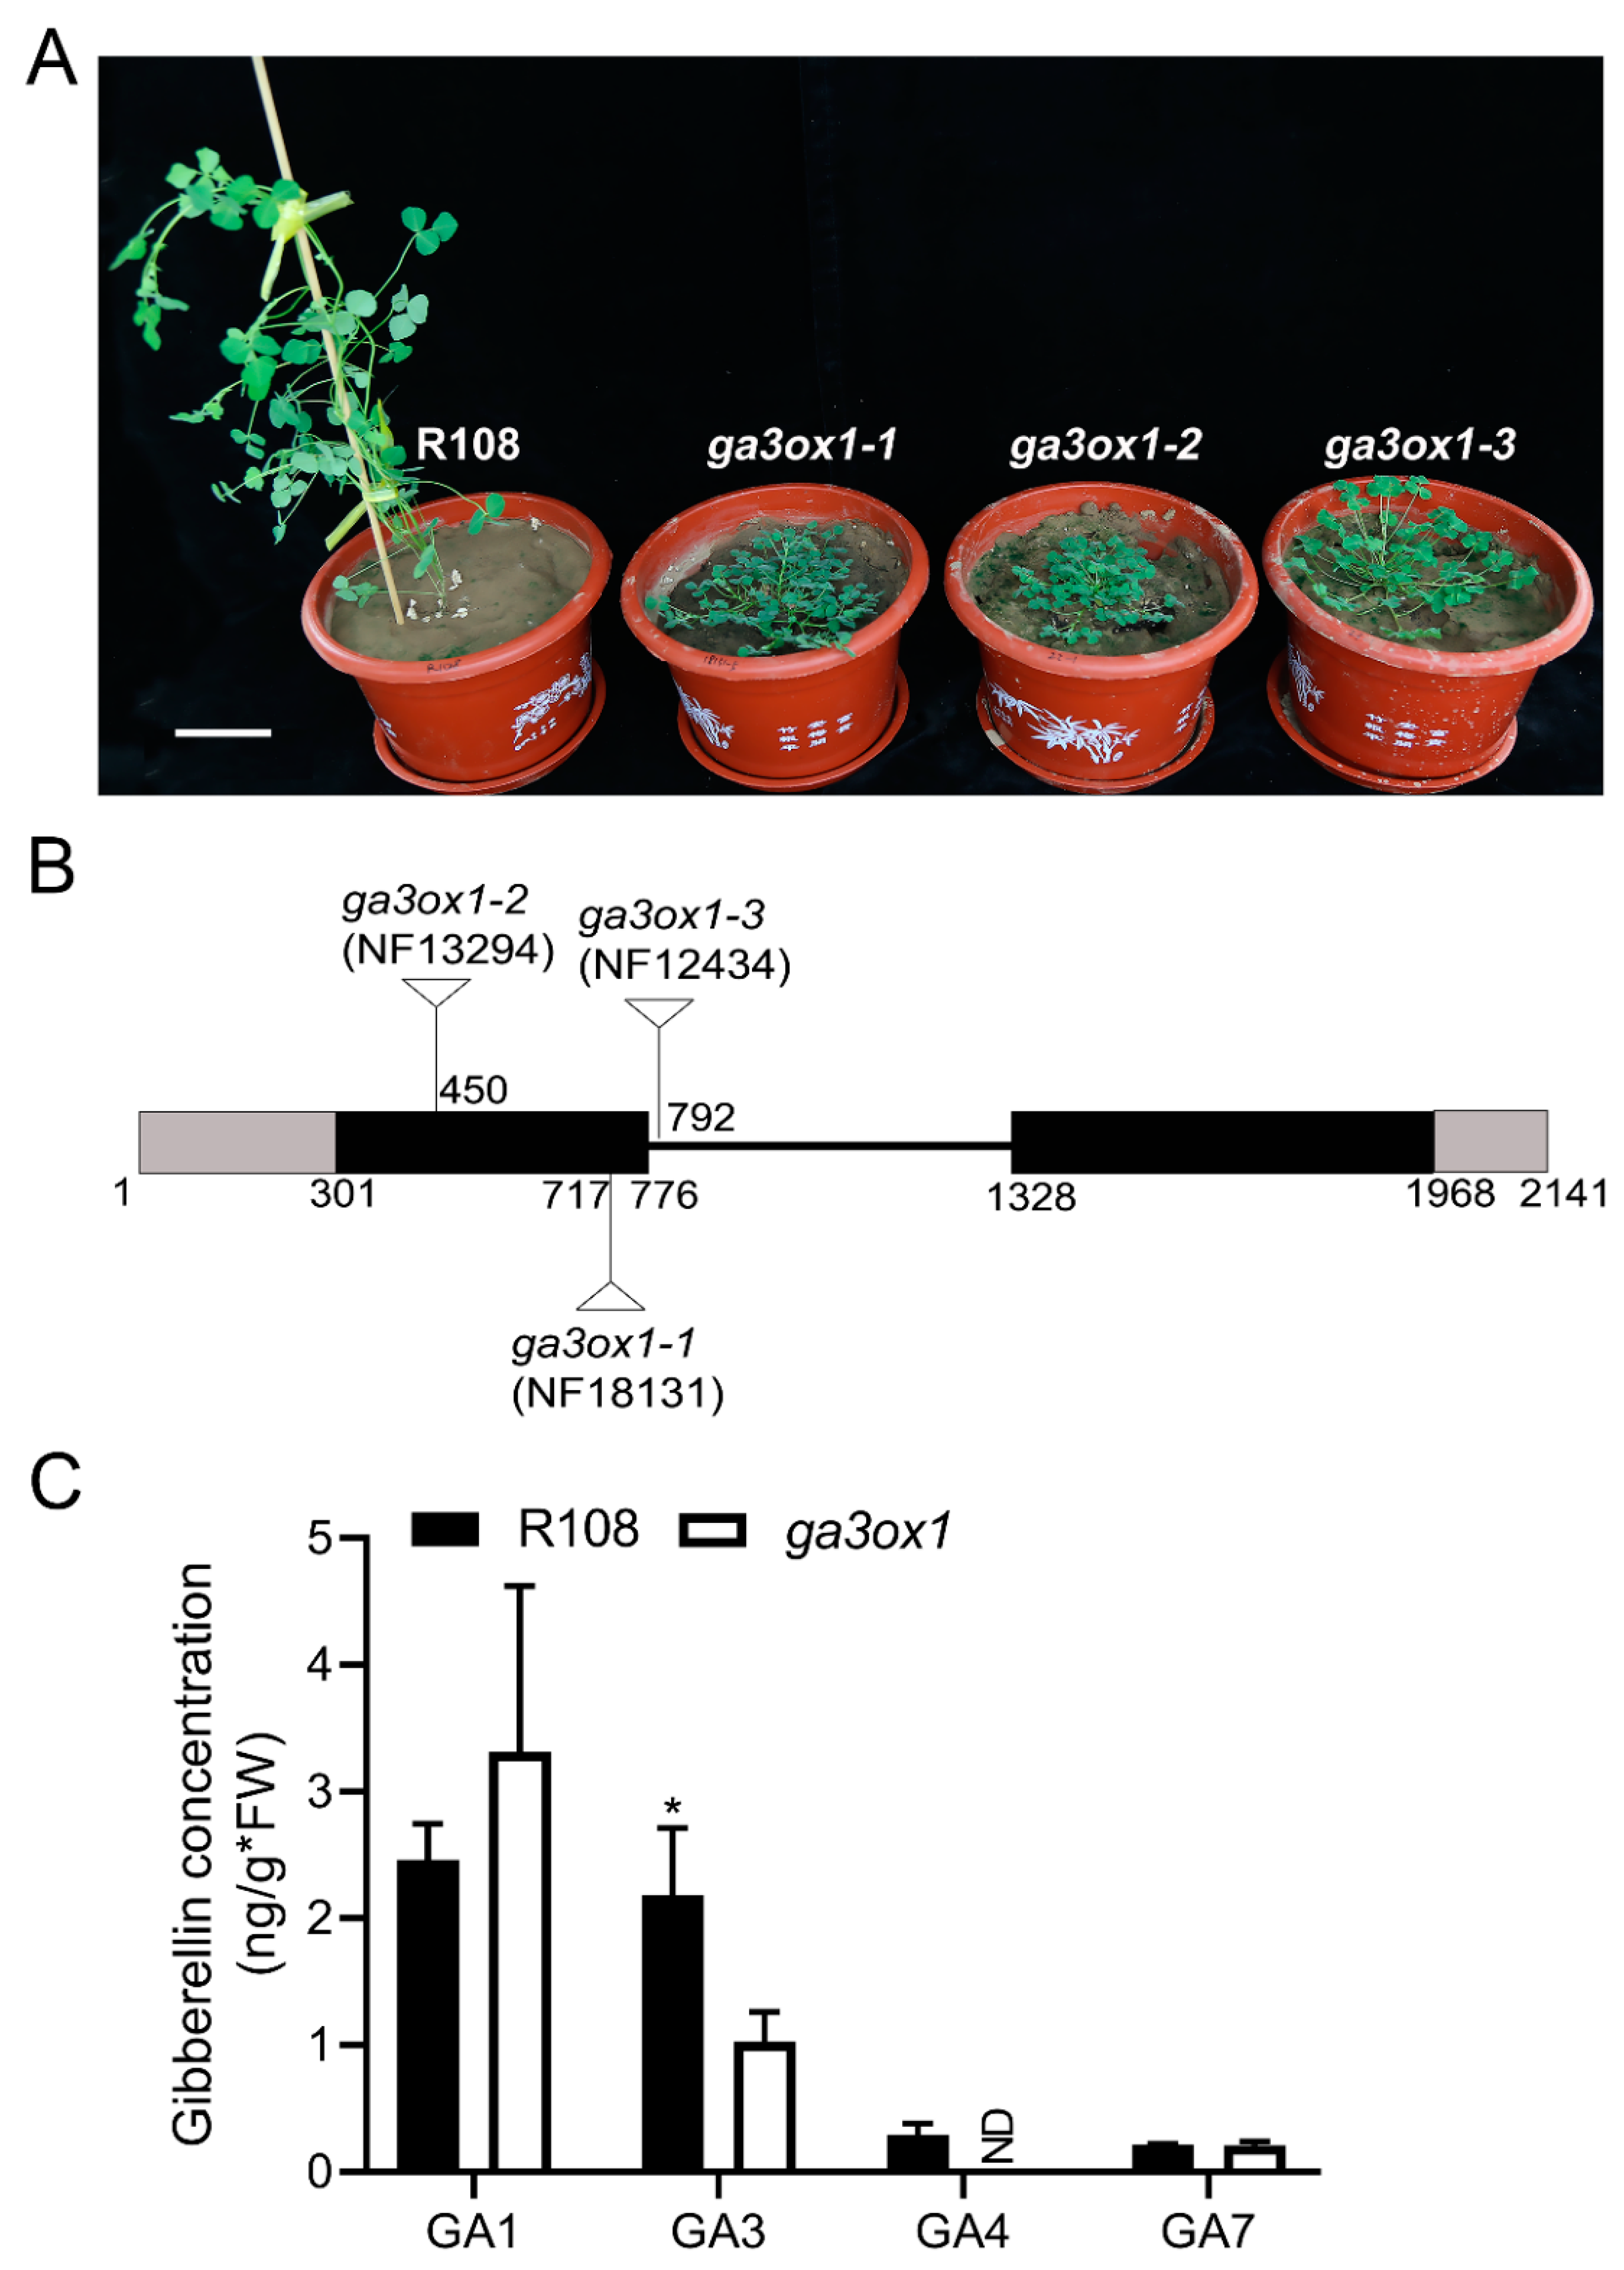
2.1. Isolation and Characterization of M. truncatula ga3ox1 Mutants

Three Tnt1 insertion mutant lines of MtGA3ox1 (NF13294, NF18131 and NF12434) were screened from an M. truncatula Tnt1 mutant population from the Noble Research Institute (Figure 1A). The TAIL-PCR results showed that the Tnt1 insertion in NF18131 was located in the first exon of MtGA3ox1 at 416 bp downstream of the ATG start codon (Figure 1B). In addition, the Tnt1 insertions in NF13294 and NF12434 were confirmed to be located in the first exon of MtGA3ox1 at 149 bp downstream of the ATG start codon and the intron of MtGA3ox1 at 16 bp downstream of the first exon, respectively (Figure 1B). In order to confirm the Tnt1 insertion, RT-PCR detection was performed at the DNA and cDNA levels. Due to Tnt1 insertion, RT-PCR could not detect the full-length GA3ox1 transcript in lines NF13294 (ga3ox1-2), NF18131 (ga3ox1-1) and NF12434 (ga3ox1-3), indicating that they are null mutants (Supplementary Materials Figure S1A). Although Mtga3ox mutant has been recently characterized in other mutant lines of M. truncatula [26], the mutant lines used in our experiment were identified by forward genetics combined with reverse genetics. Since the subsequent experiments were carried out with ga3ox1-1, we donated ga3ox1-1 as ga3ox1. In a phylogenetic analysis of MtGA3ox1, based on the entire protein sequences, MtGA3ox1 was clustered with a group of proteins that have been identified as the GA3ox family of proteins (Supplementary Materials Figure S1B), which are responsible for catalyzing the reactions from GA9 to GA4, as well as from GA20 to GA1 (Supplementary Materials Figure S1C) [5]. The content of the various bioactive GAs in the wild-type R108 and ga3ox1 mutants was determined by HPLC-MS. The results revealed that the content of GA3 and GA4 in the ga3ox1 mutant was significantly lower than that in the R108 ecotype. Compared with wild-type R108, the content of GA3 in the ga3ox1 mutant was reduced by 50%, while the content of GA4 was undetectable (Figure 1C). In addition, we further used HPLC/MS analysis to profile the endogenous GAs in wild-type R108 and ga3ox1 mutants. The results showed that several GAs (GA1, GA3, GA3 O-beta glucoside, GA4, GA5) were greatly reduced in the ga3ox1 mutant, whereas GA36 was greatly increased compared with that in wild-type R108 (Supplementary Materials Figure S1D). In addition, GA9 and GA20 maintained at a normal level. Overall, these data suggested that the loss function of MtGA3ox1 resulted in a decrease in various bioactive GAs (GA1, GA3 and GA4) and an increase in GA36.

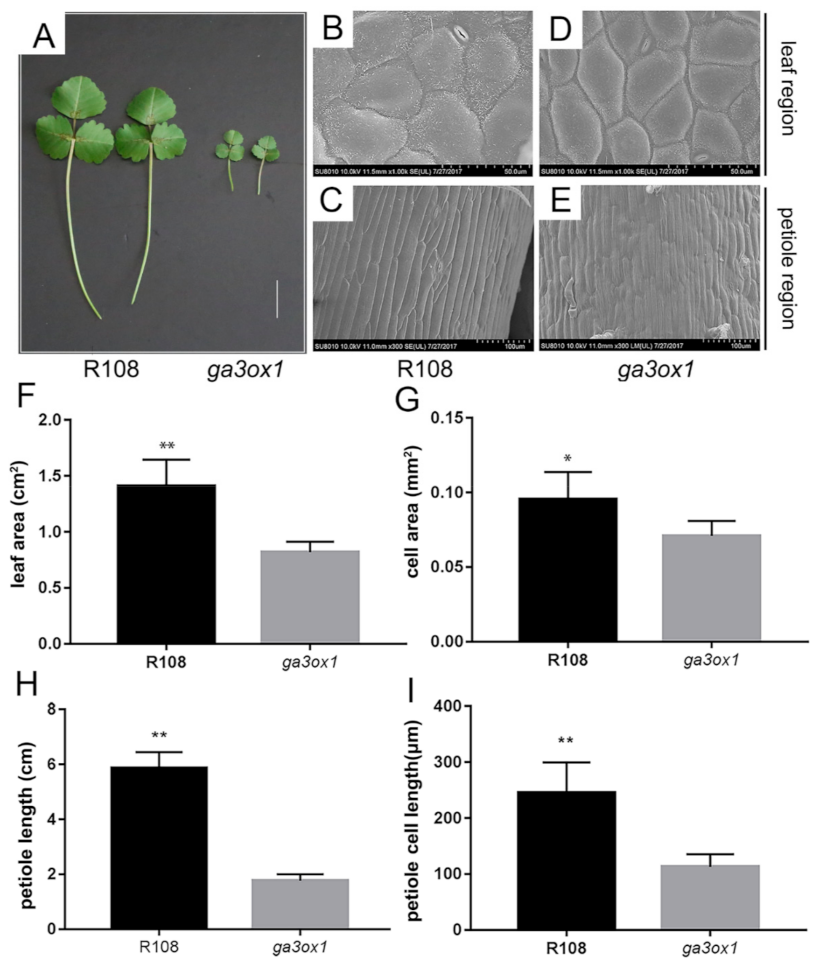
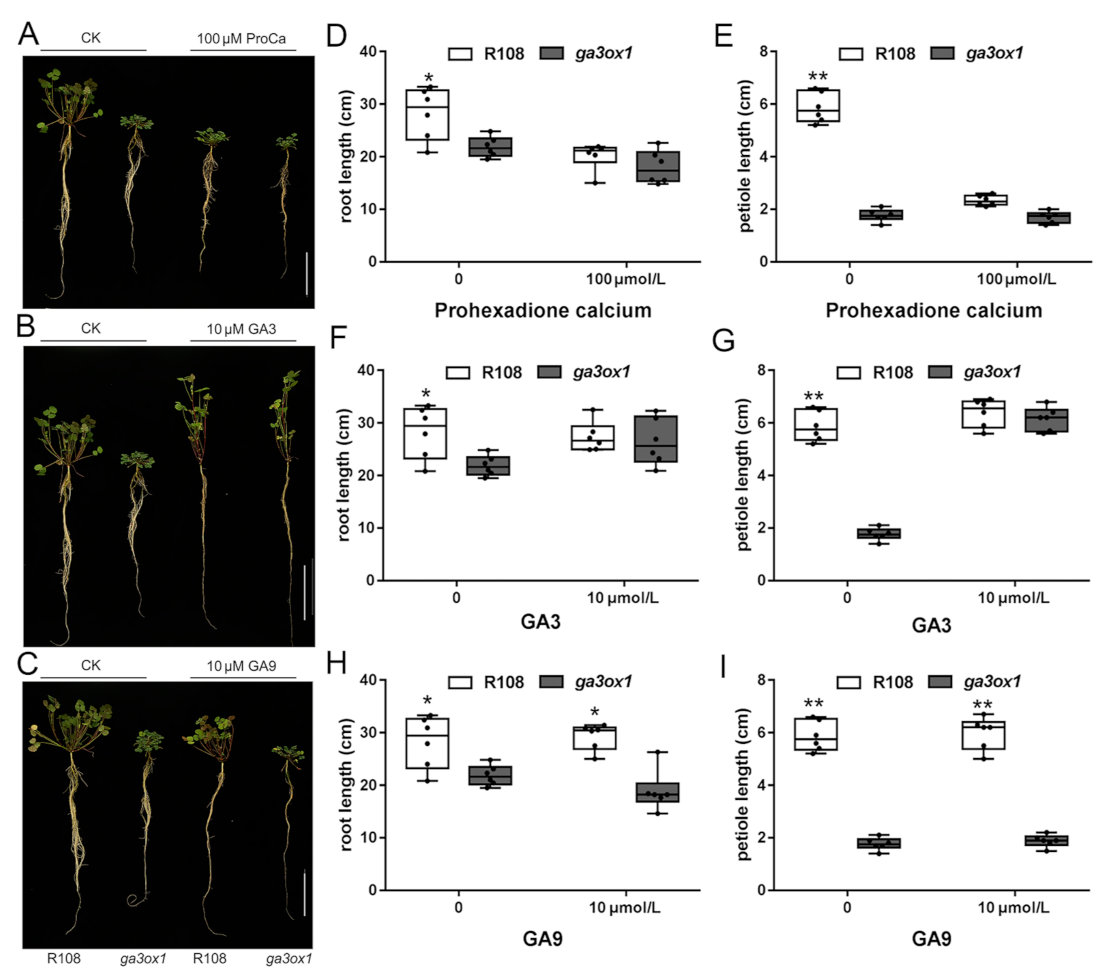
2.2. Phenotypic Analysis and Physiological Changes of the ga3ox1 Mutant

Compared with wild-type R108, the Tnt1 insertion mutant lines showed a dwarf phenotype, creeping growth, dark green leaves, shorter petioles and smaller leaves (Figure 2A). SEM imaging revealed that the leaf cell size and petoile cell length were significantly larger in wild-type R108 than that in ga3ox1 mutant (Figure 2B–E), which was consistent with leaf area and petiole length (Figure 2F–I). In order to establish the relationship between leaf color and chlorophyll content, the chlorophyll content of ga3ox1 mutant and wild-type R108 was determined. The results showed that the content of chlorophyll a (Ca), chlorophyll b (Cb) and carotenoid (Cx.c) in the ga3ox1 mutant leaves was significantly higher than those in wild-type R108 (Supplementary Materials Figure S2A,B). Similarly, the seed coat displayed a darker color in the ga3ox1 mutant (Supplementary Materials Figure S2C). The content of flavonoids in seeds, where they are involved in seed coat pigmentation, was determined, and the content of flavonoids was consistently higher in the ga3ox1 mutant (Supplementary Materials Figure S2C,D).
To further investigate the relationship between the MtGA3ox1 and dwarf phenotype, we cloned the MtGA3ox1 coding region and the complete gene and constructed the complementary vector pGA3ox1: GA3ox1/ga3ox1 and the overexpression vector p35S: GA3ox1/ga3ox1 with GUS fusion tag. Phenotypic characterization revealed that ectopic-expression of MtGA3ox1 in the ga3ox1 mutant restored the upright phenotype, as well as leaf size, petiole length and seed coat color to a similar phenotype as that of wild-type R108 (Supplementary Materials Figure S3A,B), which further demonstrated that the ga3ox1 mutant phenotype is indeed caused by loss of function of MtGA3ox1.

2.3. Loss of Function of MtGA3ox1 Inhibits Plant Morphogenesis

To further illustrate that the dwarf phenotype resulted from the Tnt1 insertion into MtGA3ox1, prohexadione calcium, a known inhibitor of GA3ox enzymes [37], was used for exogenous treatment of M. truncatula seedlings. The results showed that the phenotype of the R108 ecotype was consistent with the dwarf phenotype under 100 µM prohexadione calcium (Figure 3A,D,E). Furthermore, GA3 is one of the few bioactive GAs, as well as one of the products of the catalytic reaction of MtGA3ox1. Accordingly, GA9, which is one of the precursors of the biosynthesis of GA3 and GA4, has no bioactivity. To further understand the relationship between GA deficiency and the dwarf phenotype, M. truncatula seedlings were separately treated with GA3, GA9 and prohexadione calcium. The results revealed that GA3 could effectively restore the dwarf phenotype of the ga3ox1 mutant to the normal state consistent with wild-type R108 (Figure 3B,F,G), while GA9 treatment had no effect on the ga3ox1 mutant and wild-type R108 (Figure 3C,H,I). These results indicated that the dwarf phenotype likely resulted from deficiency of bioactive GAs, while exogenous GA9 could not be catalyzed to generate bioactive GAs due to the Tnt1 insertion mutation of MtGA3ox1.
As mentioned above, due to the lack of GAs, leaf and petiole lengths become smaller. Therefore, four bioactive GAs (GA1, GA3, GA4 and GA7) were used to investigate the relationship between bioactive GAs and the dwarf phenotype. Remarkably, to a certain extent, four bioactive GAs could consistently restore the dwarf phenotype of the ga3ox1 mutant to the wild-type phenotype (Supplementary Materials Figure S4A). In addition, the cell number and cell area of the ga3ox1 mutant were restored to the normal level, which was consistent with those of wild-type R108 (Supplementary Materials Figure S4B–E). However, although treatment with GAs did not significantly change cell size, it significantly increased the hypocotyl length in wild-type R108 (Supplementary Materials Figure S4A).

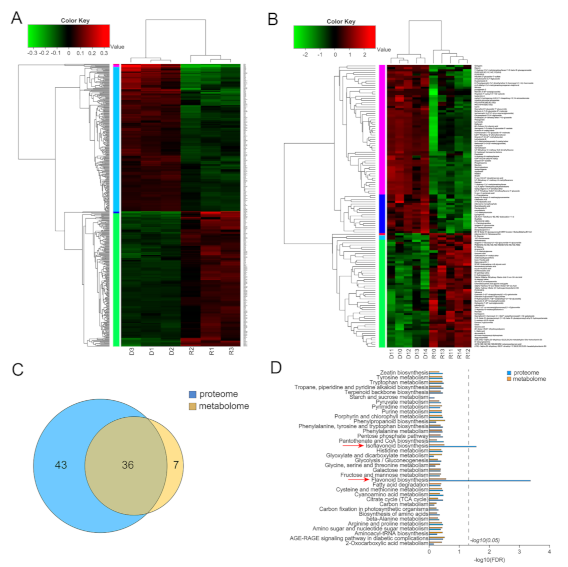
2.4. Based on iTRAQ Labeling Proteomic Analysis and HPLC-MS Metabolomic Analysis

To further investigate dynamic changes resulting from GA deficiency in ga3ox1 mutant, proteomics based on iTRAQ labeling and metabolomics based on HPLC-MS analysis were performed on ga3ox1/R108 tissues. In this study, a total of 456 significantly differentially enriched proteins (DEPs) (screening criteria: p < 0.05 & (FC < 0.83 or FC > 1.20)) were identified, including 238 up-regulated and 218 down-regulated enriched proteins (Figure 4A, Supplementary Materials Table S1). Among them, the up-regulated DEPs were mainly involved in flavonoid, isoflavone and lignin biosynthesis (Supplementary Materials Figure S5A, Supplementary Materials Table S2), while the down-regulated DEPs were mainly involved in oxidative phosphorylation, nitrogen metabolism, photosynthesis and other metabolic pathways (Supplementary Materials Figure S5B, Supplementary Materials Table S2).
In addition, a total of 131 differential metabolites were screened and identified by using the NIST spectral library attached to GC/MS and coupled to the multi-dimensional analysis of OPLS-DA with the single-dimensional analysis of Student’s t-test (VIP > 1.5, p < 0.05), including 53 up-regulated differential metabolites and 78 down-regulated ones (Figure 4B, Supplementary Materials Table S3). Additionally, differential metabolites were assigned to seven biological processes, including glycine, serine and threonine metabolism, starch and sucrose metabolism, ABC transporters, carbon metabolism, aminoacyl-tRNA biosynthesis, isoflavonoid biosynthesis and phenylpropanoid biosynthesis (Supplementary Materials Figure S5C, Supplementary Materials Table S2).
By comparing the metabolic pathways identified to be involved by DEPs based on proteomics and those identified to be involved by differential metabolites based on metabolomics, it was found that DEPs were annotated to 79 metabolic pathways, while differentially enriched metabolites were annotated to 43 metabolic pathways (Figure 4C). Among them, 36 metabolic pathways were consistently enriched between proteomics and metabolomics, including phenylpropanoids synthesis, carbon fixation in photosynthetic organs, flavonoid synthesis, lignin synthesis, isoflavone synthesis, glycolysis and glyconeogenesis. Further KEGG (Kyoto Encyclopedia of Genes and Genomes) enrichment analysis of proteomics and metabolomics metabolic pathways revealed that the flavonoid and isoflavonoid biosynthesis pathways were significantly enriched when the screening condition was FDR < 0.5 (Figure 4D), which indicated that there were dynamic changes in flavonoid and isoflavone synthesis between wild-type R108 and ga3ox1 mutants.

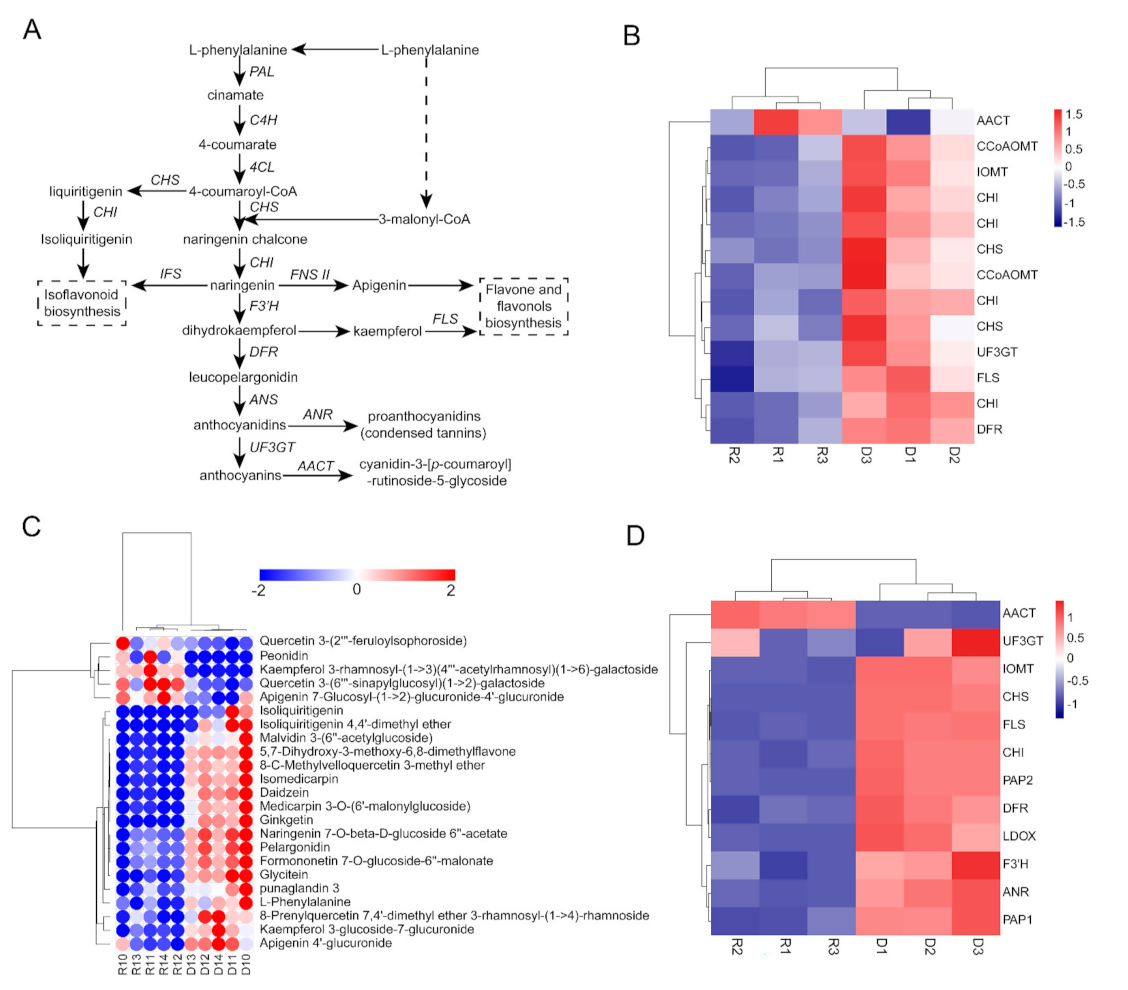
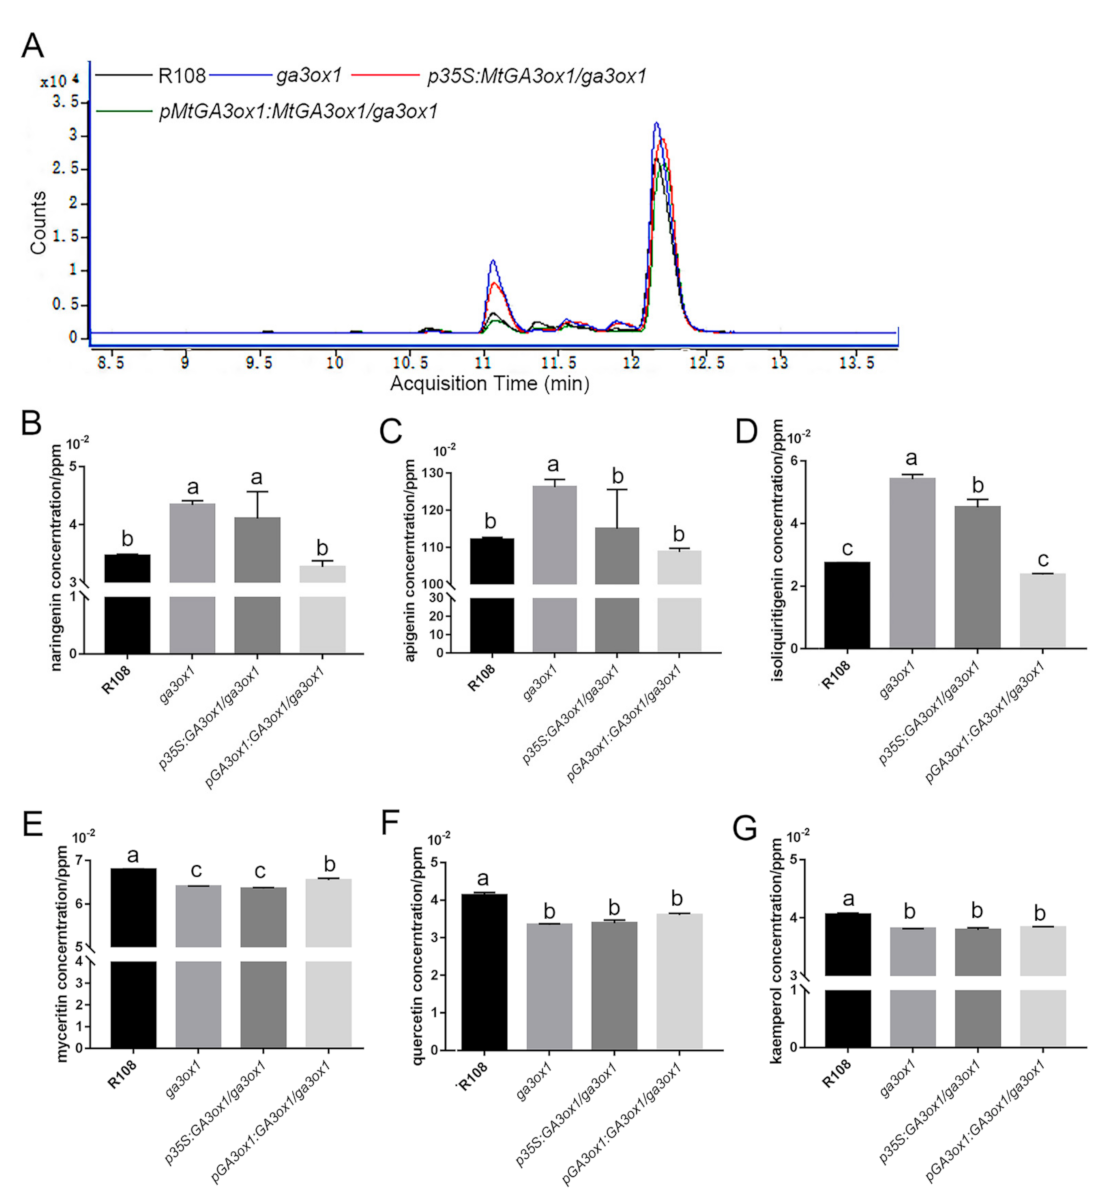
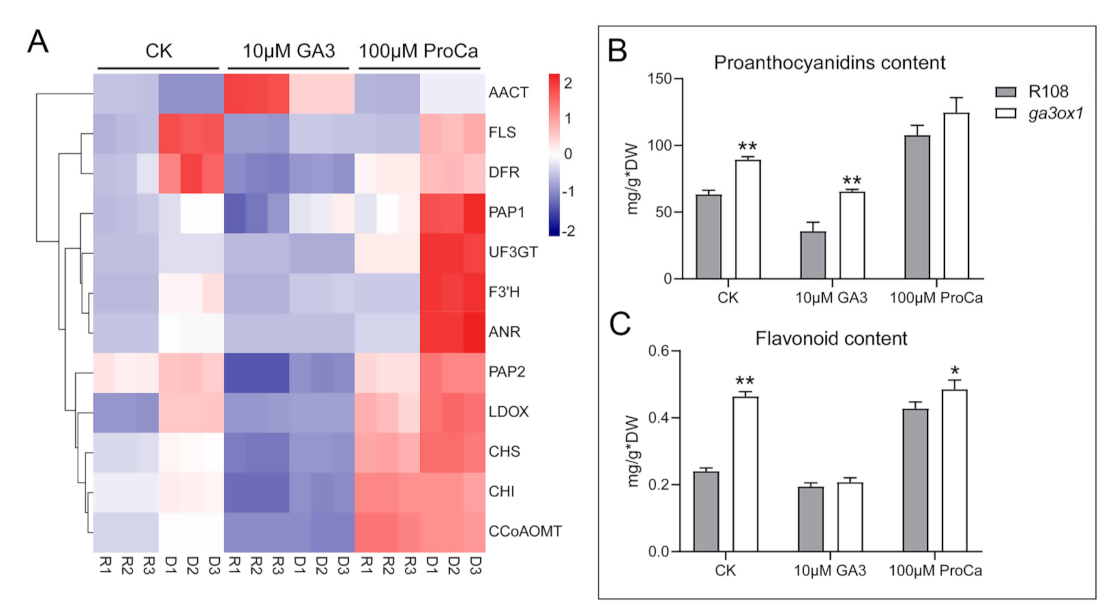
2.5. GAs Inhibited Flavonoid and Isoflavonoid Biosynthesis

To further establish the relationship between the GA and anthocyanin biosynthesis pathways, several key enzymes identified in the proteomic analysis as involved in anthocyanin biosynthesis pathways were selected to investigate the abundance of their corresponding mRNA and protein. The results showed that the mRNA transcript and protein of the key enzymes involved in the anthocyanin biosynthesis pathway (Figure 5A) were present at higher abundance in the ga3ox1 mutant. Meanwhile, the abundance of mRNA transcript and protein of AACT (Anthocyanin 5-aromatic acyltransferase), a protein related to the acetylation of anthocyanin, was lower in the ga3ox1 mutant (Figure 5B,C). In addition, the transcript level of PAP1(production of anthocyanin pigment (1) and PAP2 (production of anthocyanin pigment (2), which regulate the anthocyanin synthesis pathway, were significantly up-regulated in ga3ox1 mutant (Figure 5C).
To further confirm the higher accumulation of flavonoid and anthocyanin due to GA deficiency, the gene expression levels of key naringenin downstream enzymes were analyzed after treatment with exogenous GA3 and prohexadione calcium (Figure 6A). The results showed that the transcript abundance of key enzymes involved in the anthocyanin synthesis pathway was significantly down-regulated after GA3 treatment, and the AACT involved in the acetylation of anthocyanin was significantly up-regulated (Figure 6A). Moreover, the analysis of flavonoid and proanthocyanin contents revealed that the levels of flavonoids and proanthocyanin were significantly increased in the ga3ox1 mutant (Figure 6B,C). Furthermore, the transcript abundance of PAP1 and PAP2, as well as the content of flavonoids and proanthocyanin, were also significantly decreased by treatment with exogenous GA3 but increased by treatment with exogenous prohexadione calcium treatment, which further demonstrated the inhibitory effect of GA on the anthocyanin synthesis pathway. Likewise, the mRNA abundance of key enzymes associated with flavonoid and isoflavonoid biosynthesis, as well as proanthocyanin content, decreased in complementary lines p35S:GA3ox1/ga3ox1 and pGA3ox1:GA3ox1/ga3ox1, which further confirmed that GA biosynthesis inhibits flavonoid and isoflavonoid biosynthesis (Supplementary Materials Figure S6A–I).
To further demonstrate the function of GA3ox1 in flavonoid metabolization, the relative and absolute abundance of the main flavonoid metabolites were analyzed by HPLC/MS. The identity of the flavonoids was established using commercially available standards run under the same conditions and comparing retention times and absorbance spectra of each standard against each of the separated peaks (Supplementary Materials Figure S7). Compared with the wild type, we detected that the mutant leaves produced a higher abundance of flavonoid metabolites (Figure 7A). We further detected naringenin, dihydroquercetin, apigenin, quercetin, liquiritigenin, isoliquiritigenin, kaempferol, myricetin and dihydromyricetin as the main flavonoid metabolites. The levels of the identified flavonoids, especially naringenin and apigenin, were significantly increased in the extracts of ga3ox1 mutant leaves (Figure 7B–D) but restored to normal levels in complementary lines pGA3ox1:GA3ox1/ga3ox1 (Figure 7B–D). Meanwhile, the abundance of quercetin, myricetin and kaempferol, part of the downstream products of naringenin, were significantly reduced in the extracts of ga3ox1 mutant leaves but slightly increased in complementary lines of p35S:GA3ox1/ga3ox1 and pGA3ox1:GA3ox1/ga3ox1 (Figure 7E–G).

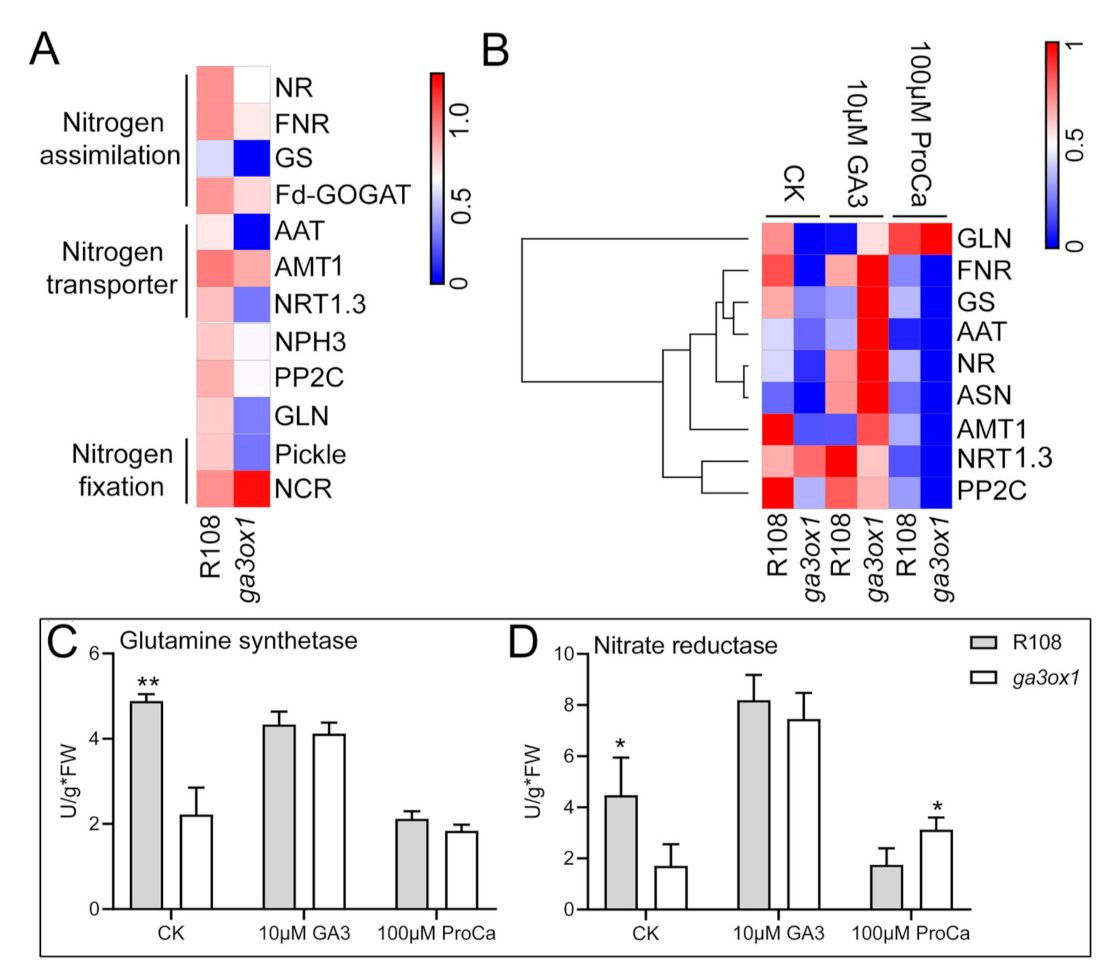
2.6. The Effect of GA-Deficiency on Nitrogen Metabolism and Transport

Based on the iTRAQ labeling proteomic analysis, a number of DEPs associated with nitrogen assimilation (including NIR, GS, GLN and FNR), as well as DEPs associated with nitrogen transport (including NRT1.3, AAT1 and AMT1) and NPH3 involved in signal transduction of nitrogen metabolism were identified and found to be down-regulated in ga3ox1 mutant (Figure 8A).
Although we have characterized the expression levels of several key enzymes involved in nitrogen fixation and transport, it was not sufficient evidence to explain the relationship between GAs and nitrogen metabolism. To further investigate the effect of GAs on nitrogen fixation and transport, the expression levels of DEPs associated with nitrogen metabolism and nitrogen transport were analyzed. qRT-PCR analysis was performed to confirm the abundance of mRNAs encoding NO3 assimilation enzymes (for example, NR and FNR), amino acid transporter (AAT) and NO3 transporters (for example, NRT1.3) in leaves. The results of the analysis revealed that the abundance of the corresponding mRNA was significantly down-regulated in ga3ox1 mutants (Figure 8B) and by treatment with exogenous prohexadione calcium, whereas treatment with GA3 rescued it (Figure 8B). Meanwhile, the abundance of these mRNAs was restored in the complementary lines pGA3ox1:GA3ox1/ga3ox1 (Supplementary Materials Figure S8A–D). Moreover, the activities of key nitrogen assimilation enzymes, such as glutamine synthase (NH4+ assimilation) [38] and nitrate reductase (NO3 assimilation), were consistently higher in wild-type R108 than in the ga3ox1 mutant. Similarly, the corresponding enzymatic activities were relatively enhanced in complementary lines p35S:GA3ox1/ga3ox1 and pGA3ox1:GA3ox1/ga3ox1 (Supplementary Materials Figure S8E,F). Notably, the activities of key nitrogen assimilation enzymes, such as glutamine synthase (NH4+ assimilation) and nitrate reductase (NO3 assimilation), were enhanced by treatment with exogenous GA3 but decreased by treatment with exogenous prohexadione calcium, which had a similar trend with protein and transcript levels in the ga3ox1 mutant (Figure 8C,D).

3. Discussion

3.1. GAs Participated in the Regulation of Flavonoid and Isoflavonoid Biosynthesis

Flavonoids are a kind of secondary polyphenolic metabolites produced by the synthesis of phenylpropanoid, which are widely found in plants, mainly including bioflavonoids, flavonols, isoflavonoids and anthocyanins. Flavonoids are essential for plant structure and function, as well as plant microbial interactions, including symbiotic signaling in root nodule symbiosis (RNS) and the genesis and development of nodule organs [39,40,41]. Anthocyanins, the key molecules of pigmentation and signal transduction, has been reported to be involved in attracting pollinators, inhibiting herbivores or pathogens, reducing the damage of reactive oxygen species and protecting the roots of legumes from ultraviolet rays [42]. Since anthocyanins are involved in various important functions, the synthesis of anthocyanins and related regulatory mechanisms have attracted extensive attention.
Several studies have shown that the biosynthesis of anthocyanins in plants is affected by external environmental factors (such as light [43], low phosphorus stress, cold stress) [44], as well as plant hormones, including CKs, ethylene, JAs and GA [45,46,47,48,49,50]. It has been shown that sucrose induced dihydroflavonol 4-reductase (DFR) and PAP1 transcription, but this process was inhibited by treatment with exogenous GA3, which indicated that GA3 is an antagonist of sucrose-induced anthocyanin biosynthesis [45]. In addition, previous studies have shown that GAs have tissue specificity in regulating anthocyanin biosynthesis, which is manifested in promoting anthocyanin biosynthesis in flowers and inhibiting anthocyanin biosynthesis in other tissues. In this study, protein and mRNA abundance of key enzymes associated with flavonoid and isoflavonoid biosynthesis, as well as differential metabolites identified by leaf metabolomics, were found consistently increased in the ga3ox1 mutant, which indicated that these biological processes were facilitated by the absence of GAs (Supplementary Materials Figure S5A). Remarkably, we noticed that flavonoid and isoflavonoid biosynthesis, as well as flavonoid content, were restored to normal level by treatment with exogenous GA3 but further promoted by treatment with exogenous prohexadione calcium (Figure 6A–C). However, the abundance of protein and transcript of AACT, an enzyme associated with anthocyanin acetylation, was lower in the ga3ox1 mutant compared with wild-type R108 (Figure 5B,C), which is consistent with previous studies [45]. These results further demonstrated that GAs have a negative effect on flavonoid and isoflavonoid biosynthesis in leaves.
However, the GA-insensitive mutant gai is not sensitive to GA-dependent inhibition of DFR expression induced by sucrose, which indicated that GAs regulate sucrose-induced anthocyanin biosynthesis by regulating the abundance or activity of DELLA proteins [45,50,51]. The GA–DELLA pathway has also been shown to be involved in the regulation of anthocyanin accumulation induced by low temperature [48], phosphorus deficiency [52] and nitrogen deficiency [53]. In this study, based on iTRAQ labeling proteomics analysis, a GRAS family protein was identified and found to be up-regulated in the ga3ox1 mutant, which might provide a reasonable explanation for the anthocyanin accumulation in the ga3ox1 mutant. Previous studies have shown that DELLA protein positively regulates nitrogen-deficiency-induced accumulation of anthocyanin through direct interaction with PAP1 and enhances its transcriptional activity on the expression of the anthocyanin biosynthesis gene [53], which suggested that GAs regulates the expression of PAP1 and its downstream genes through the regulation of the activity of DELLA proteins. Noteworthy, the transcript level of PAP1 and PAP2 were significantly up-regulated (Figure 5D) and more proanthocyanin accumulated in the ga3ox1 mutant (Figure 6C), which indicated that GAs inhibited anthocyanin biosynthesis.
Due to the loss function of MtGA3ox1, the leaves of ga3ox1 mutant produced a more diverse range of flavonoids metabolites (Figure 7A). Furthermore, naringenin (the precursors of flavonoid biosynthesis), apigenin (the precursors of flavone and flavonol biosynthesis) as well as isoliquiritigenin (the precursors of isoflavone biosynthesis) were significantly increased in ga3ox1 mutant leaves (Figure 7B–D), which suggested that these three biological processes have been promoted. Meanwhile, the abundance of mRNAs and protein of the cytochrome P450 family flavone synthase, which catalyze the reaction from naringenin to apigenin, were consistently up-regulated in ga3ox1 mutant leaves. Besides naringenin and apigenin, along with the increased abundance of mRNAs and proteins of the chalcone-flavanone isomerase family protein and chalcone and stilbene synthase family protein, the levels of liquiritigenin and isoliquiritigenin were increased in ga3ox1 mutant leaves. These findings suggested that isoflavonoid biosynthesis, as well as flavone and flavonol biosynthesis, might be positively regulated by GAs.

3.2. GAs Affect Seed Coat Pigmentation by Regulating Anthocyanin Synthesis

The pigmentation of flower and seed coats is caused by the deposition of a large number of flavonoids in soybean tissues. The synthesis of these compounds mainly comes from the anthocyanin biosynthesis branch of the phenylpropane pathway [54]. Thus far, genetic analysis of genes controlling natural variation of seed coat and flower color in soybean showed that at least five alleles (I, T, W1, R and O) were known to control seed coat pigmentation, and six alleles (W1, W2, W3, W4, Wm and Wp) were known to control flower color deposition [55]. In this study, two chalcone and stilbene synthase family proteins, which have been shown to be involved in the control of the distribution of anthocyanins and proanthocyanidins [56,57], were identified and found to be up-regulated in the ga3ox1 mutant. In addition, F3′H has been proved to be co-segregated with T locus and played a key role in control specific seed coat color by controlling the types of anthocyanins and proanthocyanidins [58]. We further investigated the transcription level of CHS and F3′H and found that the expression of related genes was significantly up-regulated in the ga3ox1 mutant. Interestingly, compared to the wild type, the seed coat displayed a darker color in the ga3ox1 mutant (Supplementary Materials Figure S2C), which was consistent with the mRNA abundance of CHS and F3′H. Previous studies have shown that the formation of seed coat color was mainly due to the composition of anthocyanins and proanthocyanidins. Therefore, based on leaf metabolomics, we found that peonidin and pelargonidin had a higher abundance in ga3ox1 mutants, which may be one of the reasons for the deepening of seed coat color of the ga3ox1 mutants. Furthermore, the expression of CHS and F3′H was induced by gibberellin synthesis inhibitors, whereas it was inhibited by exogenous GA3, which further demonstrated that GAs might affect seed coat pigmentation by regulating anthocyanin synthesis. Phenotypic characterization also revealed that over-expression of MtGA3ox1 in the ga3ox1 mutant restored seed coat color to a similar phenotype as that of wild-type R108 (Supplementary Materials Figure S3A,B). Moreover, the transcription level of CHS and F3′H were down-regulated, and the mRNA abundance corresponding genes were even lower in the ga3ox1 mutant than that in the wild type, which provided solid evidence for the effect of GAs on seed coat color by inhibiting anthocyanin synthesis.

3.3. GAs Is Involved in the Regulation of Nitrogen Transport and Metabolism

Nitrogen is an essential mineral nutrient in plant growth and development, and the application of nitrogen fertilizer increased crop yield, which has become an important factor in the green revolution. The root system is responsible for absorbing and metabolizing bioavailable nitrogen and transducing nitrogen signals. Therefore, roots play a crucial role in regulating plant responses to nitrogen. Relevant research has revealed that nitrogen transporters, anabolic enzymes and signal transducers are transcriptionally regulated by changes in soil nitrogen availability [59]. Furthermore, post-transcriptional modification and calcium- and phosphorylation-dependent signaling cascades are key regulators of this transcriptional response [60]. Recently, several transcription factors associated with root development and nitrogen metabolism were screened [61,62,63,64,65,66], and carbon metabolism and hormone pathways have also been proved to be involved in nitrogen metabolism [67]. More recently, an interaction network was established based on the interaction between the promoters and genes associated with nitrogen transport, nitrogen assimilation, nitrogen signaling transduction, nitrogen metabolism as well as hormone response and transcription factors, which indicated that phytohormone probably participates in nitrogen signaling transduction [68,69]. Interestingly, nitrogen-metabolism-related proteins were identified by proteomics, and, in particular, several DEPs (including NRT1.3, AAT1 and AMT1 associated with nitrogen transport, and NIR, GS, GLN and FNR associated with nitrogen assimilation, as well as NPH3 involved in nitrogen metabolism signal transduction) were down-regulated in the ga3ox1 mutant (Figure 8A). In addition, we further found that nitrogen metabolism and nitrogen transporter were induced by treatment with GA3 but inhibited by treatment with exogenous prohexadione calcium (Figure 8B), which indicated that gibberellins were required for nitrogen absorption and GAs could promote nitrogen metabolism. Recent studies reported that the decrease of bioactive GAs and the accumulation of DELLA proteins inhibited nitrogen absorption [70,71], which was consistent with our data. In addition, the accumulation of DELLA proteins resulted in semi-dwarfing, which reduced the response of plant growth to nitrogen, thus reducing the absorption of nitrogen. Moreover, the abundance of DELLA proteins probably affects NO3 uptake and nitrate reductase activity by inhibiting the GRF4-induced transcriptional activation of NO3 metabolism genes [72]. Accordingly, we further investigated the activities of key nitrogen assimilation enzymes, including glutamine synthase (NH4+ assimilation) and nitrate reductase (NO3 assimilation). The results showed that the corresponding enzymatic activities were lower in the ga3ox1 mutant than those in wild-type R108, and enzymatic activities were restored in complementary lines p35S:GA3ox1/ga3ox1 and pGA3ox1:GA3ox1/ga3ox1 (Supplementary Materials Figure S8E,F). Furthermore, enzymatic activities associated with nitrogen assimilation were enhanced by treatment with GA3 but suppressed by treatment with prohexadione calcium, which suggested that nitrogen assimilation varies with dynamic changes in the GA levels. In this study, due to GA deficiency, the mRNA and protein levels of DELLA proteins were higher in the ga3ox1 mutant compared with the wild-type R108 (Supplementary Materials Figure S9A), which reasonably explained the involvement of GAs in positively regulating nitrogen metabolism.

3.4. The Cross-Talk between Flavonoid Biosynthesis and Nitrogen Metabolism

The symbiotic interaction between legumes and nitrogen-fixing rhizobia bacteria provides most of the terrestrial biological nitrogen fixation. Previous studies have reported that bioflavonoids, especially flavonoids and flavones, played a critical role in legume–rhizobium symbiosis. Additionally, flavonoid-deficient lines have a near-complete loss of nodulation, while flavones-deficient lines have reduced nodulation [73]. In general, flavonoids can play a role in three distinct stages of the nodulation process. Flavonoids, as a group of inducers, promote the expression of the nod gene in the rhizosphere [74], while in the infection thread, flavonoids participate in the induction of Nod-factor biosynthesis [30]. In addition, flavonoids can also regulate auxin transport and initiate nodule primordial cell division [75,76]. Auxin transport, as well as flavonoids accumulation, are necessary for the induction of nodulation. Auxin transport is enhanced in flavonoid-deficient roots, and flavonoid deficiency hinders the inhibition of auxin transport, although NPA inhibits auxin transport [77,78]. In this study, the levels of flavonoids were higher in the ga3ox1 mutant than those in wild-type R108. Additionally, by proteomics, auxin efflux carrier family protein, a member of auxin transporter family proteins, was identified and found to be down-regulated in ga3ox1 mutants, which might explain the inhibitory effect of flavonoid on auxin transport [71]. Furthermore, GAs play an essential role in nodule formation and development by mediating the activities of DELLA proteins and decreasing nodule formation along with GA-deficiency [28,29]. Interestingly, in this study, the mRNA and protein levels of GRAS family transcription factor (MTR_2g097390), which was identified by proteomics, were higher in the ga3ox1 mutant, as well as the transcript level of DELLA domain GRAS family transcription factor GAI (MTR_3g065980). DELLA proteins can be directly regulated by the nitrile specifier protein 2 (NSP2) signaling pathway and the transcription factor nuclear factor Y subunit A1 (NF-YA1), activate ERN1 transcription and promote the regulation of rhizobium infection [79]. In addition, we identified a CHD3-type chromatin-remodeling factor pickle protein (PKL) (Figure 8A), which is involved in the regulation of plant development processes, including embryonic development, seed germination, root meristem activity and hypocotyl cell elongation during skotomorphogenesis [80]. Moreover, GA3 inhibited H3K27me3 modification of histones associated with cell-elongation-related loci in a DELLA-mediated manner; DELLA proteins interacted with PKL and attenuated its binding ability [81]. Further analysis demonstrated that PKL plays a positive role in regulating GA signaling, and the expression of 80% of GA-responsive genes in seedlings is PKL dependent, including genes that function in cell elongation, cell division and phase transitions [82]. Therefore, PKL might display an essential role in forming indeterminate nodules. Furthermore, a Nodule Cysteine-Rich (NCR) secreted peptide (NCR) was found to be up-regulated in ga3ox1 mutants. The gene family of NCR might be specific for galegoid legumes forming indeterminate nodules [83]; the elevated protein abundance of NCR further supported the increase of nodule number in ga3ox1 mutants (Supplementary Figure Materials S9B). Taking plant hormones and flavonoids into account, GAs and flavonoids are important aspects in the regulation of nodule formation, respectively. Furthermore, we found an antagonistic effect between GAs and flavonoids in nodule development (Supplementary Materials Figure S9B).
The GA–DELLA system differentially regulates the mRNAs levels of the AMT1.1 and GS1.2 genes encoding proteins involved in NH4+ metabolism [38,84]. The accumulation of SLR1, a member of the DELLA protein family, reduces NH4+ uptake, whereas GA restores it by promoting protein DELLA ubiquitination and subsequent degradation [72]. In this study, due to GA deficiency, the expression of genes involved in nitrogen metabolism and transport was down-regulated and further inhibited nitrogen absorption in the ga3ox1 mutant. Meanwhile, high carbon/nitrogen ratios induce anthocyanin pigmentation in leaves by promoting the expression of anthocyanin/flavonoid biosynthetic genes [85]. Moreover, mineral nitrogen availability reduced the isoflavonoid concentration of the soybean root system, which probably plays a part in the regulation of soybean nodule formation by available nitrogen [73]. In addition, nitrogen deficiency induced the expression of the MYB-bHLH-WD repeat protein (MBW) complex and ultimately increased the levels of anthocyanin and flavonoids in A. thaliana [44]. Measurement of the flavonoids content by spectrophotometry revealed that more flavonoids accumulated in the ga3ox1 mutant, whereas flavonoid content was restored to normal levels in pGA3ox1:GA3ox1/ga3ox1 lines. Accordingly, the abundance of pelargonidin and proanthocyanidins was increased in the ga3ox1 mutant, which is consistent with the protein and transcription levels of key naringenin downstream enzymes. Furthermore, the cytochrome P450 family flavone synthase, identified by proteomics and found to be up-regulated in the ga3ox1 mutant, was responsible for catalyzing naringenin to apigenin. The general flavonoid pathway regulators PAP1 and PAP2 were also up-regulated in response to nitrogen deficiency in A. thaliana. The transcription factor PAP1/AtMYB75 promoted the expression of genes for enzymes involved in the biosynthesis of phenylpropanoids and flavonoids, such as phenylalanine ammonialyase (PAL), chalcone synthase (CHS), chalcone isomerase (CHI) and DFR [86]. Therefore, the mRNA abundance of PAP1 and PAP2 were determined. Unlike previous research [44], although PAP1 was up-regulated, PAP2 expression was much slighter than that of PAP1 and was even down-regulated in the ga3ox1 mutant. In addition, DELLA proteins positively regulated nitrogen-deficiency-induced anthocyanin accumulation by directly interacting with PAP1 to enhance its transcriptional activity on anthocyanin biosynthetic gene expressions [53].

4. Materials and Methods

4.1. Plant Materials and Growth Conditions

Medicago truncatula cv. R108 was used as the wild type. The mutant line, NF18131, was identified from an M. truncatula Tnt1-insertion population based on a dwarf phenotype. A TAIL-PCR was performed to amplify and analyze flanking sequences and conduct a BLAST search against the Ensemble Plants (http://plants.ensembl.org/, accessed on 26 July 2021, version 2.0.0, EMBL-EBI, Cambridge, London) to identify the T-DNA insertion site as previously described [87,88]. Mutant and wild-type seeds were scarified with fine sandpaper and treated at 4 °C for 2 days on filter paper. Small plantlets were transferred to soil and grown in the greenhouse at 24/22 °C (day/night) temperature with 16 h light. Hydroponic culture conditions were modified from previously published work [89]. Seeds were scarified with fine sandpaper and disinfected in 20% sodium hypochlorite solution for 30 min, thoroughly washed with deionized water and subsequently germinated in a moist filter paper. Seven-day-old seedlings were then selected and transplanted to 1/2 Hoagland nutrient solution. The nutrient solutions of all seedlings were changed once per week, and the pH value was adjusted to 5.8. The temperature was maintained at 24 °C during the day and at 22 °C at night, and the relative humidity was kept at 70%.

4.2. TAIL-PCR

Genomic DNA was extracted according to the instructions of the Tiangen DP305 Plant Genomic DNA extraction kit (Tian-gen, Biotech Co., Ltd., Beijing, China). TAIL-PCR was performed as described previously [87]. The degenerate primers used for TAIL-PCR were AD1, AD2, AD3, AD4 and AD6 [87]. The T-DNA specific primers Tntail3, LTR4 and LTR7 (primer sequences are shown in Supplementary Materials Table S4) were used in the primary, secondary and tertiary TAIL-PCR reactions, respectively. Specific TAIL-PCR products were gel-purified, sequenced and BLAST-searched against the Ensemble Plants to identify the T-DNA insertion site.

4.3. Screening of Mutants and Plant Transformation

The mutant lines of MtGA3ox1 (NF12434 and NF13294) were identified by searching the Medicago truncatula Mutant Database (https://medicago-mutant.noble.org/mutant/database.php, 6 March 2018, Noble Research Institute, Ardmore, USA). The mutants were further confirmed by PCR amplification (using primers identified from the M. truncatula genome sequence that spanned across the Tnt1 insertion sites). The PCR products were purified and cloned into the pEASY-T5 cloning vector (TransGen Biotech Co., Ltd., Beijing, China) and sequenced using Sanger dideoxy sequencing. The flanking sequences were BLAST-searched against the M. truncatula genome sequence at the NCBI database. The genomic sequence of MtGA3ox1 was obtained from the wild-type M. truncatula R108 database (http://www.medicagohapmap.org/tools/r108_blastform, 18 March 2018). For ga3ox1 mutant complementation assays, the pMtGA3ox1:GA3ox1 and p35S:GA3ox1 constructs were obtained using the destination vector pCAMBIA3301. For translational fusions, MtGA3ox1 cDNA was amplified by PCR (primer sequences are shown in Supplementary Materials Table S2), first cloned into the pEASY-T5 cloning vector (TransGen Biotech Co., Ltd., Beijing, China), and subsequently in the pCAMBIA3301 (driven by the CaMV35S promoter) carrying a GUS sequence downstream of the cloning site. For wild-type R108 overexpression assays, the coding sequences of MtGA3ox1 were obtained by RT-PCR amplification using primers MtGA3ox1-F and MtGA3ox1-R (primer sequences are shown in Supplementary Materials Table S1). The pMtGA3ox1:GA3ox1 and p35S:GA3ox1 constructs were obtained and used to transform the wildtype and mutant using leaf explants. PCR analysis of the regenerated plants was performed using a forward primer selected from the CaMV35S promoter (35Spromoter-F) and a reverse primer selected from MtGA3ox1 (MtGA3ox1-R1) (Supplementary Materials Table S5).

4.4. iTRAQ-Based Comparative Proteomic Analysis

The mature leaves of 1-month-old plants were collected and immediately frozen in liquid nitrogen. Every three individual samples were pooled for one replicate, and three biological replicates were analyzed. Total protein was isolated and purified according to a previously published study [90]. Additionally, protein concentration was measured using a Bradford assay kit (Bio-Rad Laboratories Inc., Hercules, CA, USA), and bovine serum albumin (BSA) was used as a reference protein for this experiment to generate a standard curve. Proteins were digested using the filter-aided sample preparation (FASP) method as follows [91]. The peptides of the six samples were labeled with isobaric tags from the iTRAQ Reagent-8plex Multiplex Kit (AB Sciex, LLC, Framingham, MA, USA) according to the manufacturer’s recommended procedure [92].

4.5. Metabolomics Analysis Based on LC-MS

Analysis of plant leaves extracts was performed by using ultra-performance liquid chromatography coupled to quadrupole-time-of-flight mass spectrometry (UPLCQ-TOF/MS) system (Waters Corporation, Milford, MA, USA), equipped with BEH C18 columns (Waters Corporation) of the following size and granulation: 100 mm × 2.1 mm, grain diameter 1.7 μm. Chromatography was performed at a flow rate of 0.40 mL/min using mixtures of two solvents: A (99.9% H2O, 0.1% formic acid v/v) and B (99.9% acetonitrile, 0.1% formic acid v/v). The elution steps were as follows: 0–2 min linear gradient from 5 to 20% B, 2–8 min linear gradient from 20 to 60% B, 8–12 min linear gradient from 60 to 100% B, 12–14 min isocratic at 100% B; after return to the initial conditions, the equilibration was achieved after 1 min. The settings of the TOF mass spectrometer were as follows: the signals of the mass spectrometer were collected using positive and negative ion scanning modes; electrospray capillary voltage, entrance potential and collision energy were set to 1.0 kV, 40 V and 6 eV, respectively; ion source temperature and de-solvent temperature were set to 120 and 500 °C, respectively; flow rate of dry gas was set to 900 L/h. According to the results of preliminary experiments, spectra were recorded in the targeted mode in the mass range 50–1000 m/z. Baseline filtering, peak identification, integration, retention time correction, peak alignment and normalization of the original data were performed by the metabolomics software progenesis QI (Waters Corporation), and a data matrix of the retention time, mass/charge ratio and peak strength was ultimately obtained. After normalization of the data matrix, it was imported into the SIMCA-P 14.0 software (Umetrics, Umea, Sweden); the unsupervised principal component analysis (PCA) was performed to test the population distribution of the samples and the stability of the whole analysis process, and the supervised (orthogonal) partial least squares discriminant analysis (OPLS-DA) was carried out to discriminate between metabolic profiles of the general differences between groups, and identify the differences between groups of metabolites. In OPLS-DA analysis, a variable important in projection (VIP) with value greater than 1 is considered as a differential variable. In order to prevent overfitting of the model, seven cyclic interactive validation and 200 response sequencing tests were used to assess the quality of the model.

4.6. HPLC of Flavonoid Aglycones

Mature leaves were collected from the 1-month-old pot-grown plants, immediately ground in liquid nitrogen with a mortar and pestle, transferred into an Eppendorf tube and weighed. For each genotype, mature leaves from three individual plants were used for flavonoid aglycones extraction. The extraction experiments were conducted with three biological replicates.For determination of total flavonoids, 100 mg fresh samples were extracted with 1 mL of 80% methanol, sonicated for 1 h and kept at room temperature on a rotating wheel overnight. The extract was centrifuged at room temperature for 30 min to remove tissue debris and the supernatant was dried under nitrogen gas, and the remnant was deglycosylated by redissolving the pellets in 2 M HCl and heated at 80 ℃ for 1 h. Flavonoid aglycones were extracted by shaking in an equal volume of ethyl acetate, and the ethyl acetate fraction was evaporated in a speed-vac centrifuge. The pellets were redissolved in an equal volume of 100% HPLC-grade acetone. Flavonoids were separated on an Agilent 6470 Triple Quadrupole LC/MS (QQQ LC/MS) system (Agilent Technologies, Santa Clara, CA, USA) equipped with an ions trap (IT) mass spectrometer. Solvent A was Milli-Q purified water, and solvent B was 100% methanol: 0–1 min 30% B, 1–6 min 90% B, 6–13 min 90% B, 13–20 min 50% B, 20–23 min 20% B, 23–25 min 20% B. The flow rate was 0.5ml/min. For determination of the relative abundance of the compounds, peak areas were integrated using the software implemented in the QQQ LC/MS system. To identify the separated peaks, a number of standard flavonoids and precursors, dissolved at 1, 0.5, 0.25, 0.125 and 0.0625 ppm, were separated under the same conditions, including naringenin, apigenin, quercitrin, liquiritigenin, isoliquiritigenin, dihydromyricetin, dihydroquercitrin, kaempferol and myricetin. HPLC analysis of flavonoid extracts was performed three times using different batches of transformed plants. All batches yielded similar results.

4.7. GA Measurements

The fresh leaves of 1-month-old soil-grown ga3ox1 and R108 plants were collected and frozen in liquid nitrogen immediately. GAs was purified and quantified according to previous publication [93] by liquid chromatography-electrospray ionization tandem mass spectroscopy (LC-ESI-MS/MS) using an Xciex QTRAP 5500 rapid resolution LC-MS/MS system equipped with Turbo V source ESI probe (AB Xciex LLC, Ontario, Canada) fitted with an HSS T3 column (1.8 μm, 100 × 2.1 mm). The inlet method was set as follows: Solvent A (0.1% formic-aqueous solution), solvent B (0.1% formic-acetonitrile). Gradient: 0–17 min, 3% B to 65% B; 17–18.5 min, 65% B to 90% B; 18.5–19.5 min, 90% B; 19.5–21 min, 90% B to 3% B; 21–22.5 min, 3% B. GAs were detected in negative multiple reaction monitoring (MRM) mode. The source parameters were set as: IS voltage −4500 V, TEM 550°C, GS1 50, GS2 50 and curtain gas 40. Using the default parameters, the ion fragments were automatically identified and integrated in the Analyst Software (AB Sciex LLC). Taking the mass spectral peak area of the analyte as the vertical coordinate and the concentration of the analyte as the horizontal coordinate, the linear regression standard curve was drawn to calculate the sample concentration, and the mass spectral peak area of the sample analyte was substituted into the linear equation to calculate the concentration. To identify the separated peaks, a number of GAs, dissolved at 1, 5, 10, 20, 40, 60, 80, 120, 160, 200 ng/mL, were separated under the same conditions, including GA1 (CAS: 545-97-1, OlChemIm, Olomouc, Czech Republic), GA3 (CAS: 77-06-5, OlChemIm, Olomouc, Czech Republic), GA4 (CAS: 468-44-0, OlChemIm, Olomouc, Czech Republic), GA7 (CAS: 510-75-8, OlChemIm, Olomouc, Czech Republic). HPLC analysis of GA extract was performed three times using different batches. All batches yielded similar results.

4.8. Cell Area Measurement by Scanning Electron Microscopy (SEM)

The petioles and mature leaves of 1-month-old hydroponic-grown ga3ox1 and R108 plants were harvested and fixed with a 3% glutaraldehyde solution (v/v in 1 × PBS) and 1% OsO4 (v/v in H2O) and dehydrated with a graded ethanol series (30, 50, 60, 70, 80, 90, 95 and 100%). Before SEM observations, tissues were critical-point dried in liquid CO2, mounted on aluminum stubs, dissected and sputter-coated with gold. Specimens were then examined using a ZEISS DSM-960A scanning electron microscope (Carl Zeiss, Microscopy GmbH, Oberkochen, Germany) at an accelerating voltage of 5 kV. Digital images were collected and assembled using Adobe Photoshop (Adobe Inc., San Jose, CA, USA).

4.9. qRT–PCR Analysis

Total RNA was extracted from 4-week-old M. truncatula leaves under hydroponic conditions using the EastepTM Super Total RNA Extraction Kit (Cat# Z3101; Promega Corporation, Madison, WI, USA) according to the manufacturer’s protocol. Full-length cDNA was then reverse transcribed using the cDNA synthesis kit PrimeScript RT Reagent Kit with gDNA Eraser (Cat# RR047A, TaKaRa, Tokyo, Japan). The qRT-PCR analysis was performed using a one-step qRT-PCR kit (Cat# RR420A; TaKaRa) according to the manufacturer’s instructions, using three independent RNA preparations as biological replicates. Actin gene transcript was used as a reference. The relative quantification (2−△△CT) of gene expression was evaluated using the comparative cycle threshold method [94]. The relevant primer sequences are given in Supplementary Materials Tables S6–S8.

4.10. Exogenous GA Treatment

After germination of wild-type R108 and ga3ox1 mutant seeds, 7-day-old seedlings were selected and transplanted to 1/2 Hoagland nutrient solutions containing GA at the final concentrations of 10 μM (GA1, GA3, GA4 or GA7), and 100 μM prohexadione calcium, which were replaced once a week, respectively. Samples were collected from different organs of 4-week-old M. truncatula plants and frozen in liquid nitrogen immediately.

4.11. Determination of the Content of Chlorophyll, Proanthocyanidin and Flavonoids

The mature leaves of 1-month-old hydroponic-grown ga3ox1 and R108 plants were obtained, and the chlorophyll content was determined according to a previously published study [95]. The content of proanthocyanidin and flavonoids were determined with a Proanthocyanidin Kit (Cat# BC1350; Solarbio Life Sciences, Beijing, China) and a Flavonoids Kit (Cat# BC1330; Solarbio Life Sciences, Beijing, China) following the manufacturer’s instructions.

4.12. Determination of Nitrate Reductase and Glutamine Synthase Activities

Glutamine synthase and nitrate reductase activities were determined in vitro using a Glutamine Synthase Kit (Cat# BC0910; Solarbio Life Sciences, Beijing, China) and the Nitrate Reductase Kit (Cat# BC0080 Solarbio Life Sciences, Beijing, China) following the manufacturer’s instructions.

4.13. Inoculation of Symbiotic Bacteria

For nodulation experiments in perlite, 2-day-old seedlings were transferred to perlite and grown for 5 days in nitrogen-poor medium before inoculation. The nodule number was counted at 14 dpi. At 14 days post-inoculation (dpi), nodule numbers were counted and main root lengths were measured with ImageJ software. Nodules appeared on both the main root and on some lateral roots; all nodules were taken into account for the analysis.

5. Conclusions

In summary, GAs, positive regulators of nitrogen metabolism, as well as negative regulators of flavonoid biosynthesis, play an essential role in balancing the relationship between flavonoid biosynthesis and nitrogen metabolism. DELLA proteins accumulation (due to GA deficiency) inhibited the expression of genes involved in nitrogen metabolism and stimulated the expression of genes involved in flavonoid biosynthesis.

Supplementary Materials

The following are available online at https://www.mdpi.com/article/10.3390/ijms22179291/s1.

Author Contributions

Data curation, H.S., H.C. and M.L.; Formal analysis, H.S., J.Z. and F.Y.; Funding acquisition, Q.Y., H.S. and R.L.; Investigation, J.K.; Methodology, Z.W.; Project administration, R.L.; Software, H.S.; Supervision, R.L.; Writing—original draft, H.S.; Writing—review and editing, H.S., Q.Y. and R.L. All authors have read and agreed to the published version of the manuscript.

Funding

This work was supported by the earmarked fund for the China Agriculture Research System (CARS-34), the National Key Basic Research Program of China (973 Program) (2015CB943500), the National Science Foundation of China (No. 32001393) and the Agricultural Science and Technology Innovation Program (ASTIP-IAS14). The funding body played no role in the design of the study, the collection, analysis and interpretation of the data or the writing of the manuscript.

Institutional Review Board Statement

Not applicable.

Informed Consent Statement

Not applicable.

Data Availability Statement

The mass spectrometry proteomics data have been deposited to the ProteomeXchange Consortium (http://proteomecentral.proteomexchange.org, 31 May 2021) via the iProX partner repository with the dataset identifier PXD026363 [96].

Acknowledgments

We thank Wenshan Guo for his technical help during greenhouse experiments. The authors would also like to thank Wenwen Liu for the data collection. This work was supported by the China Forage and Grass Research System (CARS-34), the National Key Basic Research Program of China (973 Program) (2015CB943500), the Agricultural Science and Technology Innovation Program (ASTIP-IAS14) and National Science Foundation of China (No. 32001393).

Conflicts of Interest

The authors declare no conflict of interest.

Abbreviations

GA: gibberellin acid; 2ODD: 2-oxoglutarate-dependent dioxygenase; ABA: abscisic acid; IAA: indole-3-acetic acid; SA: salicylic acid; ProCa: prohexadione calcium; PAL: phenylalanine ammonialyase; CHS: chalcone and stilbene synthase family protein; CHI: chalcone-flavanone isomerase family protein; ANR: anthocyanidin reductase; F3′H: flavonol synthase/flavanone 3-hydroxylase; LDOX: leucoanthocyanidin dioxygenase-like protein; DFR: dihydroflavonol 4-reductase-like protein; FLS: cytochrome P450 family flavone synthase; IOMT: Isoflavone-7-O-methyltransferase; AACT: anthocyanin 5-aromatic acyltransferase; PAP1: production of anthocyanin pigment 1; PAP2: production of anthocyanin pigment 2; GS: glutamine synthase; NR: nitrate reductase; GLN: Glutamyl-tRNA (Gln) amidotransferase; AAT: amino acid transporter; NRT: nitrate transporter; AMT: ammonium transporter; FNR: ferredoxin-nitrite reductase; PKL: CHD3-type chromatin-remodeling factor pickle protein; NCR: Nodule Cysteine-Rich (NCR) secreted peptide; Dof: DNA-binding with one finger; DEPs: differentially enriched proteins; KEGG: Kyoto Encyclopedia of Genes and Genomes.

References

  1. Wolters, H.; Jürgens, G. Survival of the flexible: Hormonal growth control and adaptation in plant development. Nat. Rev. Genet. 2009, 10, 305–317. [Google Scholar] [CrossRef]
  2. Wilson, R.N.; Heckman, J.W.; Somerville, C.R. Gibberellin Is Required for Flowering in Arabidopsis thaliana under Short Days. Plant Physiol. 1992, 100, 403–408. [Google Scholar] [CrossRef] [Green Version]
  3. Yamaguchi, S. Gibberellin Metabolism and its Regulation. Annu. Rev. Plant Biol. 2008, 59, 225–251. [Google Scholar] [CrossRef] [PubMed]
  4. Hedden, P. Gibberellin Metabolism and Its Regulation. J. Plant Growth Regul. 2001, 20, 317–318. [Google Scholar] [CrossRef]
  5. Hedden, P. The Current Status of Research on Gibberellin Biosynthesis. Plant Cell Physiol. 2020, 61, 1832–1849. [Google Scholar] [CrossRef]
  6. Duncan, J.D.; West, C.A. Properties of Kaurene Synthetase from Marah macrocarpus Endosperm: Evidence for the Participation of Separate but Interacting Enzymes. Plant Physiol. 1981, 68, 1128–1134. [Google Scholar] [CrossRef] [PubMed] [Green Version]
  7. Kawaide, H.; Imai, R.; Sassa, T.; Kamiya, Y. ent-Kaurene Synthase from the FungusPhaeosphaeria sp. L487 cDNA isolation, characterization, and bacterial expression of a bifunctional diterpene cyclase in fungal gibberellin biosynthesis. J. Biol. Chem. 1997, 272, 21706–21712. [Google Scholar] [CrossRef] [Green Version]
  8. Chen, Y.; Hou, M.; Liu, L.; Wu, S.; Shen, Y.; Ishiyama, K.; Kobayashi, M.; McCarty, D.R.; Tan, B.-C. The Maize DWARF1 Encodes a Gibberellin 3-Oxidase and Is Dual Localized to the Nucleus and Cytosol. Plant Physiol. 2014, 166, 2028–2039. [Google Scholar] [CrossRef] [PubMed] [Green Version]
  9. Ueguchi-Tanaka, M.; Nakajima, M.; Katoh, E.; Ohmiya, H.; Asano, K.; Saji, S.; Hongyu, X.; Ashikari, M.; Kitano, H.; Yamaguchi, I.; et al. Molecular Interactions of a Soluble Gibberellin Receptor, GID1, with a Rice DELLA Protein, SLR1, and Gibberellin. Plant Cell 2007, 19, 2140–2155. [Google Scholar] [CrossRef] [Green Version]
  10. Varbanova, M.; Yamaguchi, S.; Yang, Y.; McKelvey, K.; Hanada, A.; Borochov, R.; Yu, F.; Jikumaru, Y.; Ross, J.; Cortes, D.; et al. Methylation of Gibberellins by Arabidopsis GAMT1 and GAMT. Plant Cell 2007, 19, 32–45. [Google Scholar] [CrossRef] [PubMed] [Green Version]
  11. Thomas, S.G.; Phillips, A.L.; Hedden, P. Molecular cloning and functional expression of gibberellin 2- oxidases, multifunctional enzymes involved in gibberellin deactivation. Proc. Natl. Acad. Sci. USA 1999, 96, 4698–4703. [Google Scholar] [CrossRef] [PubMed] [Green Version]
  12. Zhu, Y.; Nomura, T.; Xu, Y.; Zhang, Y.; Peng, Y.; Mao, B.; Hanada, A.; Zhou, H.; Wang, R.; Li, P.; et al. ELONGATED UPPERMOST INTERNODE Encodes a Cytochrome P450 Monooxygenase That Epoxidizes Gibberellins in a Novel Deactivation Reaction in Rice. Plant Cell 2006, 18, 442–456. [Google Scholar] [CrossRef] [Green Version]
  13. Lester, D.R.; Ross, J.J.; Smith, J.J.; Elliott, R.C.; Reid, J.B. Gibberellin 2-oxidation and the SLN gene of Pisum sativum. Plant J. 1999, 19, 65–73. [Google Scholar] [CrossRef] [Green Version]
  14. Zhang, Y.; Zhang, B.; Yan, D.; Dong, W.; Yang, W.; Li, Q.; Zeng, L.; Wang, J.; Wang, L.; Hicks, L.; et al. Two Arabidopsis cytochrome P450 monooxygenases, CYP714A1 and CYP714A2, function redundantly in plant development through gibberellin deactivation. Plant J. 2011, 67, 342–353. [Google Scholar] [CrossRef] [PubMed]
  15. Rieu, I.; Ruíz-Rivero, O.; Garcia, N.F.; Griffiths, J.; Powers, S.J.; Gong, F.; Linhartova, T.; Eriksson, S.; Nilsson, O.; Thomas, S.G.; et al. The gibberellin biosynthetic genes AtGA20ox1 and AtGA20ox2 act, partially redundantly, to promote growth and development throughout the Arabidopsis life cycle. Plant J. 2007, 53, 488–504. [Google Scholar] [CrossRef]
  16. Magome, H.; Nomura, T.; Hanada, A.; Takeda-Kamiya, N.; Ohnishi, T.; Shinma, Y.; Katsumata, T.; Kawaide, H.; Kamiya, Y.; Yamaguchi, S. CYP714B1 and CYP714B2 encode gibberellin 13-oxidases that reduce gibberellin activity in rice. Proc. Natl. Acad. Sci. USA 2013, 110, 1947–1952. [Google Scholar] [CrossRef] [Green Version]
  17. He, J.; Chen, Q.; Xin, P.; Yuan, J.; Ma, Y.; Wang, X.; Xu, M.; Chu, J.; Peters, R.J.; Wang, G. CYP72A enzymes catalyse 13-hydrolyzation of gibberellins. Nat. Plants 2019, 5, 1057–1065. [Google Scholar] [CrossRef] [PubMed] [Green Version]
  18. Regnault, T.; Davière, J.-M.; Wild, M.; Sakvarelidze-Achard, L.; Heintz, D.; Bergua, E.C.; Diaz, I.L.; Gong, F.; Hedden, P.; Achard, P. The gibberellin precursor GA12 acts as a long-distance growth signal in Arabidopsis. Nat. Plants 2015, 1, 15073. [Google Scholar] [CrossRef]
  19. Chiang, H.H.; Hwang, I.; Goodman, H.M. Isolation of the Arabidopsis GA4 locus. Plant Cell 1995, 7, 195–201. [Google Scholar] [CrossRef] [Green Version]
  20. Dalmadi, A.; Kaló, P.; Jakab, J.; Saskői, A.; Petrovics, T.; Deák, G.; Kiss, G.B. Dwarf plants of diploid Medicago sativa carry a mutation in the gibberellin 3-β-hydroxylase gene. Plant Cell Rep. 2008, 27, 1271–1279. [Google Scholar] [CrossRef]
  21. Israelsson, M.; Mellerowicz, E.; Chono, M.; Gullberg, J.; Moritz, T. Cloning and Overproduction of Gibberellin 3-Oxidase in Hybrid Aspen Trees. Effects on Gibberellin Homeostasis and Development. Plant Physiol. 2004, 135, 221–230. [Google Scholar] [CrossRef] [PubMed] [Green Version]
  22. Wen, L.; Kong, Y.; Wang, H.; Xu, Y.; Lu, Z.; Zhang, J.; Wang, M.; Wang, X.; Han, L.; Zhou, C. Interaction between the MtDELLA–MtGAF1 Complex and MtARF3 Mediates Transcriptional Control of MtGA3ox1 to Elaborate Leaf Margin Formation in Medicago truncatula. Plant Cell Physiol. 2021, 62, 321–333. [Google Scholar] [CrossRef]
  23. Lange, T.; Kappler, J.; Fischer, A.; Frisse, A.; Padeffke, T.; Schmidtke, S.; Lange, M.J.P. Gibberellin Biosynthesis in Developing Pumpkin Seedlings. Plant Physiol. 2005, 139, 213–223. [Google Scholar] [CrossRef] [PubMed] [Green Version]
  24. Itoh, H.; Ueguchi-Tanaka, M.; Sentoku, N.; Kitano, H.; Matsuoka, M.; Kobayashi, M. Cloning and functional analysis of two gibberellin 3-hydroxylase genes that are differently expressed during the growth of rice. Proc. Natl. Acad. Sci. USA 2001, 98, 8909–8914. [Google Scholar] [CrossRef] [Green Version]
  25. Itoh, H.; Tanaka-Ueguchi, M.; Kawaide, H.; Chen, X.; Kamiya, Y.; Matsuoka, M. The gene encoding tobacco gibberellin 3beta-hydroxylase is expressed at the site of GA action during stem elongation and flower organ development. Plant J. 1999, 20, 15–24. [Google Scholar] [CrossRef] [Green Version]
  26. Appleford, N.E.; Evans, D.J.; Lenton, J.R.; Gaskin, P.; Croker, S.J.; Devos, K.M.; Phillips, A.L.; Hedden, P. Function and transcript analysis of gibberellin-biosynthetic enzymes in wheat. Planta 2005, 223, 568–582. [Google Scholar] [CrossRef]
  27. Aravind, L.; Koonin, E.V. The DNA-repair protein AlkB, EGL-9, and leprecan define new families of 2-oxoglutarate- and iron-dependent dioxygenases. Genome Biol. 2001, 2, 1–8. [Google Scholar] [CrossRef]
  28. Ferguson, B.; Ross, J.J.; Reid, J.B. Nodulation Phenotypes of Gibberellin and Brassinosteroid Mutants of Pea. Plant Physiol. 2005, 138, 2396–2405. [Google Scholar] [CrossRef] [Green Version]
  29. Ferguson, B.; Foo, E.; Ross, J.J.; Reid, J.B. Relationship between gibberellin, ethylene and nodulation in Pisum sativum. New Phytol. 2010, 189, 829–842. [Google Scholar] [CrossRef]
  30. Liu, C.-W.; Murray, J.D. The Role of Flavonoids in Nodulation Host-Range Specificity: An Update. Plants 2016, 5, 33. [Google Scholar] [CrossRef] [Green Version]
  31. McAdam, E.L.; Reid, J.B.; Foo, E. Gibberellins promote nodule organogenesis but inhibit the infection stages of nodulation. J. Exp. Bot. 2018, 69, 2117–2130. [Google Scholar] [CrossRef] [PubMed]
  32. Serova, T.A.; Tsyganova, A.V.; Tikhonovich, I.A.; Tsyganov, V.E. Gibberellins Inhibit Nodule Senescence and Stimulate Nodule Meristem Bifurcation in Pea (Pisum sativum L.). Front. Plant Sci. 2019, 10, 285. [Google Scholar] [CrossRef] [Green Version]
  33. Kim, G.-B.; Son, S.-U.; Yu, H.-J.; Mun, J.-H. MtGA2ox10 encoding C20-GA2-oxidase regulates rhizobial infection and nodule development in Medicago truncatula. Sci. Rep. 2019, 9, 5952. [Google Scholar] [CrossRef] [PubMed]
  34. McGuiness, P.N.; Reid, J.B.; Foo, E. The influence of ethylene, gibberellins and brassinosteroids on energy and nitrogen-fixation metabolites in nodule tissue. Plant Sci. 2021, 305, 110846. [Google Scholar] [CrossRef] [PubMed]
  35. Akpunarlieva, S.; Weidt, S.; Lamasudin, D.; Naula, C.; Henderson, D.; Barrett, M.; Burgess, K.; Burchmore, R. Integration of proteomics and metabolomics to elucidate metabolic adaptation in Leishmania. J. Proteom. 2017, 155, 85–98. [Google Scholar] [CrossRef]
  36. Schroeder, A.B.; Dobson, E.T.A.; Rueden, C.T.; Tomancak, P.; Jug, F.; Eliceiri, K.W. The ImageJ ecosystem: Open-source software for image visualization, processing, and analysis. Protein Sci. 2020, 30, 234–249. [Google Scholar] [CrossRef]
  37. Kamiya, Y.; Kobayashi, M.; Fujioka, S.; Yamane, H.; Nakayama, I.; Sakurai, A. Effects of a Plant Growth Regulator, Prohexadione Calcium (BX-112), on the Elongation of Rice Shoots Caused by Exogenously Applied Gibberellins and Helminthosporol, Part II. Plant Cell Physiol. 1991, 32, 1205–1210. [Google Scholar] [CrossRef]
  38. Tabuchi, M.; Abiko, T.; Yamaya, T. Assimilation of ammonium ions and reutilization of nitrogen in rice (Oryza sativa L.). J. Exp. Bot. 2007, 58, 2319–2327. [Google Scholar] [CrossRef] [Green Version]
  39. Subramanian, S.; Stacey, G.; Yu, O. Distinct, crucial roles of flavonoids during legume nodulation. Trends Plant Sci. 2007, 12, 282–285. [Google Scholar] [CrossRef] [Green Version]
  40. Ng, J.L.P.; Hassan, S.; Truong, T.T.; Hocart, C.H.; Laffont, C.; Frugier, F.; Mathesius, U. Flavonoids and Auxin Transport Inhibitors Rescue Symbiotic Nodulation in the Medicago truncatula Cytokinin Perception Mutant cre. Plant Cell 2015, 27, 2210–2226. [Google Scholar] [CrossRef] [Green Version]
  41. Gifford, I.; Battenberg, K.; Vaniya, A.; Wilson, A.; Tian, L.; Fiehn, O.; Berry, A.M. Distinctive Patterns of Flavonoid Biosynthesis in Roots and Nodules of Datisca glomerata and Medicago spp. Revealed by Metabolomic and Gene Expression Profiles. Front. Plant Sci. 2018, 9. [Google Scholar] [CrossRef] [PubMed]
  42. Buer, C.S.; Imin, N.; Djordjevic, M. Flavonoids: New Roles for Old Molecules. J. Integr. Plant Biol. 2010, 52, 98–111. [Google Scholar] [CrossRef] [PubMed]
  43. Cominelli, E.; Gusmaroli, G.; Allegra, D.; Galbiati, M.; Wade, H.K.; Jenkins, G.I.; Tonelli, C. Expression analysis of anthocyanin regulatory genes in response to different light qualities in Arabidopsis thaliana. J. Plant Physiol. 2008, 165, 886–894. [Google Scholar] [CrossRef]
  44. Lea, U.S.; Slimestad, R.; Smedvig, P.; Lillo, C. Nitrogen deficiency enhances expression of specific MYB and bHLH transcription factors and accumulation of end products in the flavonoid pathway. Planta 2006, 225, 1245–1253. [Google Scholar] [CrossRef] [PubMed]
  45. Loreti, E.; Povero, G.; Novi, G.; Solfanelli, C.; Alpi, A.; Perata, P. Gibberellins, jasmonate and abscisic acid modulate the sucrose-induced expression of anthocyanin biosynthetic genes in Arabidopsis. New Phytol. 2008, 179, 1004–1016. [Google Scholar] [CrossRef]
  46. Jeong, S.-W.; Das, P.K.; Jeoung, S.C.; Song, J.-Y.; Lee, H.K.; Kim, Y.-K.; Kim, W.J.; Park, Y.I.; Yoo, S.-D.; Choi, S.-B.; et al. Ethylene Suppression of Sugar-Induced Anthocyanin Pigmentation in Arabidopsis. Plant Physiol. 2010, 154, 1514–1531. [Google Scholar] [CrossRef] [PubMed] [Green Version]
  47. Qi, T.; Song, S.; Ren, Q.; Wu, D.; Huang, H.; Chen, Y.; Fan, M.; Peng, W.; Ren, C.; Xie, D. The Jasmonate-ZIM-Domain Proteins Interact with the WD-Repeat/bHLH/MYB Complexes to Regulate Jasmonate-Mediated Anthocyanin Accumulation and Trichome Initiation in Arabidopsis thaliana. Plant Cell 2011, 23, 1795–1814. [Google Scholar] [CrossRef] [Green Version]
  48. Zhang, Y.; Liu, Z.; Liu, R.; Hao, H.; Bi, Y. Gibberellins negatively regulate low temperature-induced anthocyanin accumulation in a HY5/HYH-dependent manner. Plant Signal. Behav. 2011, 6, 632–634. [Google Scholar] [CrossRef] [PubMed] [Green Version]
  49. Das, P.K.; Shin, D.H.; Choi, S.-B.; Park, Y.-I. Sugar-hormone cross-talk in anthocyanin biosynthesis. Mol. Cells 2012, 34, 501–507. [Google Scholar] [CrossRef] [Green Version]
  50. Das, P.K.; Shin, D.H.; Choi, S.-B.; Yoo, S.-D.; Choi, G.; Park, Y.-I. Cytokinins enhance sugar-induced anthocyanin biosynthesis in Arabidopsis. Mol. Cells 2012, 34, 93–101. [Google Scholar] [CrossRef] [PubMed] [Green Version]
  51. Li, Y.; Ende, W.V.D.; Rolland, F. Sucrose Induction of Anthocyanin Biosynthesis Is Mediated by DELLA. Mol. Plant 2014, 7, 570–572. [Google Scholar] [CrossRef] [PubMed] [Green Version]
  52. Jiang, C.; Gao, X.; Liao, L.; Harberd, N.P.; Fu, X. Phosphate Starvation Root Architecture and Anthocyanin Accumulation Responses Are Modulated by the Gibberellin-DELLA Signaling Pathway in Arabidopsis. Plant Physiol. 2007, 145, 1460–1470. [Google Scholar] [CrossRef] [PubMed] [Green Version]
  53. Zhang, Y.; Liu, Z.; Liu, J.; Lin, S.; Wang, J.; Lin, W.; Xu, W. GA-DELLA pathway is involved in regulation of nitrogen deficiency-induced anthocyanin accumulation. Plant Cell Rep. 2017, 36, 557–569. [Google Scholar] [CrossRef] [PubMed]
  54. Li, P.; Chen, B.; Zhang, G.; Chen, L.; Dong, Q.; Wen, J.; Mysore, K.; Zhao, J. Regulation of anthocyanin and proanthocyanidin biosynthesis by M edicago truncatula b HLH transcription factor M t TT New Phytol. 210. [CrossRef]
  55. Palmer, R.G.; Pfeiffer, T.W.; Buss, G.R.; Kilen, T.C. Qualitative genetics. In Soybeans: Improvement, Production, and Uses, 3rd ed.; Boerma, H.R., Specht, J.E., Eds.; American Society of Agronomy, Inc.: Madison, WI, USA, 2004; pp. 137–214. [Google Scholar]
  56. Clough, S.J.; Tuteja, J.H.; Li, M.; Marek, L.F.; Shoemaker, R.C.; Vodkin, L.O. Features of a 103-kb gene-rich region in soybean include an inverted perfect repeat cluster ofCHSgenes comprising theIlocus. Genome 2004, 47, 819–831. [Google Scholar] [CrossRef] [PubMed] [Green Version]
  57. Tuteja, J.H.; Clough, S.J.; Chan, W.-C.; Vodkin, L.O. Tissue-Specific Gene Silencing Mediated by a Naturally Occurring Chalcone Synthase Gene Cluster in Glycine max. Plant Cell 2004, 16, 819–835. [Google Scholar] [CrossRef] [PubMed] [Green Version]
  58. Zabala, G.; Vodkin, L.O. Cloning of the pleiotropic T locus in soybean and two recessive alleles that differentially affect structure and expression of the encoded flavonoid 3′ hydroxylase. Genetics 2003, 163, 295–309. [Google Scholar] [CrossRef]
  59. Scheible, W.-R.; Morcuende, R.; Czechowski, T.; Fritz, C.; Osuna, D.; Palacios-Rojas, N.; Schindelasch, D.; Thimm, O.; Udvardi, M.; Stitt, M. Genome-Wide Reprogramming of Primary and Secondary Metabolism, Protein Synthesis, Cellular Growth Processes, and the Regulatory Infrastructure of Arabidopsis in Response to Nitrogen. Plant Physiol. 2004, 136, 2483–2499. [Google Scholar] [CrossRef] [Green Version]
  60. Liu, K.-H.; Niu, Y.; Konishi, M.; Wu, Y.; Du, H.; Chung, H.S.; Li, L.; Boudsocq, M.; McCormack, M.; Maekawa, S.; et al. Discovery of nitrate–CPK–NLP signalling in central nutrient–growth networks. Nature 2017, 545, 311–316. [Google Scholar] [CrossRef] [Green Version]
  61. Gifford, M.L.; Dean, A.; Gutierrez, R.A.; Coruzzi, G.M.; Birnbaum, K.D. Cell-specific nitrogen responses mediate developmental plasticity. Proc. Natl. Acad. Sci. USA 2008, 105, 803–808. [Google Scholar] [CrossRef] [Green Version]
  62. Gaudinier, A.; Zhang, L.; Reece-Hoyes, J.S.; Taylor-Teeples, M.; Pu, L.; Liu, Z.; Breton, G.; Pruneda-Paz, J.L.; Kim, D.; Kay, S.A.; et al. Enhanced Y1H assays for Arabidopsis. Nat. Chem. Biol. 2011, 8, 1053–1055. [Google Scholar] [CrossRef] [PubMed] [Green Version]
  63. Reece-Hoyes, J.S.; Diallo, A.; Lajoie, B.; Kent, A.; Shrestha, S.; Kadreppa, S.; Pesyna, C.; Dekker, J.; Myers, C.L.; Walhout, A.J.M. Enhanced yeast one-hybrid assays for high-throughput gene-centered regulatory network mapping. Nat. Methods 2011, 8, 1059–1064. [Google Scholar] [CrossRef] [Green Version]
  64. Guan, P.; Wang, R.; Nacry, P.; Breton, G.; Kay, S.A.; Pruneda-Paz, J.L.; Davani, A.; Crawford, N.M. Nitrate foraging by Arabidopsis roots is mediated by the transcription factor TCP20 through the systemic signaling pathway. Proc. Natl. Acad. Sci. USA 2014, 111, 15267–15272. [Google Scholar] [CrossRef] [PubMed] [Green Version]
  65. Vidal, E.A.; Álvarez, J.M.; Gutiérrez, R.A. Nitrate regulation ofAFB3andNAC4gene expression in Arabidopsisroots depends on NRT1.1 nitrate transport function. Plant Signal. Behav. 2014, 9, e28501. [Google Scholar] [CrossRef] [Green Version]
  66. Medici, A.; Marshall-Colon, A.; Ronzier, E.; Szponarski, W.; Wang, R.; Gojon, A.; Crawford, N.M.; Ruffel, S.; Coruzzi, G.M.; Krouk, G. AtNIGT1/HRS1 integrates nitrate and phosphate signals at the Arabidopsis root tip. Nat. Commun. 2015, 6, 1–11. [Google Scholar] [CrossRef] [PubMed] [Green Version]
  67. Krouk, G.; Ruffel, S.; Gutiérrez, R.A.; Gojon, A.; Crawford, N.M.; Coruzzi, G.M.; Lacombe, B. A framework integrating plant growth with hormones and nutrients. Trends Plant Sci. 2011, 16, 178–182. [Google Scholar] [CrossRef] [PubMed]
  68. Gaudinier, A.; Rodriguez-Medina, J.; Zhang, L.; Olson, A.; Liseron-Monfils, C.; Bågman, A.-M.; Foret, J.; Abbitt, S.; Tang, M.; Li, B.; et al. Transcriptional regulation of nitrogen-associated metabolism and growth. Nature 2018, 563, 259–264. [Google Scholar] [CrossRef] [PubMed]
  69. Wang, Y.; Yao, Q.; Zhang, Y.; Zhang, Y.; Xing, J.; Yang, B.; Mi, G.; Li, Z.; Zhang, M. The Role of Gibberellins in Regulation of Nitrogen Uptake and Physiological Traits in Maize Responding to Nitrogen Availability. Int. J. Mol. Sci. 2020, 21, 1824. [Google Scholar] [CrossRef] [Green Version]
  70. Hawkesford, M.J. Reducing the reliance on nitrogen fertilizer for wheat production. J. Cereal Sci. 2013, 59, 276–283. [Google Scholar] [CrossRef] [Green Version]
  71. Li, J.; Yang, Y.; Chai, M.; Ren, M.; Yuan, J.; Yang, W.; Dong, Y.; Liu, B.; Jian, Q.; Wang, S.; et al. Gibberellins modulate local auxin biosynthesis and polar auxin transport by negatively affecting flavonoid biosynthesis in the root tips of rice. Plant Sci. 2020, 298, 110545. [Google Scholar] [CrossRef]
  72. Li, S.; Tian, Y.; Wu, K.; Ye, Y.; Yu, J.; Zhang, J.; Liu, Q.; Hu, M.; Li, H.; Tong, Y.; et al. Modulating plant growth–metabolism coordination for sustainable agriculture. Nature 2018, 560, 595–600. [Google Scholar] [CrossRef]
  73. Zhang, J.; Subramanian, S.; Stacey, G.; Yu, O. Flavones and flavonols play distinct critical roles during nodulation of Medicago truncatula by Sinorhizobium meliloti. Plant J. 2009, 57, 171–183. [Google Scholar] [CrossRef] [PubMed]
  74. Peck, M.C.; Fisher, R.F.; Long, S.R. Diverse Flavonoids Stimulate NodD1 Binding to nod Gene Promoters in Sinorhizobium meliloti. J. Bacteriol. 2006, 188, 5417–5427. [Google Scholar] [CrossRef] [PubMed] [Green Version]
  75. Peer, W.A.; Murphy, A.S. Flavonoids and auxin transport: Modulators or regulators? Trends Plant Sci. 2007, 12, 556–563. [Google Scholar] [CrossRef]
  76. Kohlen, W.; Ng, J.L.P.; Deinum, E.E.; Mathesius, U. Auxin transport, metabolism, and signalling during nodule initiation: Indeterminate and determinate nodules. J. Exp. Bot. 2017, 69, 229–244. [Google Scholar] [CrossRef] [PubMed]
  77. Wasson, A.; Pellerone, F.I.; Mathesius, U. Silencing the Flavonoid Pathway in Medicago truncatula Inhibits Root Nodule Formation and Prevents Auxin Transport Regulation by Rhizobia. Plant Cell 2006, 18, 1617–1629. [Google Scholar] [CrossRef] [Green Version]
  78. Wasson, A.; Ramsay, K.; Jones, M.; Mathesius, U. Differing requirements for flavonoids during the formation of lateral roots, nodules and root knot nematode galls in Medicago truncatula. New Phytol. 2009, 183, 167–179. [Google Scholar] [CrossRef]
  79. Fonouni-Farde, C.; Tan, S.; Baudin, M.; Brault, M.; Wen, J.; Mysore, K.; Niebel, A.; Frugier, F.; Diet, A. DELLA-mediated gibberellin signalling regulates Nod factor signalling and rhizobial infection. Nat. Commun. 2016, 7, 12636. [Google Scholar] [CrossRef]
  80. Henneke, D.R.; Potter, G.D.; Kreider, J.L.; Yeates, B.F. Relationship between condition score, physical measurements, and body fat percentage in mares. Equine Vet. J. 1983, 15, 371–372. [Google Scholar] [CrossRef]
  81. Zhang, D.; Jing, Y.; Jiang, Z.; Lin, R. The Chromatin-Remodeling Factor PICKLE Integrates Brassinosteroid and Gibberellin Signaling during Skotomorphogenic Growth in Arabidopsis. Plant Cell 2014, 26, 2472–2485. [Google Scholar] [CrossRef] [PubMed] [Green Version]
  82. Park, J.; Oh, D.-H.; Dassanayake, M.; Nguyen, K.T.; Ogas, J.; Choi, G.; Sun, T.-P. Gibberellin Signaling Requires Chromatin Remodeler PICKLE to Promote Vegetative Growth and Phase Transitions. Plant Physiol. 2017, 173, 1463–1474. [Google Scholar] [CrossRef] [Green Version]
  83. Guefrachi, I.; Nagymihaly, M.; Pislariu, C.I.; Van De Velde, W.; Ratet, P.; Mars, M.; Udvardi, M.K.; Kondorosi, E.; Mergaert, P.; Alunni, B. Extreme specificity of NCR gene expression in Medicago truncatula. BMC Genom. 2014, 15, 1–16. [Google Scholar] [CrossRef] [Green Version]
  84. Somers, D.A.; Kuo, T.-M.; Kleinhofs, A.; Warner, R.L.; Oaks, A. Synthesis and Degradation of Barley Nitrate Reductase. Plant Physiol. 1983, 72, 949–952. [Google Scholar] [CrossRef] [PubMed] [Green Version]
  85. Wan, H.; Zhang, J.; Song, T.; Tian, J.; Yao, Y. Promotion of flavonoid biosynthesis in leaves and calli of ornamental crabapple (Malus sp.) by high carbon to nitrogen ratios. Front. Plant Plant Sci. 2015, 6, 673. [Google Scholar] [CrossRef] [PubMed] [Green Version]
  86. Matsui, K.; Tanaka, H.; Ohme-Takagi, M. Suppression of the biosynthesis of proanthocyanidin in Arabidopsis by a chimeric PAP1 repressor. Plant Biotechnol. J. 2004, 2, 487–493. [Google Scholar] [CrossRef] [PubMed]
  87. Liu, Y.-G.; Mitsukawa, N.; Oosumi, T.; Whittier, R.F. Efficient isolation and mapping of Arabidopsis thaliana T-DNA insert junctions by thermal asymmetric interlaced PCR. Plant J. 1995, 8, 457–463. [Google Scholar] [CrossRef]
  88. Kersey, P.J.; Allen, J.; Allot, A.; Barba, M.; Boddu, S.; Bolt, B.J.; Carvalho-Silva, D.; Christensen, M.; Davis, P.; Grabmueller, C.; et al. Ensembl Genomes 2018: An integrated omics infrastructure for non-vertebrate species. Nucleic Acids Res. 2017, 46, D802–D808. [Google Scholar] [CrossRef] [PubMed]
  89. Hoagland, D.R. Inorganic Plant Nutrition. J. Chem. Educ. 1972, 27, 50. [Google Scholar] [CrossRef]
  90. Sun, H.; Yu, J.; Zhang, F.; Kang, J.; Li, M.; Wang, Z.; Liu, W.; Zhang, J.; Yang, Q.; Long, R. iTRAQ-based comparative proteomic analysis of differences in the protein profiles of stems and leaves from two alfalfa genotypes. BMC Plant Biol. 2020, 20, 1–14. [Google Scholar] [CrossRef]
  91. Wiśniewski, J.R.; Zougman, A.; Nagaraj, N.; Mann, M. Universal sample preparation method for proteome analysis. Nat. Methods 2009, 6, 359–362. [Google Scholar] [CrossRef] [PubMed]
  92. Abdallah, C.; Sergeant, K.; Guillier, C.; Dumas-Gaudot, E.; Leclercq, C.C.; Renaut, J. Optimization of iTRAQ labelling coupled to OFFGEL fractionation as a proteomic workflow to the analysis of microsomal proteins of Medicago truncatula roots. Proteome Sci. 2012, 10, 37. [Google Scholar] [CrossRef] [PubMed] [Green Version]
  93. Ma, X.; Ma, J.; Zhai, H.; Xin, P.; Chu, J.; Qiao, Y.; Han, L. CHR729 Is a CHD3 Protein That Controls Seedling Development in Rice. PLoS ONE 2015, 10, e0138934. [Google Scholar] [CrossRef] [Green Version]
  94. Livak, K.J.; Schmittgen, T.D. Analysis of Relative Gene Expression Data Using Real-Time Quantitative PCR and the 2−ΔΔCT Method. Methods 2001, 25, 402–408. [Google Scholar] [CrossRef] [PubMed]
  95. Lichtenthaler, H.K.; Wellburn, A.R. Determinations of total carotenoids and chlorophylls a and b of leaf extracts in different solvents. Biochem. Soc. Trans. 1983, 11, 591–592. [Google Scholar] [CrossRef] [Green Version]
  96. Ma, J.; Chen, T.; Wu, S.; Yang, C.; Bai, M.; Shu, K.; Li, K.; Zhang, G.; Jin, Z.; He, F.; et al. iProX: An integrated proteome resource. Nucleic Acids Res. 2019, 47, D1211–D1217. [Google Scholar] [CrossRef] [PubMed] [Green Version]
Figure 1. Screening and identification of ga3ox1 mutants. (A) Phenotypes of ga3ox1 null mutants. The ga3ox1 mutant displays a dwarf phenotype. Bar = 5 cm. (B) Position of Tnt1 insertions in the GA3ox1 gene in the mutant lines ga3ox1-1 (NF18131), ga3ox1-2 (NF13294) and ga3ox1-3 (NF12434). Gray boxes indicate the 5′UTR and 3′UTR. Dark boxes indicate exons, and the line indicates the intron. (C) Determination of the content of bioactive GAs content based on HPLC-MS analysis. Three biological replicates were analyzed. Error bars indicate SD. * p < 0.05 by Duncan test. NA: not available.
Ijms 22 09291 g001
Figure 2. Phenotype identification and analysis of the ga3ox1 mutant. (A) Phenotype of ga3ox1 mutant leaves, petioles. Bar = 2 cm. (BE) SEM images of leaves with a magnification of 1000× and petioles with a magnification of 300× of wild-type R108 and ga3ox1 mutants, respectively. (F) Leaf area of wild-type R108 and ga3ox1 mutants were measured with a leaf area meter. Six single leaves were randomly selected to calculate the cell area. (G) Leaf cell area of wild-type R108 and ga3ox1 mutant calculated using the ImageJ software (https://imagej.nih.gov/ij/ accessed on 26 July 2021) [36]. Ten single cells were randomly selected to calculate the leaf area. (H) Petiole length of wild-type R108 and ga3ox1 mutant was measured with a ruler. Six single petioles were randomly selected to calculate the petiole length. (I) Petiole cell length of wild-type R108 and ga3ox1 mutant calculate using the ImageJ software (https://imagej.nih.gov/ij/ accessed on 26 July 2021) [36], respectively. Ten single cells were randomly selected to calculate the petiole cell length. Error bars indicate SD. * p < 0.05, and ** p < 0.01 by Duncan test.
Ijms 22 09291 g002
Figure 3. The dwarfism of ga3ox1 mutants resulted from bioactive GA deficiency. (AC) Phenotype identification of wild-type R108 and ga3ox1 mutants treated with GAs and MtGA3ox1 enzyme inhibitors; note: control group (R108, ga3ox1) and treatment group (R108, ga3ox1) from left to right. (DI) Root length and petiole length of wild-type R108 and ga3ox1 mutants treated with (D,E) 100 μM prohexadione calcium, (F,G) 10 μM GA3, (H,I) 10 μM GA9. Six biological replicates were analyzed, and error bar indicates SD. Bars = 10 cm. * p < 0.05, and ** p < 0.01 by Duncan test.
Ijms 22 09291 g003
Figure 4. Proteomic and metabolomic analysis of wild-type R108 and ga3ox1 mutant leaves. (A) The heatmap of differentially enriched proteins (DEPs) identified by proteomics. (B) The heatmap of differential metabolites identified by metabolomics. (C) Venn diagram of KEGG pathways enriched by differential proteins and metabolites. (D) The histogram of KEGG enrichment of differential proteins/metabolites.
Ijms 22 09291 g004
Figure 5. GAs inhibited the flavonoid and isoflavonoid biosynthetic pathways. (A) Anthocyanin biosynthesis pathway. (B) The heatmap of DEPs involved in flavonoid and isoflavonoid biosynthesis. (C) The heatmap of differential metabolites associated with flavonoid and isoflavonoid. (D) Transcription levels of flavonoid biosynthesis genes in wild-type R108 and ga3ox1 mutant. The heatmap was performed using the OmicShare tools, a free online platform for data analysis (http://www.omicshare.com/tools, 8 May 2020). According to the color scale on the right of Figure, each colorized cell represents the averaged spot quantity, and the color scale indicates the fold change in the mRNA expression level.
Ijms 22 09291 g005
Figure 6. Treatment with exogenous GA3 inhibited flavonoid and isoflavonoid biosynthesis pathways, while treatment with prohexadione calcium promoted these processes. (A) Transcriptional abundance of flavonoid biosynthesis genes after treatment with exogenous GA3 and prohexadione calcium. The heatmap was built using the OmicShare tools, a free online platform for data analysis (http://www.omicshare.com/tools, 9 May 2020). According to the color scale on the right of the Figure, each colorized cell represents the averaged spot quantity, and the color scale indicates fold change of the mRNA expression levels. (B,C) Flavonoid content and proanthocyanin content of wild-type R108 and ga3ox1 mutant leaves were determined by spectrophotometer. Three biological replicates were analyzed, and error bars denote the SD. DW: dry weight. * p < 0.05, and ** p < 0.01 by Duncan test.
Ijms 22 09291 g006
Figure 7. HPLC chromatograms and absorbance spectra of flavonoid extracts from leaves. (A) Chromatograms of leaf extracts from 1-month-old wild-type R108 (black line), ga3ox1 mutant (blue line) and p35S:MtGA3ox1/ga3ox1 (red line), pMtGA3ox1: MtGA3ox1/ga3ox1(green line) leaves. (BG) The absolute content of naringenin, apigenin, isoliquiritigenin, myceritin, quercetin and kaemferol were determined based on the HPLC-MS analysis. Three biological replicates were analyzed, and error bars denote the SD. Different letters above the bars indicate significant difference (p < 0.05 by Duncan test).
Ijms 22 09291 g007
Figure 8. GAs induced the expression of genes related to nitrogen metabolism and positively regulated genes involved in nitrogen transport. (A) The heat map of DEPs involved in nitrogen metabolism and transport. (B) The heat map of transcriptional expression levels of differentially expressed genes related to nitrogen metabolism and transport under control, GA3 treatment and prohexadione calcium treatment. (C,D) Determination of glutamine synthase activity and nitrate reductase activity in 1-month-old wild-type R108 and ga3ox1 mutant leaves under control, GA treatment and prohexadione calcium treatment. The heatmap was built using the OmicShare tools, a free online platform for data analysis (http://www.omicshare.com/tools, 19 May 2020). According to the color scale on the right of the Figure, each colorized cell represents the averaged spot quantity, and the color scale indicates fold change of the mRNA expression levels. * p < 0.05, and ** p < 0.01 by Duncan test.
Ijms 22 09291 g008
Publisher’s Note: MDPI stays neutral with regard to jurisdictional claims in published maps and institutional affiliations.

