Article

Reconstruction of the Diaminopimelic Acid Pathway to Promote L-lysine Production in Corynebacterium glutamicum

1
The Key Laboratory of Industrial Biotechnology, Ministry of Education, School of Biotechnology, Jiangnan University, Wuxi 214122, China
2
National Engineering Laboratory for Cereal Fermentation Technology (NELCF), Jiangnan University, 1800# Lihu Road, Wuxi 214122, China
*
Authors to whom correspondence should be addressed.
Int. J. Mol. Sci. 2021, 22(16), 9065; https://doi.org/10.3390/ijms22169065
Submission received: 28 July 2021 / Revised: 12 August 2021 / Accepted: 15 August 2021 / Published: 23 August 2021
(This article belongs to the Section Biochemistry)

Abstract

:
The dehydrogenase pathway and the succinylase pathway are involved in the synthesis of L-lysine in Corynebacterium glutamicum. Despite the low contribution rate to L-lysine production, the dehydrogenase pathway is favorable for its simple steps and potential to increase the production of L-lysine. The effect of ammonium (NH4+) concentration on L-lysine biosynthesis was investigated, and the results indicated that the biosynthesis of L-lysine can be promoted in a high NH4+ environment. In order to reduce the requirement of NH4+, the nitrogen source regulatory protein AmtR was knocked out, resulting in an 8.5% increase in L-lysine production (i.e., 52.3 ± 4.31 g/L). Subsequently, the dehydrogenase pathway was upregulated by blocking or weakening the tetrahydrodipicolinate succinylase (DapD)-coding gene dapD and overexpressing the ddh gene to further enhance L-lysine biosynthesis. The final strain XQ-5-W4 could produce 189 ± 8.7 g/L L-lysine with the maximum specific rate (qLys,max.) of 0.35 ± 0.05 g/(g·h) in a 5-L jar fermenter. The L-lysine titer and qLys,max achieved in this study is about 25.2% and 59.1% higher than that of the original strain without enhancement of dehydrogenase pathway, respectively. The results indicated that the dehydrogenase pathway could serve as a breakthrough point to reconstruct the diaminopimelic acid (DAP) pathway and promote L-lysine production.

Graphical Abstract

1. Introduction

L-lysine is an essential amino acid widely used in food, animal feed, medicine, cosmetics, and other industries [1]. Methods to produce L-lysine include albuminolysis, chemical method, enzymic method, and microbial fermentation. Microbial fermentation uses renewable feedstock and produces low amounts of pollutants [2]. Therefore, L-lysine is mainly produced by microbial fermentation in the industries, with C. glutamicum and Escherichia coli being the most commonly used strains [1].
The L-lysine biosynthesis includes two pathways, the diaminopimelic acid (DAP) pathway and the α-aminoadipic acid (AAA) pathway. In the AAA pathway, L-lysine is synthesized from α-ketoglutarate and acetylcoenzyme A (acetyl-CoA) in which α-aminoadipic acid serves as an intermediate metabolite. The AAA pathway is commonly found in yeast, fungi, and some species in the domain Archaea [3,4]. In the DAP pathway, however, L-lysine is synthesized from aspartate and pyruvate in which meso-diaminopimelic acid (meso-DAP) serves as an intermediate metabolite (Figure 1) [5]. Commonly found in archaea, algae, fungi, plants, and bacteria [6], the DAP pathway starts with the biosynthesis of L-Δ1-tetrahydrodipicolinate (THDPA) from L-aspartate, which is then converted into meso-DAP, and finally, L-lysine is produced with diaminopimelate deacetylase (DAPDC, EC:4.1.1.20) as the catalyst [7]. The conversion into meso-DAP is the essential step that distinguishes the four DAP pathway variations, the succinylase pathway, acetylase pathway, dehydrogenase pathway, and aminotransferase pathway [8]. The four variants share the common steps of converting L-aspartate to THDPA by aspartokinase (AK, EC:2.7.2.4), aspartic semialdehyde dehydrogenase (AsaDH, EC:1.2.1.11), dihydrodipicolinate synthetase (DHDPS, EC:4.3.3.7), and dihydrodipicolinate reductase (DHDPR, EC:1.17.1.8) in turn. Different enzymes are involved in the four different variant pathways to produce meso-DAP (Figure 1). The succinylase pathway is the most common in most bacteria including E. coli [9]. The acetylase pathway is found only in some Bacillus, and the dehydrogenase pathway only exists in some Gram-positive bacteria (i.e., Corynebacterium and Bacillus) [10] and plants (i.e., Glycine and Zea) [11]. The aminotransferase pathway is found in Cyanobacteria, Chlamydia, Methanothermobacter thermautotrophicus, and Arabidopsis thaliana [12,13,14]. Among the four variants, THDPA is directly converted into meso-DAP in the dehydrogenase pathway. Therefore, the dehydrogenase pathway is more favorable in situations where energy is limited [15]. However, L-lysine accumulation in the dehydrogenase pathway requires high NH4+ concentrations [16] due to the low affinity of diaminopimelate dehydrogenase (DapDH, E.C. 1.4.1.16) for the substrate. Thus, the application of the dehydrogenase pathway is limited [15].
C. glutamicum is a Gram-positive bacterium isolated from soil in 1957 [17,18]. C. glutamicum is often used to produce amino acids commercially, such as L-glutamic acid, L-lysine and L-arginine [19]. Interestingly, two variants of the DAP pathway are found in C. glutamicum, the succinylase pathway, and the dehydrogenase pathway. According to Figure 1, meso-DAP is biosynthesized from THDPA in one step via the dehydrogenase pathway [20] and in four steps via the succinylase pathway, both of which involve NH4+. In addition, the L-lysine biosynthesis efficiency of both pathways depends on the concentration of NH4+ in the medium [16]. L-lysine was produced mainly through the dehydrogenase pathway at first but then entirely through the succinylase pathway [16] as the concentration of NH4+ decreases during the fermentation, resulting in the decrease in the dehydrogenase activity [16,21]. Sonntag et al. reported that 33% of L-lysine was synthesized via the dehydrogenase pathway and 66% via the succinylase pathway in C. glutamicum [22]. Although the succinylase pathway is important for increasing the titer of L-lysine, the dehydrogenase pathway has potential in improving the production intensity of L-lysine as only one step is required to biosynthesize meso-DAP. Hence the question: does upregulating the dehydrogenase pathway promote L-lysine production in C. glutamicum?
In this study, the C. glutamicum XQ-5 strain was developed, which took the dehydrogenase pathway for meso-DAP biosynthesis to promote L-lysine production. The DAP pathway of C. glutamicum XQ-5 was reconstructed to upregulate the dehydrogenase pathway in L-lysine biosynthesis during the fermentation process. The strategies of this study include as follows: (1) investigating the effect of different NH4+ concentrations on L-lysine production; (2) alleviating the nitrogen limitation to improve the efficiency of L-lysine production; (3) rationally regulating the two pathways to promote L-lysine production. As a result, a recombinant strain C. glutamicum XQ-5-W4 (i.e., C. glutamicum XQ-5-dapDWΔamtR/pEC-ddh) derived from C. glutamicum XQ-5 was obtained, which produced 189 ± 8.7 g/L L-lysine with the maximum specific rate (qLys,max.) of 0.35 ± 0.05 g/(g·h) in a 5-L jar fermenter, which were 25.2% and 59.1% higher than that of the original strain C. glutamicum XQ-5, respectively.

2. Results and Discussion

2.1. The Effects of Different Ammonium (NH4+) Concentrations on L-lysine Production

Nitrogen is one of the essential nutrients for living cells. The nitrogen utilization is very important for the growth of bacteria. Ammonium (NH4+) is the standard component of the growth medium and the preferred nitrogen source for many bacteria. Both variants of the DAP pathway in C. glutamicum require the participation of NH4+. Therefore, the effect of NH4+ on L-lysine production was investigated. To do this, eight NH4+ solutions of different concentrations (i.e., 50, 100, 200, 250, 300, 350, 400, 500 mM) were added to the culture mediums and the cell growth, L-lysine production as well as qLys were monitored. The results showed that the growth of strain XQ-5 was significantly inhibited from high NH4+ concentration, but the effect of low NH4+ concentration is relatively insignificant (Figure 2a). Xu et al. observed similar results in which high NH4+ concentration was toxic to the bacteria [23]. Interestingly, too high or too low NH4+ concentration is not conducive to L-lysine accumulation (Figure 2b). The L-lysine yield was relatively high at NH4+ concentrations of 250 mM, 300 mM and 350 mM, which were 42.3 ± 2.31 g/L, 48.2 ± 3.54 g/L, and 43.9 ± 3.78 g/L, respectively. Interestingly, the maximum specific rate (qLys,max.) was found with a 350 mM NH4+ solution (i.e., 0.22 ± 0.03 g/(g·h)), which was 10% higher than that with a 300 mM NH4+ solution (i.e., 0.20 ± 0.01 g/(g·h)) (Figure 2c). These results indicated that an appropriate increase in NH4+ supply is necessary for the effective biosynthesis of L-lysine. Previous research reported that the dehydrogenase pathway is only active at high NH4+ concentration [22]. Therefore, increasing the concentration of NH4+ may upregulate the dehydrogenase pathway and promote L-lysine biosynthesis. The transcription level of the DapDH-coding gene ddh was measured. As might be expected, the transcription level of ddh gene increased with the increase of NH4+ concentration within a certain range (Figure 2d). It is safe to conclude that the increase of qLys,max at high NH4+ concentration was related to the increase in ddh gene transcription level, and upregulating the dehydrogenase pathway is conducive to promoting L-lysine biosynthesis.

2.2. Effect of The Upregulated Dehydrogenase Pathway on L-lysine Biosynthesis

As mentioned above, upregulating ddh gene promotes the biosynthesis of L-lysine. It is speculated that upregulating the dehydrogenase pathway may further increase L-lysine production. In order to enhance the effect of the dehydrogenase pathway on L-lysine production, the ddh gene was overexpressed to investigate whether the qLys and L-lysine production were improved. The ddh gene was ligated into the plasmid pEC-XK99E, which was then introduced into strain XQ-5 to give the target strain XQ-5/pEC-ddh (i.e., strain XQ-5-1) (Figure 3a). The growth rate, L-lysine production and qLys of strain XQ-5-1 were measured at shake flask fermentation for 72 h, and the effect of the upregulated dehydrogenase pathway on L-lysine production was investigated.
According to Figure 3b, the growth of strain XQ-5-1 was not affected, remaining almost the same as the original strain. In addition, the final L-lysine production of strain XQ-5-1 was 49.3 ± 3.21 g/L, slightly increased compared with strain XQ-5 (i.e., 48.2 ± 3.54 g/L) (Figure 3c). The results showed that the upregulated dehydrogenase pathway had little effect on L-lysine production. Similar results were also found in previous reports in which the overexpression of ddh gene on plasmid had no effect on the L-lysine production of C. glutamicum [24]. It is speculated that the intracellular NH4+ concentration limits the increase of L-lysine production in strains with overexpressed ddh. Due to the low affinity to NH4+, the dehydrogenase pathway is only adoptable at high NH4+ concentration [16]. However, it is heartening that XQ-5-1 produced the same amount of L-lysine as the original strain in a shorter time (Figure 3c). With the same NH4+ concentration, the qLys,max of XQ-5-1 was 5–10% higher than that of the original strain (Figure 2c and Figure 3d). Previous research suggested that the level of extracellular NH4+ concentration is higher than the intracellular NH4+ concentration as the utilization of nitrogen is controlled by AmtR [25]. Then, is the increase in intracellular NH4+ concentration beneficial to L-lysine production?

2.3. Effect of Gene amtR Deletion on NH4+ Utilization and L-lysine Synthesis

As mentioned above, L-lysine production showed no significant increase with the overexpression of ddh, possibly due to the low intracellular NH4+ concentration. To address this limitation, the regulatory proteins controlling the utilization of NH4+ should be inactivated. In C. glutamicum, the expression of genes responding to nitrogen utilization is controlled by the TetR-type regulator AmtR [25]. In contrast with most TetR-type regulators, the dissociation of AmtR from its target promoters is triggered by complex formation of the PII-type signal transduction protein GlnK rather than by the binding of a low-molecular mass ligand [26]. The transcriptional regulator AmtR responses to changes in nitrogen levels, thus at least 35 genes involved in nitrogen utilization and metabolism needed to be regulated [27]. In order to increase the concentration of NH4+, the AmtR-coding gene amtR was deleted to give the target strain C. glutamicum XQ-5-ΔamtR (i.e., XQ-5-2) (Figure 4a). Interestingly, the qLys,max of strain XQ-5-2 at 250 mM NH4+ (i.e., 0.19 ± 0.02 g/(g·h)) was similar as the strain XQ-5 at 300 mM NH4+ (i.e., 0.20 ± 0.01 g/(g·h)). Moreover, the qLys,max of strain XQ-5-2 was almost the same at 300 mM (i.e., 0.22 ± 0.03 g/(g·h)) and 350 mM NH4+ (i.e., 0.23 ± 0.04 g/(g·h)) (Figure 4b). In addition, the highest L-lysine production (i.e., 52.3 ± 4.31 g/L) of strain XQ-5-2 was obtained at 300 mM NH4+, which was 8.5% higher than that of strain XQ-5 (i.e., 48.2 ± 3.54 g/L) (Figure 4d). Previous results also indicated that the deletion of the amtR gene increased the yield of L-lysine [28]. These results indicated that the alleviation of nitrogen restriction increased the intracellular NH4+ concentration.
Subsequently, the plasmid pEC-XK99E-ddh was introduced into strain XQ-5-2 to give the target strain XQ-5-2/pEC-ddh (i.e., strain XQ-5-3). As expected, the growth of strain XQ-5-2 was inhibited from high NH4+ concentration (Figure 4c). It should be noted that the L-lysine yield of strain XQ-5-3 was 53.8 ± 3.98 g/L, which is similar to that of strain XQ-5-2 (i.e., 52.3 ± 4.31 g/L) (Figure 4d). These results indicated that the overexpression of ddh gene did not significantly increase the L-lysine production of strain XQ-5-2, possibly due to the fact that the dehydrogenase pathway is still not the dominant pathway for L-lysine production of strain XQ-5-3. According to Figure 1, the dehydrogenase pathway is a reversible reaction. In addition, previous reports pointed out that DapDH is highly specific to meso-DAP, while L,L-DAP and D,D-DAP are competitive inhibitors [29]. Theoretically, L,L-DAP, an intermediate in the succinylase pathway, inhibits the reverse reaction of DapDH [29]. Thus, the succinylase pathway was upregulated to supply L,L-DAP during the overexpression of ddh. In order to confirm this conjecture, the transcription levels of ddh and dapD were measured in strain XQ-5-3. The results showed that the transcription levels of ddh and dapD increased with the increase of NH4+ concentration within a certain range (Figure 4e). The transcription level of ddh was 82% higher at high NH4+ concentration (i.e., 500 mM) than that at low NH4+ concentration (i.e., 50 mM). Similarly, the transcription level of dapD was 92% higher at high NH4+ concentration (i.e., 500 mM) than that at low NH4+ concentration (i.e., 50 mM). Moreover, it is reported that the expression level of dapD gene increases after the deletion of amtR gene [28]. These results indicated that the upregulated dapD expression level comes with the upregulated ddh expression level. However, DapD (tetrahydrodipicolinate succinylase, E.C. 2.3.1.117) has a high affinity with the substrate THDPA [15], making the succinylase pathway the main pathway for biosynthesizing L-lysine rather than the dehydrogenase pathway in spite of the overexpression of ddh.

2.4. Blocking the Succinylase Pathway to Upregulate the Dehydrogenase Pathway

Based on the above results, increasing the expression of ddh gene in the dehydrogenase pathway showed no significant effect on L-lysine production, possibly due to the fact that the expression level of dapD is increased with the overexpression of ddh. In order to upregulate the dehydrogenase pathway, the succinylase pathway was blocked. The succinylase pathway involves enzymes such as DapC (succinyl-amino-ketopimelate-coding gene dapC), DapE (N-succinyl-diaminopimelate desuccinylase-coding gene dapE), and DapF (diaminopimelate epimerase-coding gene dapF), respectively [30,31,32]. Previous research indicated that the genes dapC and dapE are dispensable for L-lysine overproduction in shake-flask cultures [33,34], whereas the genes dapF and dapD are indispensable for the succinylase pathway [15,33]. DapD is the first key enzyme in the succinylase pathway, thus DapD was inactivated to block the succinylase pathway, hence the DapD-deficient strain XQ-5-ΔdapD (i.e., strain XQ-5-4). As a control, the DapDH-deficient strain XQ-5-Δddh (i.e., strain XQ-5-5) was also constructed. The cell morphology of the three strains (i.e., a:strain XQ-5, b:strain XQ-5-4, c:strain XQ-5-5) were observed with FESEM, and the results indicated almost no change in cell morphology compared to the original strain (Figure 5a–c). It is well-known that meso-DAP connects the glycan backbone on the cell wall of many bacteria to give them shape and rigid structure [8]. These results showed that meso-DAP synthesized by either of these two pathways had met the needs of cell structure.
In order to investigate the L-lysine production of different strains under the different NH4+ concentrations, three NH4+ solutions of different concentrations (i.e., 250 mM, 300 mM, and 350 mM) were used in the test. According to Figure 5d, L-lysine production of strain XQ-5-4 decreased significantly, especially at low NH4+ concentration (i.e., 17.6 ± 5.11 g/L), indicating that dapD gene is essential for the succinylase pathway and L-lysine production. By contrast, the L-lysine production of strain XQ-5-5 (i.e., 39.3 ± 4.11 g/L) decreased slightly. These results have once again proven that the succinylase pathway is the main pathway for L-lysine production rather than the dehydrogenase pathway [22]. It should be noted that the L-lysine production of strain XQ-5-4 increased at high NH4+ concentration (Figure 5d), possibly due to the fact that the one-step dehydrogenase pathway compensated the L-lysine production at high NH4+ concentration when the succinylase pathway was downregulated [34]. Among the recombinant strains, strain XQ-5-ΔdapDΔamtR/pEC-ddh (i.e., strain XQ-5-8) accumulated the highest L-lysine production (i.e., 41.9 ± 4.57 g/L) if not counting the strains with succinylase pathway (Figure 5d). It is worth noting that the overexpression of ddh gene in strain XQ-5-6 increased the L-lysine production (300 mM) from 29.3 ± 3.49 g/L (strain XQ-5-6) to 41.9 ± 4.57 g/L (strain XQ-5-8). Interestingly, although the L-lysine yield of strain XQ-5-8 (i.e., 41.9 ± 4.57 g/L) was lower than that of strain XQ-5-3 (i.e., 53.8 ± 3.98 g/L), the qLys,max. of strain XQ-5-8 (i.e., 0.30 ± 0.04 g/(g·h)) was 20% higher than that of strain XQ-5-3 (i.e., 0.25 ± 0.03 g/(g·h)) (Figure 5e), possibly due to the fact that the L-lysine precursor (i.e., meso-DAP) was biosynthesized in one step rather than four steps [35] since the dehydrogenase pathway is the only pathway for L-lysine production of strain XQ-5-8. These results also showed that the dehydrogenase pathway has potential to increase L-lysine production. Taken together, these results indicated that blocking the succinylase pathway is beneficial to upregulating the dehydrogenase pathway, thus improving the qLys,max. However, the L-lysine production in strains with blocked the succinylase pathway decreased. Two reasons were proposed: (1) More NH4+ were required to produce L-lysine in the dehydrogenase pathway. Previous researches indicated that C. glutamicum strain with the dehydrogenase pathway alone cannot produce L-lysine at low NH4+ concentration [36] due to the low affinity of the dehydrogenase pathway to NH4+ in the substrate [16]; (2) the dehydrogenase pathway is a reversible process. L,L-DAP cannot be synthesized while blocking the succinylase pathway, thus relieving the competitive inhibition of the reverse reaction [29]. These proposed reasons have been validated by examining the concentration of the by-products (Table 1). As might be expected, strain XQ-5-8 had the highest by-product concentration at high NH4+ concentration (Table 1). All of the above mentioned results indicated that blocking the succinylase pathway is beneficial to improve the production intensify of L-lysine, but unhelpful for increasing the yield of L-lysine.

2.5. Weakening the dapD Gene Makes the Metabolic Flux of the Two Pathways Reach the Best Balance

As mentioned above, L-lysine production decreased significantly while blocking the succinylase pathway (Figure 5d) and the amount of by-products increased because of the lack of L,L-DAP (Table 1). To address this problem, the key enzyme DapD in the succinylase pathway was weakened to balance the flux between the succinylase pathway and the dehydrogenase pathway.
There are many ways to weaken genes, including the ones from the level of transcription or translation [37]. At the translation level, weakening the gene is often achieved by replacing RBS to change the gene expression level [38]. In this experiment, terminators were inserted in front of the gene to weaken its expression as the terminators are essential elements controlling the normal transcription of genes [37]. Six terminators with different intensities were selected (Figure 6a) and inserted in front of the dapD gene by secondary homologous recombination using pK18mobSacB [39]. The sequences of the six terminators are listed in Supplementary material (Table S1). Six recombinant bacteria with different weakening degrees were derived from strain XQ-5-3, i.e., XQ-5-W1, XQ-5-W2, XQ-5-W3, XQ-5-W4, XQ-5-W5, and XQ-5-W6. The L-lysine production of strain XQ-5-W1 (i.e., 48.7 ± 4.12 g/L), XQ-5-W2 (i.e., 50.2 ± 5.31 g/L), XQ-5-W5 (i.e., 48.3 ± 5.87 g/L), and XQ-5-W6 (i.e., 41.1 ± 6.44 g/L) were lower than that of the strain XQ-5-3 (i.e., 53.8 ± 3.98 g/L). Conversely, the L-lysine production of strain XQ-5-W3 (i.e., 54.2 ± 4.76 g/L) and XQ-5-W4 (i.e., 58.5 ± 5.43 g/L) were higher than that of strain XQ-5-3 (i.e., 53.8 ± 3.98 g/L), especially strain XQ-5-W4 (Figure 6b). These results indicated that the introduction of terminators in front of the dapD gene could change the translation level of dapD, thus affecting the flux in the succinylase pathway. The similar results were also found in previous reports [40]. The highest L-lysine yield was found in strain XQ-5-W4 (i.e., 58.5 ± 5.43 g/L), which was 21.4% higher than that of the original strain XQ-5 (i.e., 48.2 ± 3.54 g/L). In addition, the qLys,max of strain XQ-5-W4 (i.e., 0.31 ± 0.04 g/(g·h)) and strain XQ-5-8 (i.e., 0.30 ± 0.04 g/(g·h)) were similar, about 55% higher than that of strain XQ-5 (i.e., 0.20 ± 0.01 g/(g·h)) (Figure 6c). As expected, the activity of DapD decreased with the increase of terminator strength (i.e., 5.8 ± 0.13 mU/mg-1.3 ± 0.42 mU/mg) (Table 2). In addition, the forward reaction of DapDH increased with the weakening of the succinylase pathway and the reverse reaction was also enhanced (Table 2). It is worth noting that the best balance in strain XQ-5-W4 (i.e., XQ-5-dapDWΔamtR/pEC-ddh) resulted in the best L-lysine yield (i.e., 58.5 ± 5.43 g/L) and qLys,max (i.e., 0.31 ± 0.04 g/(g·h)). At the same time, the by-products of the six strains were measured. In comparison, strain XQ-5-W4 has fewer by-products (Table 3).

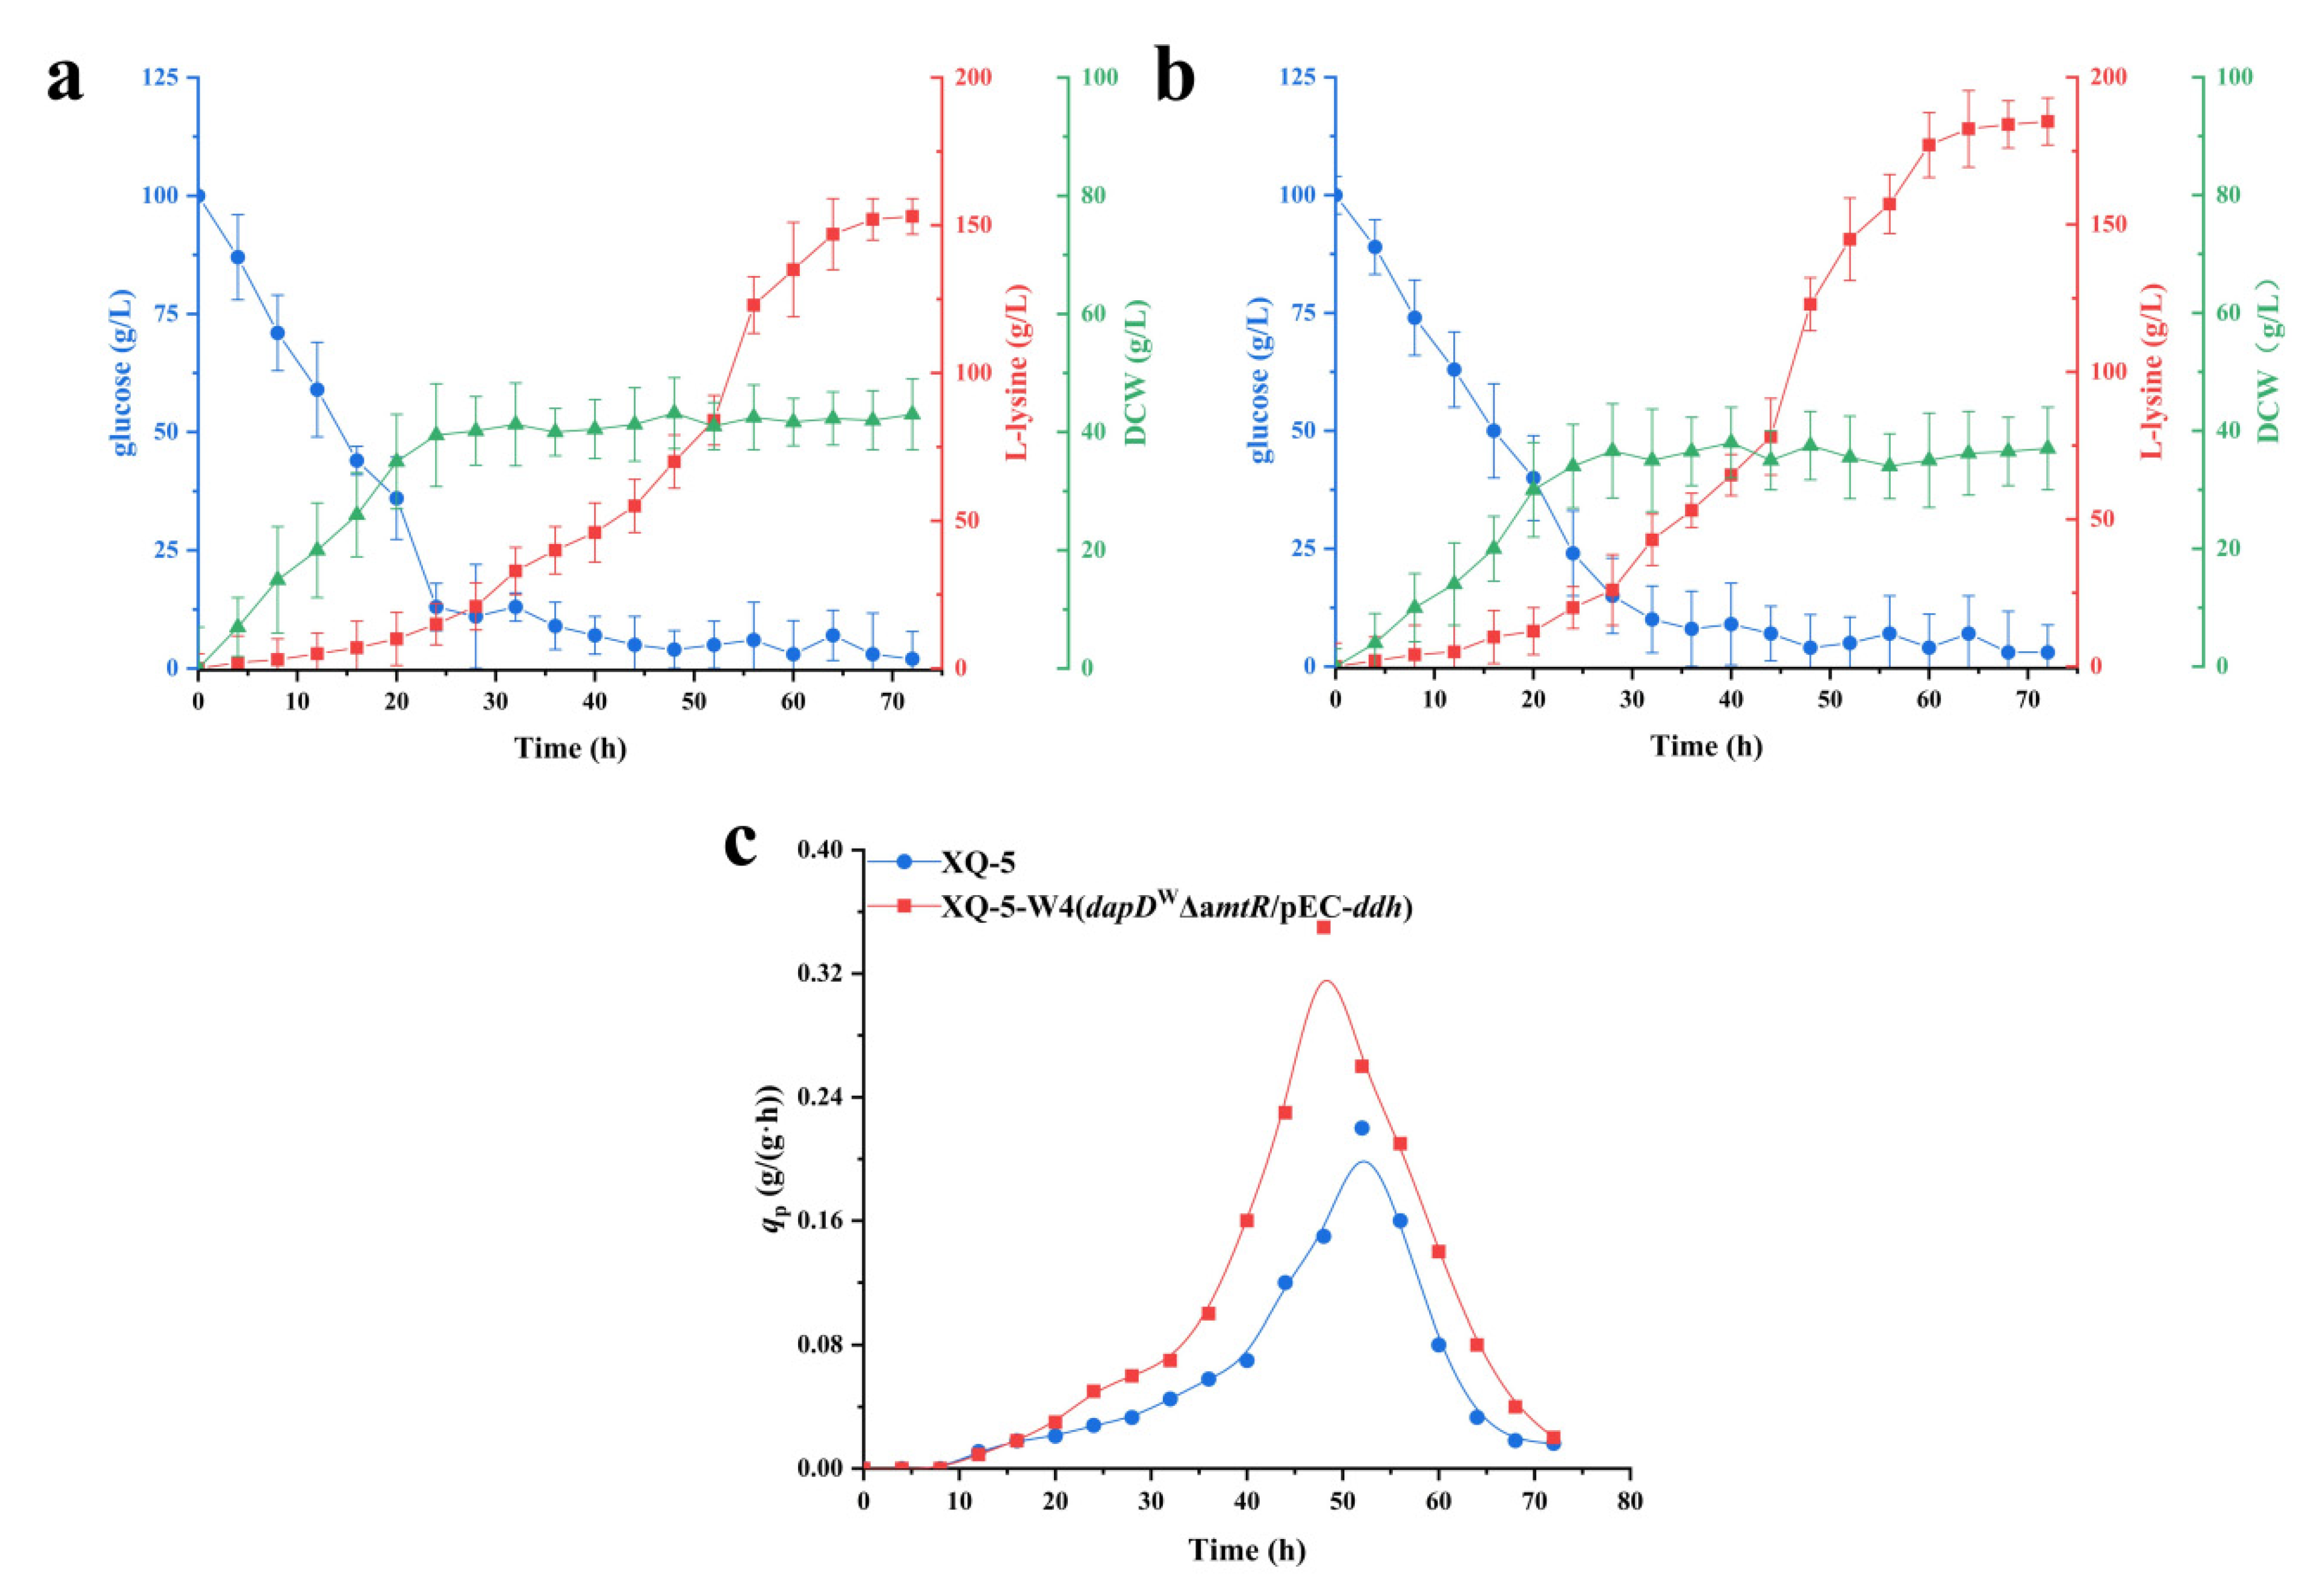
2.6. Fed-Batch Fermentation of C. glutamicum XQ-5-W4

The production performance of strain XQ-5-W4 was investigated in a fed-batch process. As a comparison, fed-batch fermentation of the original strain XQ-5 was also conducted. Figure 7 shows the time profiles of fed-batch fermentations in a 5-L jar fermenter. Fed-batch fermentation of XQ-5-W4 resulted in 189 ± 8.7 g/L of L-lysine with a qLys,max of 0.35 ± 0.05 g/(g·h) (Figure 7b,c). However, fed-batch fermentation of XQ-5 resulted in 151 ± 9.3 g/L of L-lysine with a qLys,max of 0.22 ± 0.02 g/(g·h) (Figure 7a,c). Consistent with the results of production intensity of L-lysine in shake flasks, the qLys,max of strain XQ-5-W4 was higher than that of strain XQ-5 (0.35 ± 0.05 g/(g·h) vs. 0.22 ± 0.02 g/(g·h)) (Figure 7c). In addition, the L-lysine yield of strain XQ-5-W4 stabilized faster, about six hours earlier than that of strain XQ-5. However, the dry weight of strain XQ-5-W4 was 38.9 ± 5.12 g/L, 13.9% lower than that of the original strain (i.e., 45.2 ± 7.64 g/L) (Figure 7a,b). Previous research also found the similar result in which the biomass decreased while enhancing the yield of the target products [23]. Taken together, these results demonstrated that the final strain XQ-5-W4 shows an efficient L-lysine production under fed-batch fermentation, making it a very promising platform for L-lysine production.

3. Materials and Methods

3.1. Strains, Growth Medium, and Culture Conditions

L-lysine producing strain C. glutamicum XQ-5 derived from the wild-type strain C. glutamicum ATCC 13032 after multiple rounds of random mutagenesis. Strains and plasmids used in this study are listed in Table 4. Oligonucleotides used in this study are listed in Supplementary Material (Table S2). The L-lysine high-producing strain C. glutamicum XQ-5 was derived from the wild-type strain C. glutamicum 13032 [41]. Molecular reagents (isopropyl B-D-1-thiogalactopyranoside (IPTG), 2 × Phanta Max Master Mix, 2 × Tag Max Master Mix (Dye Plus) and kanamycin) were purchased from Vazyme Biotech Co., Ltd. (Nanjing, China). Restriction endonucleases and the DNA Ligase were purchased from Thermo Fisher Scientific Shanghai Instruments Co. Ltd. (shanghai, China). Other chemical reagents, including yeast extract, tryptone, and NaCl, were purchased from China National Pharmaceutical Group Corporation (Shanghai, China). The cell concentration was measured with a spectrophotometer (721N, shanghai, China). The glucose and L-lysine concentrations were measured with an SBA-40E immobilized enzyme biosensor (Shandong, China).
E. coli grew in Luria-Bertani (LB) medium at 37 °C. C. glutamicum grew in LB-glucose (LBG) medium at 30 °C [42]. EPO medium and LB-Brain Heart Infusion-Sorbitol (LBHIS) medium were used to construct the recombinant bacteria [43]. In addition, a 50 μg/mL kanamycin solution was used to build the plasmids and a 25 μg/mL kanamycin solution was used to screen the recombinant strains. A 1 mmol/L IPTG solution was used to induce gene overexpression. Samples were taken from the shake flasks or fermenters every four hours.
The single colony was inoculated in LBG liquid medium and incubated at 30 °C for 12 h with rotation speed 100 r/min. Next, 5 mL of the seed culture was transferred to 50 mL of the fermentation medium in a standard 500 mL shake flask and was cultured for 72 h at 30 °C with rotation speed 100 r/min. The fermentation medium contained (per liter) 100 g glucose, 8 g corn steep liquor, 40 g (NH4)2SO4 (≈300 mM), 0.02 g Fe+, 0.02 g Mn+, 450 μg VB1, 8 mg VB3, 850 μg VH, 0.6 mg Zn+, 0.53 g KCl, 1 g KH2PO4, 1 g K2HPO4, 4 g MgSO4·7H2O, 50 mg betaine, 8 mL beet molasses, and 40 g CaCO3. Both media were adjusted to pH 7.3 with NaOH. Fermentation conditions: initial pH 7.3 and 10% of inoculation volume.
Fed-batch fermentation was carried out in a 5-L jar fermenter (BLBio-5GJ-2-H, Bailun Bi-Technology Co. Ltd., Shanghai, China). The fermentation medium contained (per liter): 70 g glucose, 20 g corn steep liquor, 2 g KH2SO4, 50 g beet molasses, 40 g (NH4)2SO4, 1.5 g MgSO4.7H20, 0.03 g FeSO4, 0.02 g MnSO4, 0.03 g glycine betaine, 600 ug biotin, 300 ug thiamine-HCI, and 2 mL antifoam. Ammonia was used to control pH 7.0 and provide nitrogen source for bacteria. The relative dissolved oxygen was controlled at 20–30% by stirring speed and ventilation. The temperature is maintained at 30 °C by jacket cooling. OD600, residual sugar concentration and L-Lysine concentration were determined every 4 h during fermentation. The prepared feed solution [44] was used to control the glucose concentration at about 5 g/L by adjusting the feeding rate. L-lysine concentration was determined as lysine·HCl in duplicates.

3.2. Analytical Methods

The cell concentration after 25-fold dilution was measured at OD600 using a spectrophotometer. The correlation coefficient between the dry cell weight (DCW) and OD600 was 0.32 (1 OD600 = 0.32g DCW). After sample dilution of 100 times, glucose and L-lysine concentrations were measured with an SBA-40E immobilized enzyme biosensor. The concentration of the by-products was measured with high performance liquid chromatography (HPLC) [44]. Cell morphology was observed via field emission scanning electron microscopy (FESEM). Cells of C. glutamicum in the mid-log phase were collected by centrifugation and rinsed three times in physiological saline (pH 7.0). Bacterial cells were spread onto a small silicon platelet and air dried under room temperature, followed by in-situ fixation with a 2.5% glutaraldehyde solution in a 0.15 M sodium phosphate buffer (pH7.4) for 10 min. The samples were coated with gold and transferred to FESEM (SU8220, Hitachi, Japan) for observation at an accelerating voltage of 3 kV.

3.3. Construction of C. glutamicum Recombinant Strains

Restriction endonucleases and the DNA Ligase were used to construct the plasmids. In this study, the plasmid pEC-XK99E was used for gene overexpression in C. glutamicum. The suicide plasmid pK18mobsacB was used for gene knockout in C. glutamicum. Firstly, the constructed plasmid was electroporated into C. glutamicum, and then the positive transformants were screened with a 25 μg/mL kanamycin solution in LBH medium. The final positive transformants were obtained by eliminating the plasmids according to the sucrose lethal principle. The deletions in the chromosome were verified by PCR analysis.

3.4. Real-Time PCR

In order to analyze RNA, cells in exponential phase were collected during shake flask fermentation for mRNA isolation. RNA was extracted with an RNAiso Plus reagent (Takara, Dalian, China). The cDNA was synthesized with RevertAidTM First Strand cDNA synthesis kit (Fermentas, Shanghai, China). The Ct values of the 16S rDNA gene and those of the ddh and dapD genes were obtained by RT-qPCR using a Bio-Rad CFX96 Touch Real-Time PCR Detection System (Bio-Rad Hercules, CA, USA) with SYBR Premix Ex TaqTM II (Takara, Dalian, China). The primer sequences used for RT-qPCR and RT-PCR are shown in Table S3. Each sample was analyzed in triplicate.

3.5. Preparation of Crude Extracts and Enzyme Assays

Crude enzyme solution was prepared to measure the activities of DapDH and DAPD. The preparation method was based on a previous report [45]. Enzyme activity was analyzed in triplicate.
DapDH activity was measured at 30 °C. The forward reaction mixture contained 200 mM glycine-KOH (pH 10.5), 100 mM (NH4)2SO4, 0.3 mM NADPH, 5 mM THDPA, and crude enzymes extract. The reverse reaction mixture contained 200 mM glycine/NaOH (pH 10.5), 2 mM NADP+, 4 mM meso-DAP, and crude enzymes extract. One unit is defined as the amount of enzyme which catalyzes the formation or decrease of 1 μmol NADPH (340 nm) per minute [46].
DapD activity was measured by the formation of free coenzyme A (CoA) at 412 nm. The reaction mixture contained 0.1 M Tris-HCI (pH 8.0), 0.5 mM DTNB, 0.2 mM succinyl-CoA, 5 mM 2-aminopimelate, and crude enzymes extract. One unit is defined as the amount of enzyme which catalyzes the formation of 1 μmol CoA per minute [32].

4. Conclusions

For the first time, DAP pathway was reconstructed to optimize L-lysine production in C. glutamicum, which demonstrated that the dehydrogenase pathway is promising for promoting L-lysine production. In C. glutamicum, both the dehydrogenase pathway and the succinylase pathway are involved in the production of L-lysine, but the relative proportion of each pathway on L-lysine biosynthesis is different because of the different demand for NH4+ concentration [16]. The proportion of the dehydrogenase pathway on L-lysine production increased when increasing the NH4+ concentration (Figure 2d). Since the L-lysine biosynthesis in the dehydrogenase pathway has less steps, the strain showed the highest qLys,max at high NH4+ concentration (Figure 2c). The similar results were also found in the AmtR-deficient strain (Figure 4b), as NH4+ was efficiently transferred into the cell during inactivation of AmtR [25]. The L-lysine yield and qLys,max in strain XQ-5-2 reached 52.3 ± 4.31 g/L and 0.22 ± 0.03 g/(g·h), which were 8.5% and 10% higher than that of the original strain XQ-5, respectively. Although the dehydrogenase pathway is promising in promoting L-lysine production, redirecting the flux into the dehydrogenase pathway while blocking the succinylase pathway is counterproductive to L-lysine production (Figure 5d). Fortunately, this problem can be overcome by weakening the succinylase pathway (Figure 6b). The target strain C. glutamicum XQ-5-W4 produced 58.5 ± 5.43 g/L L-lysine with a qLys,max. (i.e., 0.31 ± 0.04 g/(g·h)) in shake-flask fermentation, which were 21.4% and 55% higher than that of strain XQ-5. In addition, fed-batch fermentation of strain XQ-5-W4 resulted in 189 ± 8.7 g/L of L-lysine with a qLys,max of 0.35 ± 0.05 g/(g·h). These results indicated that the reconstruction of DAP pathway to switch the flux in the variants of DAP pathway has great potential to promote L-lysine production in C. glutamicum.

Supplementary Materials

The following are available online at https://www.mdpi.com/article/10.3390/ijms22169065/s1.

Author Contributions

J.-Z.X. and Z.-M.R. conceived the experiments. N.L., T.-T.Z. and W.-G.Z. designed and performed the experiments and analyzed the data. N.L. and J.-Z.X. wrote the paper. All authors have read and agreed to the published version of the manuscript.

Funding

This work was supported by the National Natural Science Foundation of China [No. 31601459], the Top-Notch Academic Programs Project of Jiangsu Higher Education Institutions, the 111 project (Grant number 111-2-06), and the National First class Discipline Program of Light Industry Technology and Engineering (LITE2018-08).

Institutional Review Board Statement

Not applicable.

Informed Consent Statement

Not applicable.

Data Availability Statement

The data presented in this study are available on request from the corresponding author.

Acknowledgments

The authors would like to acknowledge Xian Zhang and Xuewei Pan for their help in the data analysis and drawing the figures.

Conflicts of Interest

The authors declare no conflict of interest.

References

  1. Félix, F.; Letti, L.; Vinícius de Melo Pereira, G.; Bonfim, P.; Soccol, V.; Soccol, C. L-lysine production improvement: A review of the state of the art and patent landscape focusing on strain development and fermentation technologies. Crit. Rev. Biotechnol. 2019, 39, 1031–1055. [Google Scholar] [CrossRef]
  2. Leuchtenberger, W.; Huthmacher, K.; Drauz, K. Biotechnological production of amino acids and derivatives: Current status and prospects. Appl. Microbiol. Biotechnol. 2005, 69, 1–8. [Google Scholar] [CrossRef] [PubMed]
  3. Nishida, H.; Nishiyama, M.; Kobashi, N.; Kosuge, T.; Hoshino, T.; Yamane, H. A prokaryotic gene cluster involved in synthesis of lysine through the amino adipate pathway: A key to the evolution of amino acid biosynthesis. Genome Res. 1999, 9, 1175–1183. [Google Scholar] [CrossRef] [PubMed] [Green Version]
  4. Velasco, A.M.; Leguina, J.I.; Lazcano, A. Molecular Evolution of the Lysine Biosynthetic Pathways. J. Mol. Evol. 2002, 55, 445–449. [Google Scholar] [CrossRef] [PubMed]
  5. Jetten, M.; Sinskey, A. Recent advances in the physiology and genetics of amino acid-producing bacteria. Crit. Rev. Biotechnol. 1995, 15, 73–103. [Google Scholar] [CrossRef]
  6. Scapin, G.; Blanchard, J.S. Enzymology of Bacterial Lysine Biosynthesis. Adv. Enzymol. Relat. Areas Mol. Biol. 1998, 72, 279–324. [Google Scholar] [CrossRef] [Green Version]
  7. Liu, Y.; White, R.H.; Whitman, W.B. Methanococci Use the Diaminopimelate Aminotransferase (DapL) Pathway for Lysine Biosynthesis. J. Bacteriol. 2010, 192, 3304–3310. [Google Scholar] [CrossRef] [PubMed] [Green Version]
  8. Born, T.L.; Blanchard, J.S. Structure/function studies on enzymes in the diaminopimelate pathway of bacterial cell wall biosynthesis. Curr. Opin. Chem. Biol. 1999, 3, 607–613. [Google Scholar] [CrossRef]
  9. Cirilli, M.; Zheng, R.J.; Scapin, G.; Blanchard, J.S. Structural symmetry: The three-dimensional structure of Haemophilus influenzae diaminopimelate epimerase. Biochemistry 1998, 37, 16452–16458. [Google Scholar] [CrossRef]
  10. White, P.J. The Essential Role of Diaminopimelate Dehydrogenase in the Biosynthesis of Lysine by Bacillus sphaericus. J. Gen. Microbiol. 1983, 129, 739–749. [Google Scholar] [CrossRef] [Green Version]
  11. Wenko, L.K.; Treick, R.W.; Wilson, K.G. Isolation and characterization of a gene encoding meso-diaminopimelate dehydrogenase from Glycine max. Plant Mol. Biol. 1985, 4, 197–204. [Google Scholar] [CrossRef] [PubMed]
  12. Mccoy, A.J.; Adams, N.E.; Hudson, A.O.; Gilvarg, C.; Maurelli, A.T. L,L-diaminopimelate aminotransferase, a trans-kingdom enzyme shared by Chlamydia and plants for synthesis of diaminopimelate/lysine. Proc. Natl. Acad. Sci. USA 2018, 103, 17909–17914. [Google Scholar] [CrossRef] [Green Version]
  13. Dobson, R.C.J.; Girón, I.; Hudson, A.O. L,L-Diaminopimelate Aminotransferase from Chlamydomonas reinhardtii: A Target for Algaecide Development. PLoS ONE 2011, 6, e20439. [Google Scholar] [CrossRef] [Green Version]
  14. Watanabe, N.; Cherney, M.M.; Belkum, M.J.V.; Marcus, S.L.; Flegel, M.D.; Clay, M.D.; Deyholos, M.K.; Vederas, J.C.; James, M.N.G. Crystal structure of L,L-diaminopimelate aminotransferase from Arabidopsis thaliana: A recently discovered enzyme in the biosynthesis of L-lysine by plants and Chlamydia. J. Mol. Biol. 2007, 371, 685–702. [Google Scholar] [CrossRef] [PubMed]
  15. Wehrmann, A.; Phillipp, B.; Sahm, H.; Eggeling, L. Different modes of diaminopimelate synthesis and their role in cell wall integrity: A study with Corynebacterium glutamicum. J. Bacteriol. 1998, 180, 3159–3165. [Google Scholar] [CrossRef] [Green Version]
  16. Sahm, H.; Eggeling, L.; de Graaf, A. Pathway analysis and metabolic engineering in Corynebacterium glutamicum. Biol. Chem. 2000, 381, 899–910. [Google Scholar] [CrossRef] [PubMed] [Green Version]
  17. UDAKA, S. Screening method for microorganisms accumulating metabolites and its use in the isolation of Micrococcus glutamicus. J. Bacteriol. 1960, 79, 754–755. [Google Scholar] [CrossRef] [Green Version]
  18. Burillo, S.; Luque, I.; Fuentes, I.; Contreras, A. Interactions between the nitrogen signal transduction protein PII and N-acetyl glutamate kinase in organisms that perform oxygenic photosynthesis. J. Bacteriol. 2004, 186, 3346–3354. [Google Scholar] [CrossRef] [Green Version]
  19. Bott, M. Offering surprises: TCA cycle regulation in Corynebacterium glutamicum. Trends Microbiol. 2007, 15, 417–425. [Google Scholar] [CrossRef]
  20. Misono, H.; Togawa, H.; Yamamoto, T.; Soda, K. Occurrence of meso-alpha, epsilon-diaminopimelate dehydrogenase in Bacillus sphaericus. Biochem. Biophys. Res. Commun. 1976, 72, 89–93. [Google Scholar] [CrossRef]
  21. Rehm, N.; Burkovski, A. Engineering of nitrogen metabolism and its regulation in Corynebacterium glutamicum: Influence on amino acid pools and production. Appl. Microbiol. Biotechnol. 2011, 89, 239–248. [Google Scholar] [CrossRef]
  22. Sonntag, K.; Eggeling, L.; Graaf, A.A.; Sahm, H. Flux partitioning in the split pathway of lysine synthesis in Corynebacterium glutamicum Quantification by 13C- and 1H-NMR spectroscopy. Eur. J. Biochem. 2010, 213, 1325–1331. [Google Scholar] [CrossRef] [Green Version]
  23. Xu, M.; Li, J.; Shu, Q.; Tang, M.; Rao, Z. Enhancement of l-arginine production by increasing ammonium uptake in an AmtR-deficient Corynebacterium crenatum mutant. J. Ind. Microbiol. Biotechnol. 2019, 46, 1155–1166. [Google Scholar] [CrossRef] [PubMed]
  24. Yeh, P.; Sicard, A.; Sinskey, A. General organization of the genes specifically involved in the diaminopimelate-lysine biosynthetic pathway of Corynebacterium glutamicum. Mol. Gen. Genet. 1988, 212, 105–111. [Google Scholar] [CrossRef] [PubMed]
  25. Palanca, C.; Rubio, V. Structure of AmtR, the global nitrogen regulator of Corynebacterium glutamicum, in free and DNA-bound forms. FEBS J. 2016, 283, 1039–1059. [Google Scholar] [CrossRef] [PubMed]
  26. Rehm, N.; Georgi, T.; Hiery, E.; Degner, U.; Schmiedl, A.; Burkovski, A.; Bott, M. L-Glutamine as a nitrogen source for Corynebacterium glutamicum: Derepression of the AmtR regulon and implications for nitrogen sensing. Microbiology 2010, 156, 3180–3193. [Google Scholar] [CrossRef] [Green Version]
  27. Marc, J.; Reinhard, K.; Andreas, B. Nitrogen regulation in Corynebacterium glutamicum: Isolation of genes involved and biochemical characterization of corresponding proteins. FEMS Microbiol. Lett. 1999, 173, 303–310. [Google Scholar] [CrossRef] [Green Version]
  28. Buchinger, S.; StröSser, J.; Rehm, N.; Hänßler, E.; Hans, S.; Bathe, B.; Schomburg, D.; KräMer, R.; Burkovski, A. A combination of metabolome and transcriptome analyses reveals new targets of the Corynebacterium glutamicum nitrogen regulator AmtR. J. Biotechnol. 2009, 140, 68–74. [Google Scholar] [CrossRef]
  29. Scapin, G.; Cirilli, M.; Reddy, S.G.; Gao, Y.; Vederas, J.C.; Blanchard, J.S. Substrate and Inhibitor Binding Sites in Corynebacterium glutamicum Diaminopimelate Dehydrogenase. Biochemistry 1998, 37, 3278–3285. [Google Scholar] [CrossRef]
  30. Dutta, D.; Mishra, S. The structural and energetic aspects of substrate binding and the mechanism of action of the DapE-encoded N-succinyl-L,L-diaminopimelic acid desuccinylase (DapE) investigated using a hybrid QM/MM method. Phys. Chem. Chem. Phys. 2014, 16, 26348–26358. [Google Scholar] [CrossRef]
  31. Sagong, H.Y.; Kim, K.J. Structural basis for redox sensitivity in Corynebacterium glutamicum diaminopimelate epimerase: An enzyme involved in L-lysine biosynthesis. Sci. Rep. 2017, 7, 42318. [Google Scholar] [CrossRef] [Green Version]
  32. Sagong, H.; Kim, K. Crystal Structure and Biochemical Characterization of Tetrahydrodipicolinate N-Succinyltransferase from Corynebacterium glutamicum. J. Agric. Food. Chem. 2015, 63, 10641–10646. [Google Scholar] [CrossRef]
  33. Hartmann, M.; Tauch, A.; Eggeling, L.; Bathe, B.; Möckel, B.; Pühler, A.; Kalinowski, J. Identification and characterization of the last two unknown genes, dapC and dapF, in the succinylase branch of the L-lysine biosynthesis of Corynebacterium glutamicum. J. Biotechnol. 2003, 104, 199–211. [Google Scholar] [CrossRef]
  34. Shaw-Reid, C.; McCormick, M.; Sinskey, A.; Stephanopoulos, G. Flux through the tetrahydrodipicolinate succinylase pathway is dispensable for L-lysine production in Corynebacterium glutamicum. Appl. Microbiol. Biotechnol. 1999, 51, 325–333. [Google Scholar] [CrossRef] [PubMed]
  35. Eggeling, L.; Bott, M. A giant market and a powerful metabolism: L-lysine provided by Corynebacterium glutamicum. Appl. Microbiol. Biotechnol. 2015, 99, 3387–3394. [Google Scholar] [CrossRef] [PubMed]
  36. Misono, H.; Soda, K. Purification and Properties of meso-α, ε-Diaminopimelate D-Dehydrogenase from Bacillus sphaericus. Agric. Biol. Chem. 1980, 44, 227–229. [Google Scholar] [CrossRef] [Green Version]
  37. He, Z.; Duan, Y.; Zhai, W.; Zhang, X.; Shi, J.; Zhang, X.; Xu, Z. Evaluating Terminator Strength Based on Differentiating Effects on Transcription and Translation. ChemBioChem 2020, 21, 2067–2072. [Google Scholar] [CrossRef]
  38. Man, Z.; Xu, M.; Rao, Z.; Guo, J.; Yang, T.; Zhang, X.; Xu, Z. Systems pathway engineering of Corynebacterium crenatum for improved L-arginine production. Sci. Rep. 2016, 6, 28629. [Google Scholar] [CrossRef] [Green Version]
  39. Chen, Y.J.; Liu, P.; Nielsen, A.A.K.; Brophy, J.A.N.; Clancy, K.; Peterson, T.; Voigt, C.A. Characterization of 582 natural and synthetic terminators and quantification of their design constraints. Nat. Methods 2013, 10, 659–664. [Google Scholar] [CrossRef]
  40. Zhang, B.; Yu, M.; Zhou, Y.; Ye, B.C. Improvement of L-ornithine production by attenuation of argF in engineered Corynebacterium glutamicum S9114. Amb Express 2018, 8, 26. [Google Scholar] [CrossRef]
  41. Wang, L.; Yu, H.; Xu, J.; Ruan, H.; Zhang, W. Deciphering the crucial roles of AraC-type transcriptional regulator Cgl2680 on NADPH metabolism and L-lysine production in Corynebacterium glutamicum. World J. Microbiol. Biotechnol. 2020, 36, 82. [Google Scholar] [CrossRef]
  42. Xu, J.; Han, M.; Ren, X.; Zhang, W. Modification of aspartokinase III and dihydrodipicolinate synthetase increases the production of L-lysine in Escherichia coli. Biochem. Eng. J. 2016, 114, 79–86. [Google Scholar] [CrossRef]
  43. Rest, M.E.V.D.; Lange, C.; Molenaar, D. A heat shock following electroporation induces highly efficient transformation of Corynebacterium glutamicum with xenogeneic plasmid DNA. Appl. Microbiol. Biotechnol. 1999, 52, 541–545. [Google Scholar] [CrossRef] [PubMed]
  44. Xu, J.; Wu, Z.; Gao, S.; Zhang, W. Rational modification of tricarboxylic acid cycle for improving L-lysine production in Corynebacterium glutamicum. Microb. Cell Factories 2018, 17, 105. [Google Scholar] [CrossRef] [PubMed] [Green Version]
  45. Wang, Y.Y.; Zhang, F.; Xu, J.Z.; Zhang, W.G.; Chen, X.L.; Liu, L.M. Improvement of L-Leucine Production in Corynebacterium glutamicum by Altering the Redox Flux. Int. J. Mol. Sci. 2019, 20, 2020. [Google Scholar] [CrossRef] [PubMed] [Green Version]
  46. Cremer, J.; Treptow, C.; Eggeling, L.; Sahm, H. Regulation of Enzymes of Lysine Biosynthesis in Corynebacterium glutamicum. J. Gen. Microbiol. 1988, 134, 3221–3229. [Google Scholar] [CrossRef] [Green Version]
Figure 1. The DAP pathway of L-lysine synthesis. (A) Dehydrogenase pathway, (B) succinylase pathway, (C) acetylase pathway, (D) aminotransferase pathway. Abbreviations: DHDPS Dihydrodipicolinate synthetase, DHDPR Dihydrodipicolinate reductase, DapDH Diaminopimelate dehydrogenase, DapD Tetrahydrodipicolinate N-succinyltransferase, DapC Succinyl-amino-ketopimelate transaminase, DapE N-succinyl-diaminopimelate desuccinylase, DapF Diaminopimelate epimerase, THDP-NAT Tetrahydrodipicolinate acetylase, AT N-acetylaminoketopimelate aminotransferase, NAD-DAC N-acetyl-diaminopimelate deacetylase, DapL Tetrahydrodipicolinate aminotransferase.
Ijms 22 09065 g001
Figure 2. The effects of different ammonium (NH4+) concentrations on L-lysine synthesis. (a) Cell growth (OD600) of strain XQ-5 at different NH4+ concentrations. The cell concentration after 25 fold dilution was measured at OD600. (b) L-lysine production of strain XQ-5 at different NH4+ concentrations. (c) The qLys of strain XQ-5 at different NH4+ concentrations. (d) Transcription level of gene ddh at different NH4+ concentrations. All data represent values of three determinations of triplicate independent experiments.
Ijms 22 09065 g002
Figure 3. Effect of dehydrogenase pathway on L-lysine synthesis. (a) The construction process of strain XQ-5-1 and SDS-PAGE analysis of DapDH (i.e., DapDH: 35 kDa). Lane M, protein ruler; lane 1,2: crude enzyme extract (i.e., strain XQ-5-1); lane 3,4: crude enzyme extract (i.e., strain XQ-5). (b) Cell growth (OD600) of strain XQ-5 and XQ-5-1 in shake flask culture. The cell concentration after a 25-fold dilution was measured at OD600. (c) L-lysine production of strain XQ-5 and XQ-5-1 in shake flask culture. (d) The qLys of strain XQ-5-1 in shake flask culture. The data represent mean values and standard deviations obtained from three independent cultivations.
Ijms 22 09065 g003
Figure 4. Effect of alleviating nitrogen source restriction on L-lysine synthesis. (a) The construction process of strain XQ-5-3 and SDS-PAGE analysis of DapDH (i.e., 35 kDa). Lane M, protein ruler; lane 1,2: crude enzyme extract (i.e., strain XQ-5-3); lane 3,4: crude enzyme extract (i.e., strain XQ-5). (b) The qLys of strain XQ-5 and strain XQ-5-1 under different NH4+ concentrations. (c) Cell growth (OD600) of strain XQ-5-1 and XQ-5-2 in shake flask culture. The cell concentration after 25 fold dilution was measured at OD600. (d) L-lysine production of strain XQ-5-1 and XQ-5-2 in shake flask culture. (e) Transcription levels of ddh and dapD in strain XQ-5-3. All data represent values of three determinations of triplicate independent experiments.
Ijms 22 09065 g004
Figure 5. Blocking succinylase pathway to redirection of flux in dehydrogenase pathway. (a) FESEM of strain XQ-5. (b) FESEM of strain XQ-5-4. (c) FESEM of strain XQ-5-5. (d) L-lysine production of strain XQ-5-1, XQ-5-4, XQ-5-5, XQ-5-6, XQ-5-7, XQ-5-8 in shake flask culture. (e) The qLys of strain XQ-5-3 and strain XQ-5-8 at 300 mM NH4+ concentration. All data represent values of three determinations of triplicate independent experiments.
Ijms 22 09065 g005
Figure 6. Balancing the flux in the two variants of DAP pathway to promote L-lysine production. (a) Different strengths of six terminators. (b) L-lysine production of strain XQ-5-W1, XQ-5-W2, XQ-5-W3, XQ-5-W4, XQ-5-W5, and XQ-5-W6 in shake flask culture. (c) qLys of strain XQ-5-1, XQ-5-8, and XQ-5-W4 at 300 mM NH4+ concentration. All data represent values of three determinations of triplicate independent experiments.
Ijms 22 09065 g006
Figure 7. Time course of L-lysine fed-batch fermentations of strains XQ-5 (a) and XQ-5-W4 (b) in 5-L fermentors. The L-lysine production (squares, red line), DCW (triangle, green line), and glucose (circle, blue line) of strains cultivated in 5-L fermentors. (c) qLys of strain XQ-5 and XQ-5-W4 at 300 mM NH4+ concentration in fed-batch fermentations. All data represent values of three determinations of triplicate independent experiment.
Ijms 22 09065 g007
Table 1. By-products of Corynebacterium glutamicum strains XQ-5-1, XQ-5-3, and XQ-5-8.
XQ-5-1 (XQ-5/pEC-ddh)XQ-5-3 (XQ-5-ΔamtR/pEC-ddh)XQ-5-8 (XQ-5-ΔamtRΔdapD/pEC-ddh)
by-Products200 mM300 mM400 mM200 mM300 mM400 mM200 mM300 mM400 mM
glutamate0.26 ± 0.050.35 ± 0.110.54 ± 0.020.49 ± 0.060.97 ± 0.111.23 ± 0.021.07 ± 0.041.75 ± 0.152.01 ± 0.02
pyruvate1.94 ± 0.042.08 ± 0.142.36 ± 0.022.21 ± 0.042.65 ± 0.033.32 ± 0.043.01 ± 0.123.43 ± 0.093.91 ± 0.12
isoleucine1.06 ± 0.161.33 ± 0.111.35 ± 0.121.57 ± 0.022.03 ± 0.032.37 ± 0.022.31 ± 0.042.93 ± 0.113.51 ± 0.02
aspartate2.06 ± 0.062.87 ± 0.052.92 ± 0.072.98 ± 0.083.52 ± 0.123.91 ± 0.123.88 ± 0.164.01 ± 0.114.22 ± 0.12
methionine1.12 ± 0.111.33 ± 0.071.41 ± 0.151.22 ± 0.021.54 ± 0.111.87 ± 0.081.46 ± 0.021.98 ± 0.052.31 ± 0.06
threonine0.98 ± 0.131.15 ± 0.141.23 ± 0.021.06 ± 0.162.01 ± 0.113.91 ± 0.122.17 ± 0.133.23 ± 0.113.91 ± 0.12
All data represent values of three determinations of triplicate independent experiments.
Table 2. The activity DapDH and DapD different recombinant C. glutamicum strains.
StrainsSpecific Activity (mU/mg of Protein)
DapDDapDH(F-Reaction)DapDH (R-Reaction)
XQ-5-W15.8 ± 0.13201 ± 13.6130 ± 13.8
XQ-5-W25.3 ± 0.21227 ± 22.1138 ± 18.1
XQ-5-W34.5 ± 0.39241 ± 26.8145 ± 17.4
XQ-5-W43.3 ± 0.26260 ± 18.4151 ± 21.2
XQ-5-W52.1 ± 0.22268 ± 19.3177 ± 19.3
XQ-5-W61.3 ± 0.42275 ± 20.2194 ± 18.9
All data represent values of three determinations of triplicate independent experiments.
Table 3. By products of C. glutamicum strains XQ-5-W1, XQ-5-W2, XQ-5-W3, XQ-5-W4, XQ-5-W5, and XQ-5-W6.
Strainsby-Products (g/L)
GlutamatePyruvateIsoleucineAspartateMethionineThreonine
XQ-5-W10.4 ± 0.032.11 ± 0.141.5 ± 0.092.93 ± 0.181.54 ± 0.041.26 ± 0.08
XQ-5-W20.54 ± 0.042.23 ± 0.131.64 ± 0.072.85 ± 0.121.25 ± 0.021.75 ± 0.11
XQ-5-W30.64 ± 0.122.41 ± 0.101.32 ± 0.052.42 ± 0.121.05 ± 0.061.35 ± 0.02
XQ-5-W40.78 ± 0.042.32 ± 0.131.24 ± 0.092.15 ± 0.110.85 ± 0.121.65 ± 0.08
XQ-5-W51.32 ± 0.072.87 ± 0.112.01 ± 0.122.78 ± 0.051.05 ± 0.102.75 ± 0.02
XQ-5-W61.64 ± 0.123.12 ± 0.032.64 ± 0.143.65 ± 0.021.75 ± 0.043.01 ± 0.12
All data represent values of three determinations of triplicate independent experiments.
Table 4. The main strains and plasmids used in this study.
Strains and PlasmidsCharactersReference
C. glutamicum strains
XQ-5C. glutamicum AECr 2-TAr MFr Mets, L-lysine-producing bacteria derived from strain C. glutamicum ATCC13032[41]
XQ-5-1strain XQ-5 harboring plasmid pEC-XK99E-ddhthis study
XQ-5-2derivative of strain XQ-5 with deletion of amtRthis study
XQ-5-3strain XQ-5-2 harboring plasmid pEC-XK99E-ddhthis study
XQ-5-4derivative of strain XQ-5 with deletion of dapDthis study
XQ-5-5derivative of strain XQ-5 with deletion of ddhthis study
XQ-5-6derivative of strain XQ-5-2 with deletion of dapDthis study
XQ-5-7strain XQ-5-4 harboring plasmid pEC-XK99E-ddhthis study
XQ-5-8strain XQ-5-6 harboring plasmid pEC-XK99E-ddhthis study
XQ-5-W1derivative of strain XQ-5-3 with weaking of dapD(T1-Terminator)this study
XQ-5-W2derivative of strain XQ-5-3 with weaking of dapD(T2-Terminator)this study
XQ-5-W3derivative of strain XQ-5-3 with weaking of dapD(T3-Terminator)this study
XQ-5-W4derivative of strain XQ-5-3 with weaking of dapD(T4-Terminator)this study
XQ-5-W5derivative of strain XQ-5-3 with weaking of dapD(T5-Terminator)this study
XQ-5-W6derivative of strain XQ-5-3 with weaking of dapD(T6-Terminator)this study
plasmid
pEC-XK99EKanr, Expression vector with pMB1 repliconstratagene
pK18mobSacBKanr, Integration vectorstratagene
pEC-XK99E-ddhpEC-XK99E carrying gene ddh from C.glutamicumthis study
pK18mobsacBamtRpK18mobsacB carrying amtR-L and amtR-R fragmentsthis study
pK18mobsacBdapD
pK18mobsacBddh
pK18mobsacB carrying dapD-L and dapD-R fragmentsthis study
pK18mobsacB carrying ddh-L and ddh-R fragments this study
pK18mobsacB-T1a derivative of pK18mobsacB, harboring the fragment of inserting T1 terminator in front of dapDthis study
pK18mobsacB-T2a derivative of pK18mobsacB, harboring the fragment of inserting T2 terminator in front of dapDthis study
pK18mobsacB-T3a derivative of pK18mobsacB, harboring the fragment of inserting T3 terminator in front of dapDthis study
pK18mobsacB-T4a derivative of pK18mobsacB, harboring the fragment of inserting T4 terminator in front of dapDthis study
pK18mobsacB-T5a derivative of pK18mobsacB, harboring the fragment of inserting T5 terminator in front of dapDthis study
pK18mobsacB-T6a derivative of pK18mobsacB, harboring the fragment of inserting T6 terminator in front of dapDthis study
XQ-5-W4derivative of strain XQ-5-3 with weaking of dapD(T4-Terminator)this study
XQ-5-W5derivative of strain XQ-5-3 with weaking of dapD(T5-Terminator)this study
XQ-5-W6derivative of strain XQ-5-3 with weaking of dapD(T6-Terminator)this study
Publisher’s Note: MDPI stays neutral with regard to jurisdictional claims in published maps and institutional affiliations.

