Article

Synthesis of New AIEE-Active Chalcones for Imaging of Mitochondria in Living Cells and Zebrafish In Vivo

1
School of Pharmaceutical Science, Sun Yat-sen University, Guangzhou 510006, China
2
Department of Anatomy and Neurobiology, Zhongshan School of Medicine, Sun Yat-sen University, Guangzhou 510006, China
*
Author to whom correspondence should be addressed.
Int. J. Mol. Sci. 2021, 22(16), 8949; https://doi.org/10.3390/ijms22168949
Submission received: 19 July 2021 / Revised: 2 August 2021 / Accepted: 16 August 2021 / Published: 19 August 2021
(This article belongs to the Section Molecular Toxicology)

Abstract

:
Fluorophores with aggregation-induced emission enhancement (AIEE) properties have attracted increasing interest in recent years. On the basis of our previous research, we successfully designed and synthesized eleven chalcones. Through an optical performance experiment, we confirmed that compounds 16 had obvious AIEE properties. As these AIEE molecules had excellent fluorescence properties and a large Stokes shift, we studied their application in living cell imaging, and the results showed that these compounds had low cytotoxicity and good biocompatibility at the experimental concentrations. More importantly, they could specifically label mitochondria. Subsequently, we selected zebrafish as experimental animals to explore the possibilities of these compounds in animal imaging. The fluorescence imaging of zebrafish showed that these AIEE molecules can enter the embryo and can be targeted to aggregate in the digestive tract, which provides a strong foundation for their practical application in the field of biological imaging. Compared with traditional fluorophores, these AIEE molecules have the advantages of possessing a small molecular weight and high flexibility. Therefore, they have excellent application prospects in the field of biological imaging. In addition, the findings of this study have very positive practical significance for the discovery of more AIEE molecules.

1. Introduction

Organic fluorescent dyes have been generally applied to biological imaging, fluorescent probes, pathological detection, and other fields on account of their strong fluorescence emission [1,2,3,4]. However, traditional organic fluorescent dyes often show an aggregation-caused quenching (ACQ) phenomenon, which severely limits their practical application. ACQ molecules emit strong fluorescence in low-concentration solutions, but show fluorescence quench in high concentrations or solid state [5]. Tang’s research group first discovered a compound with an aggregation-induced emission (AIE) phenomenon called 1-methyl-1,2,3,4,5-pentaphenylsilole in 2001 [6]. Fluorescence molecules with this property show weak emission in solution but show a dramatically enhanced emission in high concentrations and solid state, which is contrary to the ACQ phenomenon [7]. The AIEE phenomenon has attracted many scientists interest since it was first discovered. An increasing number of AIEE molecules have been found with the development of research, including derivatives from tetraphenylethylene (TPE), 2-phenylcinnamylnitrile, and hexaphenylsilole (HPS) [8,9,10]. The causes of the AIEE phenomenon have been extensively studied, and various mechanisms have been proposed, including restricted intramolecular rotation (RIR), J-type aggregation, restriction of intramolecular vibration (RIV), twisted intramolecular charge transfer (TICT), and Z/E isomerization. Of all the above factors, RIR is considered to be the main cause [11,12,13,14,15,16]. Since the AIEE phenomenon was proposed, many compounds with this property have been synthesized and successfully applied in the biomedical field in the past decades, mainly including in the monitoring of life activities, the diagnosis of diseases, and the treatment of diseases [17,18,19,20].
In our previous studies, as shown in Figure 1, we researched the fluorescence properties of sanguinarine and found that it showed obvious AIEE properties [21]. Molecules with a large conjugate system and high molecular weights are easily inserted into DNA bases and cause toxicity. Simultaneously, according to Lipinski’s rules of five, they will be greatly limited in practical applications in medical research [22,23]. Therefore, we tried to reduce the planarity and the conjugated structure by breaking the oxygen-containing pentacyclic ring at the end of the sanguinarine. The experiments results showed that chelerythrine was also a typical AIEE molecule [21]. Subsequently, on the basis of chelerythrine, we synthesized six flavonoid and two flavanone compounds by opening another benzene ring. They also exhibited AIEE characteristics [24,25]. In addition, chalcone-based AIEE molecules have been reported in several works [26,27,28], which further increases our interest and confidence in the study of the fluorescence characteristics of chalcone compounds. In this project, we tried to acquire smaller molecules through the same ideas and experiences. Fortunately, we eventually obtained 11 chalcones (chemical structure is shown in Figure 1) and confirmed that compounds 16 had AIEE properties by measuring their optical properties. In Table 1, we calculated the molecular weight (MW), partition coefficient (logp), and number of hydrogen bond acceptors (nON) of all the chalcone derivatives.
Chalcones are a kind of natural product that widely exist in nature and possess many pharmacological activities, including anti-infection, anti-inflammatory, anti-cancer, antioxidant, anti-bacterial and anti-viral properties [29,30,31,32,33,34,35,36]. In this paper, 11 target products were obtained through the Claisen–Schmidt reaction. By studying their optical properties, such as the fluorescence spectrum, UV spectrum, fluorescence images under 365 nm UV light, fluorescence quantum yield (ϕF), and fluorescence stability, compounds 16 were concluded to be AIEE molecules. Subsequently, through different viscosity tests, it was speculated that the cause of the AIEE phenomenon was restricted intramolecular rotation (RIR). Due to the fact that they present strong emission and stable fluorescence intensity characteristics, we tried to explore the possibilities in terms of biological imaging. Using an MTT assay, a cell uptake assay, and a mitochondrial co-localization assay, chalcones were identified as having good biocompatibility and labeling the mitochondria specifically under experimental concentrations. After zebrafish embryos were infiltrated by compounds 16 for 1 h, bright blue fluorescences were observed at 24, 48, and 120 h, respectively. Additionally, we found that they had different affinities for the tissues and organs of zebrafish and specifically gathered in the digestive tract, which indicates that AIEE compounds 16 have great potential for practical application in zebrafish imaging.

2. Results and Discussion

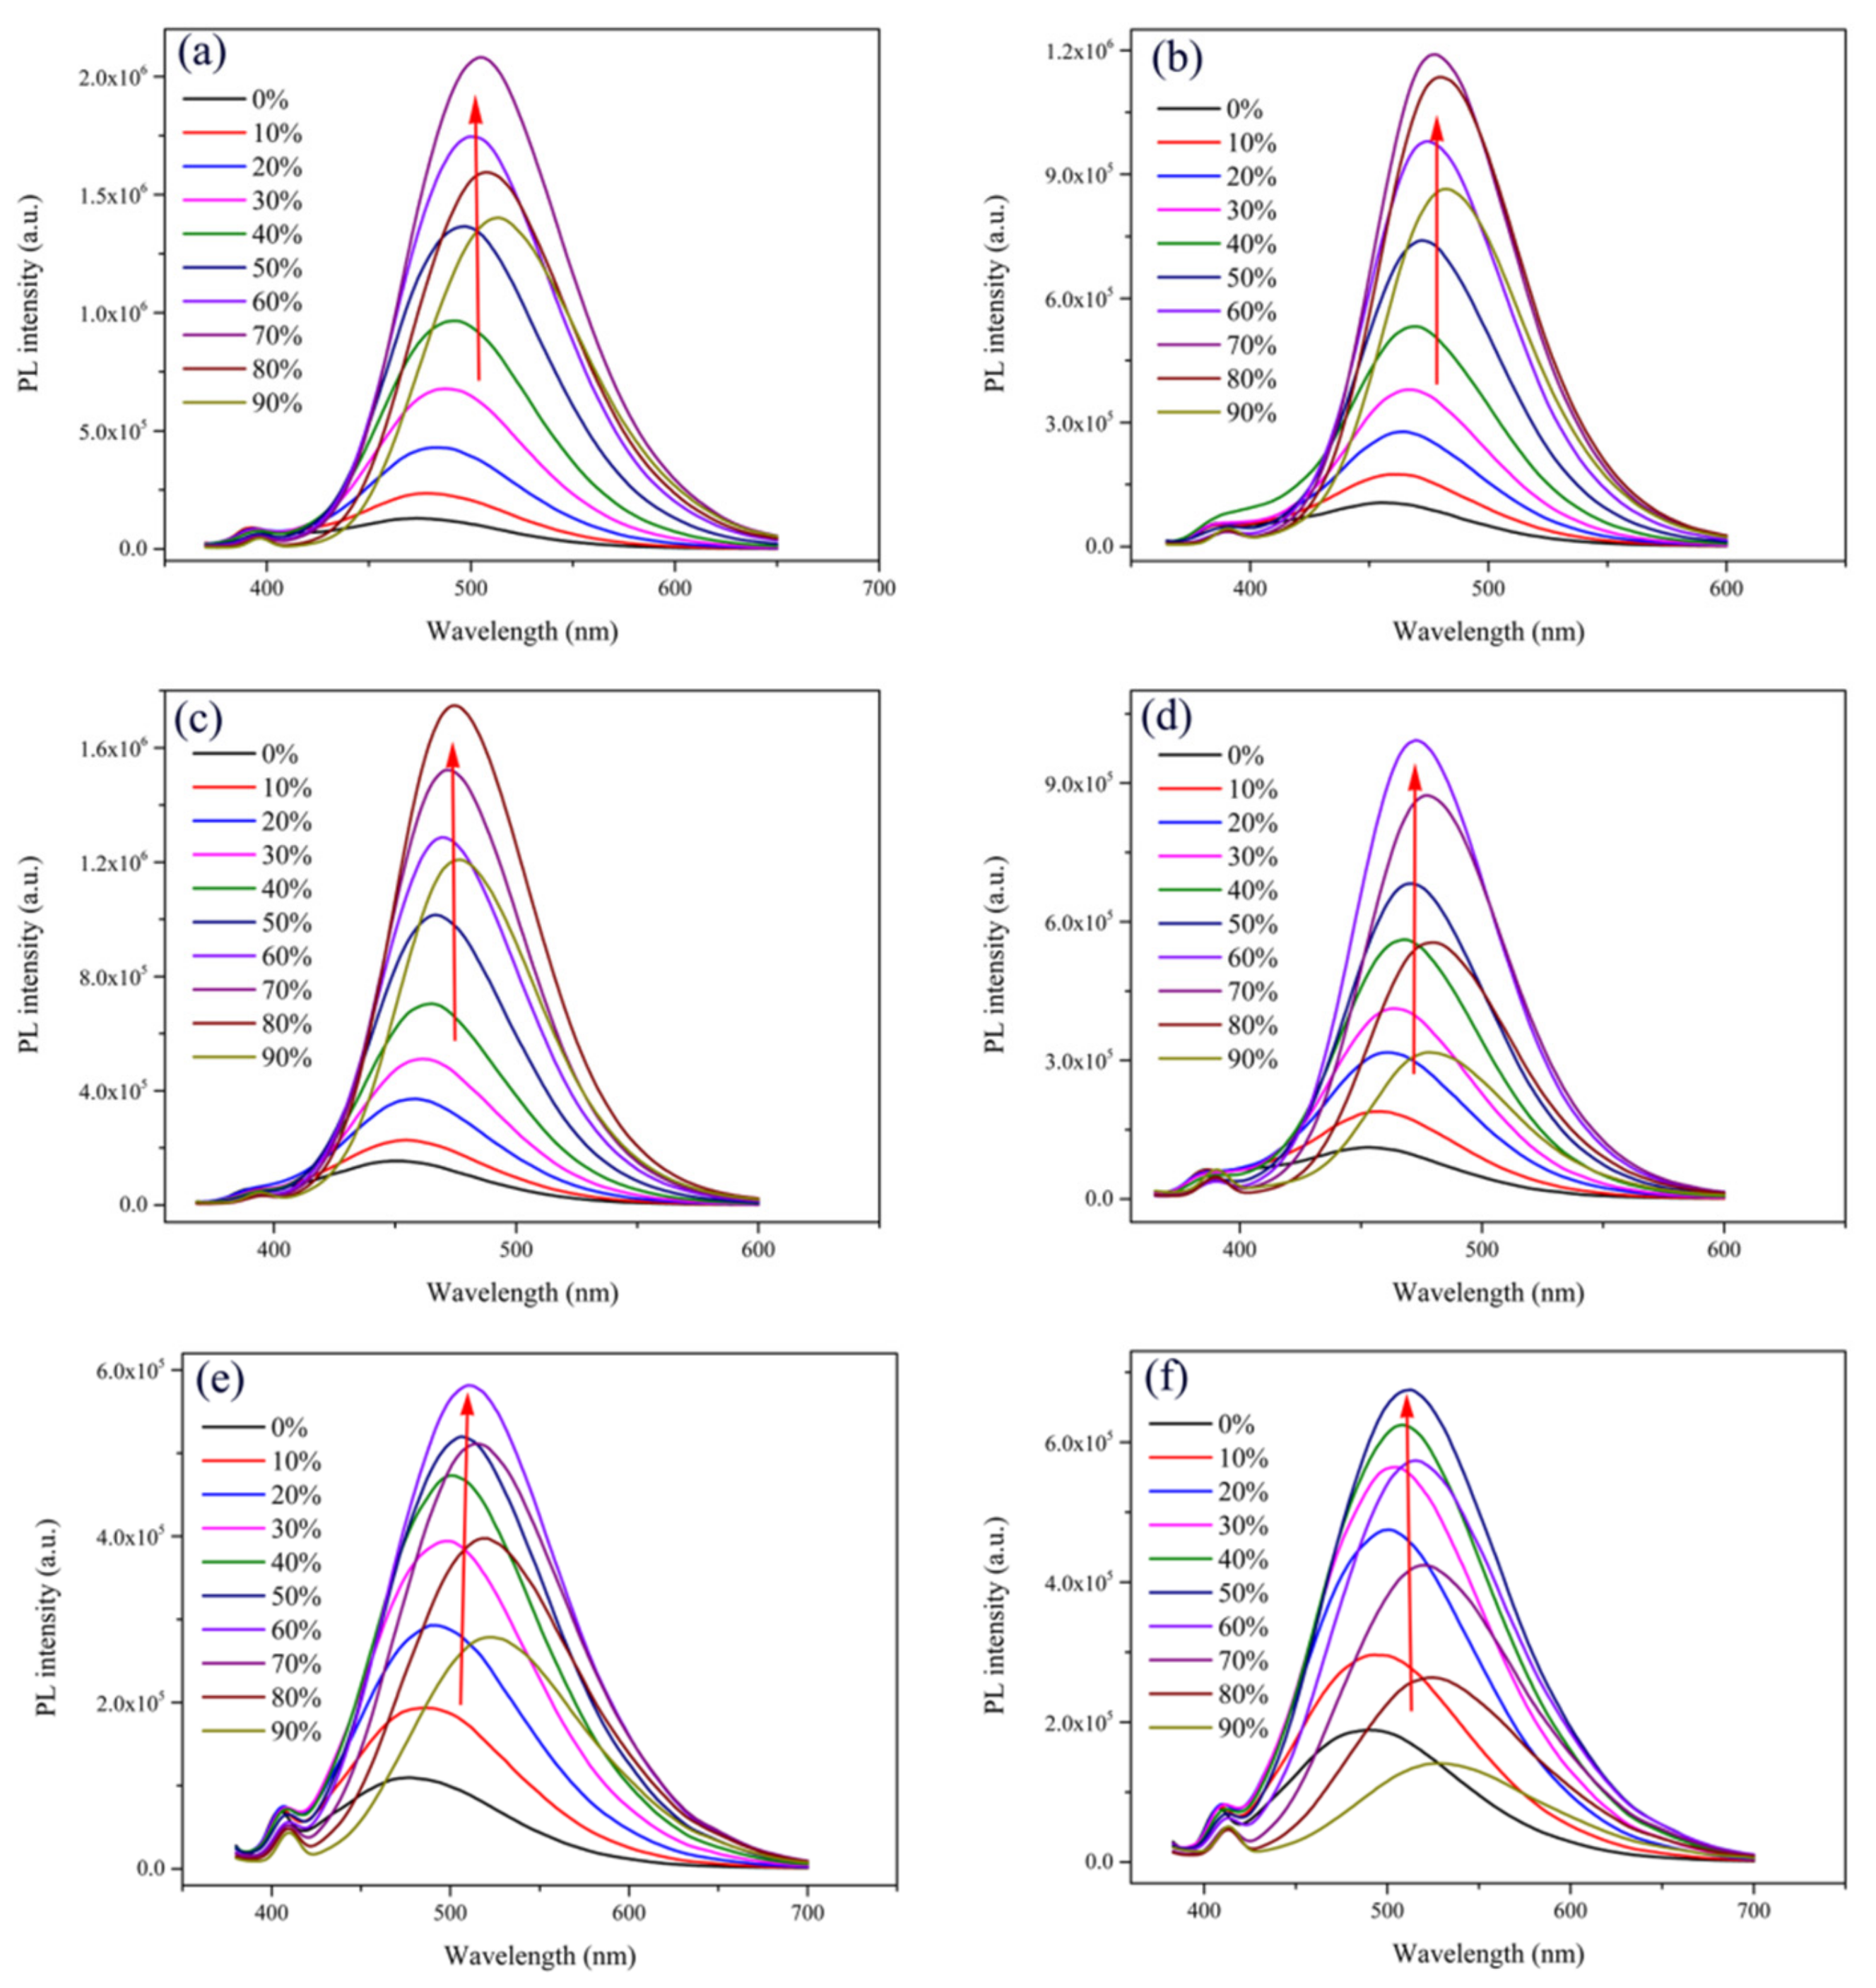
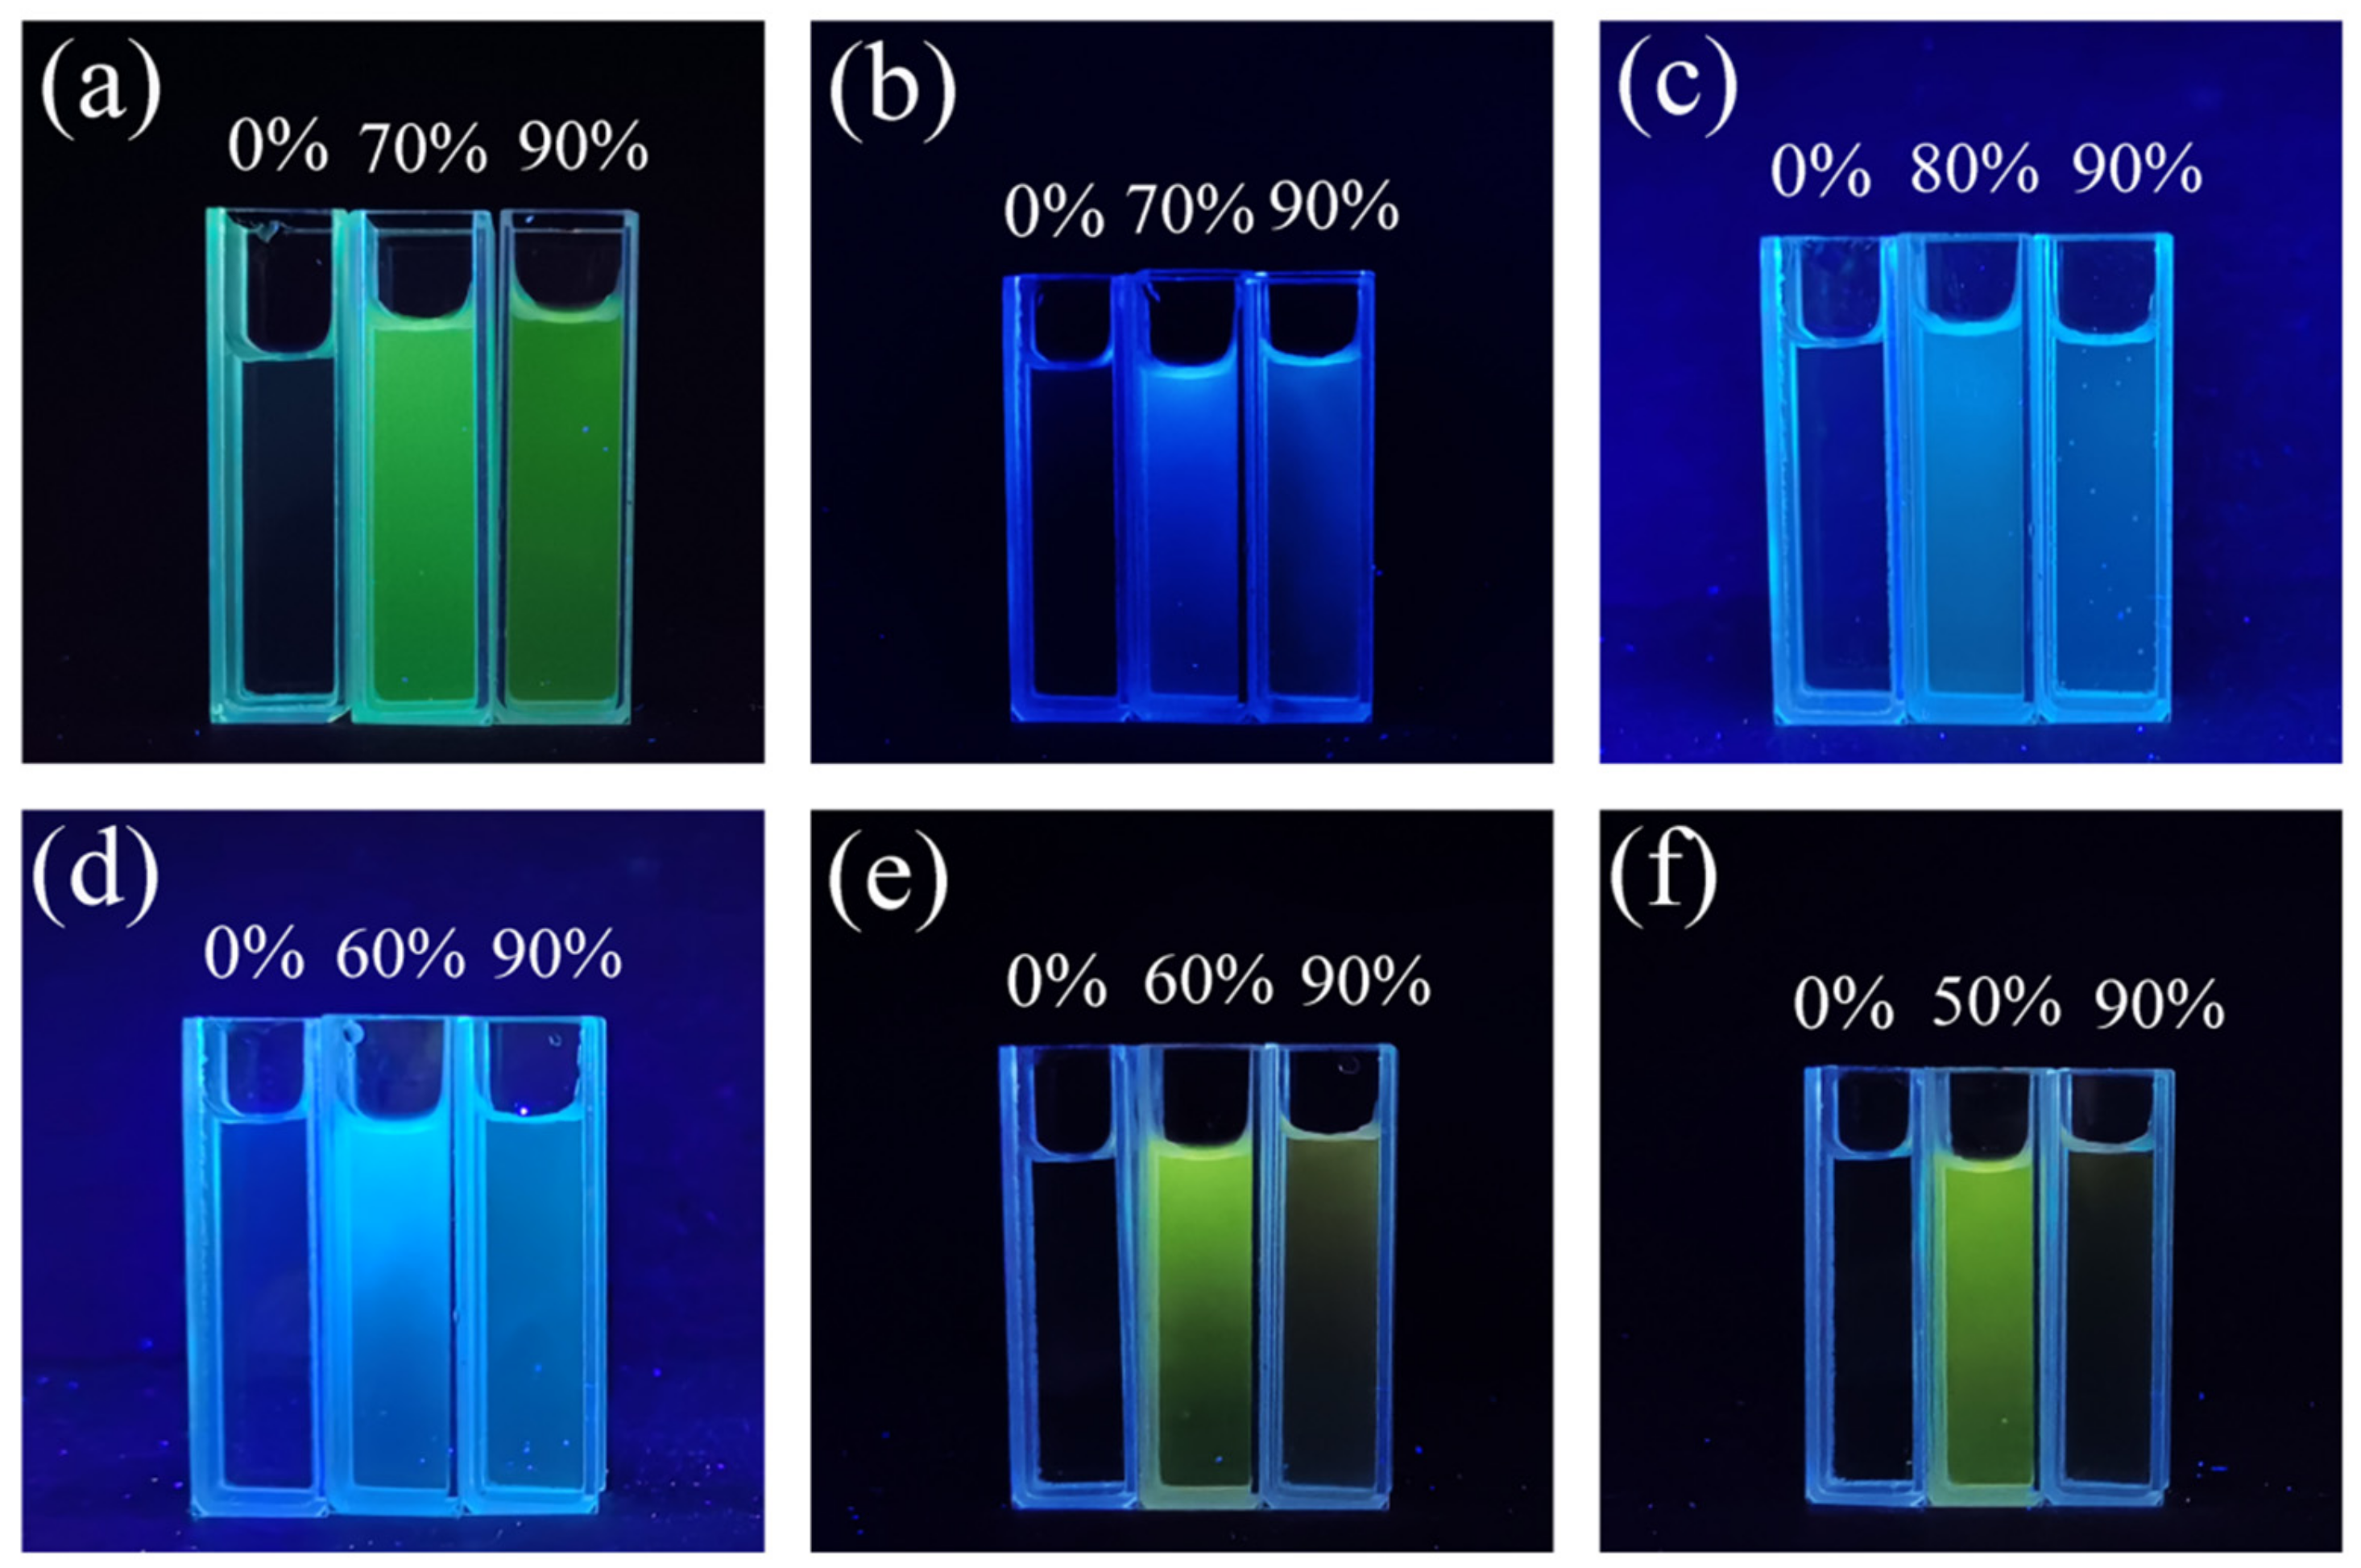
2.1. Optical Properties and Aggregation-Induced Emission Enhancement Properties
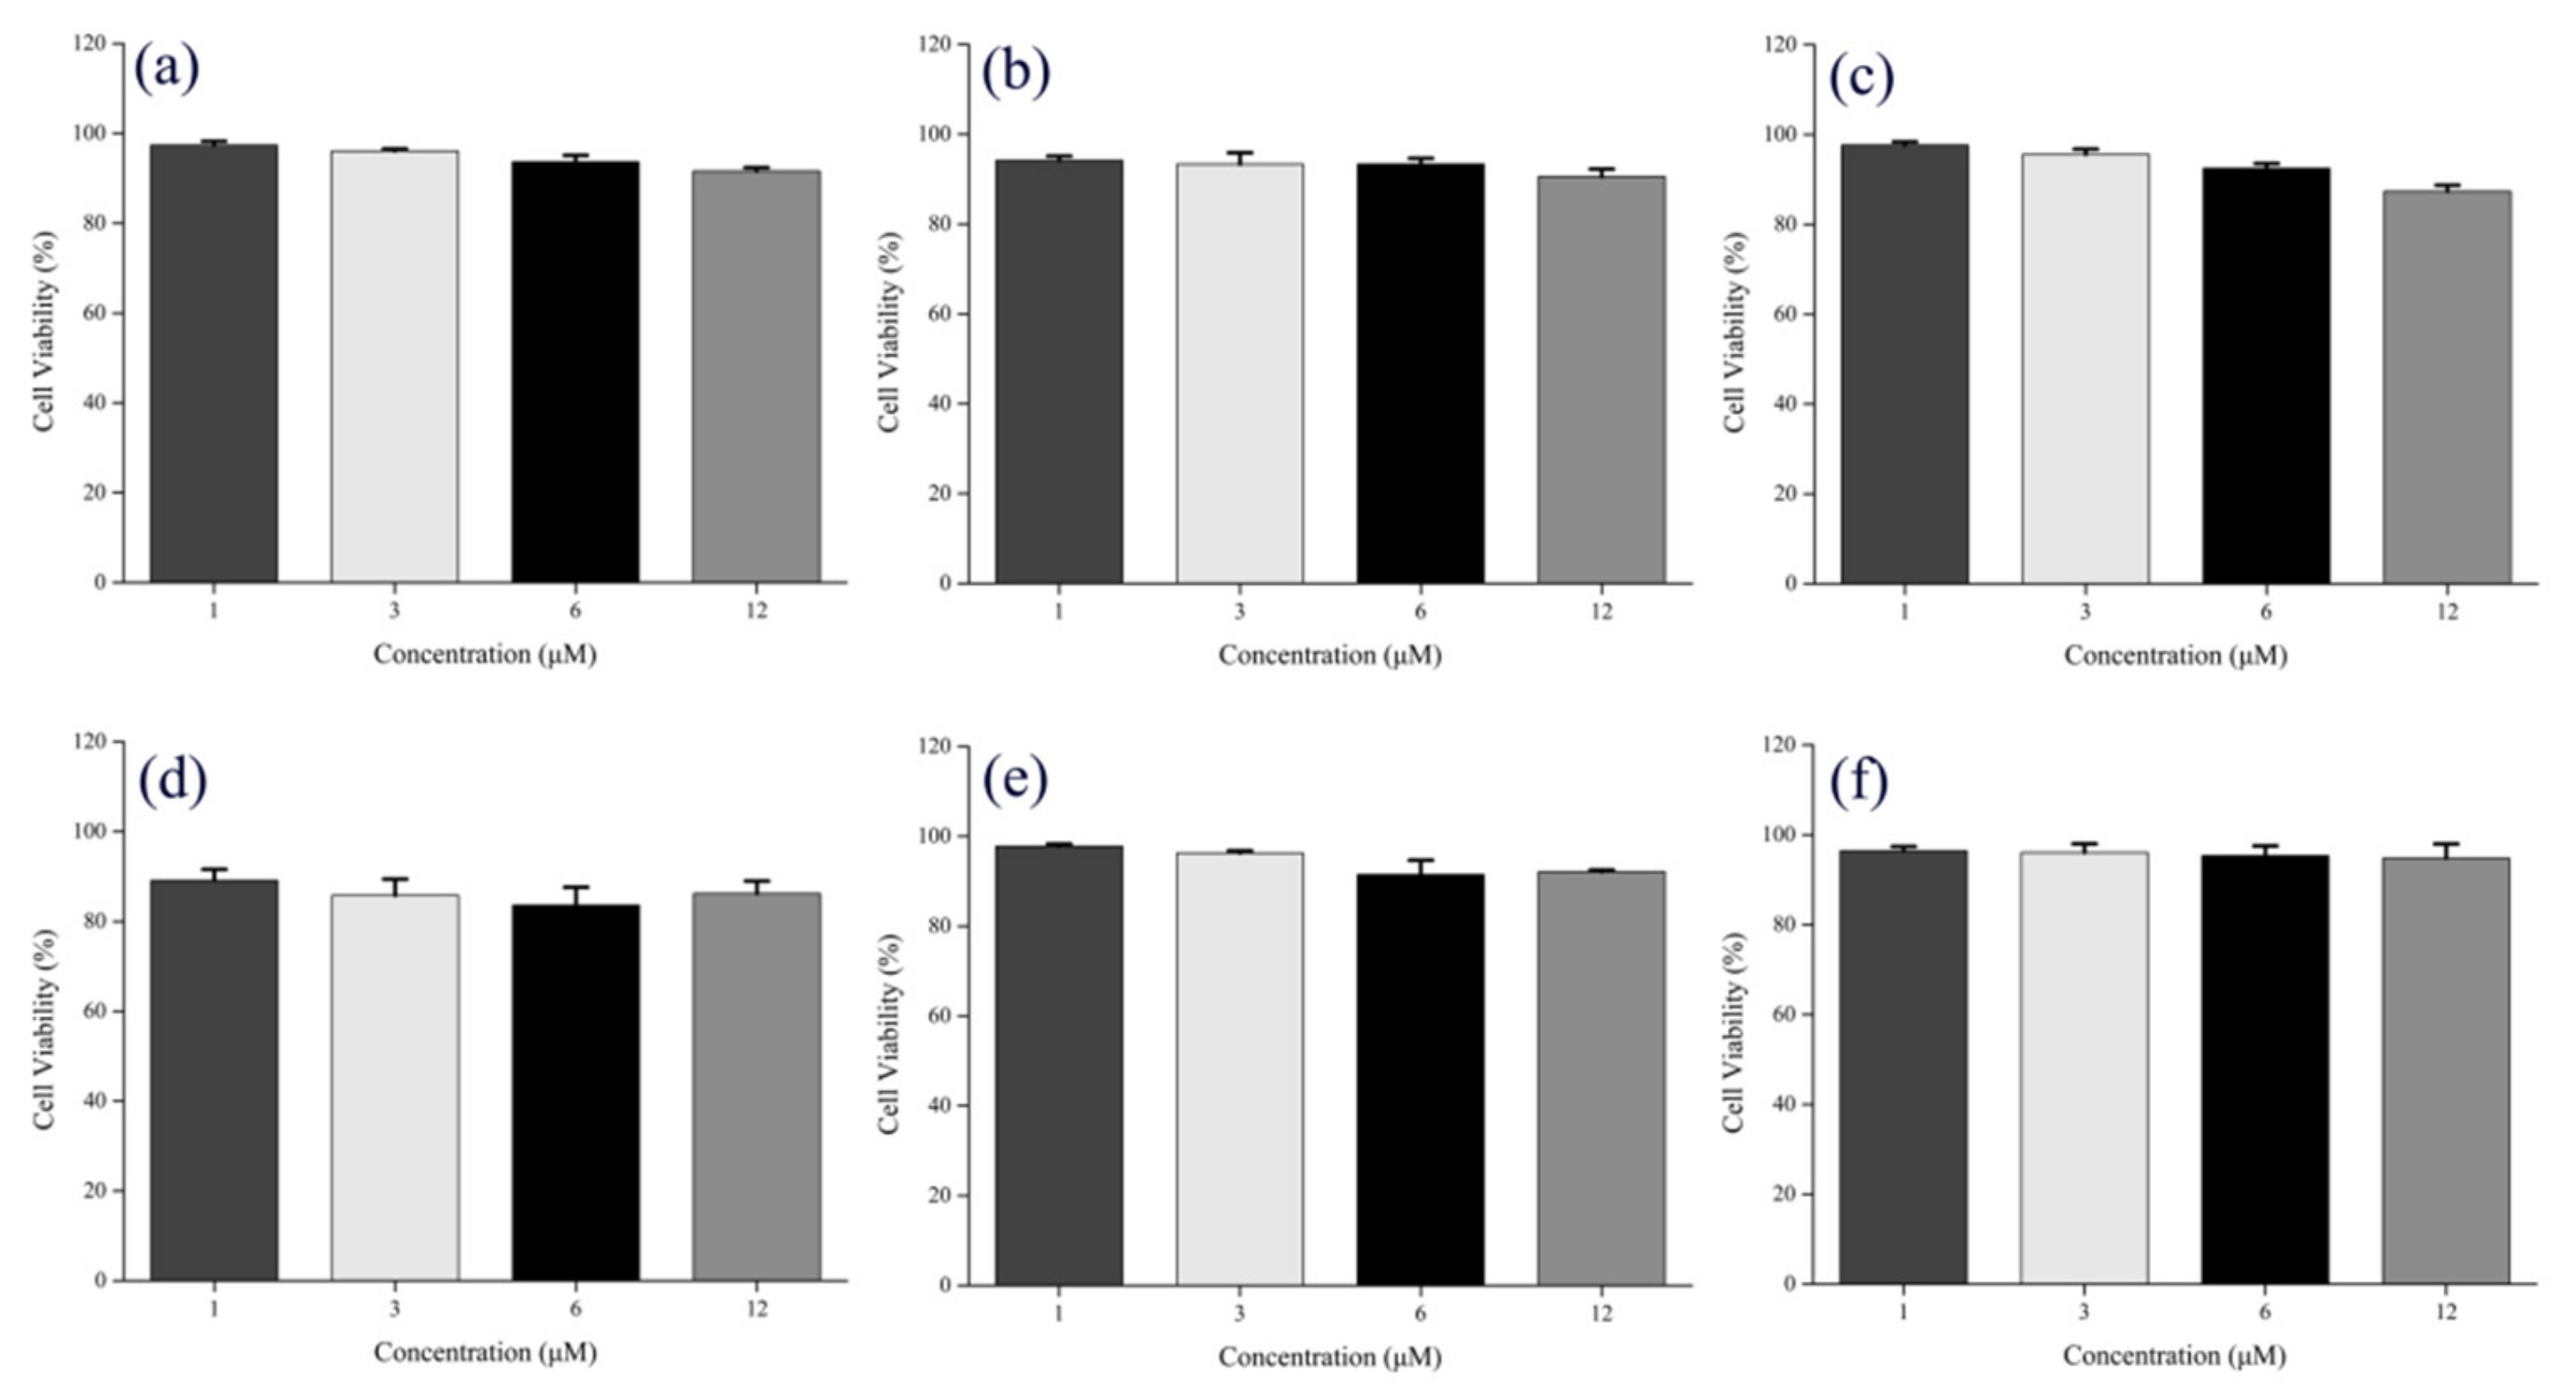
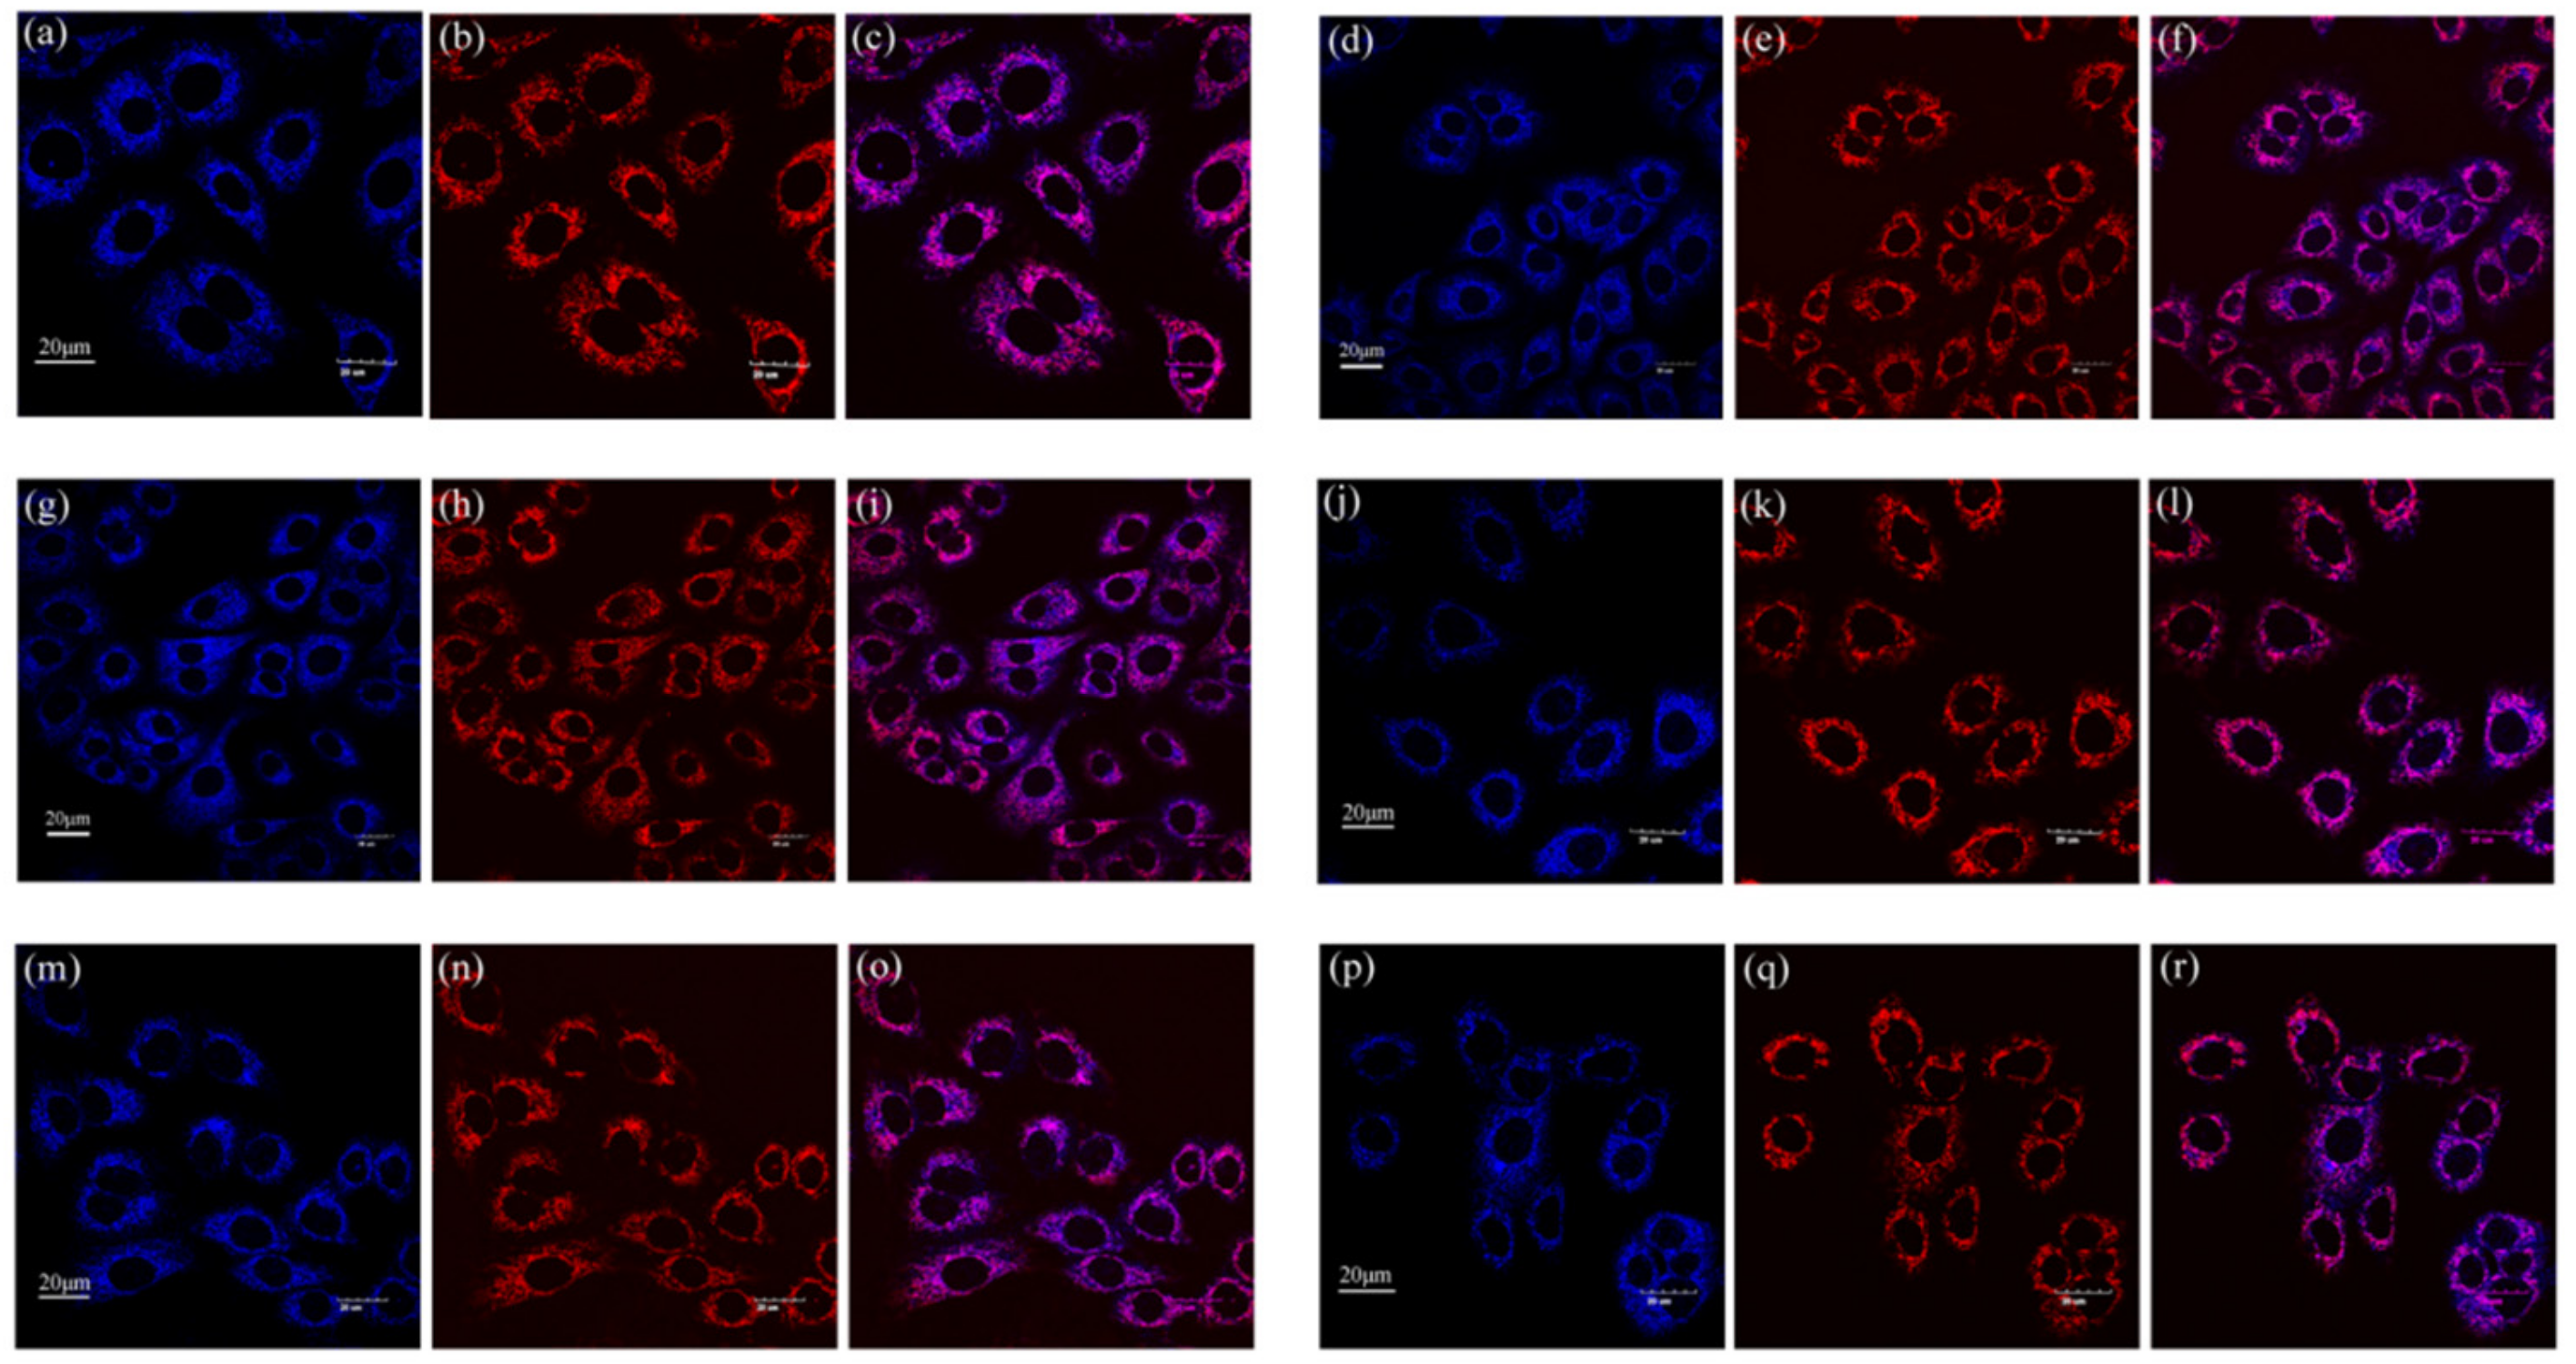
Compounds 111 are all soluble in methanol but insoluble in water. In order to investigate their fluorescence properties, we configured CH3OH/H2O mixed solutions with different water contents (0–90%), respectively, and measured the emission values at room temperature by PL spectra. As shown in Figure 2a, the PL intensity of compound 1 was relatively low in a pure CH3OH solution. As the water contents increased in the mixed solution, the PL intensity gradually increased and reached the maximum when the volume fraction of water was 70%. As can been seen in Figure S1a, the maximum fluorescence intensity of compound 1 with 70% water content was about 15-fold of that in the pure CH3OH solution, indicating that compound 1 exhibits typical AIEE properties [13]. However, as the water fractions increased, the fluorescence intensity showed a tendency to decrease. A possible explanation for this phenomenon is that when water, a poor solvent, was added, the solute molecules could aggregate into two forms: regular nanoparticles and amorphous particles. The regular nanoparticles led to enhanced fluorescence intensity, while the amorphous particles resulted in a decrease in fluorescence intensity [37]. In addition, as shown in Figure S2a, there was a large Stokes shift, which is favorable for its fluorescent labeling properties [38], of about 164 nm. A similar variation trend can be observed in Figure 2b; the maximum PL intensity was about 11-fold of that in 0%. As shown in Figure 2c, the PL intensity gradually increased when the volume fraction of water changed from 0% to 80%, and it reached a maximum when the water content was 80%, with an approximate 11-fold increase compared with the pure methanol solution. As shown in Figure 2d,e, the PL intensity of the main emission peak increased gradually when the water content changed from 0% to 60% but decreased from 60% to 90%. As shown in Figure 2f, the PL intensity reached a maximum when the volume fraction of water was 50%. We speculated that the reason for the attenuation of PL intensity shown in Figure 2b–f was similar to that in Figure 2a. The variation trend of the maximum fluorescence intensity of compounds 26 under different water contents is shown in Figure S1b–f. In summary, compounds 26 were shown to possess AIEE characteristics from these results of the PL spectra. As shown in Figure S2b–f, they also had a large Stokes shift of about 135, 127, 135, 197, and 212 nm, respectively. In addition, we investigated the fluorescence stability properties of compounds 16 by measuring their time-dependent fluorescence spectra. As is shown in Figure S3, with the passage of time, the intensity of the fluorescence spectra of all the compounds had no obvious change, which means that compounds 16 in the CH3OH/H2O mixed solution were stable. This feature provides strong support for their application in other fields. However, as shown in Figure S4a–e, compounds 7–11 exhibited the strongest fluorescence in the pure CH3OH solution and showed an apparent decrease from 0–90%, which means compounds 7–11 are ACQ molecules [39].
In order to further study the AIEE properties of compounds 16, the UV–vis absorption spectra of these compounds in the pure CH3OH solution and CH3OH/H2O mixed solution with 90% water contents were measured. The results are shown in Figure 3. In the pure CH3OH solution, the maximum absorption wavelengths of compounds 16 were 345, 341, 342, 341, 318, and 306 nm, respectively. As the water contents increased to 90%, the maximum absorption peaks of compounds 1, 2, 3, 5 showed a significant red shift, and the absorption peaks of compounds 4 and 6 disappeared, indicating that new aggregated particles formed in the solution with the increase in undesirable solvent (water) [40].
The AIEE properties of compounds 16 can also be proved through their fluorescence photographs under a 365 nm wavelength UV light. As can be observed intuitively from Figure 4a, there was almost no fluorescence emission in the pure CH3OH solution. Interestingly, when the water content increased to 70%, a distinct bright green color was captured. However, the fluorescence emission decreased somewhat as the water content continued to increase to 90%. Similar results can be observed in Figure 4b–f. These results are consistent with the trend seen in the fluorescence spectra results above. In addition, we found that compounds 16 showed different color emissions, including green, blue, and yellow. This phenomenon can be attributed to the fact that they have different substituent groups, which affect the electronic density distribution of the molecule. This indicates that the fluorescence color of chalcone derivatives can be successfully adjusted and controlled by changing the substituent functional groups [41].
In order to further research the AIEE properties of compounds 16, we measured their fluorescence quantum yields (ϕF) in mixed solutions of CH3OH/H2O with different water contents. As shown in Table 2, the ϕF of compound 1 in pure CH3OH solution was only 0.03. Whereas, when the water fraction was 70%, the ϕF increased to 0.59. Subsequently, when the water content continued to increase to 90%, the ϕF decreased slightly to 0.34. Obviously, the variation trend of the fluorescence quantum yield is consistent with the fluorescence spectra results. Similarly, the variation trend of the fluorescence quantum yield of compounds 26 in mixed solutions with different water contents are in accordance with the change trend of the fluorescence spectra. These results further validate that compounds 16 show typical AIEE properties.
In order to explain the AIEE characteristics of compound 16 more directly, the morphology of compounds 16 in the CH3OH/H2O mixed solutions with different water contents was observed by scanning electron microscopy (SEM). In Figure 5a, regular, spherical nanoparticles with small diameters can be directly observed. When the water content increased to 70%, the diameter of the spherical nanoparticles became larger, and they were still uniformly distributed in the solution, as shown in Figure 5b. However, as shown in Figure 5c, when the water content increased to 90%, a large number of amorphous particles gathered in the solution. This may be the reason for the decrease in fluorescence intensity when the water content was 90% [42]. The SEM results of compounds 26 also showed the same change, which indicates that the increase in the diameter of the spherical nanoparticles was conducive to the enhancement of fluorescence intensity. However, when amorphous particles appeared in the solution, the fluorescence emission reduced to a certain extent, which is consistent with the results of the fluorescence spectrum.
In our previous studies, we found that RIR should be the main cause for the AIEE properties of flavonoids and flavanones [24,25]. Therefore, we performed different viscosity tests to explore the AIEE mechanism of compounds 16. By adding ethylene glycol (EG) to change the viscosity of the solution, we measured the fluorescence intensity of the compounds in the CH3OH/EG mixed solution with different EG fractions (0–50%). As shown in Figure 6a, when the EG fractions gradually increased from 0% to 50%, the viscosity of the solution gradually increased, as did the fluorescence intensity. The fluorescence intensity of compounds 26 in the mixed solutions with different viscosities also showed the same variation rule. According to the above experimental results, when the content of EG in the mixed solution increased, the viscosity of the solution gradually increased, which restricted the free rotation within the molecule and enhanced the fluorescence intensity of the mixed solution. Therefore, we speculated that the restriction of intramolecular rotation (RIR) might be the main reason for the AIEE characteristics of compounds 16.

2.2. Cell Imaging

In order to evaluate the application of compounds 16 in the biomedical field, we used an MTT assay to test the cytotoxicity of compounds 16 with different concentrations (1, 3, 6, and 12 µM) on A549 cells, respectively. As shown in Figure 7 below, after 24 h co-incubation of A549 cells with compounds 16, cell viability at various experimental concentrations was more than 80%, which indicates that compounds 16 have low cytotoxicity on and good cytocompatibility with A549 cells at the experimental concentrations. This result indicates the possibility of its practical application in the biomedical field.
The above experimental results indicate that compounds 16 are typical AIEE molecules with good photostability, low cytotoxicity, and good biocompatibility. Therefore, in order to further study the biological applications of compounds 16, cell uptake experiments were carried out. A549 cells were co-cultured with 10 µM compounds 16 in a cell incubator in darkness for 30 min and then washed with PBS buffer three times for confocal imaging. All fluorescence images results are shown in Figure 8. After co-incubating with compounds 16 for 30 min, the cell morphology of A549 cells did not change significantly, and a strong blue fluorescence was observed in the cytoplasm. These results indicate that compounds 16 could be taken up by A549 cells and aggregated in the cytoplasm, which again verified that compounds 16 had good cytocompatibility. In addition, this means that compounds 16 have great application potential in the field of biological imaging.
From the cell uptake experiment results above, we can intuitively observe the strong blue fluorescence in the cytoplasm. Based on our previous studies, both flavonoids and flavanones were specifically aggregated in the mitochondria [24,25]. In order to further study whether chalcones also aggregated in the mitochondria, we conducted a mitochondrial co-localization experiment. A549 cells were co-cultured with compounds 16 (10 µM) and Mito Tracker Deep Red (200 nM) for 30 min in the dark, respectively. After washing three times with PBS buffer, the cells were observed by FV3000 laser scanning confocal microscope (Zeiss) under a 60-fold oil immersion lens. The experimental results are shown in Figure 9. Figure 9a,d,g,j,m,p, with obvious blue fluorescence, are the cell images of compounds 16. In Figure 9b,e,h,k,n,q, MT specifically labels the target organelle mitochondria, and we can see strong red fluorescence in the cytoplasm. In the merged Figure 9c,f,i,l,o,r, it can be seen that the blue fluorescence region emitted by the compounds is highly coincidental with the red fluorescence region emitted by the MT. In order to further accurately analyze the coincidence, cellSens software was used for quantitative analysis, and the results are shown in Table 3 below. The corresponding R values (Pearson correlation coefficient, the coefficient indicating the degree of coincidence, range +1 to −1) of compounds 16 were 0.87, 0.83, 0.87, 0.88, 0.86, and 0.85, respectively, which indicate a high degree of overlap between the compounds and the MT staining regions. The results of the mitochondrial co-localization experiment showed that compounds 16 specifically aggregated in the mitochondria, providing strong support for their practical application in mitochondrial imaging.
The above experimental results indicate that compounds 16 can be used in the field of cell imaging. In order to further study their application in animal imaging, zebrafish were selected as the study object. The advantages of zebrafish as a model organism are outstanding. They have a small body, a short development cycle, and a high level (about 87%) of genetic homology with humans. Moreover, the living embryos are transparent, so we can directly observe the distribution of drugs in zebrafish embryos [43,44,45]. As can be seen from Figure 10, 24 h after administration, blue fluorescence was observed in the yolk of zebrafish embryos. This means that compounds 16 entered the embryo through the embryo membrane within 1 h and mainly concentrated in the yolk sac. After 48 h, we could observe distinct blue fluorescence at the same location in the zebrafish embryos. After 120 h, the zebrafish embryos had developed into normal young fish, and strong blue fluorescence was distributed in the yolk sac and digestive tract of the zebrafish. The above results indicate that AIEE molecules 16 can be applied in in vivo imaging and specifically label the digestive tract of zebrafish.

3. Materials and Methods

3.1. Materials and Instruments

All the regents and analytical grade solvents in this paper were acquired from reagent providers and used without further purification unless otherwise indicated. 2-methoxybenzaldehyde, 3-methoxybenzaldehyde, 4-methoxybenzaldehyde, 4-methoxyacetophenone, 4-methylacetophenone, 4-dimethylaminobenzaldehyde, 4-methylbenzaldehyde, and 3-methylbenzaldehyde were purchased from Aladdin (Shanghai, China). Acetophenone and benzaldehyde were obtained from Macklin (Shanghai, China). Sodium hydroxide (NaOH), ethanol, methanol, and glycol solutions were purchased from Zhiyuan Chemical Reagent Co. Ltd. (Tianjin, China). The high-resolution mass spectra were measured on a Orbitrap Fusion Lumos mass spectrometers (ThermoFisher, Waltham, MA, America). All the consumables and raw materials used in the cell experiment, as well as the related instruments and equipment used throughout the research, can be obtained from reference [25].

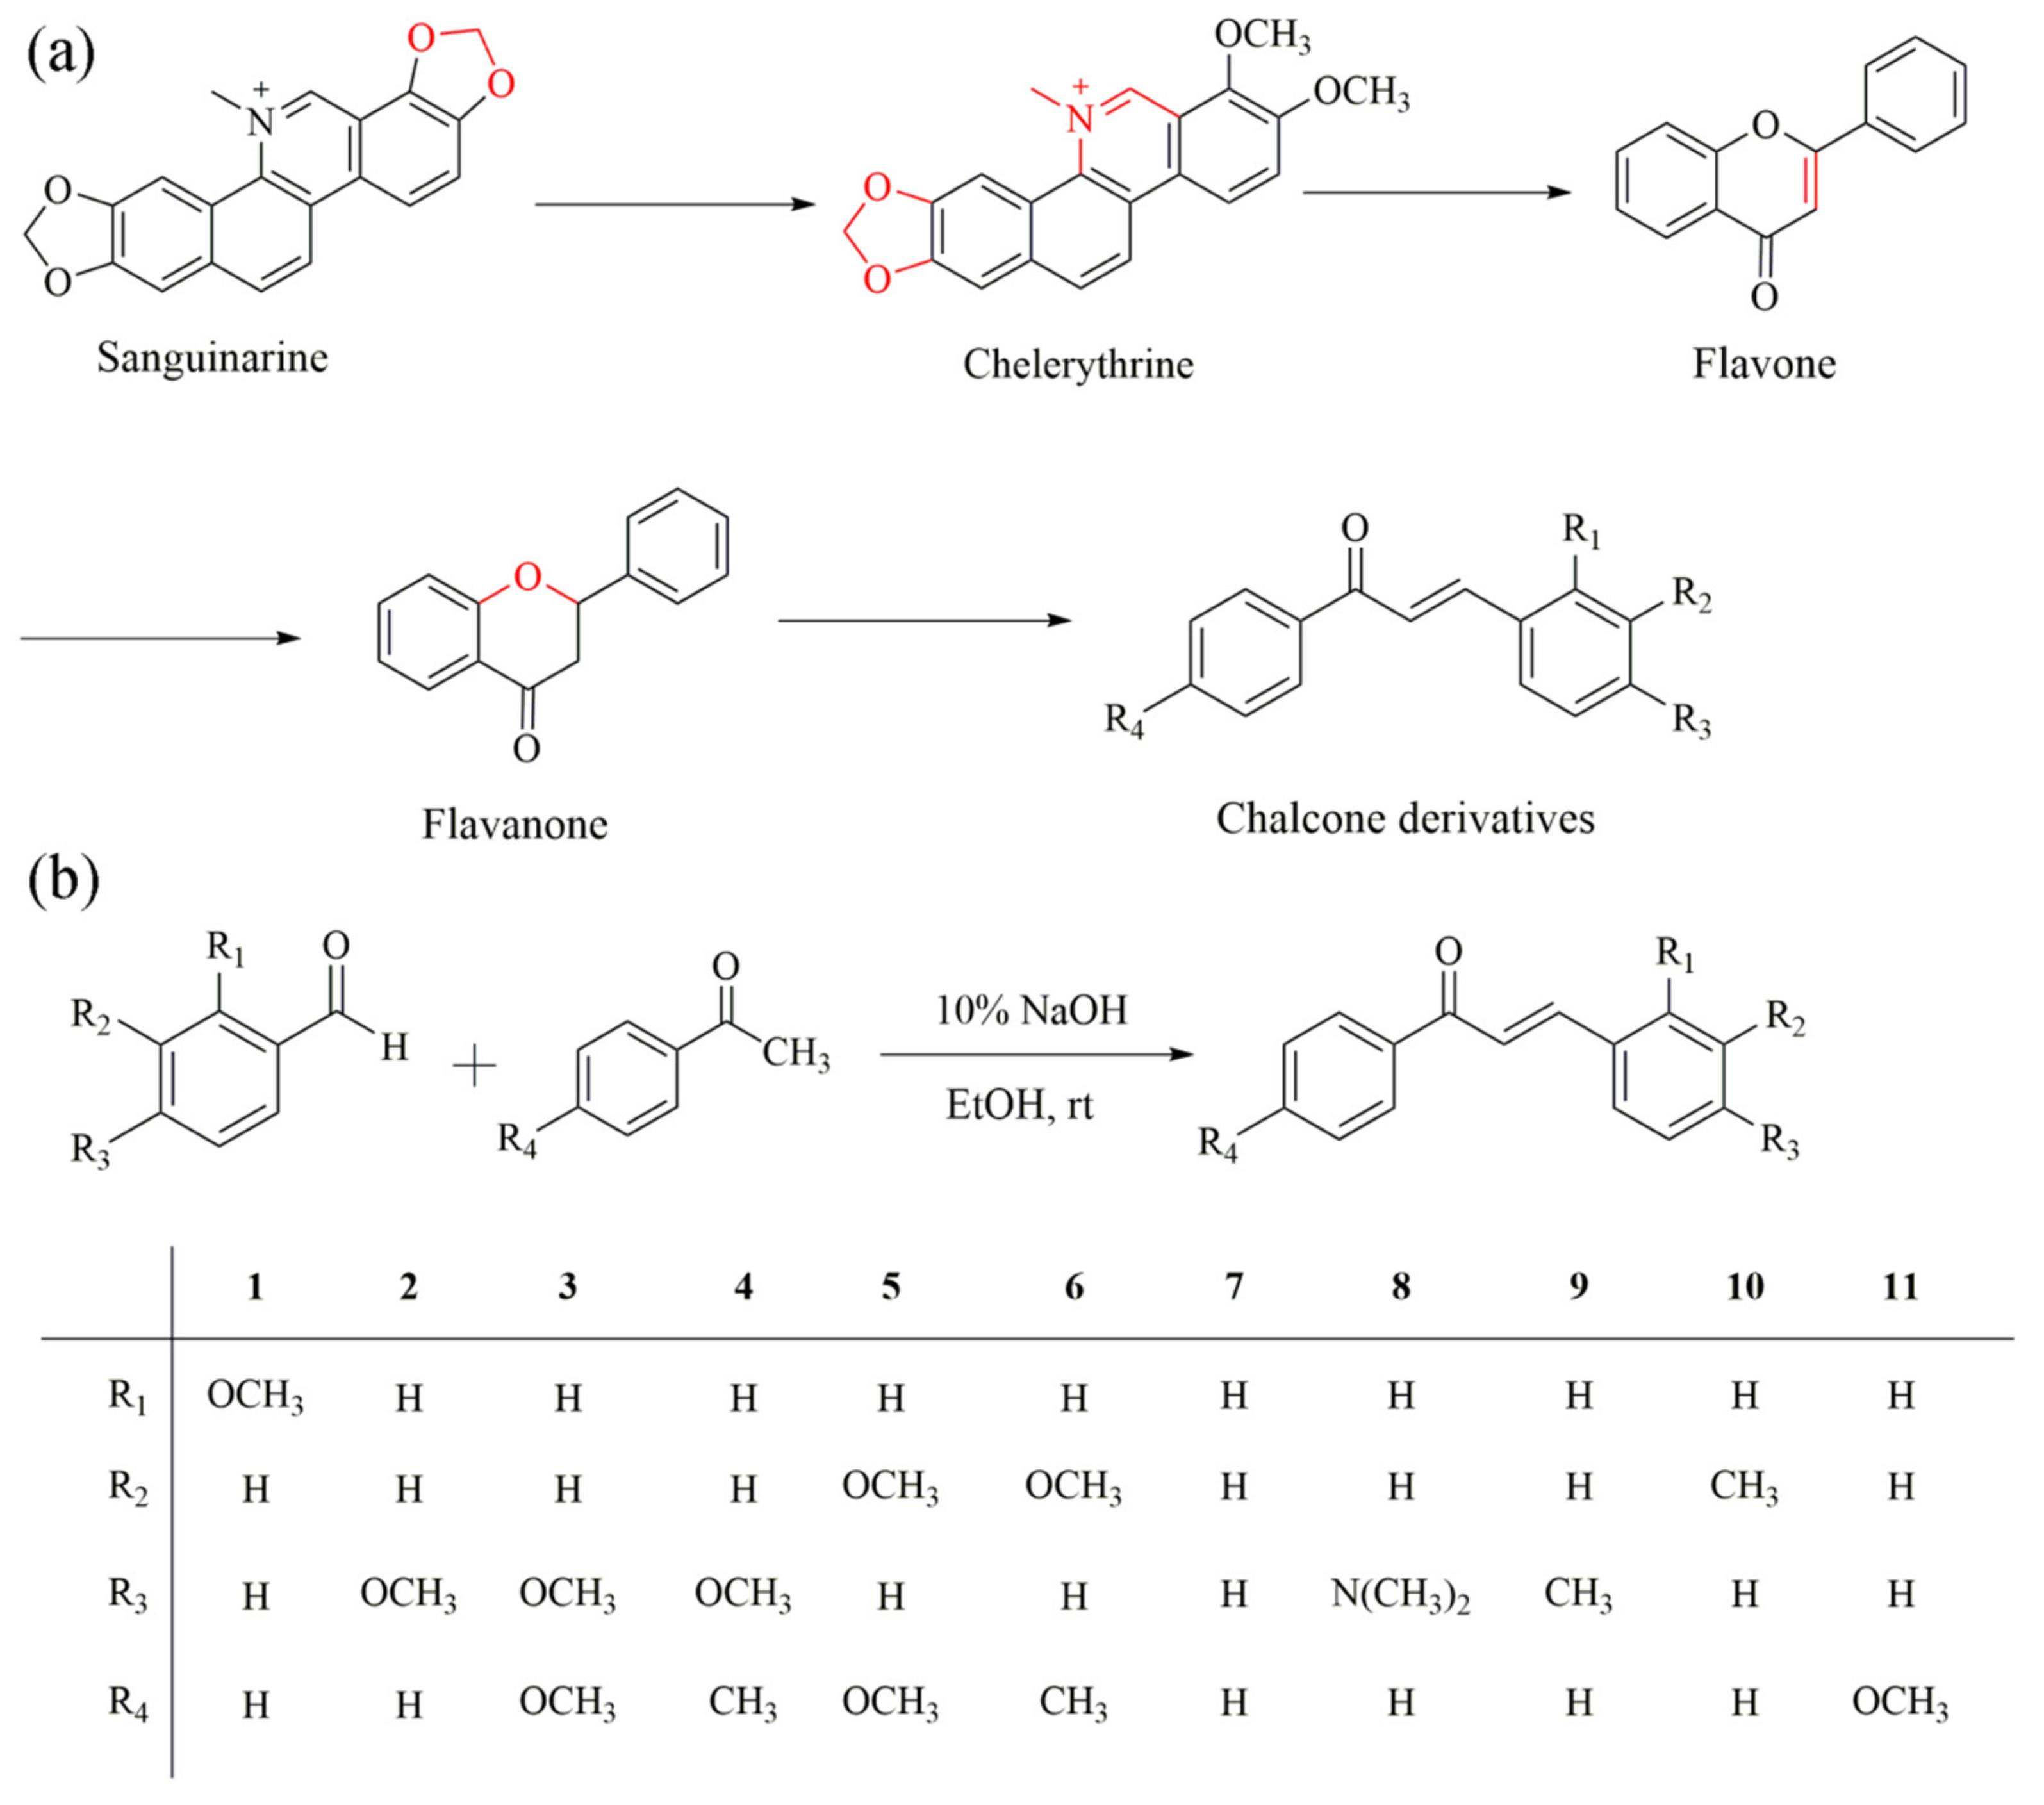
3.2. Synthesis of Chalcones Derivatives

The general synthetic procedure for the chalcone derivatives is shown in Figure 1b. This synthesis has only one step. Under the catalysis of 10% sodium hydroxide, acetophenone and benzaldehyde containing different substitutions undergo the Claisen–Schmidt reaction to produce the corresponding products [46]. During the reaction process, TLC with 10% ethyl acetate/petroleum ether was used as the solvent system to detect the reaction progress until all reactants disappeared. The TLC Rf values of compounds 111 are 0.41, 0.31, 0.22, 0.36, 0.24, 0.42, 0.53, 0.28, 0.53, 0.59, 0.36, respectively. We recrystallized the solids using 95% ethanol to obtain the pure end products. Fortunately, the yields of all the end products was relatively high, with all above 75%. The 1H, 13C-NMR spectra and ESI-MS analysis for compounds 111 can be obtained from the Supplementary Materials Figures S5–S15.

3.2.1. Synthesis of Compound 1

Sodium hydroxide (0.55 g) and water (5 mL) were charged into a 50 mL flask, and then we added a mixture of acetophenone (1.2 mL) and ethanol (3 mL). All reagents were dissolved under a magnetic stirrer. Under this condition, 2-methoxybenzaldehyde (1.36 g) was dissolved in 1 mL ethanol and was added slowly through the dripping funnel. We adjusted the drip rate to maintain the reaction temperature between 25 and 30 °C. After dripping 2-methoxybenzaldehyde, the mixed solution was vigorously stirred at room temperature for about 5 h until there was solid precipitation. Then, we placed the bottle in an ice bath and cooled for 15–30 min until the crystal was completely separated. Then, the white precipitation was collected by vacuum filtration and washed with distilled water until the litmus paper was neutral. Finally, the crude product was recrystallized with 95% ethanol to generate a pure final 2-methoxychalcone product.

3.2.2. Synthesis of Compound 2

Sodium hydroxide (0.55 g) and water (5 mL) were charged into a 50 mL flask, and then we added a mixture of acetophenone (1.2 mL) and ethanol (3 mL). All reagents were dissolved under a magnetic stirrer. Under this condition, 4-methoxybenzaldehyde (1.2 mL) was dissolved in 1 mL ethanol and was added slowly through the dripping funnel. The latter operation was the same as that in Section 3.2.1. Finally, we obtained the target 4-methoxychalcone product.

3.2.3. Synthesis of Compound 3

Sodium hydroxide (0.55 g) and water (5 mL) were charged into a 50 mL flask, and then, we added a mixture of 4-methoxyacetophenone (1.65 g) and ethanol (3 mL). All reagents were dissolved under a magnetic stirrer. Under this condition, 4-methoxybenzaldehyde (1.2 mL) was dissolved in 1 mL ethanol and was added slowly through the dripping funnel. The latter operation was the same as that in Section 3.2.1. Finally, we obtained the target 4-methoxy-4′-methoxychalcone product.

3.2.4. Synthesis of Compound 4

Sodium hydroxide (0.55 g) and water (5 mL) were charged into a 50 mL flask, and then we added a mixture of 4-methylacetophenone (1.46 mL) and ethanol (3 mL). All reagents were dissolved under a magnetic stirrer. Under this condition, 4-methoxybenzaldehyde (1.2 mL) was dissolved in 1 mL ethanol and was added slowly through the dripping funnel. The latter operation was the same as that in Section 3.2.1. Finally, we obtained the target 4-methoxy-4′-methyl chalcone product.

3.2.5. Synthesis of Compound 5

Sodium hydroxide (0.55 g) and water (5 mL) were charged into a 50 mL flask, and then we added the mixture of 4-methoxyacetophenone (1.65 g) and ethanol (3 mL). All reagents were dissolved under a magnetic stirrer. Under this condition, 3-methoxybenzaldehyde (1.2 mL) was dissolved in 1 mL ethanol and was added slowly through the dripping funnel. The latter operation was the same as that in Section 3.2.1. Finally, we obtained the target 3-methoxy-4′-methoxychalcone product.

3.2.6. Synthesis of Compound 6

Sodium hydroxide (0.55 g) and water (5 mL) were charged into a 50 mL flask, and then we added a mixture of 4-methylacetophenone (1.46 mL) and ethanol (3 mL). All reagents were dissolved under a magnetic stirrer. Under this condition, 3-methoxybenzaldehyde (1.2 mL) was dissolved in 1 mL ethanol and was added slowly through the dripping funnel. The latter operation was the same as that in Section 3.2.1. Finally, we obtained the target 3-methoxy-4′-methyl chalcone product.

3.2.7. Synthesis of Compound 7

Sodium hydroxide (0.55 g) and water (5 mL) were charged into a 50 mL flask, and then we added a mixture of acetophenone (1.2 mL) and ethanol (3 mL). All reagents were dissolved under a magnetic stirrer. Under this condition, benzaldehyde (1 mL) was dissolved in 1 mL ethanol and was added slowly through the dripping funnel. The latter operation was the same as that in Section 3.2.1. Finally, we obtained the target chalcone product.

3.2.8. Synthesis of Compound 8

Sodium hydroxide (0.55 g) and water (5 mL) were charged into a 50 mL flask, and then we added a mixture of acetophenone (1.2 mL) and ethanol (3 mL). All reagents were dissolved under a magnetic stirrer. Under this condition, 4-dimethylaminobenzaldehyde (1.5 g) was dissolved in 1 mL ethanol and was added slowly through the dripping funnel. The latter operation was the same as that in Section 3.2.1. Finally, we obtained the target 4-dimethylaminochalcone product.

3.2.9. Synthesis of Compound 9

Sodium hydroxide (0.55 g) and water (5 mL) were charged into a 50 mL flask, and then we added a mixture of acetophenone (1.2 mL) and ethanol (3 mL). All reagents were dissolved under a magnetic stirrer. Under this condition, 4-methylbenzaldehyde (1.2 mL) was dissolved in 1 mL ethanol and was added slowly through the dripping funnel. The latter operation was the same as that in Section 3.2.1. Finally, we obtained the target 4-methyl chalcone product.

3.2.10. Synthesis of Compound 10

Sodium hydroxide (0.55 g) and water (5 mL) were charged into a 50 mL flask, and then we added a mixture of acetophenone (1.2 mL) and ethanol (3 mL). All reagents were dissolved under a magnetic stirrer. Under this condition, 3-methylbenzaldehyde (1.2 mL) was dissolved in 1 mL ethanol and was added slowly through the dripping funnel. The latter operation was the same as that in Section 3.2.1. Finally, we obtained the target 3-methyl chalcone product.

3.2.11. Synthesis of Compound 11

Sodium hydroxide (0.55 g) and water (5 mL) were charged into a 50 mL flask, and then we added the mixture of 4-methoxyacetophenone (1.5 g) and ethanol (3 mL). All reagents were dissolved under a magnetic stirrer. Under this condition, benzaldehyde (1 mL) was dissolved in 1 mL ethanol and was added slowly through the dripping funnel. The latter operation was the same as that in Section 3.2.1. Finally, we obtained the target 4′-methoxychalcone product.

3.2.12. Characterization of Compounds 111

2-Methoxychalcone (1), yield: 89%; slight yellow solid, m.p.: 59–60 °C; 1H NMR (500 MHz, CDCl3) δ 8.12 (d, J = 15.9 Hz, 1H), 8.06–7.98 (m, 2H), 7.66–7.64 (m, 1H), 7.62 (d, J = 12.4 Hz, 1H), 7.58 (t, J = 7.4 Hz, 1H), 7.50 (t, J = 7.5 Hz, 2H), 7.43–7.34 (m, 1H), 7.00 (t, J = 7.5 Hz, 1H), 6.95 (d, J = 8.3 Hz, 1H), 3.92 (s, 3H); 13C NMR (126 MHz, CDCl3) δ 191.17, 158.82, 140.43, 138.53, 132.54, 131.76, 129.25, 128.54, 123.94, 122.89, 120.75, 111.24, 55.55; HRMS (ESI-MS) m/z calcd for C16H15O2 [M + H]+: 239.10666; found: 239.10677.
4-Methoxychalcone (2), yield: 92%; slight yellow solid, m.p.: 75–76 °C; 1H NMR (500 MHz, CDCl3) δ 8.03–7.99 (m, 2H), 7.79 (d, J = 15.6 Hz, 1H), 7.62–7.55 (m, 3H), 7.50 (t, J = 7.6 Hz, 2H), 7.42 (d, J = 15.6 Hz, 1H), 6.96–6.92 (m, 2H), 3.85 (s, 3H); 13C NMR (126 MHz, CDCl3) δ 190.62, 161.69, 144.73, 138.50, 132.57, 130.24, 128.57, 128.42, 127.61, 119.78, 114.43, 55.42; HRMS (ESI-MS) m/z calcd for C16H15O2 [M + H]+: 239.10666; found: 239.10674.
4-Methoxy-4′-methoxychalcone (3), yield: 75%; slight yellow solid, m.p.: 101–102 °C; 1H NMR (500 MHz, CDCl3) δ 8.03 (d, J = 8.7 Hz, 2H), 7.78 (d, J = 15.6 Hz, 1H), 7.60 (d, J = 8.6 Hz, 2H), 7.43 (d, J = 15.6 Hz, 1H), 6.98 (d, J = 8.7 Hz, 2H), 6.94 (d, J = 8.6 Hz, 2H), 3.89 (s, 3H), 3.86 (s, 3H); 13C NMR (126 MHz, CDCl3) δ 188.75, 163.27, 161.51, 143.80, 131.35, 130.70, 130.10, 127.81, 119.54, 114.38, 113.78, 55.47, 55.39; HRMS (ESI-MS) m/z calcd for C17H17O3 [M + H]+: 269.11722; found: 269.11728.
4-Methoxy-4′-methylchalcone (4), yield: 78%; slight yellow solid, m.p.: 90–93 °C; 1H NMR (500 MHz, CDCl3) δ 7.93 (d, J = 8.1 Hz, 2H), 7.78 (d, J = 15.6 Hz, 1H), 7.60 (d, J = 8.7 Hz, 2H), 7.42 (d, J = 15.6 Hz, 1H), 7.30 (d, J = 8.0 Hz, 2H), 6.94 (d, J = 8.7 Hz, 2H), 3.86 (s, 3H), 2.43 (s, 3H); 13C NMR (126 MHz, CDCl3) δ 190.06, 161.59, 144.25, 143.37, 135.90, 130.17, 129.27, 128.57, 127.73, 119.78, 114.40, 55.40, 21.66; HRMS (ESI-MS) m/z calcd for C17H17O2 [M + H]+: 253.12231; found: 253.12238.
3-Methoxy-4′-methoxychalcone (5), yield: 83%; slight yellow solid, m.p.: 103–104 °C; 1H NMR (500 MHz, CDCl3) δ 8.04 (d, J = 8.8 Hz, 2H), 7.76 (d, J = 15.6 Hz, 1H), 7.52 (d, J = 15.6 Hz, 1H), 7.33 (t, J = 7.9 Hz, 1H), 7.24 (d, J = 7.7 Hz, 1H), 7.16 (s, 1H), 6.99 (d, J = 8.8 Hz, 2H), 6.96 (dd, J = 8.2, 2.4 Hz, 1H), 3.89 (s, 3H), 3.86 (s, 3H); 13C NMR (126 MHz, CDCl3) δ 188.72, 163.45, 159.93, 143.88, 136.47, 131.06, 130.84, 129.91, 122.19, 121.00, 116.06, 113.86, 113.41, 55.50, 55.35; HRMS (ESI-MS) m/z calcd for C17H17O3 [M + H]+: 269.11722; found: 269.11723.
3-Methoxy-4′-methyl chalcone (6), yield: 81%; slight yellow solid, m.p.: 65–67 °C; 1H NMR (500 MHz, CDCl3) δ 7.93 (d, J = 8.1 Hz, 2H), 7.76 (d, J = 15.7 Hz, 1H), 7.51 (d, J = 15.7 Hz, 1H), 7.34 (d, J = 7.9 Hz, 1H), 7.31 (d, J = 8.1 Hz, 2H), 7.24 (d, J = 7.7 Hz, 1H), 7.16 (s, 1H), 6.96 (dd, J = 8.2, 2.3 Hz, 1H), 3.86 (s, 3H), 2.44 (s, 3H); 13C NMR (126 MHz, CDCl3) δ 190.03, 159.94, 144.31, 143.67, 136.38, 135.60, 129.93, 129.34, 128.67, 122.42, 121.05, 116.17, 113.43, 55.35, 21.68; HRMS (ESI-MS) m/z calcd for C17H17O2 [M + H]+: 253.12231; found: 253.12239.
Chalcone (7), yield: 89%; slight yellow solid, m.p.: 59 °C; 1H NMR (500 MHz, CDCl3) δ 8.07–7.97 (m, 2H), 7.82 (d, J = 15.7 Hz, 1H), 7.65 (dd, J = 6.1, 2.8 Hz, 2H), 7.61–7.57 (m, 1H), 7.54 (d, J = 14.3 Hz, 1H), 7.53–7.48 (m, 2H), 7.47–7.36 (m, 3H); 13C NMR (101 MHz, CDCl3) δ 189.52, 143.81, 137.16, 133.83, 131.76, 129.52, 127.93, 127.60, 127.47, 127.42, 121.04; HRMS (ESI-MS) m/z calcd for C15H13O [M + H]+: 209.09609; found: 209.09619.
4-Dimethylaminochalcone (8), yield: 76%; bright orange solid, m.p.: 113–114 °C; 1H NMR (500 MHz, CDCl3) δ 8.00 (d, J = 6.9 Hz, 2H), 7.79 (d, J = 15.5 Hz, 1H), 7.57 (dd, J = 15.3, 7.7 Hz, 3H), 7.49 (t, J = 7.1 Hz, 2H), 7.37 (d, J = 15.5 Hz, 1H), 7.02–6.69 (m, 2H), 3.07 (s, 6H); 13C NMR (126 MHz, CDCl3) δ 190.71, 151.95, 145.83, 139.06, 132.15, 130.41, 128.45, 128.31, 122.77, 117.00, 111.93, 40.19; HRMS (ESI-MS) m/z calcd for C17H18ON [M + H]+: 252.13829; found: 252.13837.
4-Methyl chalcone (9), yield: 85%; slight yellow solid, m.p.: 93 °C; 1H NMR (500 MHz, CDCl3) δ 8.05–7.98 (m, 2H), 7.80 (d, J = 15.7 Hz, 1H), 7.58 (t, J = 7.4 Hz, 1H), 7.55 (d, J = 8.1 Hz, 2H), 7.53–7.50 (m, 2H), 7.49 (d, J = 4.6 Hz, 1H), 7.23 (d, J = 7.9 Hz, 2H), 2.40 (s, 3H); 13C NMR (101 MHz, CDCl3) δ 189.64, 143.93, 140.07, 137.32, 131.65, 131.11, 128.68, 127.56, 127.46, 127.44, 120.05, 20.51; HRMS (ESI-MS) m/z calcd for C16H15O [M + H]+: 223.11174; found: 223.11177.
3-Methyl chalcone (10), yield: 81%; slight yellow solid, m.p.: 63 °C; 1H NMR (500 MHz, CDCl3) δ 8.05–8.01 (m, 2H), 7.79 (d, J = 15.7 Hz, 1H), 7.62–7.56 (m, 1H), 7.53 (d, J = 7.6 Hz, 1H), 7.50 (d, J = 7.1 Hz, 2H), 7.46 (d, J = 7.4 Hz, 2H), 7.32 (t, J = 7.9 Hz, 1H), 7.24 (d, J = 7.6 Hz, 1H), 2.41 (s, 3H); 13C NMR (101 MHz, CDCl3) δ 189.58, 144.05, 137.60, 137.23, 133.80, 131.71, 130.40, 128.02, 127.82, 127.58, 127.47, 124.69, 120.85, 20.32; HRMS (ESI-MS) m/z calcd for C16H15O [M + H]+: 223.11174; found: 223.11178.
4′-Methoxychalcone (11), yield: 88%; slight yellow solid, m.p.: 96 °C; 1H NMR (500 MHz, CDCl3) δ 8.05 (d, J = 8.9 Hz, 2H), 7.81 (d, J = 15.7 Hz, 1H), 7.67–7.62 (m, 2H), 7.55 (d, J = 15.7 Hz, 1H), 7.45–7.39 (m, 3H), 6.99 (d, J = 8.9 Hz, 2H), 3.89 (s, 3H); 13C NMR (101 MHz, CDCl3) δ 187.69, 162.40, 142.94, 134.04, 130.04, 129.79, 129.31, 127.89, 127.33, 120.83, 112.82, 54.46; HRMS (ESI-MS) m/z calcd for C16H15O2 [M + H]+: 239.10666; found: 239.10677.

3.3. Preparatory Work before UV–Vis Spectra, PL Spectra, and SEM Measurements

3.3.1. Preparatory Work before UV–Vis Spectra and PL Spectra Measurements

Compounds 111 were weighed accurately using electronic scales: 0.50, 0.50, 0.56, 0.53, 0.56, 0.53, 0.44, 0.53, 0.47, 0.47, and 0.50 mg. Then, they were each dissolved in a methanol solution (10 mL) and mixed well. The final concentration of each solution was 2.07 × 10⁻⁴ M. Then, each mother solution was diluted with different amounts of water and methanol. Finally, the solutions with a water fraction from 0 to 90 vol % were prepared at a concentration of 2.07 × 10⁻⁵ M. After being sonicated for 15 min, the solutions were measured immediately at room temperature to obtain the UV-vis absorption spectra and the PL spectra at their excitation wavelengths of 350, 345, 348, 345, 360, 363, 313, 429, 326, 318, and 318 nm, respectively. The sample preparation method for the fluorescence quantum yield (ϕF) test of compounds 16 was conducted in the same manner as described above.

3.3.2. Preparatory Work before SEM Measurements

All samples were configured in the same way as described in Section 3.3.1. Compounds 1 and 2 were prepared in a CH3OH/H2O mixture with different water fractions of 50%, 70%, and 90%, respectively. Compound 3 was prepared in a CH3OH/H2O mixture with different water fractions of 50%, 80% and 90%, respectively. Compounds 4, 5, and 6 were prepared in a CH3OH/H2O mixture with different water fractions of 50%, 60%, and 90%, respectively. After sonication for 15 min, the mixed solutions were added carefully to silicon wafers, separately. After being left at room temperature for 24 h, the silicon wafers had evaporated and were tested by scanning electron microscopy (SEM) afterwards.

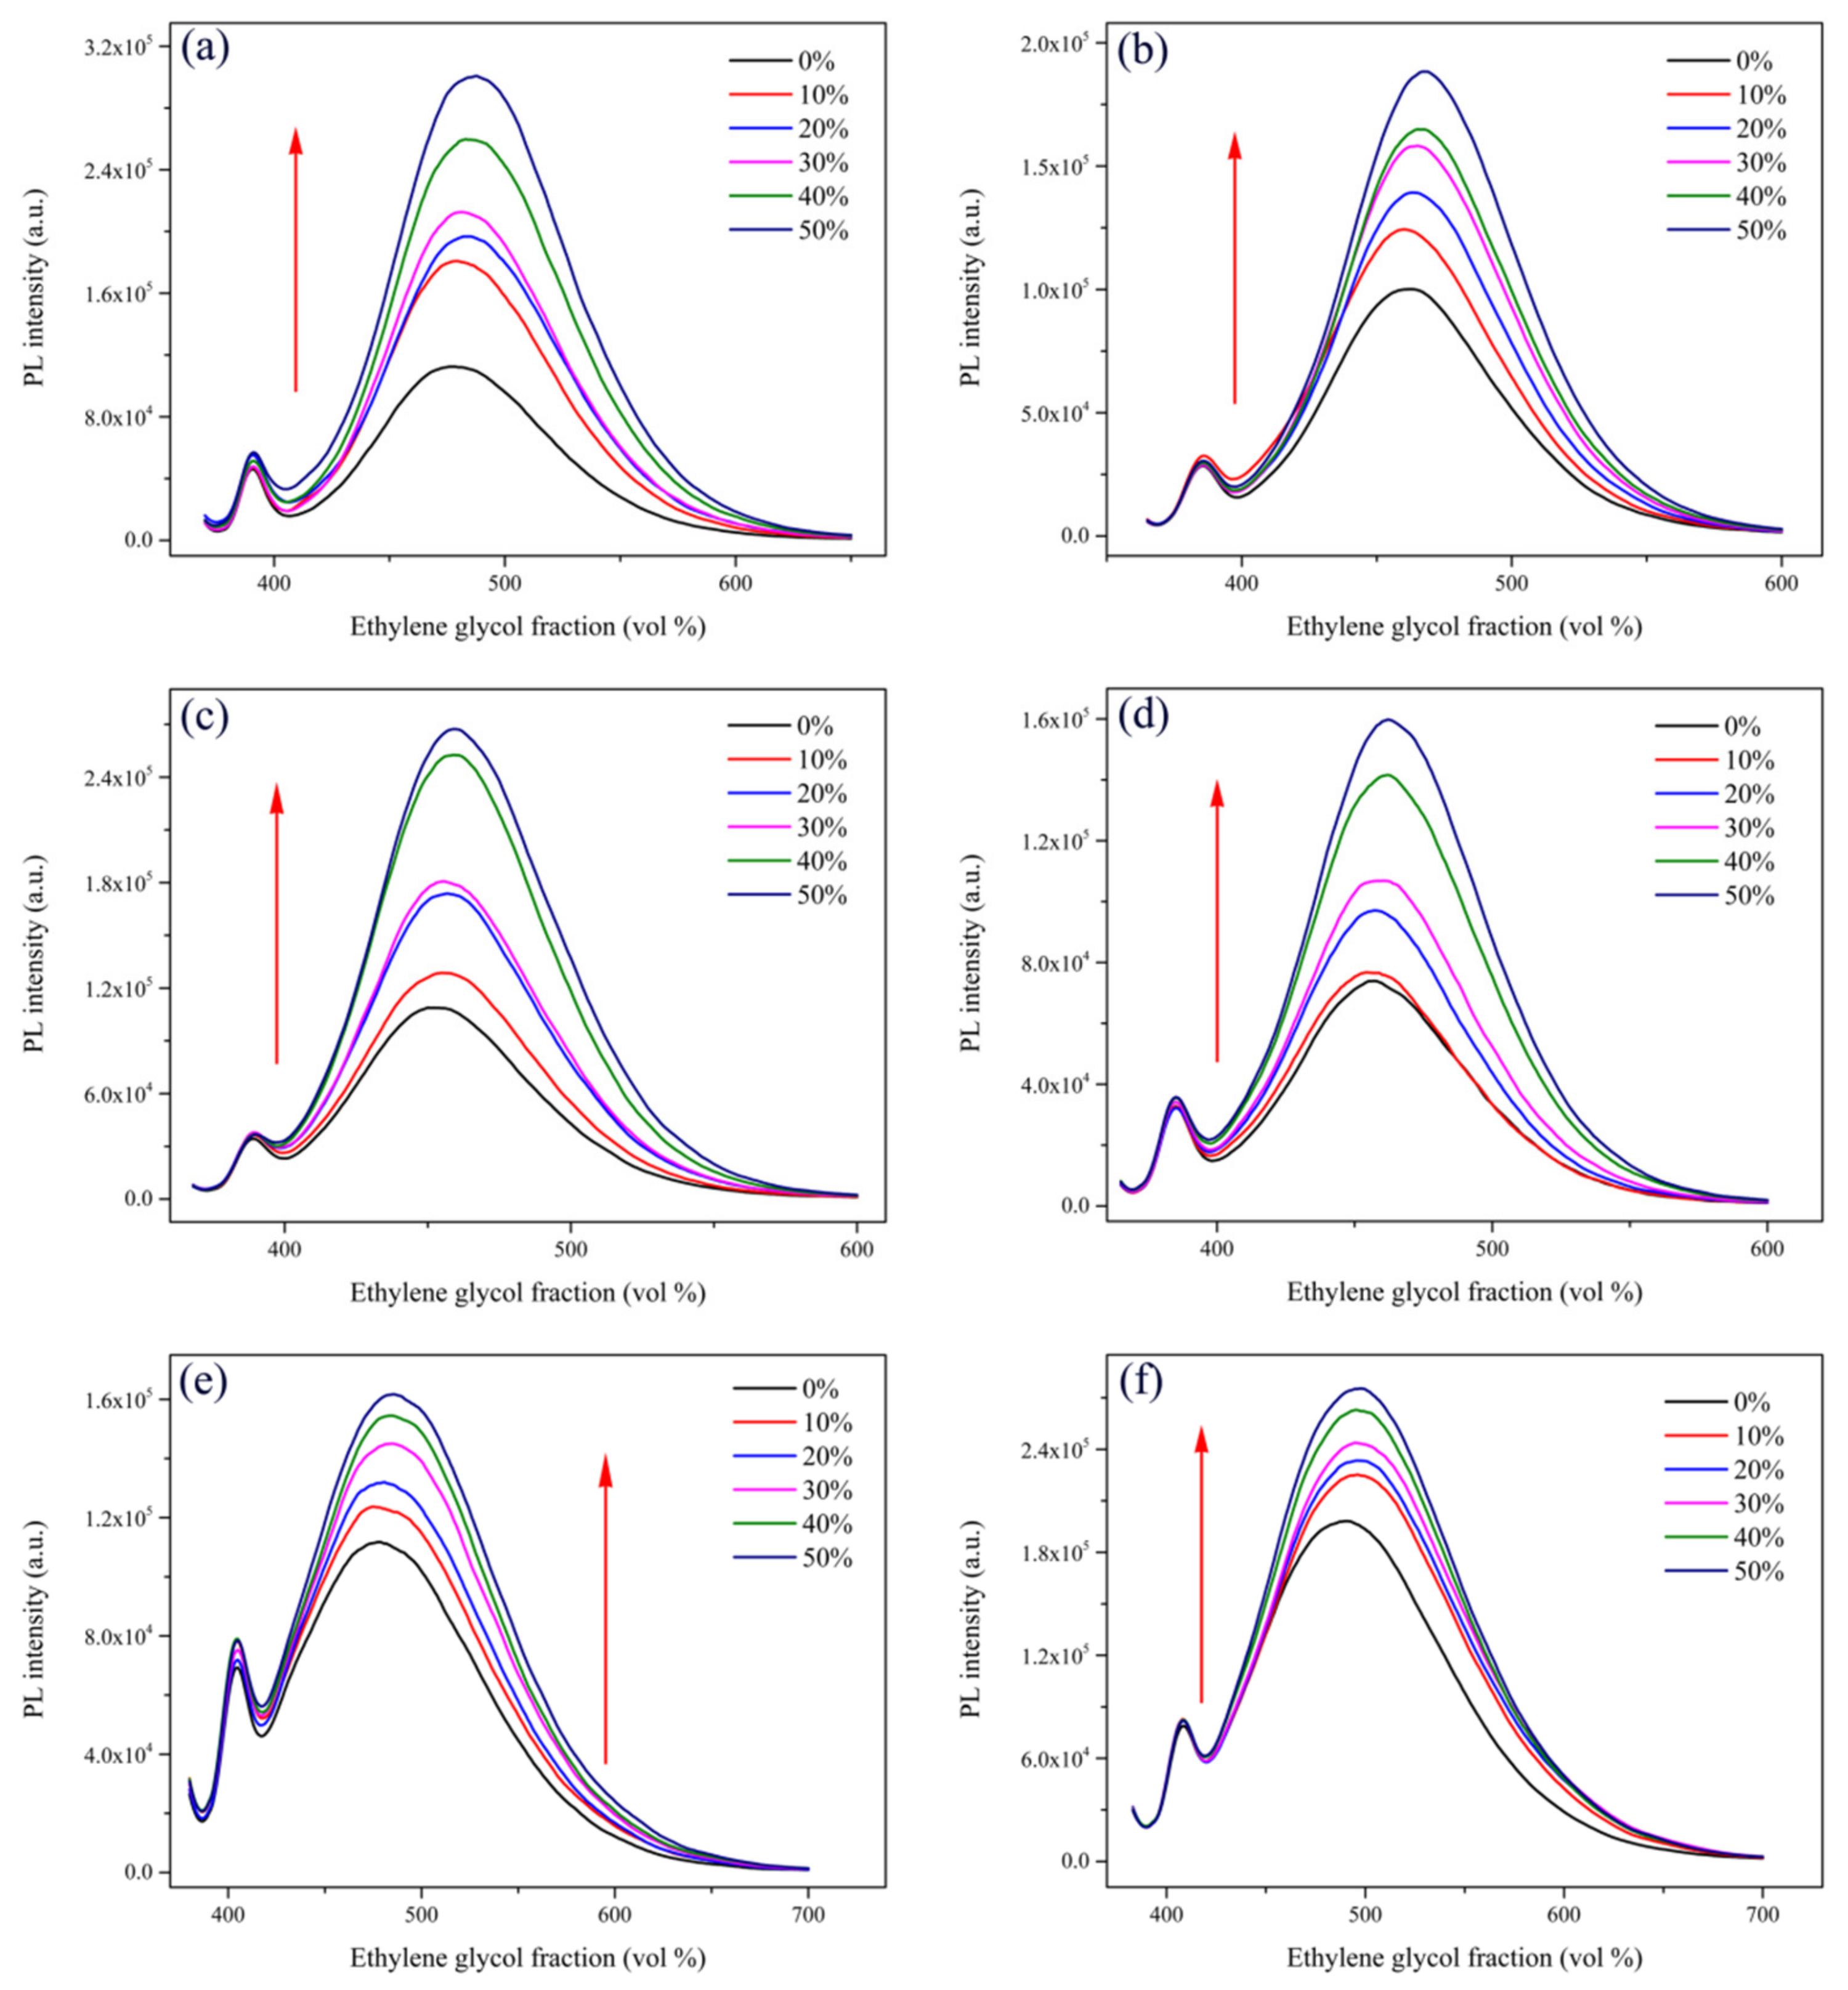
3.4. Preparatory Work before Ethylene Glycol (EG) Measurements

Compounds 16 were dissolved in a methanol solution, respectively, and mixed well with a final concentration of 2.07 × 10⁻⁴ M. Then, we diluted the solution with different EG fractions (fw = 0%, 10%, 20%, 30%, 40%, 50%) of EG/CH3OH mixed solutions to ensure a final concentration of 2.07 × 10⁻⁵ M. The above solution was sonicated for 15 min. Then, we immediately measured their PL spectra at room temperature with excitation wavelengths of 350, 345, 348, 345, 360, and 363 nm, respectively.

3.5. Cell Culture

RPMI-1640 culture medium containing 10% fetal bovine serum (FBS), 10 mg/mL streptomycin, and 10 mg/mL penicillin was used for culturing the A549 cells in the cell culture incubator with 5% CO2 and 90% humidity at 37 °C.

3.6. Evaluation of Cell Viability

A549 cells in the logarithmic growth phase were transferred to 96-well plates, and there were about 9 × 10³ cells in each well. The 96-well plates were placed in an incubator for 24 h. Then, we transferred the preconfigured sample solutions of compounds 16 of different concentrations (1, 3, 6, 12 µM) to each well, respectively After culturing the cells in an incubator for 24 h, we added 20 μL 0.5% MTT solution to each well. After incubation for 4 h, the excess solution in each well was sucked out carefully. Then, 150 μL DMSO solution was added to each well and shaken through a shaker for 10 min until the crystals were completely dissolved. The absorbance value at 490 nm of the plates was measured by a microplate reader (Synergy H1).

3.7. Cell Imaging

A549 cells in the logarithmic growth phase were transferred to glass bottom dishes with a density in each dish of 1 × 10⁵. The cells grew in the cell culture incubator for 24 h. Then, we added the sample solution of compounds 16 with a concentration of 10 μM to each dish, respectively. After 30 min of dark incubation, the solution in the dishes was carefully sucked out with pipetting gun and washed with PBS buffer for three times. Finally, we added 1 mL PBS buffer to each dish and observed them under a 60-fold oil immersion lens using an FV3000 laser scanning confocal microscope (Zeiss). The procedure of mitochondrial colocalization imaging was similar to the above procedure. After the A549 cells were transferred to glass bottom dishes and cultivated in cell incubators for 24 h, the mixed solutions of compounds 16 (10 µM) and Mito Tracker Red (MT) (200 nM) were added, respectively. After 30 min of dark incubation in the incubator, the solution was sucked out carefully, and the dishes were washed three times by PBS buffer. Finally, 1 mL PBS buffer was added to each dish, and they were observed by an FV3000 laser scanning confocal microscope (Zeiss) under a 60-fold oil immersion lens.

3.8. Zebrafish Imaging

Zebrafish (wild-type AB strain) were purchased from the Zebrafish Resource Center (Core Lab Plat for Medical Science, Zhongshan School of Medicine, Sun Yat-sen University). All procedures were conducted in accordance with the Code of Ethics for Animal Experiments. The ethical approval number is SYSU-IACUC-2020-B0659. The zebrafish were fed at a constant temperature of 28.5 °C and given a light cycle of 14 h on/10 h off. Before the fluorescence imaging experiment, 6 hpf zebrafish embryos were randomly divided into six groups according to the random grouping method and given a sample solution of compounds 16 with a concentration of 15 µM. After incubating at a constant temperature of 28.5 °C for 1 h, the excess liquid was discarded, and we washed the embryos three times with E3 medium. Then, the embryos were incubated continuously in an incubator with a constant temperature of 28.5 °C. After 24 h and 48 h, we observed the embryos using an EVOS FL Auto Imaging system. After 120 h, we observed the Zebrafish using FV3000 laser scanning confocal microscopy under a 10-fold lens.

4. Conclusions

In summary, we successfully designed and synthesized chalcone derivatives 111 based on our previous research of AIEE molecules. By analyzing the experimental results of PL intensity, fluorescence photographs under a 365 nm wavelength UV light and fluorescence quantum yields (ϕF), compounds 16 were identified as typical AIEE molecules. Through different viscosity tests, we determined that the main reason for the AIEE phenomenon was the restriction of intramolecular rotation (RIR). Furthermore, compounds 16 showed low cytotoxicity and good cytocompatibility at the experimental concentrations. Additionally, we found that they could specifically aggregate in the mitochondria, which enriches the compounds library that can be applied to mitochondrial imaging. We obtained pictures of compounds 16 in zebrafish fluorescence imaging from the experiment, which demonstrated that these AIEE molecules could be targeted to aggregate in the digestive tract and have the potential to be applied in in vivo imaging of zebrafish. Our research group is dedicated to the design and synthesis of additional novel AIEE molecules. Further efforts to study their application prospects in the field of living cell and biological imaging are in progress.

Supplementary Materials

The following are available online at https://www.mdpi.com/article/10.3390/ijms22168949/s1, Figure S1: variation trend of the maximum fluorescence intensity of compounds 1-6 in CH3OH/H2O mixtures. Figure S2: Normalized UV absorption and fluorescence spectra of compounds 1–6 in CH3OH/H2O mixtures with 90% water fractions. Figure S3: Time-dependent fluorescence spectra of compounds 1–6 in CH3OH/H2O mixtures. Figure S4: PL spectra of compounds 7–11 in CH3OH/H2O mixtures with different water fractions. Figures S5–S15: 1H, 13C-NMR spectra and ESI-MS analysis for compounds 1–11.

Author Contributions

Conceptualization, F.H.; Synthesis and data collection, H.L., N.L. and L.L.; Writing—original draft preparation, H.L.; Writing—review and editing, F.H., N.L., L.L. and H.W. All authors have read and agreed to the published version of the manuscript.

Funding

This work was supported by the National Natural Science Foundation of China (grant no. 81774099 and 81173577), the National Key R&D Program of China (grant no. 2017YFC1701100), and the Natural Science Foundation of Guangdong (grant no. 8451008901000380).

Institutional Review Board Statement

All procedures for this study were conducted in accordance with the Code of Ethics for Animal Experiments. The ethical approval number is SYSU-IACUC-2020-B0659.

Informed Consent Statement

Not applicable.

Data Availability Statement

Not applicable.

Conflicts of Interest

The authors declare no conflict of interest.

References

  1. Bera, M.K.; Pal, P.; Malik, S. Solid-state emissive organic chromophores: Design, strategy and building blocks. J. Mater. Chem. C 2020, 8, 788–802. [Google Scholar] [CrossRef]
  2. He, X.J.; Chen, H.; Xu, C.C.; Fan, J.Y.; Xu, W.; Li, Y.H.; Deng, H.; Shen, J.L. Ratiometric and colorimetric fluorescent probe for hypochlorite monitor and application for bioimaging in living cells, bacteria and zebrafish. J. Hazard. Mater. 2020, 388, 122029. [Google Scholar] [CrossRef]
  3. Jing, L.; Sun, M.; Xu, P.; Yao, K.; Yang, J.; Wang, X.; Liu, H.; Sun, M.; Sun, Y.; Ni, R.; et al. Noninvasive In Vivo Imaging and Monitoring of 3D-Printed Polycaprolactone Scaffolds Labeled with an NIR Region II Fluorescent Dye. ACS Applied Bio Materials 2021, 4, 3189–3202. [Google Scholar] [CrossRef]
  4. Zhao, E.; Chen, S. Materials with aggregation-induced emission characteristics for applications in diagnosis, theragnosis, disease mechanism study and personalized medicine. Mat. Chem. Front. 2021, 5, 3322–3343. [Google Scholar] [CrossRef]
  5. Feng, G.; Liu, B. Aggregation-Induced Emission (AIE) Dots: Emerging Theranostic Nanolights. Acc. Chem. Res. 2018, 51, 1404–1414. [Google Scholar] [CrossRef] [PubMed]
  6. Luo, J.; Xie, Z.; Lam, J.W.; Cheng, L.; Chen, H.; Qiu, C.; Kwok, H.S.; Zhan, X.; Liu, Y.; Zhu, D.; et al. Aggregation-induced emission of 1-methyl-1,2,3,4,5-pentaphenylsilole. Chem. Commun. 2001, 18, 1740–1741. [Google Scholar] [CrossRef] [PubMed]
  7. Wurthner, F. Aggregation-Induced Emission (AIE): A Historical Perspective. Angew. Chem.-Int. Edit. 2020, 59, 14192–14196. [Google Scholar] [CrossRef]
  8. Feng, H.T.; Yuan, Y.X.; Xiong, J.B.; Zheng, Y.S.; Tang, B.Z. Macrocycles and cages based on tetraphenylethylene with aggregation-induced emission effect. Chem. Soc. Rev. 2018, 47, 7452–7476. [Google Scholar] [CrossRef] [PubMed]
  9. An, B.K.; Gierschner, J.; Park, S.Y. pi-Conjugated Cyanostilbene Derivatives: A Unique Self-Assembly Motif for Molecular Nanostructures with Enhanced Emission and Transport. Acc. Chem. Res. 2012, 45, 544–554. [Google Scholar] [CrossRef]
  10. Hong, Y.N.; Lam, J.W.Y.; Tang, B.Z. Aggregation-induced emission. Chem. Soc. Rev. 2011, 40, 5361–5388. [Google Scholar] [CrossRef] [Green Version]
  11. Garg, K.; Ganapathi, E.; Rajakannu, P.; Ravikanth, M. Stereochemical modulation of emission behaviour in E/Z isomers of diphenyldipyrroethene from aggregation induced emission to crystallization induced emission. Phys. Chem. Chem. Phys. 2015, 17, 19465–19473. [Google Scholar] [CrossRef]
  12. Hong, Y.; Lam, J.W.; Tang, B.Z. Aggregation-induced emission: Phenomenon, mechanism and applications. Chem. Commun. 2009, 29, 4332–4353. [Google Scholar] [CrossRef] [PubMed]
  13. Mei, J.; Hong, Y.; Lam, J.W.; Qin, A.; Tang, Y.; Tang, B.Z. Aggregation-induced emission: The whole is more brilliant than the parts. Adv. Mater. 2014, 26, 5429–5479. [Google Scholar] [CrossRef] [PubMed]
  14. Sasaki, S.; Drummen, G.P.C.; Konishi, G.-I. Recent advances in twisted intramolecular charge transfer (TICT) fluorescence and related phenomena in materials chemistry. J. Mater. Chem. C 2016, 4, 2731–2743. [Google Scholar] [CrossRef] [Green Version]
  15. Yakali, G. Examination of aggregation-induced enhanced emission in a propeller-shaped chiral nonconjugated blue emitter from restricted intramolecular rotation and J-type pipi stacking interactions. Phys. Chem. Chem. Phys. 2021, 23, 11388–11399. [Google Scholar] [CrossRef]
  16. Li, Y.; Li, F.; Zhang, H.; Xie, Z.; Xie, W.; Xu, H.; Li, B.; Shen, F.; Ye, L.; Hanif, M.; et al. Tight intermolecular packing through supramolecular interactions in crystals of cyano substituted oligo(para-phenylene vinylene): A key factor for aggregation-induced emission. Chem. Commun. 2007, 3, 231–233. [Google Scholar] [CrossRef] [PubMed]
  17. Liu, Y.; Deng, C.; Tang, L.; Qin, A.; Hu, R.; Sun, J.Z.; Tang, B.Z. Specific detection of D-glucose by a tetraphenylethene-based fluorescent sensor. J. Am. Chem. Soc. 2011, 133, 660–663. [Google Scholar] [CrossRef]
  18. Sun, X.; Zebibula, A.; Dong, X.; Li, G.; Zhang, G.; Zhang, D.; Qian, J.; He, S. Targeted and imaging-guided in vivo photodynamic therapy for tumors using dual-function, aggregation-induced emission nanoparticles. Nano Res. 2018, 11, 2756–2770. [Google Scholar] [CrossRef]
  19. Yan, L.; Xie, Y.; Li, J.; Zhu, W. A red fluorogen: AIEE characteristic, photoluminescence mechanism and its application as chemosensor for ClO. Spectroc. Acta Pt. A-Molec. Biomolec. Spectr. 2020, 228, 117794. [Google Scholar] [CrossRef]
  20. Zhang, W.; Wang, N.; Liu, Y.H.; Jiao, S.Y.; Zhang, W.W.; Pu, X.M.; Yu, X.Q. 1,4-Dihydropyridines: Discovery of minimal AIEEgens and their mitochondrial imaging applications. J. Mat. Chem. B 2017, 5, 464–469. [Google Scholar] [CrossRef]
  21. Lei, Y.; Liu, L.; Tang, X.; Yang, D.; Yang, X.; He, F. Sanguinarine and chelerythrine: Two natural products for mitochondria-imaging with aggregation-induced emission enhancement and pH-sensitive characteristics. RSC Adv. 2018, 8, 3919–3927. [Google Scholar] [CrossRef] [Green Version]
  22. Hayashi, M.; Harada, Y. Direct observation of the reversible unwinding of a single DNA molecule caused by the intercalation of ethidium bromide. Nucleic Acids Res. 2007, 35, e125. [Google Scholar] [CrossRef]
  23. Over, B.; McCarren, P.; Artursson, P.; Foley, M.; Giordanetto, F.; Gronberg, G.; Hilgendorf, C.; Lee, M.D.t.; Matsson, P.; Muncipinto, G.; et al. Impact of stereospecific intramolecular hydrogen bonding on cell permeability and physicochemical properties. J. Med. Chem. 2014, 57, 2746–2754. [Google Scholar] [CrossRef]
  24. Liu, L.; Lei, Y.; Zhang, J.; Li, N.; Zhang, F.; Wang, H.; He, F. Rational Design for Multicolor Flavone-Based Fluorophores with Aggregation-Induced Emission Enhancement Characteristics and Applications in Mitochondria-Imaging. Molecules 2018, 23, 2290. [Google Scholar] [CrossRef] [PubMed] [Green Version]
  25. Li, N.; Liu, L.; Luo, H.; Wang, H.; Yang, D.; He, F. Flavanone-Based Fluorophores with Aggregation-Induced Emission Enhancement Characteristics for Mitochondria-Imaging and Zebrafish-Imaging. Molecules 2020, 25, 3298. [Google Scholar] [CrossRef]
  26. Chen, H.; Fang, S.; Wang, L.; Liu, X.; Yan, J.; Zhang, N.; Zheng, K. Tetraphenylene-chalcone hybrid derivatives: Synthesis, structural, fluorescence properties and imaging in living cells. J. Mol. Liq. 2021, 321, 114913. [Google Scholar] [CrossRef]
  27. Sachdeva, T.; Milton, M.D. AIEE active novel red-emitting D-pi-A phenothiazine chalcones displaying large Stokes shift, solvatochromism and “turn-on” reversible mechanofluorochromism. Dyes Pigment. 2020, 181, 108539. [Google Scholar] [CrossRef]
  28. Vaz, P.A.A.M.; Rocha, J.; Silva, A.M.S.; Guieu, S. Aggregation-induced emission enhancement in halochalcones. New J. Chem. 2016, 40, 8198–8201. [Google Scholar] [CrossRef]
  29. Maria, K.; Dimitra, H.L.; Maria, G. Synthesis and Anti-Inflammatory Activity of Chalcones and Related Mannich Bases. Med. Chem. 2008, 4, 586–596. [Google Scholar] [CrossRef]
  30. Machala, M.; Kubinova, R.; Horavova, P.; Suchy, V. Chemoprotective potentials of homoisoflavonoids and chalcones of Dracaena cinnabari: Modulations of drug-metabolizing enzymes and antioxidant activity. Phytother. Res. 2001, 15, 114–118. [Google Scholar] [CrossRef]
  31. Coskun, D.; Erkisa, M.; Ulukaya, E.; Coskun, M.F.; Ari, F. Novel 1-(7-ethoxy-1-benzofuran-2-yl) substituted chalcone derivatives: Synthesis, characterization and anticancer activity. Eur. J. Med. Chem. 2017, 136, 212–222. [Google Scholar] [CrossRef]
  32. Cole, A.L.; Hossain, S.; Cole, A.M.; Phanstiel, O.t. Synthesis and bioevaluation of substituted chalcones, coumaranones and other flavonoids as anti-HIV agents. Bioorg. Med. Chem. 2016, 24, 2768–2776. [Google Scholar] [CrossRef]
  33. Ayati, A.; Esmaeili, R.; Moghimi, S.; Oghabi Bakhshaiesh, T.; Eslami, S.Z.; Majidzadeh, A.K.; Safavi, M.; Emami, S.; Foroumadi, A. Synthesis and biological evaluation of 4-amino-5-cinnamoylthiazoles as chalcone-like anticancer agents. Eur. J. Med. Chem. 2018, 145, 404–412. [Google Scholar] [CrossRef] [PubMed]
  34. Nowakowska, Z. A review of anti-infective and anti-inflammatory chalcones. Eur. J. Med. Chem. 2007, 42, 125–137. [Google Scholar] [CrossRef]
  35. Rozmer, Z.; Perjési, P. Naturally occurring chalcones and their biological activities. Phytochem. Rev. 2014, 15, 87–120. [Google Scholar] [CrossRef]
  36. Zhuang, C.; Zhang, W.; Sheng, C.; Zhang, W.; Xing, C.; Miao, Z. Chalcone: A Privileged Structure in Medicinal Chemistry. Chem. Rev. 2017, 117, 7762–7810. [Google Scholar] [CrossRef]
  37. Yang, Z.Y.; Chi, Z.G.; Yu, T.; Zhang, X.Q.; Chen, M.N.; Xu, B.J.; Liu, S.W.; Zhang, Y.; Xu, J.R. Triphenylethylene carbazole derivatives as a new class of AIE materials with strong blue light emission and high glass transition temperature. J. Mater. Chem. 2009, 19, 5541–5546. [Google Scholar] [CrossRef]
  38. Li, S.; Fei, X.; Jiao, X.; Lin, D.; Zhang, B.; Cao, L. Synthesis and characterization of the fluorescent probes for the labeling of Microthrix parvicella. Appl. Microbiol. Biotechnol. 2016, 100, 2883–2894. [Google Scholar] [CrossRef] [PubMed]
  39. Wen, P.; Gao, Z.; Zhang, R.; Li, A.; Zhang, F.; Li, J.; Xie, J.; Wu, Y.; Wu, M.; Guo, K. A–π–D–π–A carbazole derivatives with remarkable solvatochromism and mechanoresponsive luminescence turn-on. J. Mater. Chem. C 2017, 5, 6136–6143. [Google Scholar] [CrossRef]
  40. Dong, J.; Solntsev, K.M.; Tolbert, L.M. Activation and Tuning of Green Fluorescent Protein Chromophore Emission by Alkyl Substituent-Mediated Crystal Packing. J. Am. Chem. Soc. 2009, 131, 662–670. [Google Scholar] [CrossRef] [PubMed]
  41. Sun, Y.F.; Wang, H.P.; Chen, Z.Y.; Duan, W.Z. Solid-state fluorescence emission and second-order nonlinear optical properties of coumarin-based fluorophores. J. Fluoresc. 2013, 23, 123–130. [Google Scholar] [CrossRef] [PubMed]
  42. Zheng, Z.; Yu, Z.; Yang, M.; Jin, F.; Zhang, Q.; Zhou, H.; Wu, J.; Tian, Y. Substituent group variations directing the molecular packing, electronic structure, and aggregation-induced emission property of isophorone derivatives. J. Org. Chem. 2013, 78, 3222–3234. [Google Scholar] [CrossRef]
  43. Li, Y.; Chen, T.; Miao, X.; Yi, X.; Wang, X.; Zhao, H.; Lee, S.M.; Zheng, Y. Zebrafish: A promising in vivo model for assessing the delivery of natural products, fluorescence dyes and drugs across the blood-brain barrier. Pharmacol. Res. 2017, 125, 246–257. [Google Scholar] [CrossRef] [PubMed]
  44. Howe, K.; Clark, M.D.; Torroja, C.F.; Torrance, J.; Berthelot, C.; Muffato, M.; Collins, J.E.; Humphray, S.; McLaren, K.; Matthews, L.; et al. The zebrafish reference genome sequence and its relationship to the human genome. Nature 2013, 496, 498–503. [Google Scholar] [CrossRef] [PubMed] [Green Version]
  45. Hill, A.J.; Teraoka, H.; Heideman, W.; Peterson, R.E. Zebrafish as a model vertebrate for investigating chemical toxicity. Toxicol. Sci. 2005, 86, 6–19. [Google Scholar] [CrossRef] [Green Version]
  46. Xu, Z.; Ba, M.; Zhou, H.; Cao, Y.; Tang, C.; Yang, Y.; He, R.; Liang, Y.; Zhang, X.; Li, Z.; et al. 2,4,5-Trisubstituted thiazole derivatives: A novel and potent class of non-nucleoside inhibitors of wild type and mutant HIV-1 reverse transcriptase. Eur. J. Med. Chem. 2014, 85, 27–42. [Google Scholar] [CrossRef] [PubMed]
Figure 1. (a) Chemical structures of sanguinarine, chelerythrine, flavone, flavanone, and chalcone derivatives. (b) Synthesis route and chemical structure of chalcone derivatives 111.
Ijms 22 08949 g001
Figure 2. PL spectra of compounds (a) 1, (b) 2, (c) 3, (d) 4, (e) 5, (f) 6 in CH3OH/H2O mixed solutions (c = 2.07 × 10⁻⁵ M) with different water fractions (0–90%).
Ijms 22 08949 g002
Figure 3. UV–vis absorption spectra of compounds (a) 1, (b) 2, (c) 3, (d) 4, (e) 5, and (f) 6 in pure CH3OH solution and CH3OH/H2O mixed solution with 90% water contents.
Ijms 22 08949 g003
Figure 4. Fluorescence photographs of compounds (a) 1, (b) 2, (c) 3, (d) 4, (e) 5, (f) 6 in CH3OH/H2O mixed solution (with various water fractions) under 365 nm wavelength UV light.
Ijms 22 08949 g004
Figure 5. SEM images in CH3OH/H2O (5:5 v:v) mixed solutions of compounds (a) 1, (d) 2, (g) 3, (j) 4, (m) 5, (p) 6. SEM images in CH3OH/H2O (3:7 v:v) mixed solutions of compounds (b) 1, (e) 2. SEM image in CH3OH/H2O (2:8 v:v) mixed solutions of compound (h) 3. SEM images in CH3OH/H2O (4:6 v:v) mixed solutions of compounds (k) 4, (n) 5, (q) 6. SEM images in CH3OH/H2O (1:9 v:v) mixed solutions of compounds (c) 1, (f) 2, (i) 3, (l) 4, (o) 5, (r) 6.
Ijms 22 08949 g005
Figure 6. Fluorescence intensity of compounds (a) 1, (b) 2, (c) 3, (d) 4, (e) 5, and (f) 6 in CH3OH/EG mixed solutions with different EG fractions (0–50%).
Ijms 22 08949 g006
Figure 7. Cell viabilities of A549 cells co-cultured with different concentrations of compounds (a) 1, (b) 2, (c) 3, (d) 4, (e) 5, (f) 6 for 24 h.
Ijms 22 08949 g007
Figure 8. The imaging figures of A549 cells co-cultured with compounds (a) 1, (d) 2, (g) 3, (j) 4, (m) 5, (p), 6 (10 µM) for 30 min. The bright-field images of A549 cells co-cultured with (b) 1, (e) 2, (h) 3, (k) 4, (n) 5, (q) 6. The merged images co-cultured with (c) 1, (f) 2, (i) 3, (l) 4, (o) 5, (r) 6. An excitation wavelength of 405 nm was selected for the experiment.
Ijms 22 08949 g008
Figure 9. Co-localized images of A549 cells incubated with compounds (a) 1, (d) 2, (g) 3, (j) 4, (m) 5, and (p) 6 (10 µM) and Mito Tracker Red (200 nM) (b) 1, (e) 2, (h) 3, (k) 4, (n) 5, and (q) 6 for 30 min. The merged images co-cultured with (c) 1, (f) 2, (i) 3, (l) 4, (o) 5, (r) 6. The excitation wavelength of compounds 16 was 405 nm. The excitation wavelength of Mito Tracker Red was 578 nm.
Ijms 22 08949 g009
Figure 10. Fluorescence images of zebrafish embryos after soaking with compounds (a) 1, (d) 2, (g) 3, (j) 4, (m) 5, and (p) 6 (15 µM) for 1 h at 24 hpf. Fluorescence images of zebrafish embryos after soaking with compounds (b) 1, (e) 2, (h) 3, (k) 4, (n) 5, (q) 6 (15 µM) for 1 h at 48 hpf. Fluorescence images of zebrafish embryos after soaking with compounds (c) 1, (f) 2, (i) 3, (l) 4, (o) 5, (r) 6 (15 µM) for 1 h at 120 hpf.
Ijms 22 08949 g010
Table 1. MW, logp, and nON of compounds 111.
CompoundMWLogpnON
1239.113.462
2239.113.462
3269.123.333
4253.123.952
5269.123.333
6253.123.952
7209.103.591
8252.143.872
9223.114.071
10223.114.071
11239.113.462
MW: molecular weight; logP: logarithm of octanol–water partition coefficient; nON: number of hydrogen bond acceptors.
Table 2. Fluorescence quantum yield of compounds 16 in CH3OH/H2O mixed solution with various water fractions.
CompoundSolventsQuantum Yields (ϕF)
1CH3OH0.03
CH3OH/H2O (3:7)0.59
CH3OH/H2O (1:9)0.34
2CH3OH0.01
CH3OH/H2O (3:7)0.19
CH3OH/H2O (1:9)0.12
3CH3OH0.07
CH3OH/H2O (2:8)0.21
CH3OH/H2O (1:9)0.15
4CH3OH0.02
CH3OH/H2O (4:6)0.18
CH3OH/H2O (1:9)0.10
5CH3OH0.04
CH3OH/H2O (4:6)0.08
CH3OH/H2O (1:9)0.05
6CH3OH0.04
CH3OH/H2O (5:5)0.14
CH3OH/H2O (1:9)0.09
Table 3. Corresponding R values of compounds 16.
CompoundCorresponding R Values (Pearson Correlation Coefficient)
10.87
20.83
30.87
40.88
50.86
60.85
Publisher’s Note: MDPI stays neutral with regard to jurisdictional claims in published maps and institutional affiliations.

