
Conservative and Atypical Ferritins of Sponges

 , , , , , ,
  , , , add
Show full author list
, , , add
Show full author list
Abstract
1. Introduction
2. Results
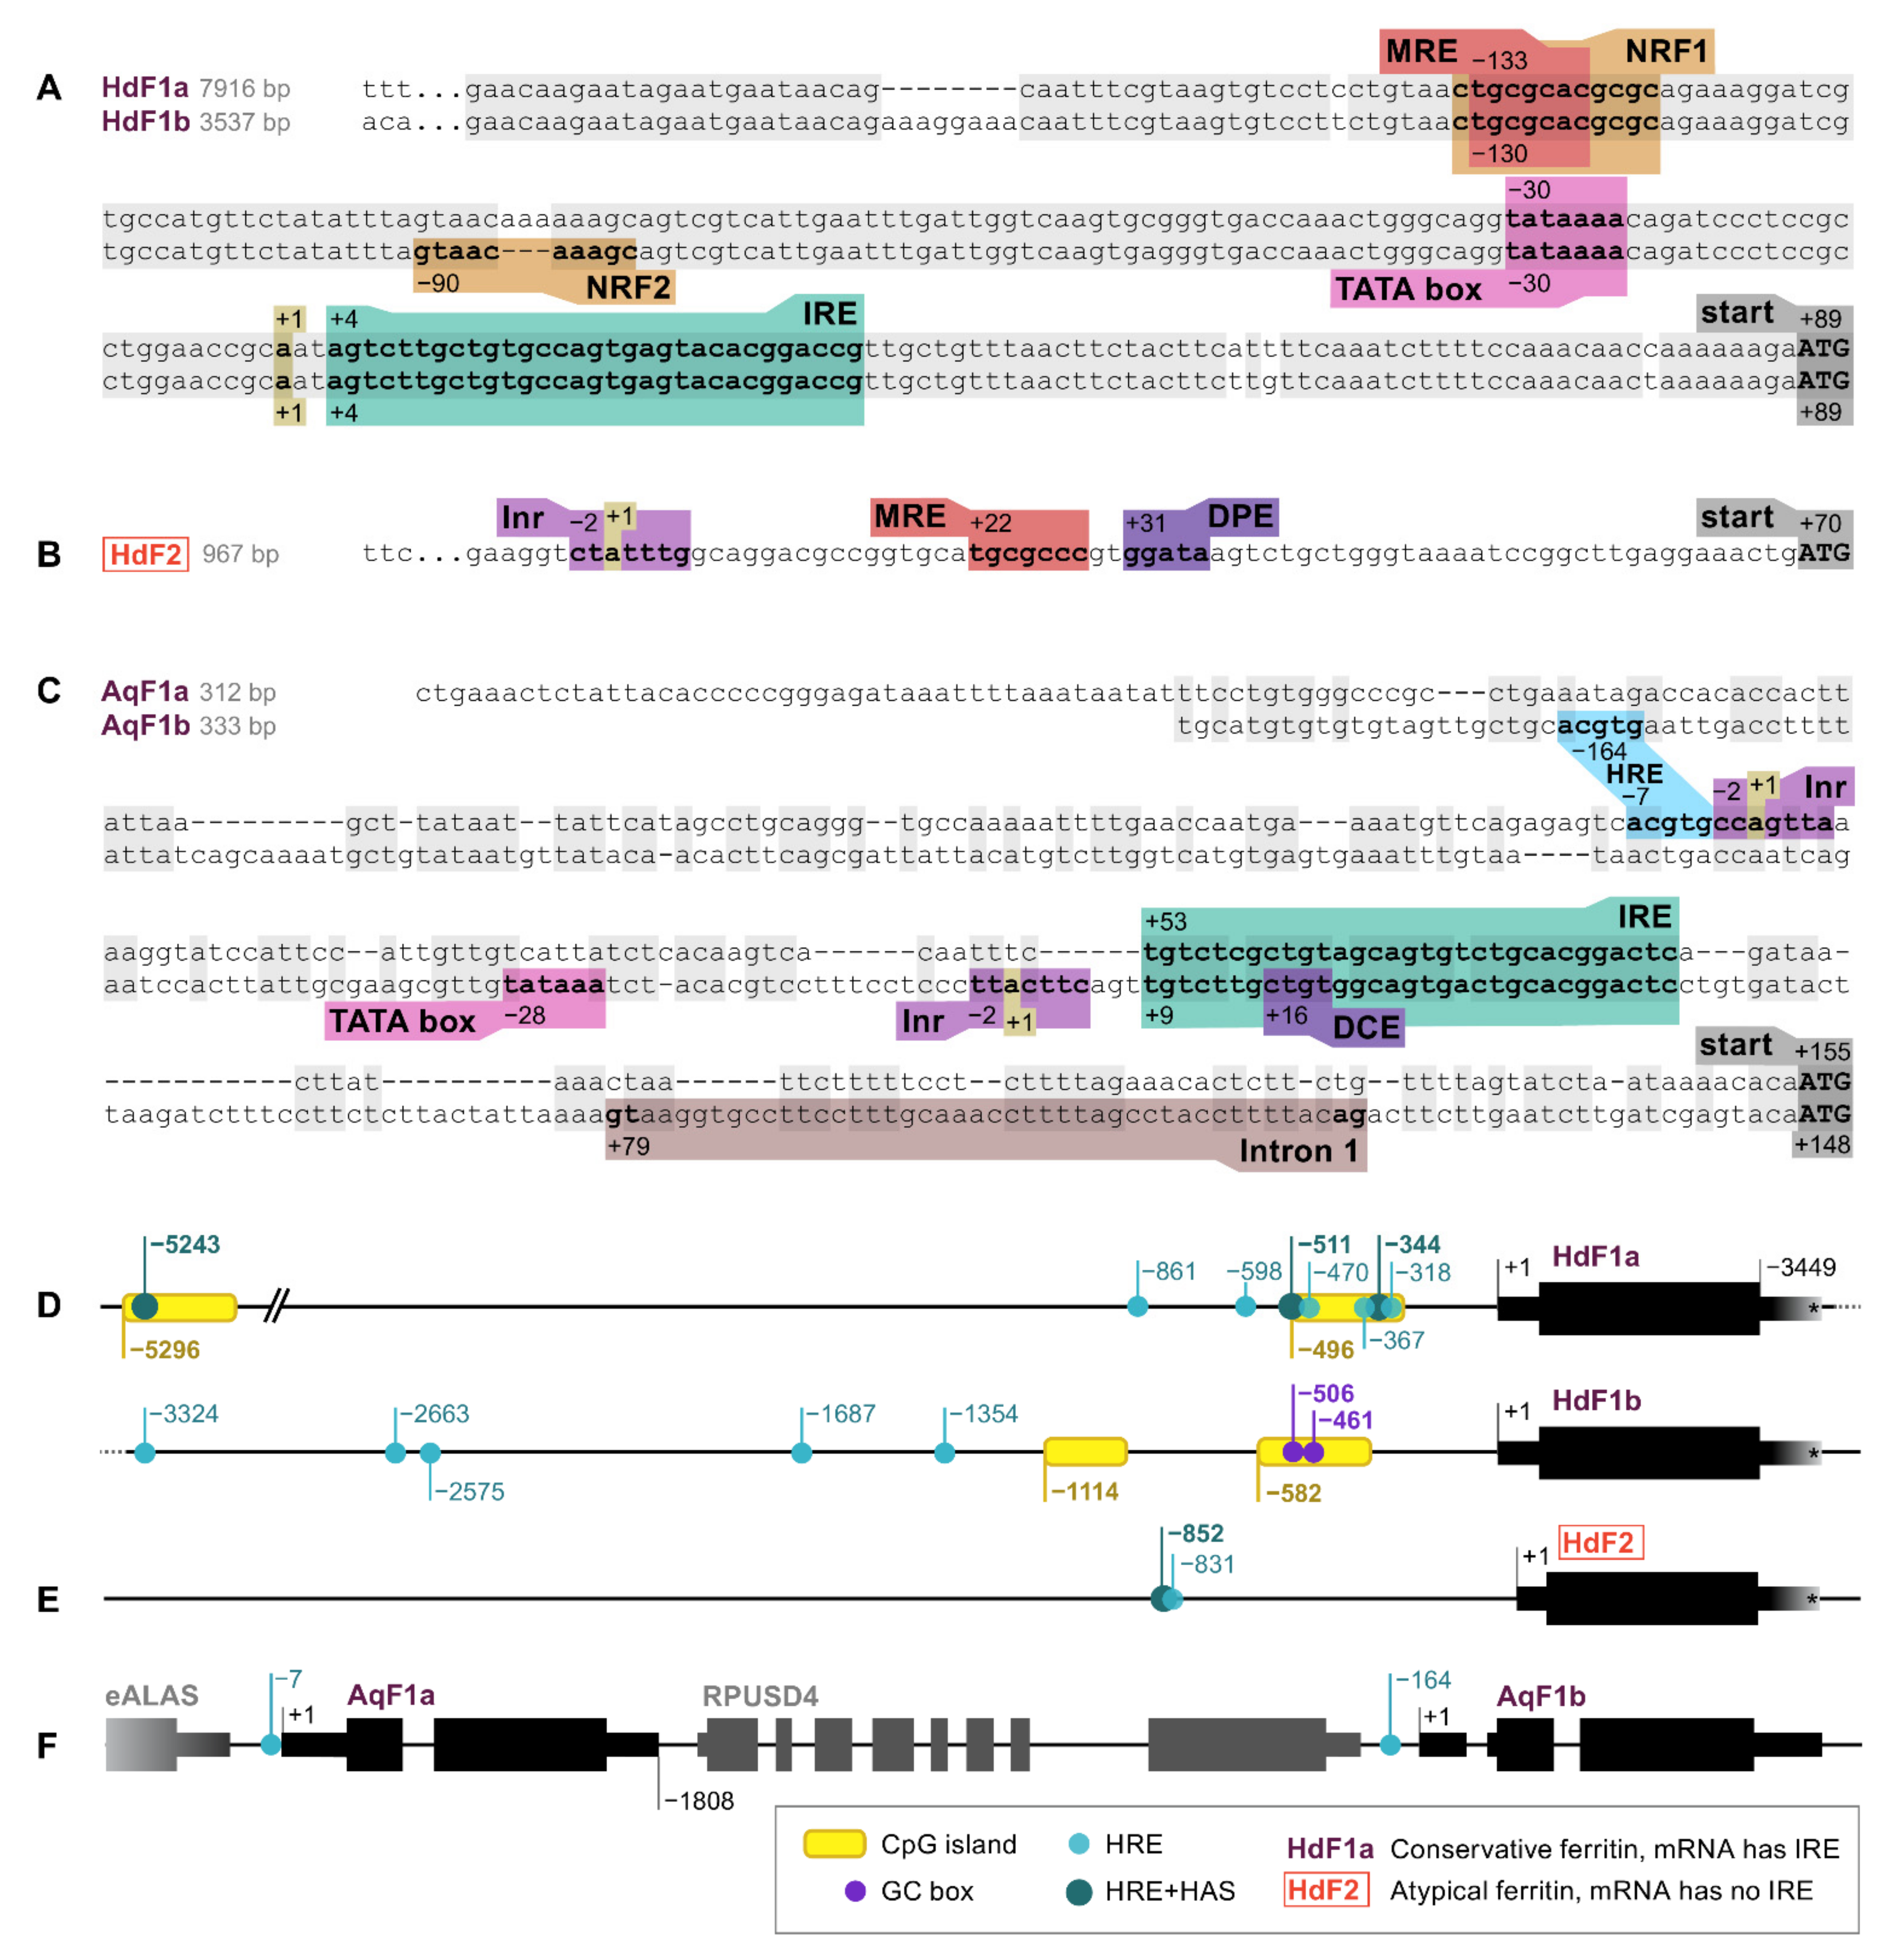
2.1. Ferritin Genes
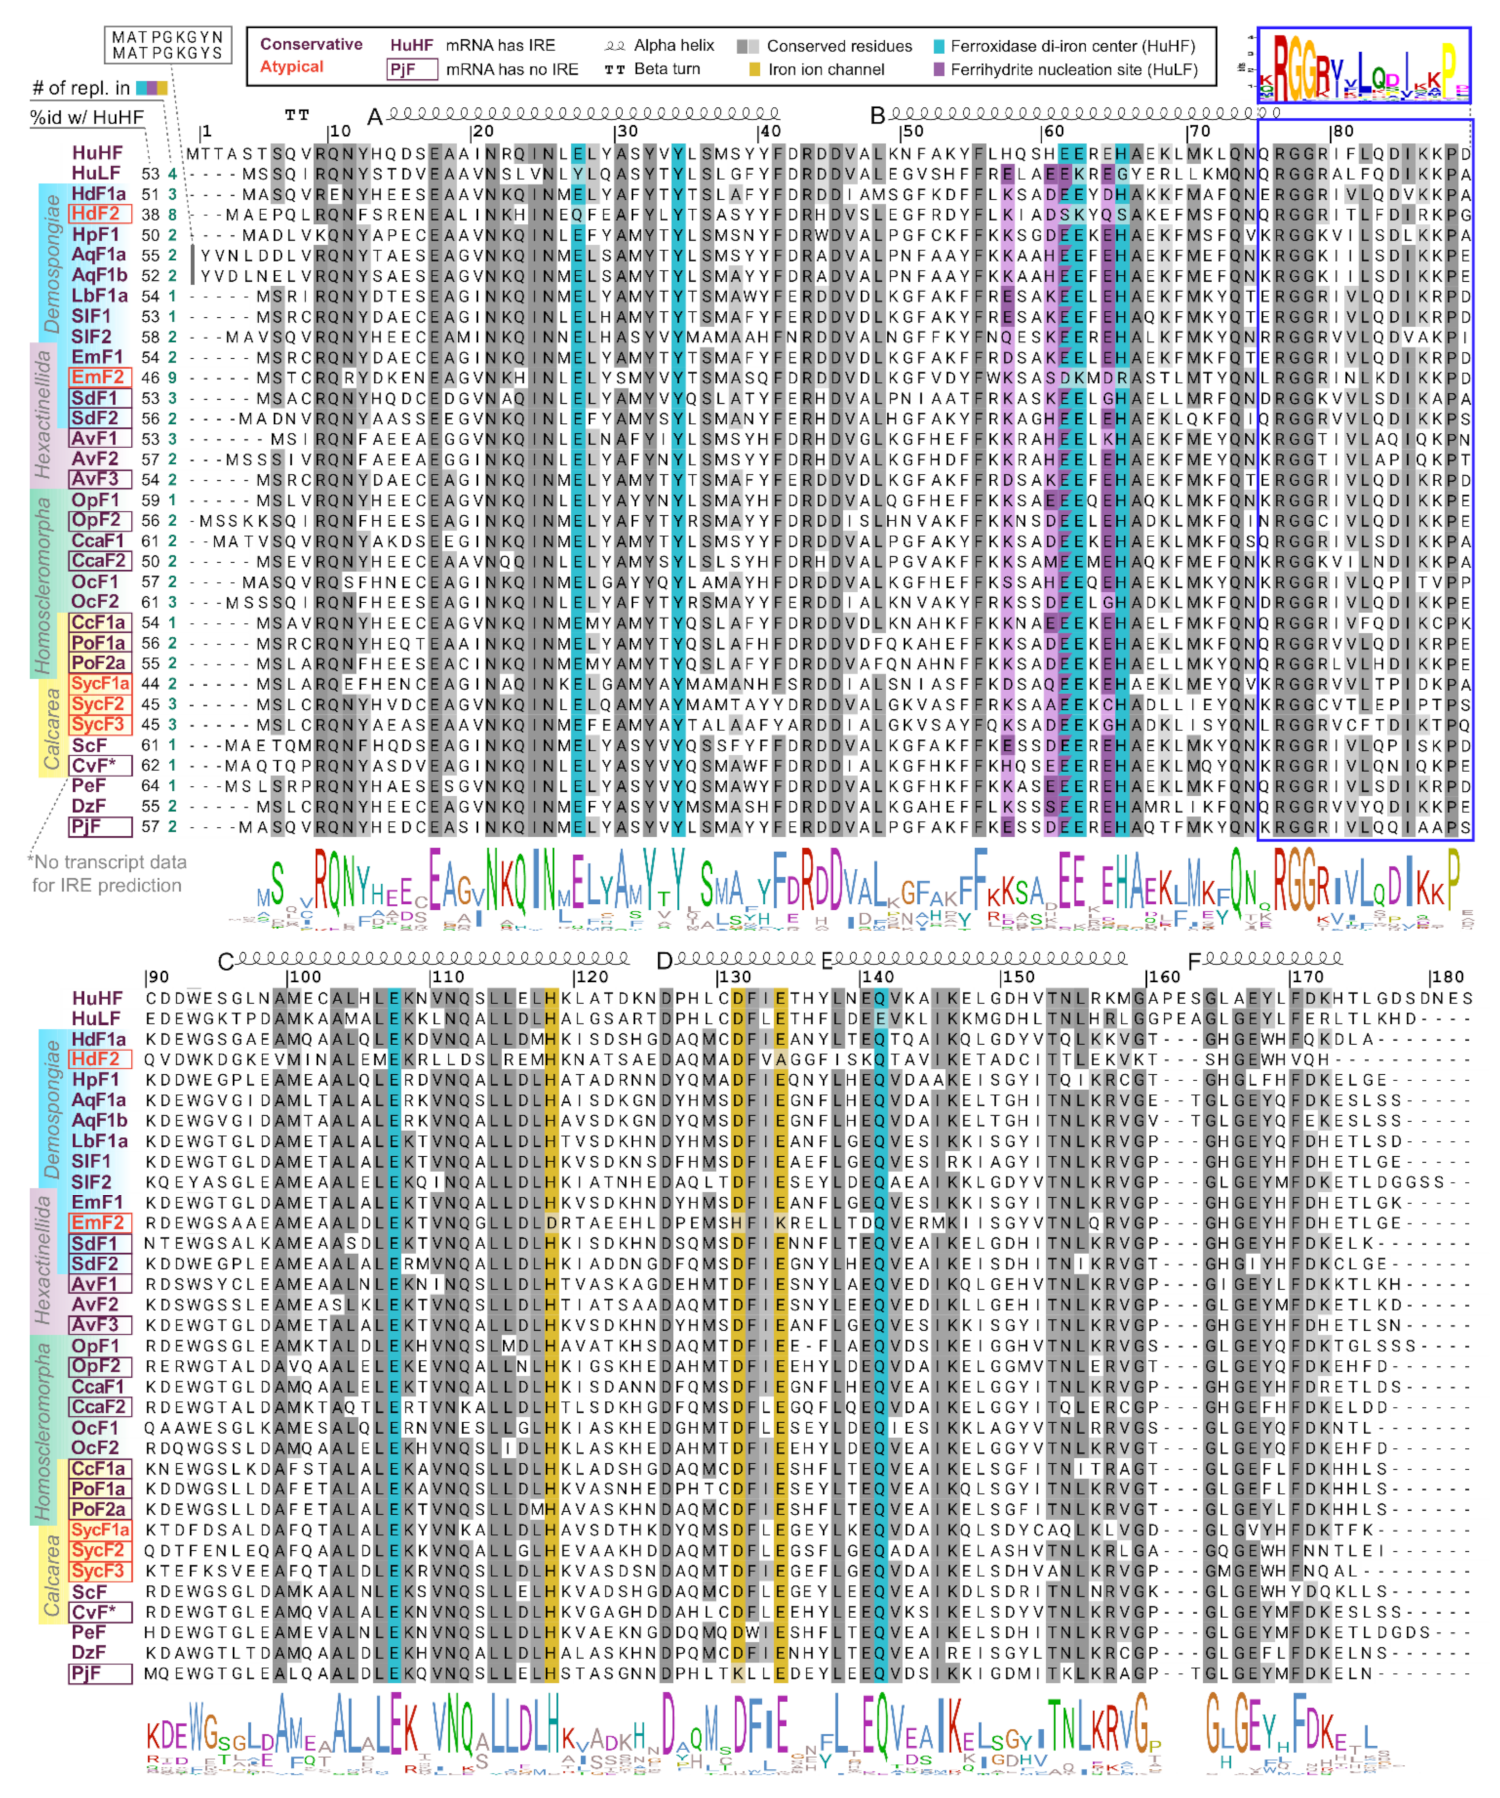
2.2. Ferritin Proteins
2.3. Phylogenetic Analysis of Sponge Ferritins
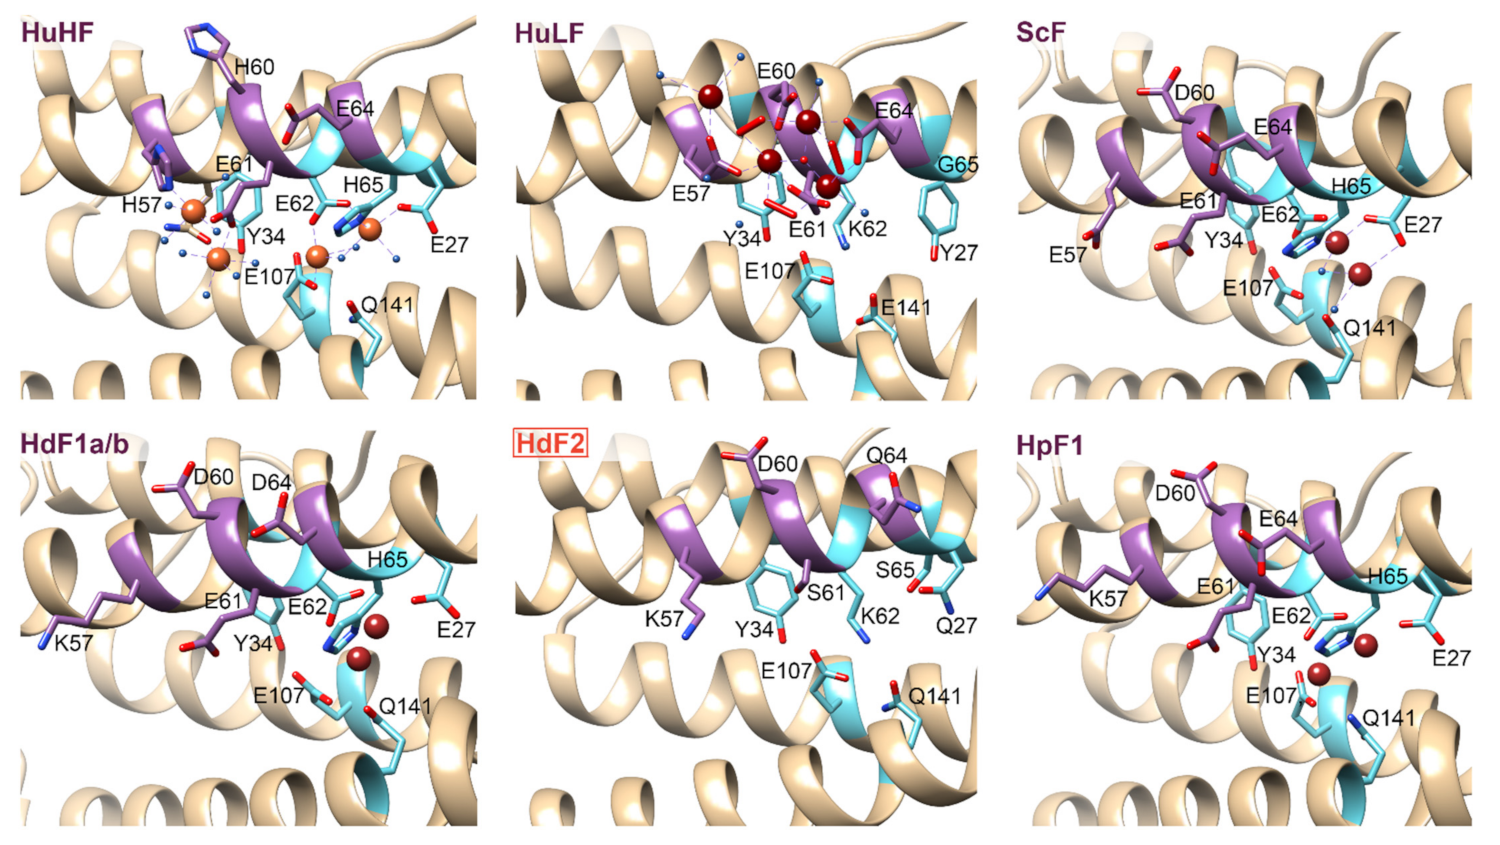
2.4. Ferritin Complexes
2.5. Subcellular Localization of Ferritins
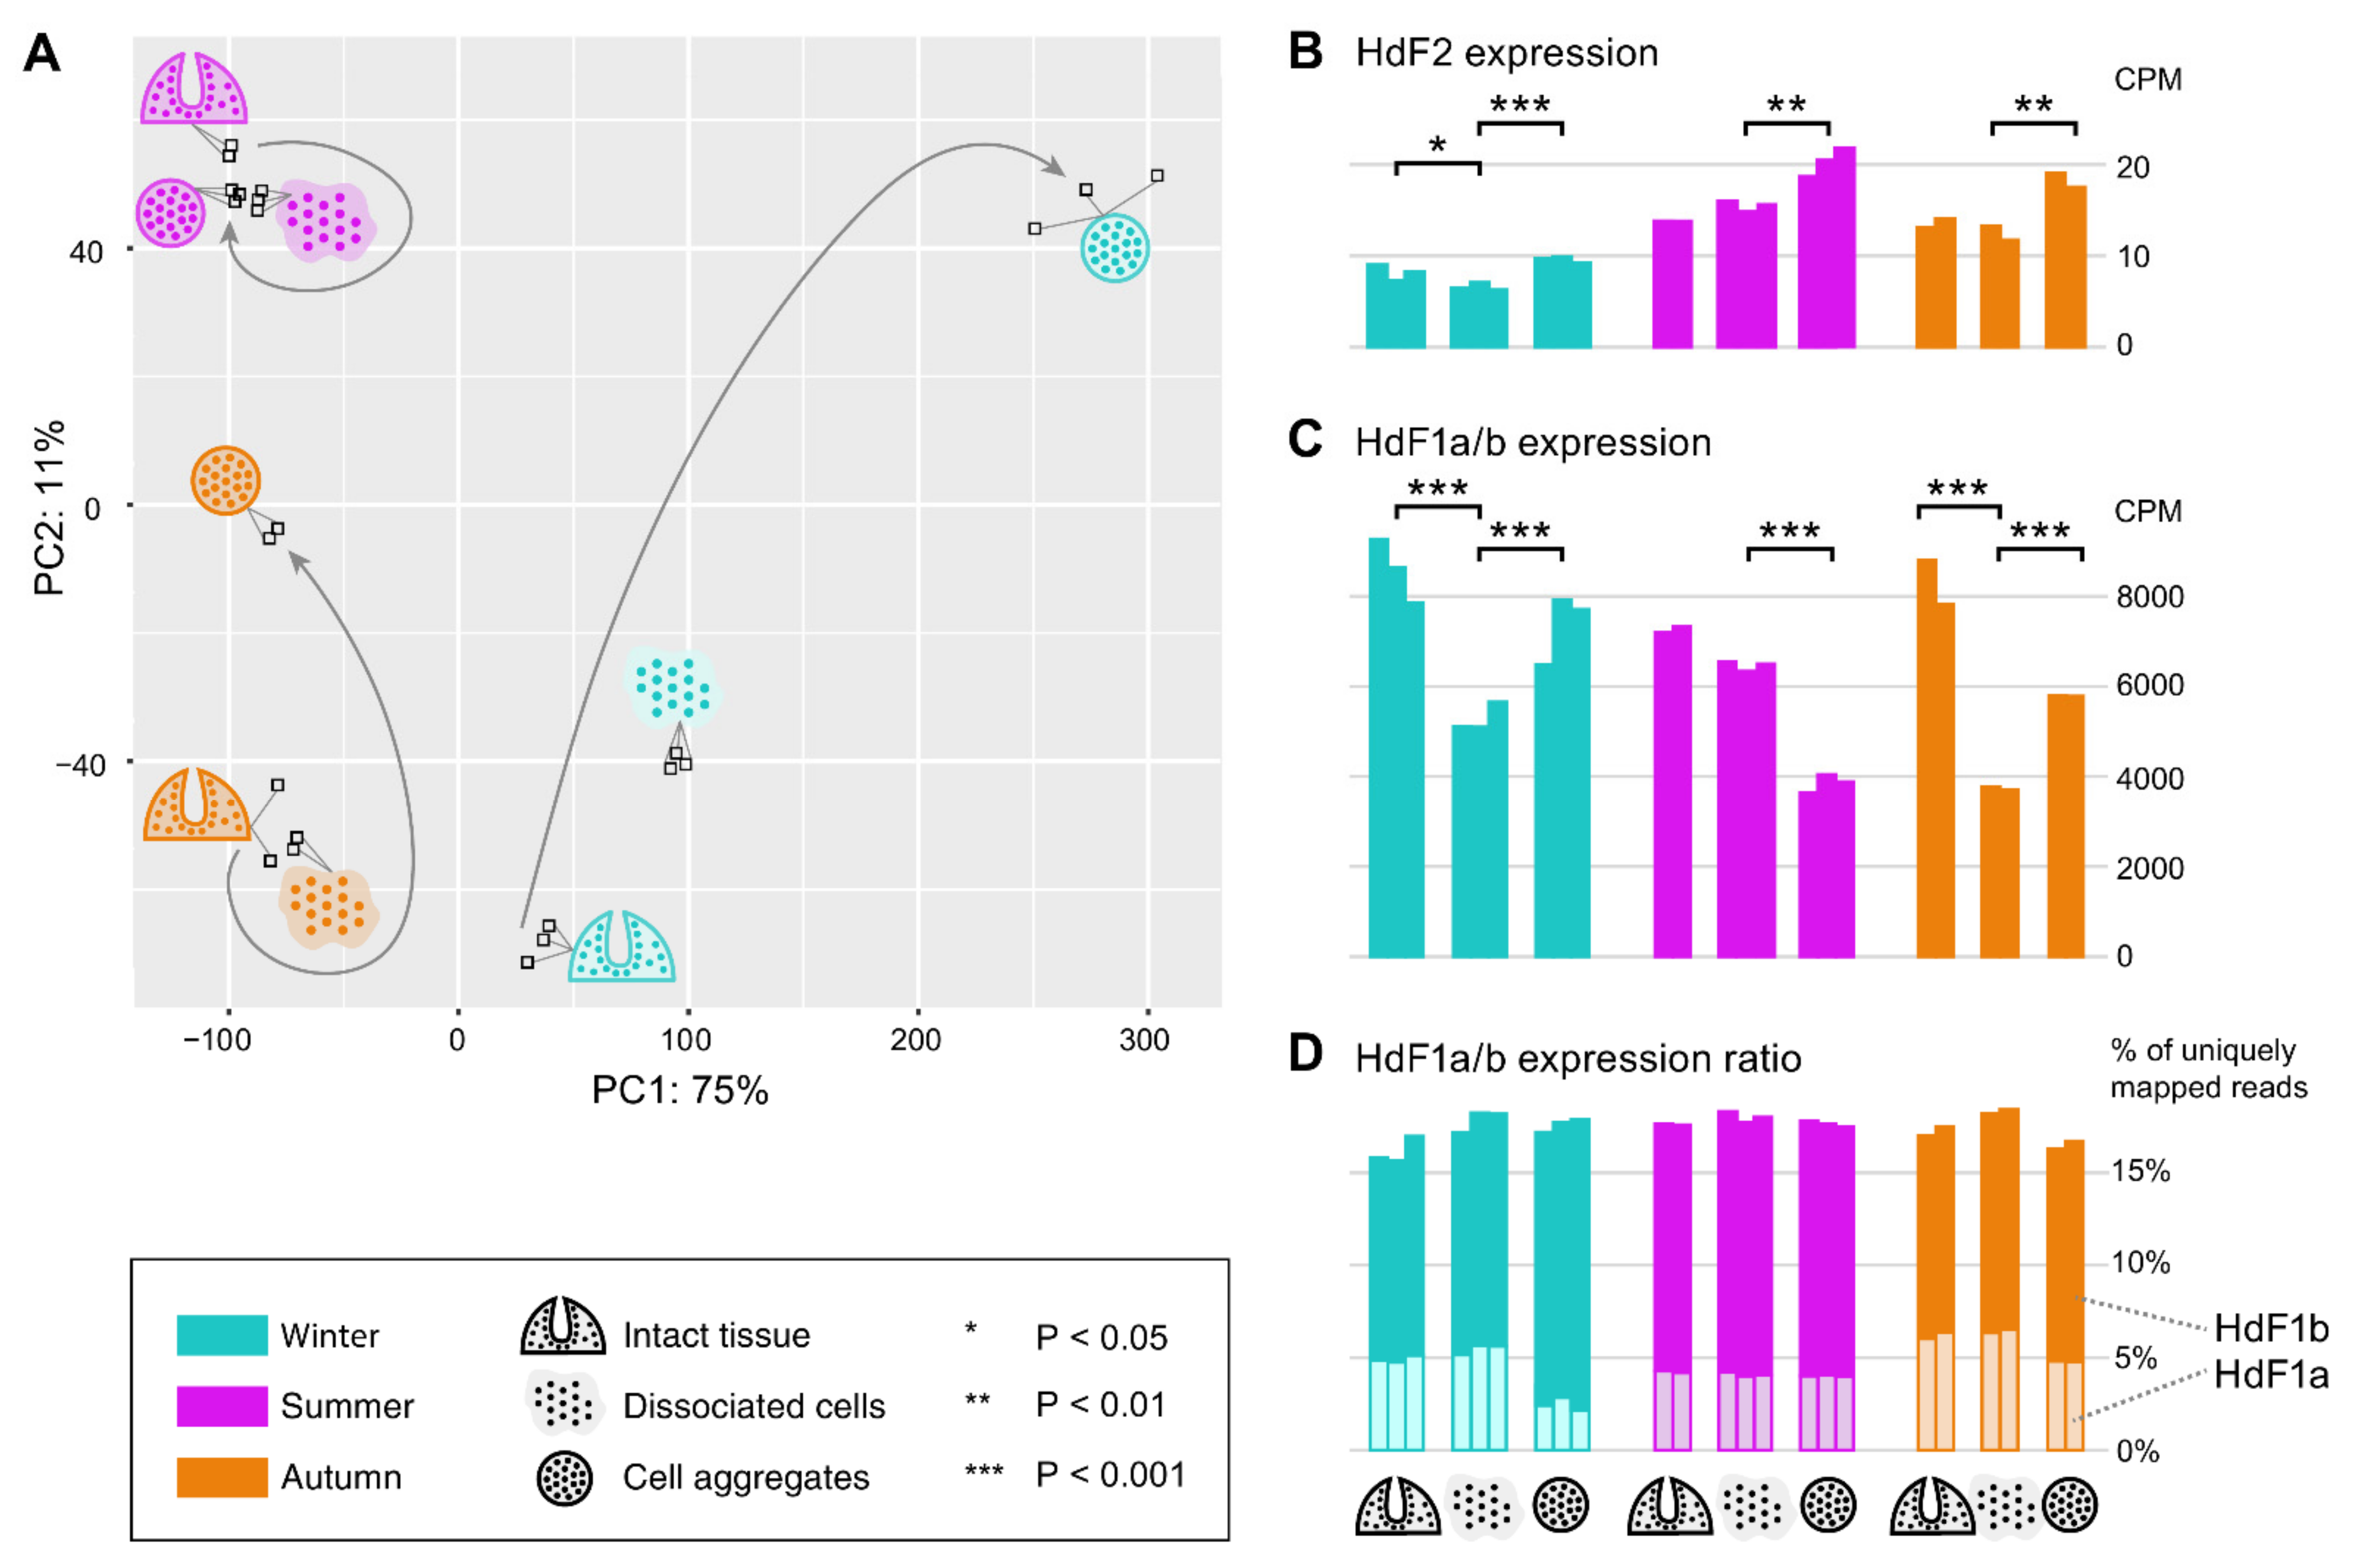
2.6. Expression of Ferritins and the Ferritin Associated Factors during Different Periods of the Annual Cycle
2.7. Ferritin Superfamily Members of the Microbial Community of H. dujardini
3. Discussion
4. Materials and Methods
4.1. Specimen Collection
4.2. Sponge Body Dissociation and Reaggregation Procedures
4.3. DNA Libraries
4.3.1. DNA Isolation, Genomic Library Construction and Sequencing
4.3.2. Draft Genome Assembly
4.3.3. Genomic Features Identification
4.4. RNA Libraries
4.4.1. RNA Isolation
4.4.2. cDNA Library Construction, Quality Detection, and Illumina Sequencing
4.4.3. Differential Expression Analysis for H. dujardini Dissociated and Reaggregated Cells
4.4.4. RACE Analysis
4.4.5. Identification of Bacterial Ferritin Superfamily Members
4.5. Protein Analyses
4.5.1. Native Gel Electrophoresis
4.5.2. Iron Staining
4.5.3. Matrix-Assisted Laser Desorption/Ionization Time-of-Flight Mass (MALDI-TOF)
4.5.4. Liquid Chromatography-Tandem Mass Spectrometry (LC-MS/MS)
4.5.5. Data Analysis and Proteins Identification after LC-MS/MS
4.5.6. Ferritin, Actin, and Tubulin Immunofluorescent Microscopy and Cell Imaging
4.5.7. Transmission Electron Microscopy with Iron Detection
4.6. Functional Annotation of Proteins
4.6.1. Multiple Sequence Alignment and Tree Construction
4.6.2. Homology Modeling
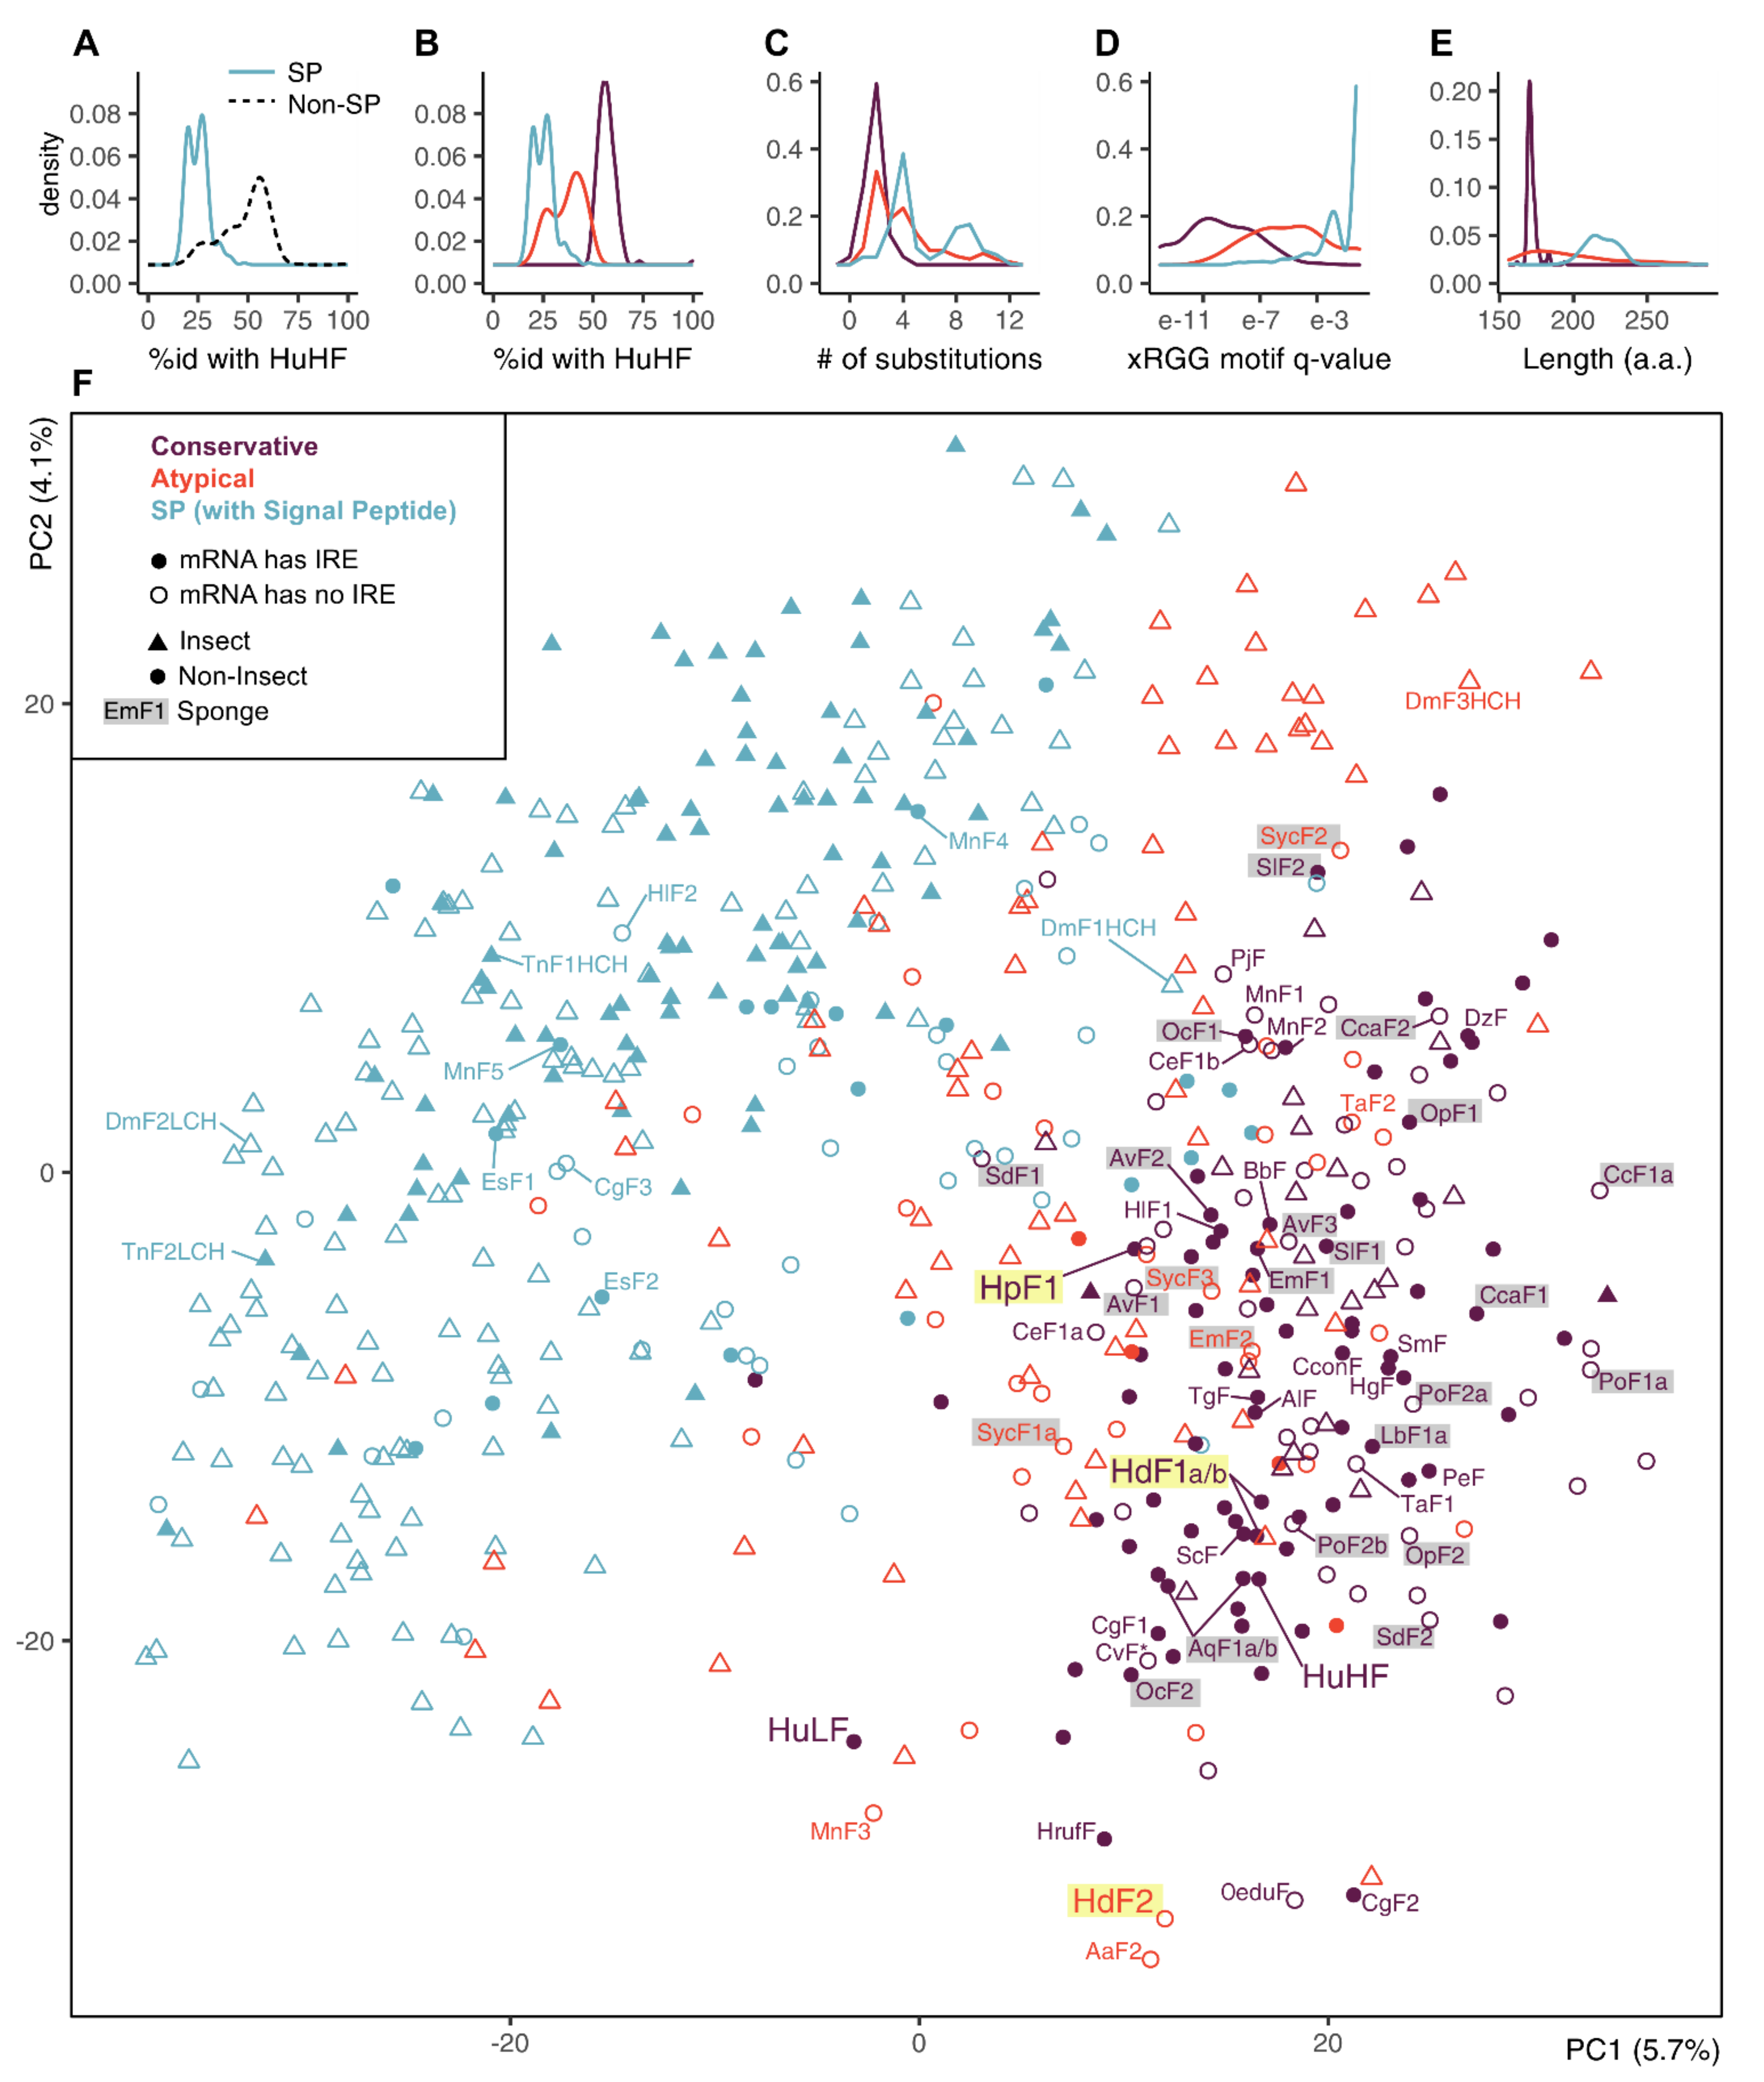
4.6.3. Sequence Features Mining and Selection
- Highly similar sequences having more than 95% identity after clustering by CD-HIT v. 4.8.1 [114];
- Manually selected sequences which introduced long singleton regions to the total alignment;
- Sequences annotated as partial and of low-quality;
- Sequences shorter than 150 or longer than 300 amino acids;
- Sequences of Daphnia magna species (more than 40 sequences annotated as ferritins);
- Sequences that have only coding mRNA sequence without UTRs (so it is impossible to screen it for iron-responsive elements).
4.7. Statistical Analyses
5. Conclusions
Supplementary Materials
Author Contributions
Funding
Institutional Review Board Statement
Informed Consent Statement
Data Availability Statement
Acknowledgments
Conflicts of Interest
References
- Harrison, P.M.; Arosio, P. The Ferritins: Molecular Properties, Iron Storage Function and Cellular Regulation. Biochim. Biophys. Acta (BBA) Bioenerg. 1996, 1275, 161–203. [Google Scholar] [CrossRef]
- Andrews, S.C.; Arosio, P.; Bottke, W.; Briat, J.F.; von Darl, M.; Harrison, P.M.; Laulhère, J.P.; Levi, S.; Lobreaux, S.; Yewdall, S.J. Structure, Function, and Evolution of Ferritins. J. Inorg. Biochem. 1992, 47, 161–174. [Google Scholar] [CrossRef]
- Theil, E.C. Ferritin: Structure, Gene Regulation, and Cellular Function in Animals, Plants, and Microorganisms. Annu. Rev. Biochem. 1987, 56, 289–315. [Google Scholar] [CrossRef]
- Orino, K.; Lehman, L.; Tsuji, Y.; Ayaki, H.; Torti, S.V.; Torti, F.M. Ferritin and the Response to Oxidative Stress. Biochem. J. 2001, 357, 241–247. [Google Scholar] [CrossRef] [PubMed]
- Rucker, P.; Torti, F.M.; Torti, S.V. Role of H and L Subunits in Mouse Ferritin. J. Biol. Chem. 1996, 271, 33352–33357. [Google Scholar] [CrossRef]
- Chen, P.; De Meulenaere, E.; Deheyn, D.D.; Bandaru, P.R. Iron Redox Pathway Revealed in Ferritin via Electron Transfer Analysis. Sci. Rep. 2020, 10, 4033. [Google Scholar] [CrossRef] [PubMed]
- Yévenes, A. The Ferritin Superfamily. In Macromolecular Protein Complexes; Harris, J.R., Marles-Wright, J., Eds.; Subcellular Biochemistry; Springer International Publishing: Cham, Germany, 2017; Volume 83, pp. 75–102. ISBN 978-3-319-46501-2. [Google Scholar]
- Zarjou, A.; Black, L.M.; McCullough, K.R.; Hull, T.D.; Esman, S.K.; Boddu, R.; Varambally, S.; Chandrashekar, D.S.; Feng, W.; Arosio, P.; et al. Ferritin Light Chain Confers Protection Against Sepsis-Induced Inflammation and Organ Injury. Front. Immunol. 2019, 10, 131. [Google Scholar] [CrossRef] [PubMed]
- Fibach, E.; Konijn, A.M.; Rachmilewitz, E.A. Changes in Cellular Ferritin Content during Myeloid Differentiation of Human Leukemic Cell Lines. Am. J. Hematol. 1985, 18, 143–151. [Google Scholar] [CrossRef]
- Li, W.; Garringer, H.J.; Goodwin, C.B.; Richine, B.; Acton, A.; VanDuyn, N.; Muhoberac, B.B.; Irimia-Dominguez, J.; Chan, R.J.; Peacock, M.; et al. Systemic and Cerebral Iron Homeostasis in Ferritin Knock-Out Mice. PLoS ONE 2015, 10, e0117435. [Google Scholar] [CrossRef]
- Mesquita, G.; Silva, T.; Gomes, A.C.; Oliveira, P.F.; Alves, M.G.; Fernandes, R.; Almeida, A.A.; Moreira, A.C.; Gomes, M.S. H-Ferritin Is Essential for Macrophages’ Capacity to Store or Detoxify Exogenously Added Iron. Sci. Rep. 2020, 10, 3061. [Google Scholar] [CrossRef]
- Aversa, I.; Zolea, F.; Ieranò, C.; Bulotta, S.; Trotta, A.M.; Faniello, M.C.; De Marco, C.; Malanga, D.; Biamonte, F.; Viglietto, G.; et al. Epithelial-to-Mesenchymal Transition in FHC-Silenced Cells: The Role of CXCR4/CXCL12 Axis. J. Exp. Clin. Cancer Res. 2017, 36, 104. [Google Scholar] [CrossRef] [PubMed]
- Sioutas, A.; Vainikka, L.K.; Kentson, M.; Dam-Larsen, S.; Wennerström, U.; Jacobson, P.; Persson, H.L. Oxidant-Induced Autophagy and Ferritin Degradation Contribute to Epithelial-Mesenchymal Transition through Lysosomal Iron. J. Inflamm. Res. 2017, 10, 29–39. [Google Scholar] [CrossRef] [PubMed]
- Zhang, K.-H.; Tian, H.-Y.; Gao, X.; Lei, W.-W.; Hu, Y.; Wang, D.-M.; Pan, X.-C.; Yu, M.-L.; Xu, G.-J.; Zhao, F.-K.; et al. Ferritin Heavy Chain-Mediated Iron Homeostasis and Subsequent Increased Reactive Oxygen Species Production Are Essential for Epithelial-Mesenchymal Transition. Cancer Res. 2009, 69, 5340–5348. [Google Scholar] [CrossRef] [PubMed]
- Liu, J.; Gao, L.; Zhan, N.; Xu, P.; Yang, J.; Yuan, F.; Xu, Y.; Cai, Q.; Geng, R.; Chen, Q. Hypoxia Induced Ferritin Light Chain (FTL) Promoted Epithelia Mesenchymal Transition and Chemoresistance of Glioma. J. Exp. Clin. Cancer Res. 2020, 39, 137. [Google Scholar] [CrossRef] [PubMed]
- Fuhrmann, D.C.; Mondorf, A.; Beifuß, J.; Jung, M.; Brüne, B. Hypoxia Inhibits Ferritinophagy, Increases Mitochondrial Ferritin, and Protects from Ferroptosis. Redox Biol. 2020, 36, 101670. [Google Scholar] [CrossRef] [PubMed]
- Brown, C.W.; Amante, J.J.; Chhoy, P.; Elaimy, A.L.; Liu, H.; Zhu, L.J.; Baer, C.E.; Dixon, S.J.; Mercurio, A.M. Prominin2 Drives Ferroptosis Resistance by Stimulating Iron Export. Dev. Cell 2019, 51, 575–586.e4. [Google Scholar] [CrossRef]
- Cobley, J.N.; Fiorello, M.L.; Bailey, D.M. 13 Reasons Why the Brain Is Susceptible to Oxidative Stress. Redox Biol. 2018, 15, 490–503. [Google Scholar] [CrossRef]
- Reinert, A.; Morawski, M.; Seeger, J.; Arendt, T.; Reinert, T. Iron Concentrations in Neurons and Glial Cells with Estimates on Ferritin Concentrations. BMC Neurosci. 2019, 20, 25. [Google Scholar] [CrossRef]
- Hsu, C.-Y.; Chan, Y.-P. Identification and Localization of Proteins Associated with Biomineralization in the Iron Deposition Vesicles of Honeybees (Apis Mellifera). PLoS ONE 2011, 6, e19088. [Google Scholar] [CrossRef]
- De Meulenaere, E.; Bailey, J.B.; Tezcan, F.A.; Deheyn, D.D. First Biochemical and Crystallographic Characterization of a Fast-Performing Ferritin from a Marine Invertebrate. Biochem. J. 2017, 474, 4193–4206. [Google Scholar] [CrossRef]
- Rawat, R.; Deheyn, D.D. Evidence That Ferritin Is Associated with Light Production in the Mucus of the Marine Worm Chaetopterus. Sci. Rep. 2016, 6, 36854. [Google Scholar] [CrossRef]
- Su, C.; Ming, T.; Wu, Y.; Jiang, Q.; Huan, H.; Lu, C.; Zhou, J.; Li, Y.; Song, H.; Su, X. Crystallographic Characterization of Ferritin from Sinonovacula Constricta. Biochem. Biophys. Res. Commun. 2020, 524, 217–223. [Google Scholar] [CrossRef]
- Finoshin, A.D.; Adameyko, K.I.; Mikhailov, K.V.; Kravchuk, O.I.; Georgiev, A.A.; Gornostaev, N.G.; Kosevich, I.A.; Mikhailov, V.S.; Gazizova, G.R.; Shagimardanova, E.I.; et al. Iron Metabolic Pathways in the Processes of Sponge Plasticity. PLoS ONE 2020, 15, e0228722. [Google Scholar] [CrossRef]
- Le Pennec, G.; Perovic, S.; Ammar, M.S.A.; Grebenjuk, V.A.; Steffen, R.; Brümmer, F.; Müller, W.E.G. Cultivation of Primmorphs from the Marine Sponge Suberites Domuncula: Morphogenetic Potential of Silicon and Iron. J. Biotechnol. 2003, 100, 93–108. [Google Scholar] [CrossRef]
- Guan, L.L.; Kanoh, K.; Kamino, K. Effect of Exogenous Siderophores on Iron Uptake Activity of Marine Bacteria under Iron-Limited Conditions. Appl. Environ. Microbiol. 2001, 67, 1710–1717. [Google Scholar] [CrossRef]
- Liu, M.; Fan, L.; Zhong, L.; Kjelleberg, S.; Thomas, T. Metaproteogenomic Analysis of a Community of Sponge Symbionts. ISME J. 2012, 6, 1515–1525. [Google Scholar] [CrossRef] [PubMed]
- Ilbert, M.; Bonnefoy, V. Insight into the Evolution of the Iron Oxidation Pathways. Biochim. Biophys. Acta (BBA) Bioenerg. 2013, 1827, 161–175. [Google Scholar] [CrossRef] [PubMed]
- Bergquist, P.R. Sponges; Hutchinson: London, UK, 1978; ISBN 978-0-09-131820-8. [Google Scholar]
- Ereskovsky, A.V. The Comparative Embryology of Sponges; Springer: Dordrecht, The Netherlands, 2010; ISBN 978-90-481-8574-0. [Google Scholar]
- Simpson, T.L. The Cell Biology of Sponges; Springer: New York, NY, USA, 2012; ISBN 978-1-4612-9740-6. [Google Scholar]
- Ereskovsky, A.; Borisenko, I.E.; Bolshakov, F.V.; Lavrov, A.I. Whole-Body Regeneration in Sponges: Diversity, Fine Mechanisms, and Future Prospects. Genes 2021, 12, 506. [Google Scholar] [CrossRef] [PubMed]
- Ereskovsky, A.V.; Tokina, D.B.; Saidov, D.M.; Baghdiguian, S.; Le Goff, E.; Lavrov, A.I. Transdifferentiation and Mesenchymal-to-epithelial Transition during Regeneration in Demospongiae (Porifera). J. Exp. Zool. Mol. Dev. Evol. 2020, 334, 37–58. [Google Scholar] [CrossRef]
- Sogabe, S.; Hatleberg, W.L.; Kocot, K.M.; Say, T.E.; Stoupin, D.; Roper, K.E.; Fernandez-Valverde, S.L.; Degnan, S.M.; Degnan, B.M. Pluripotency and the Origin of Animal Multicellularity. Nature 2019, 570, 519–522. [Google Scholar] [CrossRef]
- Wilson, H.V. On Some Phenomena of Coalescence and Regeneration in Sponges. J. Exp. Zool. 1907, 5, 245–258. [Google Scholar] [CrossRef]
- Ereskovsky, A.V.; Borisenko, I.E.; Lapébie, P.; Gazave, E.; Tokina, D.B.; Borchiellini, C. Oscarella Lobularis (Homoscleromorpha, Porifera) Regeneration: Epithelial Morphogenesis and Metaplasia. PLoS ONE 2015, 10, e0134566. [Google Scholar] [CrossRef]
- Soubigou, A.; Ross, E.G.; Touhami, Y.; Chrismas, N.; Modepalli, V. Regeneration in Sponge Sycon Ciliatum Mimics Postlarval Development. Development 2020, 147, dev193714. [Google Scholar] [CrossRef]
- Borisenko, I.E.; Adamska, M.; Tokina, D.B.; Ereskovsky, A.V. Transdifferentiation Is a Driving Force of Regeneration in Halisarca Dujardini (Demospongiae, Porifera). Peer J 2015, 3, e1211. [Google Scholar] [CrossRef]
- Korotkova, G.; Movchan, N. The Pecularity of the Protective-Regenerational Processes of the Sponge Halisarca Dujardini. Vestn. Leningr. Univ. 1973, 21, 15–24. [Google Scholar]
- Adameyko, K.I.; Kravchuk, O.I.; Finoshin, A.D.; Bonchuk, A.N.; Georgiev, A.A.; Mikhailov, V.S.; Gornostaev, N.G.; Mikhailov, K.V.; Bacheva, A.V.; Indeykina, M.I.; et al. Structure of Neuroglobin from Cold-Water Sponge Halisarca Dujardinii. Mol. Biol. 2020, 54, 416–420. [Google Scholar] [CrossRef]
- Waterhouse, A.; Bertoni, M.; Bienert, S.; Studer, G.; Tauriello, G.; Gumienny, R.; Heer, F.T.; de Beer, T.A.P.; Rempfer, C.; Bordoli, L.; et al. SWISS-MODEL: Homology Modelling of Protein Structures and Complexes. Nucleic Acids Res. 2018, 46, W296–W303. [Google Scholar] [CrossRef] [PubMed]
- Pettersen, E.F.; Goddard, T.D.; Huang, C.C.; Couch, G.S.; Greenblatt, D.M.; Meng, E.C.; Ferrin, T.E. UCSF Chimera—A Visualization System for Exploratory Research and Analysis. J. Comput. Chem. 2004, 25, 1605–1612. [Google Scholar] [CrossRef] [PubMed]
- Sievers, F.; Higgins, D.G. Clustal Omega for Making Accurate Alignments of Many Protein Sequences: Clustal Omega for Many Protein Sequences. Protein Sci. 2018, 27, 135–145. [Google Scholar] [CrossRef] [PubMed]
- Capella-Gutierrez, S.; Silla-Martinez, J.M.; Gabaldon, T. TrimAl: A Tool for Automated Alignment Trimming in Large-Scale Phylogenetic Analyses. Bioinformatics 2009, 25, 1972–1973. [Google Scholar] [CrossRef]
- Minh, B.Q.; Schmidt, H.A.; Chernomor, O.; Schrempf, D.; Woodhams, M.D.; von Haeseler, A.; Lanfear, R. IQ-TREE 2: New Models and Efficient Methods for Phylogenetic Inference in the Genomic Era. Mol. Biol. Evol. 2020, 37, 1530–1534. [Google Scholar] [CrossRef]
- Letunic, I.; Bork, P. Interactive Tree Of Life (ITOL) v4: Recent Updates and New Developments. Nucleic Acids Res. 2019, 47, W256–W259. [Google Scholar] [CrossRef]
- Levi, S.; Santambrogio, P.; Corsi, B.; Cozzi, A.; Arosio, P. Evidence That Residues Exposed on the Three-Fold Channels Have Active Roles in the Mechanism of Ferritin Iron Incorporation. Biochem. J. 1996, 317, 467–473. [Google Scholar] [CrossRef]
- Turiel-Fernández, D.; Blanco-González, E.; Corte-Rodríguez, M.; Bettmer, J.; Montes-Bayón, M. Analytical Strategies to Study the Formation and Drug Delivery Capabilities of Ferritin-Encapsulated Cisplatin in Sensitive and Resistant Cell Models. Anal. Bioanal. Chem. 2020, 412, 6319–6327. [Google Scholar] [CrossRef]
- Bause, E. Structural Requirements of N-Glycosylation of Proteins. Studies with Proline Peptides as Conformational Probes. Biochem. J. 1983, 209, 331–336. [Google Scholar] [CrossRef] [PubMed]
- Truman-Rosentsvit, M.; Berenbaum, D.; Spektor, L.; Cohen, L.A.; Belizowsky-Moshe, S.; Lifshitz, L.; Ma, J.; Li, W.; Kesselman, E.; Abutbul-Ionita, I.; et al. Ferritin Is Secreted via 2 Distinct Nonclassical Vesicular Pathways. Blood 2018, 131, 342–352. [Google Scholar] [CrossRef]
- Sinha, M.; Sen, C.K.; Singh, K.; Das, A.; Ghatak, S.; Rhea, B.; Blackstone, B.; Powell, H.M.; Khanna, S.; Roy, S. Direct Conversion of Injury-Site Myeloid Cells to Fibroblast-like Cells of Granulation Tissue. Nat. Commun. 2018, 9, 936. [Google Scholar] [CrossRef] [PubMed]
- Islam, M.A.; Sooro, M.; Zhang, P. Autophagic Regulation of P62 Is Critical for Cancer Therapy. Int. J. Mol. Sci. 2018, 19, 1405. [Google Scholar] [CrossRef] [PubMed]
- Mildenberger, J.; Johansson, I.; Sergin, I.; Kjøbli, E.; Damås, J.K.; Razani, B.; Flo, T.H.; Bjørkøy, G. N-3 PUFAs Induce Inflammatory Tolerance by Formation of KEAP1-Containing SQSTM1/P62-Bodies and Activation of NFE2L2. Autophagy 2017, 13, 1664–1678. [Google Scholar] [CrossRef] [PubMed]
- Ereskovsky, A.V.; Gonobobleva, E.; Vishnyakov, A. Morphological Evidence for Vertical Transmission of Symbiotic Bacteria in the Viviparous Sponge Halisarca Dujardini Johnston (Porifera, Demospongiae, Halisarcida). Mar. Biol. 2005, 146, 869–875. [Google Scholar] [CrossRef]
- Schmittmann, L.; Franzenburg, S.; Pita, L. Individuality in the Immune Repertoire and Induced Response of the Sponge Halichondria Panicea. Front. Immunol. 2021, 12, 689051. [Google Scholar] [CrossRef]
- Wang, K.; Wommack, K.E.; Chen, F. Abundance and Distribution of Synechococcus Spp. and Cyanophages in the Chesapeake Bay. Appl. Environ. Microbiol. 2011, 77, 7459–7468. [Google Scholar] [CrossRef] [PubMed]
- Richard, K.L.; Kelley, B.R.; Johnson, J.G. Heme Uptake and Utilization by Gram-Negative Bacterial Pathogens. Front. Cell. Infect. Microbiol. 2019, 9, 81. [Google Scholar] [CrossRef]
- Beck, G.; Ellis, T.W.; Habicht, G.S.; Schluter, S.F.; Marchalonis, J.J. Evolution of the Acute Phase Response: Iron Release by Echinoderm (Asterias Forbesi) Coelomocytes, and Cloning of an Echinoderm Ferritin Molecule. Dev. Comp. Immunol. 2002, 26, 11–26. [Google Scholar] [CrossRef]
- Neves, J.V.; Wilson, J.M.; Rodrigues, P.N.S. Transferrin and Ferritin Response to Bacterial Infection: The Role of the Liver and Brain in Fish. Dev. Comp. Immunol. 2009, 33, 848–857. [Google Scholar] [CrossRef]
- Tang, T.; Yang, Z.; Li, J.; Yuan, F.; Xie, S.; Liu, F. Identification of Multiple Ferritin Genes in Macrobrachium Nipponense and Their Involvement in Redox Homeostasis and Innate Immunity. Fish Shellfish Immunol. 2019, 89, 701–709. [Google Scholar] [CrossRef] [PubMed]
- Daniels, C.; Breitbart, M. Bacterial Communities Associated with the Ctenophores Mnemiopsis Leidyi and Beroe Ovata. FEMS Microbiol. Ecol. 2012, 82, 90–101. [Google Scholar] [CrossRef] [PubMed]
- Hammann, S.; Moss, A.; Zimmer, M. Sterile Surfaces of < I> Mnemiopsis Leidyi< /I> (Ctenophora) in Bacterial Suspension—A Key to Invasion Success? Open J. Mar. Sci. 2015, 5, 237–246. [Google Scholar] [CrossRef]
- Traylor-Knowles, N.; Vandepas, L.E.; Browne, W.E. Still Enigmatic: Innate Immunity in the Ctenophore Mnemiopsis Leidyi. Integr. Comp. Biol. 2019, 59, 811–818. [Google Scholar] [CrossRef]
- Bennett, K.M.; Shapiro, E.M.; Sotak, C.H.; Koretsky, A.P. Controlled Aggregation of Ferritin to Modulate MRI Relaxivity. Biophys. J. 2008, 95, 342–351. [Google Scholar] [CrossRef] [PubMed]
- Luscieti, S.; Galy, B.; Gutierrez, L.; Reinke, M.; Couso, J.; Shvartsman, M.; Di Pascale, A.; Witke, W.; Hentze, M.W.; Pilo Boyl, P.; et al. The Actin-Binding Protein Profilin 2 Is a Novel Regulator of Iron Homeostasis. Blood 2017, 130, 1934–1945. [Google Scholar] [CrossRef]
- Ereskovsky, A. Reproduction Cycles and Strategies of the Cold-Water Sponges Halisarca Dujardini (Demospongiae, Halisarcida), Myxilla Incrustans and Iophon Piceus (Demospongiae, Poecilosclerida) from the White Sea. Biol. Bull. 2000, 198, 77–87. [Google Scholar] [CrossRef] [PubMed]
- Pita, L.; Hoeppner, M.P.; Ribes, M.; Hentschel, U. Differential Expression of Immune Receptors in Two Marine Sponges upon Exposure to Microbial-Associated Molecular Patterns. Sci. Rep. 2018, 8, 16081. [Google Scholar] [CrossRef]
- Chikhi, R.; Medvedev, P. Informed and Automated K-Mer Size Selection for Genome Assembly. Bioinformatics 2014, 30, 31–37. [Google Scholar] [CrossRef]
- Zimin, A.V.; Marçais, G.; Puiu, D.; Roberts, M.; Salzberg, S.L.; Yorke, J.A. The MaSuRCA Genome Assembler. Bioinformatics 2013, 29, 2669–2677. [Google Scholar] [CrossRef] [PubMed]
- Pryszcz, L.P.; Gabaldón, T. Redundans: An Assembly Pipeline for Highly Heterozygous Genomes. Nucleic Acids Res. 2016, 44, e113. [Google Scholar] [CrossRef] [PubMed]
- Gurevich, A.; Saveliev, V.; Vyahhi, N.; Tesler, G. QUAST: Quality Assessment Tool for Genome Assemblies. Bioinformatics 2013, 29, 1072–1075. [Google Scholar] [CrossRef]
- Seppey, M.; Manni, M.; Zdobnov, E.M. BUSCO: Assessing Genome Assembly and Annotation Completeness. Methods Mol. Biol. 2019, 1962, 227–245. [Google Scholar] [CrossRef] [PubMed]
- Stanke, M.; Morgenstern, B. AUGUSTUS: A Web Server for Gene Prediction in Eukaryotes That Allows User-Defined Constraints. Nucleic Acids Res. 2005, 33, W465–W467. [Google Scholar] [CrossRef] [PubMed]
- Besemer, J.; Borodovsky, M. GeneMark: Web Software for Gene Finding in Prokaryotes, Eukaryotes and Viruses. Nucleic Acids Res. 2005, 33, W451–W454. [Google Scholar] [CrossRef] [PubMed]
- Cantarel, B.L.; Korf, I.; Robb, S.M.C.; Parra, G.; Ross, E.; Moore, B.; Holt, C.; Sanchez Alvarado, A.; Yandell, M. MAKER: An Easy-to-Use Annotation Pipeline Designed for Emerging Model Organism Genomes. Genome Res. 2007, 18, 188–196. [Google Scholar] [CrossRef] [PubMed]
- Rice, P.; Longden, I.; Bleasby, A. EMBOSS: The European Molecular Biology Open Software Suite. Trends Genet. 2000, 16, 276–277. [Google Scholar] [CrossRef]
- Baumlein, H.; Nagy, I.; Villarroel, R.; Inze, D.; Wobus, U. Cis-Analysis of a Seed Protein Gene Promoter: The Conservative RY Repeat CATGCATG within the Legumin Box Is Essential for Tissue-Specific Expression of a Legumin Gene. Plant J. 1992, 2, 233–239. [Google Scholar] [CrossRef]
- Biedenkapp, H.; Borgmeyer, U.; Sippel, A.E.; Klempnauer, K.H. Viral Myb Oncogene Encodes a Sequence-Specific DNA-Binding Activity. Nature 1988, 335, 835–837. [Google Scholar] [CrossRef]
- Dynan, W.S.; Tjian, R. Control of Eukaryotic Messenger RNA Synthesis by Sequence-Specific DNA-Binding Proteins. Nature 1985, 316, 774–778. [Google Scholar] [CrossRef]
- Karin, M.; Haslinger, A.; Heguy, A.; Dietlin, T.; Cooke, T. Metal-Responsive Elements Act as Positive Modulators of Human Metallothionein-IIA Enhancer Activity. Mol. Cell. Biol. 1987, 7, 606–613. [Google Scholar] [CrossRef]
- Lewis, B.A.; Kim, T.-K.; Orkin, S.H. A Downstream Element in the Human Beta-Globin Promoter: Evidence of Extended Sequence-Specific Transcription Factor IID Contacts. Proc. Natl. Acad. Sci. USA 2000, 97, 7172–7177. [Google Scholar] [CrossRef] [PubMed]
- Maity, S.; Golumbek, P.; Karsenty, G.; de Crombrugghe, B. Selective Activation of Transcription by a Novel CCAAT Binding Factor. Science 1988, 241, 582–585. [Google Scholar] [CrossRef] [PubMed]
- Marcotte, W.R.; Russell, S.H.; Quatrano, R.S. Abscisic Acid-Responsive Sequences from the Em Gene of Wheat. Plant Cell 1989, 1, 969–976. [Google Scholar] [CrossRef] [PubMed]
- Murre, C.; McCaw, P.S.; Baltimore, D. A New DNA Binding and Dimerization Motif in Immunoglobulin Enhancer Binding, Daughterless, MyoD, and Myc Proteins. Cell 1989, 56, 777–783. [Google Scholar] [CrossRef]
- Otsuki, A.; Suzuki, M.; Katsuoka, F.; Tsuchida, K.; Suda, H.; Morita, M.; Shimizu, R.; Yamamoto, M. Unique Cistrome Defined as CsMBE Is Strictly Required for Nrf2-SMaf Heterodimer Function in Cytoprotection. Free Radic. Biol. Med. 2016, 91, 45–57. [Google Scholar] [CrossRef]
- Raghunath, A.; Sundarraj, K.; Nagarajan, R.; Arfuso, F.; Bian, J.; Kumar, A.P.; Sethi, G.; Perumal, E. Antioxidant Response Elements: Discovery, Classes, Regulation and Potential Applications. Redox Biol. 2018, 17, 297–314. [Google Scholar] [CrossRef]
- Rashid, I.; Nagpure, N.S.; Srivastava, P.; Kumar, R.; Pathak, A.K.; Singh, M.; Kushwaha, B. HRGFish: A Database of Hypoxia Responsive Genes in Fishes. Sci. Rep. 2017, 7, 42346. [Google Scholar] [CrossRef] [PubMed]
- Sen, R.; Baltimore, D. Multiple Nuclear Factors Interact with the Immunoglobulin Enhancer Sequences. Cell 1986. 46: 705-716. J. Immunol. 2006, 177, 7485–7496. [Google Scholar] [PubMed]
- Smale, S.T.; Kadonaga, J.T. The RNA Polymerase II Core Promoter. Annu. Rev. Biochem. 2003, 72, 449–479. [Google Scholar] [CrossRef]
- Szczyglowski, K.; Szabados, L.; Fujimoto, S.Y.; Silver, D.; de Bruijn, F.J. Site-Specific Mutagenesis of the Nodule-Infected Cell Expression (NICE) Element and the AT-Rich Element ATRE-BS2* of the Sesbania Rostrata Leghemoglobin Glb3 Promoter. Plant Cell 1994, 6, 317–332. [Google Scholar] [CrossRef] [PubMed]
- Yamaguchi-Shinozaki, K.; Shinozaki, K. A Novel Cis-Acting Element in an Arabidopsis Gene Is Involved in Responsiveness to Drought, Low-Temperature, or High-Salt Stress. Plant Cell 1994, 6, 251–264. [Google Scholar] [CrossRef] [PubMed]
- Fornes, O.; Castro-Mondragon, J.A.; Khan, A.; van der Lee, R.; Zhang, X.; Richmond, P.A.; Modi, B.P.; Correard, S.; Gheorghe, M.; Baranašić, D.; et al. JASPAR 2020: Update of the Open-Access Database of Transcription Factor Binding Profiles. Nucleic Acids Res. 2019, 10, 1001. [Google Scholar] [CrossRef]
- Campillos, M.; Cases, I.; Hentze, M.W.; Sanchez, M. SIREs: Searching for Iron-Responsive Elements. Nucleic Acids Res. 2010, 38, W360–W367. [Google Scholar] [CrossRef]
- Li, B.; Dewey, C.N. RSEM: Accurate Transcript Quantification from RNA-Seq Data with or without a Reference Genome. BMC Bioinform. 2011, 12, 323. [Google Scholar] [CrossRef] [PubMed]
- Love, M.I.; Huber, W.; Anders, S. Moderated Estimation of Fold Change and Dispersion for RNA-Seq Data with DESeq2. Genome Biol. 2014, 15, 550. [Google Scholar] [CrossRef] [PubMed]
- McCarthy, D.J.; Chen, Y.; Smyth, G.K. Differential Expression Analysis of Multifactor RNA-Seq Experiments with Respect to Biological Variation. Nucleic Acids Res. 2012, 40, 4288–4297. [Google Scholar] [CrossRef]
- Gu, Z.; Eils, R.; Schlesner, M. Complex Heatmaps Reveal Patterns and Correlations in Multidimensional Genomic Data. Bioinformatics 2016, 32, 2847–2849. [Google Scholar] [CrossRef] [PubMed]
- Schmidt, W. CapSelect: A Highly Sensitive Method for 5′ CAP-Dependent Enrichment of Full-Length CDNA in PCR-Mediated Analysis of MRNAs. Nucleic Acids Res. 1999, 27, 311–331. [Google Scholar] [CrossRef]
- Matz, M. Amplification of CDNA Ends Based on Template-Switching Effect and Step- out PCR. Nucleic Acids Res. 1999, 27, 1558–1560. [Google Scholar] [CrossRef]
- Buchfink, B.; Xie, C.; Huson, D.H. Fast and Sensitive Protein Alignment Using DIAMOND. Nat. Methods 2015, 12, 59–60. [Google Scholar] [CrossRef]
- Kumar, S.; Stecher, G.; Li, M.; Knyaz, C.; Tamura, K. MEGA X: Molecular Evolutionary Genetics Analysis across Computing Platforms. Mol. Biol. Evol. 2018, 35, 1547–1549. [Google Scholar] [CrossRef]
- Lyupina, Y.V.; Zatsepina, O.G.; Serebryakova, M.V.; Erokhov, P.A.; Abaturova, S.B.; Kravchuk, O.I.; Orlova, O.V.; Beljelarskaya, S.N.; Lavrov, A.I.; Sokolova, O.S.; et al. Proteomics of the 26S Proteasome in Spodoptera Frugiperda Cells Infected with the Nucleopolyhedrovirus, AcMNPV. Biochim. Biophys. Acta (BBA) Proteins Proteom. 2016, 1864, 738–746. [Google Scholar] [CrossRef]
- May, M.E.; Fish, W.W. The Uv and Visible Spectral Properties of Ferritin. Arch. Biochem. Biophys. 1978, 190, 720–725. [Google Scholar] [CrossRef]
- Wolszczak, M.; Gajda, J. Iron Release from Ferritin Induced by Light and Ionizing Radiation. Res. Chem. Intermed. 2010, 36, 549–563. [Google Scholar] [CrossRef][Green Version]
- Leong, L.M.; Tan, B.H.; Ho, K.K. A Specific Stain for the Detection of Nonheme Iron Proteins in Polyacrylamide Gels. Anal. Biochem. 1992, 207, 317–320. [Google Scholar] [CrossRef]
- Kravchuk, O.I.; Lyupina, Y.V.; Erokhov, P.A.; Finoshin, A.D.; Adameyko, K.I.; Mishyna, M.Y.; Moiseenko, A.V.; Sokolova, O.S.; Orlova, O.V.; Beljelarskaya, S.N.; et al. Characterization of the 20S Proteasome of the Lepidopteran, Spodoptera Frugiperda. Biochim. Biophys. Acta (BBA) Proteins Proteom. 2019, 1867, 840–853. [Google Scholar] [CrossRef] [PubMed]
- Robert, X.; Gouet, P. Deciphering Key Features in Protein Structures with the New ENDscript Server. Nucleic Acids Res. 2014, 42, W320–W324. [Google Scholar] [CrossRef]
- Waterhouse, A.M.; Procter, J.B.; Martin, D.M.A.; Clamp, M.; Barton, G.J. Jalview Version 2—A Multiple Sequence Alignment Editor and Analysis Workbench. Bioinformatics 2009, 25, 1189–1191. [Google Scholar] [CrossRef] [PubMed]
- Camacho, C.; Coulouris, G.; Avagyan, V.; Ma, N.; Papadopoulos, J.; Bealer, K.; Madden, T.L. BLAST+: Architecture and Applications. BMC Bioinform. 2009, 10, 421. [Google Scholar] [CrossRef]
- Remmert, M.; Biegert, A.; Hauser, A.; Söding, J. HHblits: Lightning-Fast Iterative Protein Sequence Searching by HMM-HMM Alignment. Nat. Methods 2012, 9, 173–175. [Google Scholar] [CrossRef] [PubMed]
- Yang, J.; Yan, R.; Roy, A.; Xu, D.; Poisson, J.; Zhang, Y. The I-TASSER Suite: Protein Structure and Function Prediction. Nat. Methods 2015, 12, 7–8. [Google Scholar] [CrossRef]
- Benkert, P.; Biasini, M.; Schwede, T. Toward the Estimation of the Absolute Quality of Individual Protein Structure Models. Bioinformatics 2011, 27, 343–350. [Google Scholar] [CrossRef]
- Kans, J. Entrez Direct: E-Utilities on the Unix Command Line. Available online: https://www.ncbi.nlm.nih.gov/books/NBK179288 (accessed on 5 April 2021).
- Fu, L.; Niu, B.; Zhu, Z.; Wu, S.; Li, W. CD-HIT: Accelerated for Clustering the next-Generation Sequencing Data. Bioinformatics 2012, 28, 3150–3152. [Google Scholar] [CrossRef] [PubMed]
- Boyko, A.V.; Girich, A.S.; Eliseikina, M.G.; Maslennikov, S.I.; Dolmatov, I.Y. Reference Assembly and Gene Expression Analysis of Apostichopus Japonicus Larval Development. Sci. Rep. 2019, 9, 1131. [Google Scholar] [CrossRef]
- Chávez-Mardones, J.; Valenzuela-Muñoz, V.; Núñez-Acuña, G.; Maldonado-Aguayo, W.; Gallardo-Escárate, C. Concholepas Concholepas Ferritin H-like Subunit (CcFer): Molecular Characterization and Single Nucleotide Polymorphism Associated to Innate Immune Response. Fish Shellfish Immunol. 2013, 35, 910–917. [Google Scholar] [CrossRef]
- Ereskovsky, A.V.; Richter, D.J.; Lavrov, D.V.; Schippers, K.J.; Nichols, S.A. Transcriptome Sequencing and Delimitation of Sympatric Oscarella Species (O. Carmela and O. Pearsei Sp. Nov) from California, USA. PLoS ONE 2017, 12, e0183002. [Google Scholar] [CrossRef]
- Faddeeva, A.; Studer, R.A.; Kraaijeveld, K.; Sie, D.; Ylstra, B.; Mariën, J.; op den Camp, H.J.M.; Datema, E.; den Dunnen, J.T.; van Straalen, N.M.; et al. Collembolan Transcriptomes Highlight Molecular Evolution of Hexapods and Provide Clues on the Adaptation to Terrestrial Life. PLoS ONE 2015, 10, e0130600. [Google Scholar] [CrossRef]
- Galay, R.L.; Umemiya-Shirafuji, R.; Bacolod, E.T.; Maeda, H.; Kusakisako, K.; Koyama, J.; Tsuji, N.; Mochizuki, M.; Fujisaki, K.; Tanaka, T. Two Kinds of Ferritin Protect Ixodid Ticks from Iron Overload and Consequent Oxidative Stress. PLoS ONE 2014, 9, e90661. [Google Scholar] [CrossRef]
- Hamburger, A.E.; West, A.P.; Hamburger, Z.A.; Hamburger, P.; Bjorkman, P.J. Crystal Structure of a Secreted Insect Ferritin Reveals a Symmetrical Arrangement of Heavy and Light Chains. J. Mol. Biol. 2005, 349, 558–569. [Google Scholar] [CrossRef]
- Hehenberger, E.; Eitel, M.; Fortunato, S.A.V.; Miller, D.J.; Keeling, P.J.; Cahill, M.A. Early Eukaryotic Origins and Metazoan Elaboration of MAPR Family Proteins. Mol. Phylogenet. Evol. 2020, 148, 106814. [Google Scholar] [CrossRef] [PubMed]
- Huan, P.; Liu, G.; Wang, H.; Liu, B. Multiple Ferritin Subunit Genes of the Pacific Oyster Crassostrea Gigas and Their Distinct Expression Patterns during Early Development. Gene 2014, 546, 80–88. [Google Scholar] [CrossRef]
- Jin, C.; Li, C.; Su, X.; Li, T. Identification and Characterization of a Tegillarca Granosa Ferritin Regulated by Iron Ion Exposure and Thermal Stress. Dev. Comp. Immunol. 2011, 35, 745–751. [Google Scholar] [CrossRef]
- Kayal, E.; Bentlage, B.; Sabrina Pankey, M.; Ohdera, A.H.; Medina, M.; Plachetzki, D.C.; Collins, A.G.; Ryan, J.F. Phylogenomics Provides a Robust Topology of the Major Cnidarian Lineages and Insights on the Origins of Key Organismal Traits. BMC Evol Biol. 2018, 18, 68. [Google Scholar] [CrossRef]
- Kenny, N.J.; Plese, B.; Riesgo, A.; Itskovich, V.B. Symbiosis, Selection, and Novelty: Freshwater Adaptation in the Unique Sponges of Lake Baikal. Mol. Biol. Evol. 2019, 36, 2462–2480. [Google Scholar] [CrossRef]
- Kong, P.; Wang, L.; Zhang, H.; Zhou, Z.; Qiu, L.; Gai, Y.; Song, L. Two Novel Secreted Ferritins Involved in Immune Defense of Chinese Mitten Crab Eriocheir Sinensis. Fish Shellfish Immunol. 2010, 28, 604–612. [Google Scholar] [CrossRef]
- Korhonen, P.K.; Pozio, E.; La Rosa, G.; Chang, B.C.H.; Koehler, A.V.; Hoberg, E.P.; Boag, P.R.; Tan, P.; Jex, A.R.; Hofmann, A.; et al. Phylogenomic and Biogeographic Reconstruction of the Trichinella Complex. Nat. Commun. 2016, 7, 10513. [Google Scholar] [CrossRef]
- Krasko, A.; Schröder, H.C.; Batel, R.; Grebenjuk, V.A.; Steffen, R.; Müller, I.M.; Müller, W.E.G. Iron Induces Proliferation and Morphogenesis in Primmorphs from the Marine Sponge Suberites domuncula. DNA Cell Biol. 2002, 21, 67–80. [Google Scholar] [CrossRef]
- Lewis Ames, C.; Ryan, J.F.; Bely, A.E.; Cartwright, P.; Collins, A.G. A New Transcriptome and Transcriptome Profiling of Adult and Larval Tissue in the Box Jellyfish Alatina Alata: An Emerging Model for Studying Venom, Vision and Sex. BMC Genom. 2016, 17, 650. [Google Scholar] [CrossRef]
- Li, C.; Li, Z.; Li, Y.; Zhou, J.; Zhang, C.; Su, X.; Li, T. A Ferritin from Dendrorhynchus Zhejiangensis with Heavy Metals Detoxification Activity. PLoS ONE 2012, 7, e51428. [Google Scholar] [CrossRef] [PubMed]
- Li, M.; Saren, G.; Zhang, S. Identification and Expression of a Ferritin Homolog in Amphioxus Branchiostoma Belcheri: Evidence for Its Dual Role in Immune Response and Iron Metabolism. Comp. Biochem. Physiol. Part B Biochem. Mol. Biol. 2008, 150, 263–270. [Google Scholar] [CrossRef]
- Masuda, T.; Zang, J.; Zhao, G.; Mikami, B. The First Crystal Structure of Crustacean Ferritin That Is a Hybrid Type of H and L Ferritin: First Crystal Structure of Crustacean Ferritin. Protein Sci. 2018, 27, 1955–1960. [Google Scholar] [CrossRef]
- Ming, T.; Huan, H.; Su, C.; Huo, C.; Wu, Y.; Jiang, Q.; Qiu, X.; Lu, C.; Zhou, J.; Li, Y.; et al. Structural Comparison of Two Ferritins from the Marine Invertebrate Phascolosoma esculenta. FEBS Open Biol. 2021, 11, 793–803. [Google Scholar] [CrossRef]
- Pg, B.-L.; Ae, M.; Rj, O.; Ph, W.A.B. Transcriptomic Profiles of Spring and Summer Populations of the Southern Ocean Salp, Salpa Thompsoni, in the Western Antarctic Peninsula Region. Polar Biol. 2017, 40, 1261–1276. [Google Scholar] [CrossRef]
- Ramírez-Gómez, F.; Ortíz-Pineda, P.A.; Rojas-Cartagena, C.; Suárez-Castillo, E.C.; García-Ararrás, J.E. Immune-Related Genes Associated with Intestinal Tissue in the Sea Cucumber Holothuria Glaberrima. Immunogenetics 2008, 60, 57–71. [Google Scholar] [CrossRef]
- Ren, C.; Chen, T.; Jiang, X.; Wang, Y.; Hu, C. Identification and Functional Characterization of a Novel Ferritin Subunit from the Tropical Sea Cucumber, Stichopus Monotuberculatus. Fish Shellfish Immunol. 2014, 38, 265–274. [Google Scholar] [CrossRef] [PubMed]
- Riesgo, A.; Farrar, N.; Windsor, P.J.; Giribet, G.; Leys, S.P. The Analysis of Eight Transcriptomes from All Poriferan Classes Reveals Surprising Genetic Complexity in Sponges. Mol. Biol. Evol. 2014, 31, 1102–1120. [Google Scholar] [CrossRef] [PubMed]
- Satou, Y.; Nakamura, R.; Yu, D.; Yoshida, R.; Hamada, M.; Fujie, M.; Hisata, K.; Takeda, H.; Satoh, N. A Nearly Complete Genome of Ciona Intestinalis Type A (C. Robusta) Reveals the Contribution of Inversion to Chromosomal Evolution in the Genus Ciona. Genome Biol. Evol. 2019, 11, 3144–3157. [Google Scholar] [CrossRef] [PubMed]
- Schenk, S.; Bannister, S.C.; Sedlazeck, F.J.; Anrather, D.; Minh, B.Q.; Bileck, A.; Hartl, M.; von Haeseler, A.; Gerner, C.; Raible, F.; et al. Combined Transcriptome and Proteome Profiling Reveals Specific Molecular Brain Signatures for Sex, Maturation and Circalunar Clock Phase. Elife 2019, 8, e41556. [Google Scholar] [CrossRef]
- Shingate, P.; Ravi, V.; Prasad, A.; Tay, B.-H.; Garg, K.M.; Chattopadhyay, B.; Yap, L.-M.; Rheindt, F.E.; Venkatesh, B. Chromosome-Level Assembly of the Horseshoe Crab Genome Provides Insights into Its Genome Evolution. Nat. Commun. 2020, 11, 2322. [Google Scholar] [CrossRef]
- Treibergs, K.A.; Giribet, G. Differential Gene Expression Between Polymorphic Zooids of the Marine Bryozoan Bugulina stolonifera. G3 Genes Genomes Genet. 2020, 10, 3843–3857. [Google Scholar] [CrossRef] [PubMed]
- Voigt, O.; Fradusco, B.; Gut, C.; Kevrekidis, C.; Vargas, S.; Wörheide, G. Carbonic Anhydrases: An Ancient Tool in Calcareous Sponge Biomineralization. Front. Genet. 2021, 12, 624533. [Google Scholar] [CrossRef]
- Wang, H.; Jiang, X.; Wu, J.; Zhang, L.; Huang, J.; Zhang, Y.; Zou, X.; Liang, B. Iron Overload Coordinately Promotes Ferritin Expression and Fat Accumulation in Caenorhabditis elegans. Genetics 2016, 203, 241–253. [Google Scholar] [CrossRef]
- Wang, K.; Tomura, R.; Chen, W.; Kiyooka, M.; Ishizaki, H.; Aizu, T.; Minakuchi, Y.; Seki, M.; Suzuki, Y.; Omotezako, T.; et al. A Genome Database for a Japanese Population of the Larvacean Oikopleura dioica. Dev. Growth Differ. 2020, 62, 450–461. [Google Scholar] [CrossRef]
- Windsor Reid, P.J.; Matveev, E.; McClymont, A.; Posfai, D.; Hill, A.L.; Leys, S.P. Wnt Signaling and Polarity in Freshwater Sponges. BMC Evol. Biol. 2018, 18, 12. [Google Scholar] [CrossRef]
- Wippler, J.; Kleiner, M.; Lott, C.; Gruhl, A.; Abraham, P.E.; Giannone, R.J.; Young, J.C.; Hettich, R.L.; Dubilier, N. Transcriptomic and Proteomic Insights into Innate Immunity and Adaptations to a Symbiotic Lifestyle in the Gutless Marine Worm Olavius Algarvensis. BMC Genom. 2016, 17, 942. [Google Scholar] [CrossRef]
- Zhou, J.; Hou, F.; Li, Y.; Su, X.; Li, T.; Jin, C. Construction of a CDNA Library for Sea Cucumber Acaudina Leucoprocta and Differential Expression of Ferritin Peptide. Chin. J. Ocean. Limnol. 2016, 34, 719–729. [Google Scholar] [CrossRef]
- Slater, G.; Birney, E. Automated Generation of Heuristics for Biological Sequence Comparison. BMC Bioinform. 2005, 6, 31. [Google Scholar] [CrossRef] [PubMed]
- Moroz, L.L.; Kocot, K.M.; Citarella, M.R.; Dosung, S.; Norekian, T.P.; Povolotskaya, I.S.; Grigorenko, A.P.; Dailey, C.; Berezikov, E.; Buckley, K.M.; et al. The Ctenophore Genome and the Evolutionary Origins of Neural Systems. Nature 2014, 510, 109–114. [Google Scholar] [CrossRef] [PubMed]
- Grant, C.E.; Bailey, T.L.; Noble, W.S. FIMO: Scanning for Occurrences of a given Motif. Bioinformatics 2011, 27, 1017–1018. [Google Scholar] [CrossRef] [PubMed]
- Almagro Armenteros, J.J.; Tsirigos, K.D.; Sønderby, C.K.; Petersen, T.N.; Winther, O.; Brunak, S.; von Heijne, G.; Nielsen, H. SignalP 5.0 Improves Signal Peptide Predictions Using Deep Neural Networks. Nat. Biotechnol. 2019, 37, 420–423. [Google Scholar] [CrossRef] [PubMed]
- Gasteiger, E.; Gattiker, A.; Hoogland, C.; Ivanyi, I.; Appel, R.D.; Bairoch, A. ExPASy: The Proteomics Server for in-Depth Protein Knowledge and Analysis. Nucleic Acids Res. 2003, 31, 3784–3788. [Google Scholar] [CrossRef]
- Paul George, A.A.; Lacerda, M.; Syllwasschy, B.F.; Hopp, M.-T.; Wißbrock, A.; Imhof, D. HeMoQuest: A Webserver for Qualitative Prediction of Transient Heme Binding to Protein Motifs. BMC Bioinform. 2020, 21, 124. [Google Scholar] [CrossRef]
- Chen, Z.; Zhao, P.; Li, C.; Li, F.; Xiang, D.; Chen, Y.-Z.; Akutsu, T.; Daly, R.J.; Webb, G.I.; Zhao, Q.; et al. ILearnPlus: A Comprehensive and Automated Machine-Learning Platform for Nucleic Acid and Protein Sequence Analysis, Prediction and Visualization. Nucleic Acids Res. 2021, 49, e60. [Google Scholar] [CrossRef] [PubMed]
- Li, J.; Cheng, K.; Wang, S.; Morstatter, F.; Trevino, R.P.; Tang, J.; Liu, H. Feature Selection: A Data Perspective. ACM Comput. Surv. 2018, 50, 1–45. [Google Scholar] [CrossRef]


Publisher’s Note: MDPI stays neutral with regard to jurisdictional claims in published maps and institutional affiliations. |
© 2021 by the authors. Licensee MDPI, Basel, Switzerland. This article is an open access article distributed under the terms and conditions of the Creative Commons Attribution (CC BY) license (https://creativecommons.org/licenses/by/4.0/).
Share and Cite
Adameyko, K.I.; Burakov, A.V.; Finoshin, A.D.; Mikhailov, K.V.; Kravchuk, O.I.; Kozlova, O.S.; Gornostaev, N.G.; Cherkasov, A.V.; Erokhov, P.A.; Indeykina, M.I.; et al. Conservative and Atypical Ferritins of Sponges. Int. J. Mol. Sci. 2021, 22, 8635. https://doi.org/10.3390/ijms22168635
Adameyko KI, Burakov AV, Finoshin AD, Mikhailov KV, Kravchuk OI, Kozlova OS, Gornostaev NG, Cherkasov AV, Erokhov PA, Indeykina MI, et al. Conservative and Atypical Ferritins of Sponges. International Journal of Molecular Sciences. 2021; 22(16):8635. https://doi.org/10.3390/ijms22168635
Chicago/Turabian StyleAdameyko, Kim I., Anton V. Burakov, Alexander D. Finoshin, Kirill V. Mikhailov, Oksana I. Kravchuk, Olga S. Kozlova, Nicolay G. Gornostaev, Alexander V. Cherkasov, Pavel A. Erokhov, Maria I. Indeykina, and et al. 2021. "Conservative and Atypical Ferritins of Sponges" International Journal of Molecular Sciences 22, no. 16: 8635. https://doi.org/10.3390/ijms22168635
APA StyleAdameyko, K. I., Burakov, A. V., Finoshin, A. D., Mikhailov, K. V., Kravchuk, O. I., Kozlova, O. S., Gornostaev, N. G., Cherkasov, A. V., Erokhov, P. A., Indeykina, M. I., Bugrova, A. E., Kononikhin, A. S., Moiseenko, A. V., Sokolova, O. S., Bonchuk, A. N., Zhegalova, I. V., Georgiev, A. A., Mikhailov, V. S., Gogoleva, N. E., ... Lyupina, Y. V. (2021). Conservative and Atypical Ferritins of Sponges. International Journal of Molecular Sciences, 22(16), 8635. https://doi.org/10.3390/ijms22168635