Article

Analysis of PPARγ Signaling Activity in Psoriasis

by
Vladimir Sobolev
1,2,*,
Anastasia Nesterova
3,
Anna Soboleva
2,4,
Alexandre Mezentsev
1,2,
Evgenia Dvoriankova
2,
Anastas Piruzyan
2,
Elena Denisova
2,
Olga Melnichenko
5 and
Irina Korsunskaya
2
1
I. Mechnikov Research Institute for Vaccines and Sera RAMS, Russian Federation, Malyy Kazennyy Lane, 5, 105064 Moscow, Russia
2
Centre of Theoretical Problems of Physico-Chemical Pharmacology, Russian Academy of Sciences, Russian Federation, Srednyaya Kalitnikovskaya Street, 30, 109029 Moscow, Russia
3
Life Science Research and Development Department, Elsevier Inc., Rockville, MD 20850, USA
4
Scientific Research Institute of Human Morphology, 3 Tsurupa Street, 117418 Moscow, Russia
5
Moscow Scientific and Practical Center of Dermatovenereology and Cosmetology, Russian Federation, 17, Leninskiy Avenue, 119071 Moscow, Russia
*
Author to whom correspondence should be addressed.
Int. J. Mol. Sci. 2021, 22(16), 8603; https://doi.org/10.3390/ijms22168603
Submission received: 12 July 2021 / Revised: 31 July 2021 / Accepted: 3 August 2021 / Published: 10 August 2021
(This article belongs to the Special Issue PPARs as Key Mediators of Metabolic and Inflammatory Regulation)

Abstract

:
In our previous work, we built the model of PPARγ dependent pathways involved in the development of the psoriatic lesions. Peroxisome proliferator-activated receptor gamma (PPARγ) is a nuclear receptor and transcription factor which regulates the expression of many proinflammatory genes. We tested the hypothesis that low levels of PPARγ expression promote the development of psoriatic lesions triggering the IL17-related signaling cascade. Skin samples of normally looking and lesional skin donated by psoriasis patients and psoriatic CD3+ Tcells samples (n = 23) and samples of healthy CD3+ T cells donated by volunteers (n = 10) were analyzed by real-time PCR, ELISA and immunohistochemistry analysis. We found that the expression of PPARγ is downregulated in human psoriatic skin and laser treatment restores the expression. The expression of IL17, STAT3, FOXP3, and RORC in psoriatic skin before and after laser treatment were correlated with PPARγ expression according to the reconstructed model of PPARγ pathway in psoriasis.In conclusion, we report that PPARγ weakens the expression of genes that contribute in the development of psoriatic lesion. Our data show that transcriptional regulation of PPARγ expression by FOSL1 and by STAT3/FOSL1 feedback loop may be central in the psoriatic skin and T-cells.

1. Introduction

Peroxisome proliferator-activated receptors (PPARs) form a group of nucleus receptors that play an important role in the mammalian physiological system and function as a transcription factor [1]. There are three known PPAR isoforms, PPARα, PPARβ/δ, and PPARγ, which have significant sequence and structure homology, but exhibit different tissue distribution, selectivity, and sensitivity to ligands, which leads to the regulation of different gene sets by different receptors [2,3].
After binding to the ligand, PPARs form a heterodimer with the liver X receptor (LXR), then heterodimerize with the retinoid X receptor (RXR) and bind to the peroxisome proliferator response elements (PPRE) in the promoter regions of target genes [4,5].
PPARγ is the most studied PPAR subtype, which is expressed predominantly in the heart, adipose tissue, colon, kidneys, spleen, intestine, skeletal muscle, liver, macrophages, and skin. In the skin, PPARγ controls the genetic regulation of gene network expression involved in cell proliferation, differentiation, and inflammatory response [6].
There is an increased expression of PPARγ in skin adipocytes, where it plays a critical role in their differentiation [7,8]. PPARγ also has an important functional role in the regulation of skin barrier permeability as an inhibitor of keratinocyte cell proliferation and a promoter of terminal differentiation of the epidermis. In addition, being an important regulator of lipid metabolism, it stimulates the production of cholesterol and ceramides in keratinocytes [1,9].
As far as psoriasis is an inflammatory skin disease characterized by epidermal hyperproliferation and abnormal keratinocyte differentiation, proteins involved in PPARγ signaling can be considered as potential targets for treatment. Specific PPARγ ligands (such as BRL49653/rosiglitazone or pioglitazone) have been shown to inhibit the production of many inflammatory mediators and cytokines in various cell types, including monocytes, lymphocytes, and epithelial cells [10,11]. Studies in a mouse model of hyperproliferative skin disease have shown that local administration of PPARγ ligands thiazolidinediones family (ciglitazone and troglitazone) reduces epidermal hyperplasia [12].
Therefore, PPARγ can impede the progress of psoriasis, downregulating the expression of proinflammatory genes in a ligand-dependent manner, counteracting the activity of transcription factors.
Previously, we reconstructed several pathway models of molecular mechanisms of psoriasis. Models describe the transition to TH17 cell signaling during the differentiation of psoriatic T cells. In summary, genetic mutations in interleukin receptor (IL23R) may cause shift to the TH17 cells production which results in elevated levels of IL17 and IL22 expression, which, in turn, activates keratinocytes to release different cytokines and chemokines for attracting neutrophils and other inflammatory cells in the psoriatic lesion [13,14]. In the last work we build the model that describes a hypothesis that low activity of PPARγ signaling may promote psoriasis. We applied network analysis to build the model and we used public microarrays data to find statistically significant molecular cascades, cell processes, molecular regulators and expression targets of PPARγ [15] (see Supplementary Materials).
In this work, to test the hypothesis of low activity of PPARγ signaling in psoriasis, we measured gene expression of PPARγ and several key members of the reconstructed model in skin samples and in CD3+ T cells from patients with psoriasis. Additionally, we tested the expression of PPARγ signaling in human psoriatic skin before and after laser treatment.

2. Materials and Methods

2.1. Patients and Samples

We analyzed biopsies and peripheral blood samples from patients who were treated in the V G Korolenko Hospital, Moscow Scientific and Practical Centre of Dermatovenerology and Cosmetology. Total were analyzed from 23 patients with plaque-type psoriasis and 10 healthy controls. The age of patients varied from 25 to 56 years (Table 1). Patients were diagnosed with Psoriasis vulgaris. The diagnoses were confirmed by the pathomorphological examination of skin biopsies.
Local anesthesia and dermatological punch (4 mm) were used for the collection of skin samples. Healthy skin samples were taken at a distance of 3 cm from a psoriatic lesion. The research was approved by the Local Ethical Committee at the Center for Theoretical Problems of Physical-Chemical Pharmacology, Russian Academy of Science, and complies with the principles of the Helsinki Declaration. The laser treatment was provided 2–3 times a week. Skin samples were collected before the treatment and one day after the 7th laser seance.

2.2. Cells Isolation

For peripheral blood mononuclear cells (PBMC) isolation from the whole blood density gradient centrifugation was performed. Ficoll isolation method promoted cell extraction. 7 mL of Ficoll solution (density 1.077 g/cm3, “DIA-M”) was placed into a 15 mL Eppendorf conical tube and then carefully overlaid with 7 mL of the whole blood. After that the tube was centrifuged for 25 min at 1200× g at 4 °C. The interphase containing the cellular layer was collected from the tube and placed into a new 15-mL tube for further washing procedure. 15 mL of DPBS buffer (10× without Ca and Mg, with 0.5%Tween 20, pH 7.4) were added to the cell pellet and then centrifuged for 15 min at 400× g at 20 °C. The supernatant was carefully removed and the wash was repeated once with the only difference of the DPBS buffer volume (10 mL). After the last centrifugation and 500 μL of culture media (RPMI) addition, cell count and viability assessment were performed.
Isolation of total CD3+ T cells were obtained from PBMCs of patients and controls using a total CD3+ T cell isolation kit (Miltenyl Biotec, Bergisch Gladbach, Germany).
For better presentation we summarized all methods in one scheme (Figure 1).

2.3. PCR

Qiagen spin column and standard RNeasy Mini Kit® for the skin were used for the RNA isolation. Additional treatment of samples with the DNAase (Qiagen®, Germantown, MD, USA) was used to remove DNA traces. RNA concentration was measured with NanoDrop 1000 (Thermo Scientific®, Waltham, MA, USA).
Reverse transcription was done in 200 μL volume; the mixture included the buffer, dNTP, 100 units of reverse transcriptase (M_MLV, Promega®, Madison, WI, USA), 20 units of RNAses inhibitor (RNasin, Promega®, Madison, WI, USA), 500 ng of oligo(dT) primers (DNA-Synthes®, Moscow, Russia), and RNA sample (no more than 100 ng/μL). The mixture was incubated at 37 °C for 1 h.
Real-time PCR was performed in 96-well optical plates using fluorescent dyes SYBR Green (Eurogen®) and custom primers (DNA-Synthesis®). Primer sequences: PPAR-γ F: 5′-TCTGGCCCACCAACTTTGGG-3′ R: 5′-CTTCACAAGCATGAACTCCA-3′; STAT3 F: 5′-ACCAGCAGTATAGCCGCTTC-3′ R: 5′-GCCACAATCCGGGCAATCT-3′; IL17A F: 5′- ACAACCGATCCACCTCACCTT-3′ R: 5′- CTTTGCCTCCCAGATCACAGA-3′; RORC F: 5′- GTAGAACAGCTGCAGTACAATC-3′ R: 5′-CTTCCAGGTCACTTGGAC-3′; FOXP3 F: 5’-TCCCAGAGTTCCTCCACAAC-3′ R: 5′-ATTGAGTGTCCGCTGCTTCT-3′. PCR amplifier (Bio-Rad, CFX96™) was used for the amplification with the following program: (1) denaturation at 95 °C for 4 min, (2) denaturation at 94 °C for 15 s, (3–4) annealing and elongation at 60 °C for 30 s, (5) steps 2–4 were repeated 40 times. Levels of the GAPDH gene were used as a control for the expression of targeted genes. Amplification of the GAPDH gene and the studied genes was performed in different test tubes.
To calculate the results, we used numbers from real-time PCR reactions with primer efficiency at least 95%, 0.99 correlation coefficient and the curve (slope) −3.4 ± 0.2. PCR results were analyzed using the 2−ΔΔCT method to compare the levels of expressions detected in affected and unaffected samples [16]. Each ΔCt was calculated as ΔCt = Ct (tested gene)−Ct (GAPDH). ΔΔCt was calculated as ΔΔCt = ΔCt (psoriatic skin sample)—ΔCt (health skin sample). The experiments were repeated three times for each sample. Intergroup differences were calculated using the Mann-Whitney U-test.

2.4. ELISA

Human PPAR-γ (Peroxisome Proliferator Activated Receptor Gamma) (MBS2503174), Signal Transducer and Activator of Transcription 3 (STAT3) (MBS2024094) and Interleukin 17 (IL17) (MBS2019491) ELISA Kits (MyBioSource, Inc., San Diego, CA, USA) was applied to detect the PPARγ levels in lesional and healthy skin according to the manufacturer’s protocol. Briefly, standards and tested samples prepared in assay buffer were loaded on 96-well plate and incubated with immobilized specific antibody for 1 h at 37 °C. After washing with provided solution, the specific antibody conjugated with HRP-streptavidin was added and incubation continued for another 30 min. Then, the presence of antigen was visualized with chromogenic substrate (TMB) and assayed using a microplate reader (RT-2100C, Rayto) at wavelength 450 nm. The antigen was quantified with a standard curve generated with standards of known concentration. The standard curve was constructed by plotting the mean absorbance obtained from each standard against its concentration. The calculation was done using a professional software “Curve Expert 1.4”.

2.5. Immunohistochemistry Analysis

Preparation of a paraffin block. To prepare skin micro-sections, a tissue samples up to 5 mm in size was fixed on a substrate to prevent wrinkling. The tissue was fixed in 10% neutral buffered formalin for 24 h at room temperature. Then formalin was washed out of the sample in running water for 6–7 h. Then the tissue was dehydrated in ethyl alcohols of ascending density: 80%-24 h, 96%-24 h, 100%-4 h. To prepare the paraffin block, the sample was kept in a 50/50 ethanol/toluene solution for 40 min at room temperature. Then the skin was kept in 100% toluene for 1 h. The tissue was also kept for 1 day in a 50/50 paraffin/toluene solution at 56 °C for successful penetration of paraffin into the sample. After that, the sample was placed in melted paraffin and kept for 2 days. A paraffin block with the skin sample enclosed in it was prepared with the use of a mold.
Staining of paraffin sections. Paraffin microsections of the human skin samples were obtained with the use of MC-2 sledge microtome. Microsections were placed on positively charged superfrost plus slides. The antigens were visualized by the NOVOLINK imaging system based on the unique compact polymer RE7290-K, designed to visualize mouse immunoglobulins M, G and rabbit immunoglobulins G of primary antibodies. For immunohistochemical staining the sections were dewaxed: toluene for 3 min, 96% ethanol for 3 min, 80% ethanol for 3 min, H2O for 5 min. Triton X-100 was used to perform antigen unmasking procedure.

2.6. Data Analysis

Literature biomedical network Resnet-2020 and software Pathway Studio were used for enrichment analysis, network analysis and pathway models reconstruction (www.pathwaystudio.com). Resnet—2020 includes interactions between proteins, drugs, diseases, mutations, cells and other biomedical entities and is based on results of text-mining of 3.5 Mln full texts papers and 24 Mln abstracts.

3. Results

3.1. PPARγ Expression Is Slightly Downregulated in Psoriatic Skin and CD3+ T Cells

For each of 23 patients, we compared the expression levels of PPARγ in the psoriatic skin samples and unlesional skin collected at the distance of 3 cm from the nearest psoriatic plaque. This was necessary to minimize the influence of disease-irrelevant factors on the molecular profile of selected genes [17].
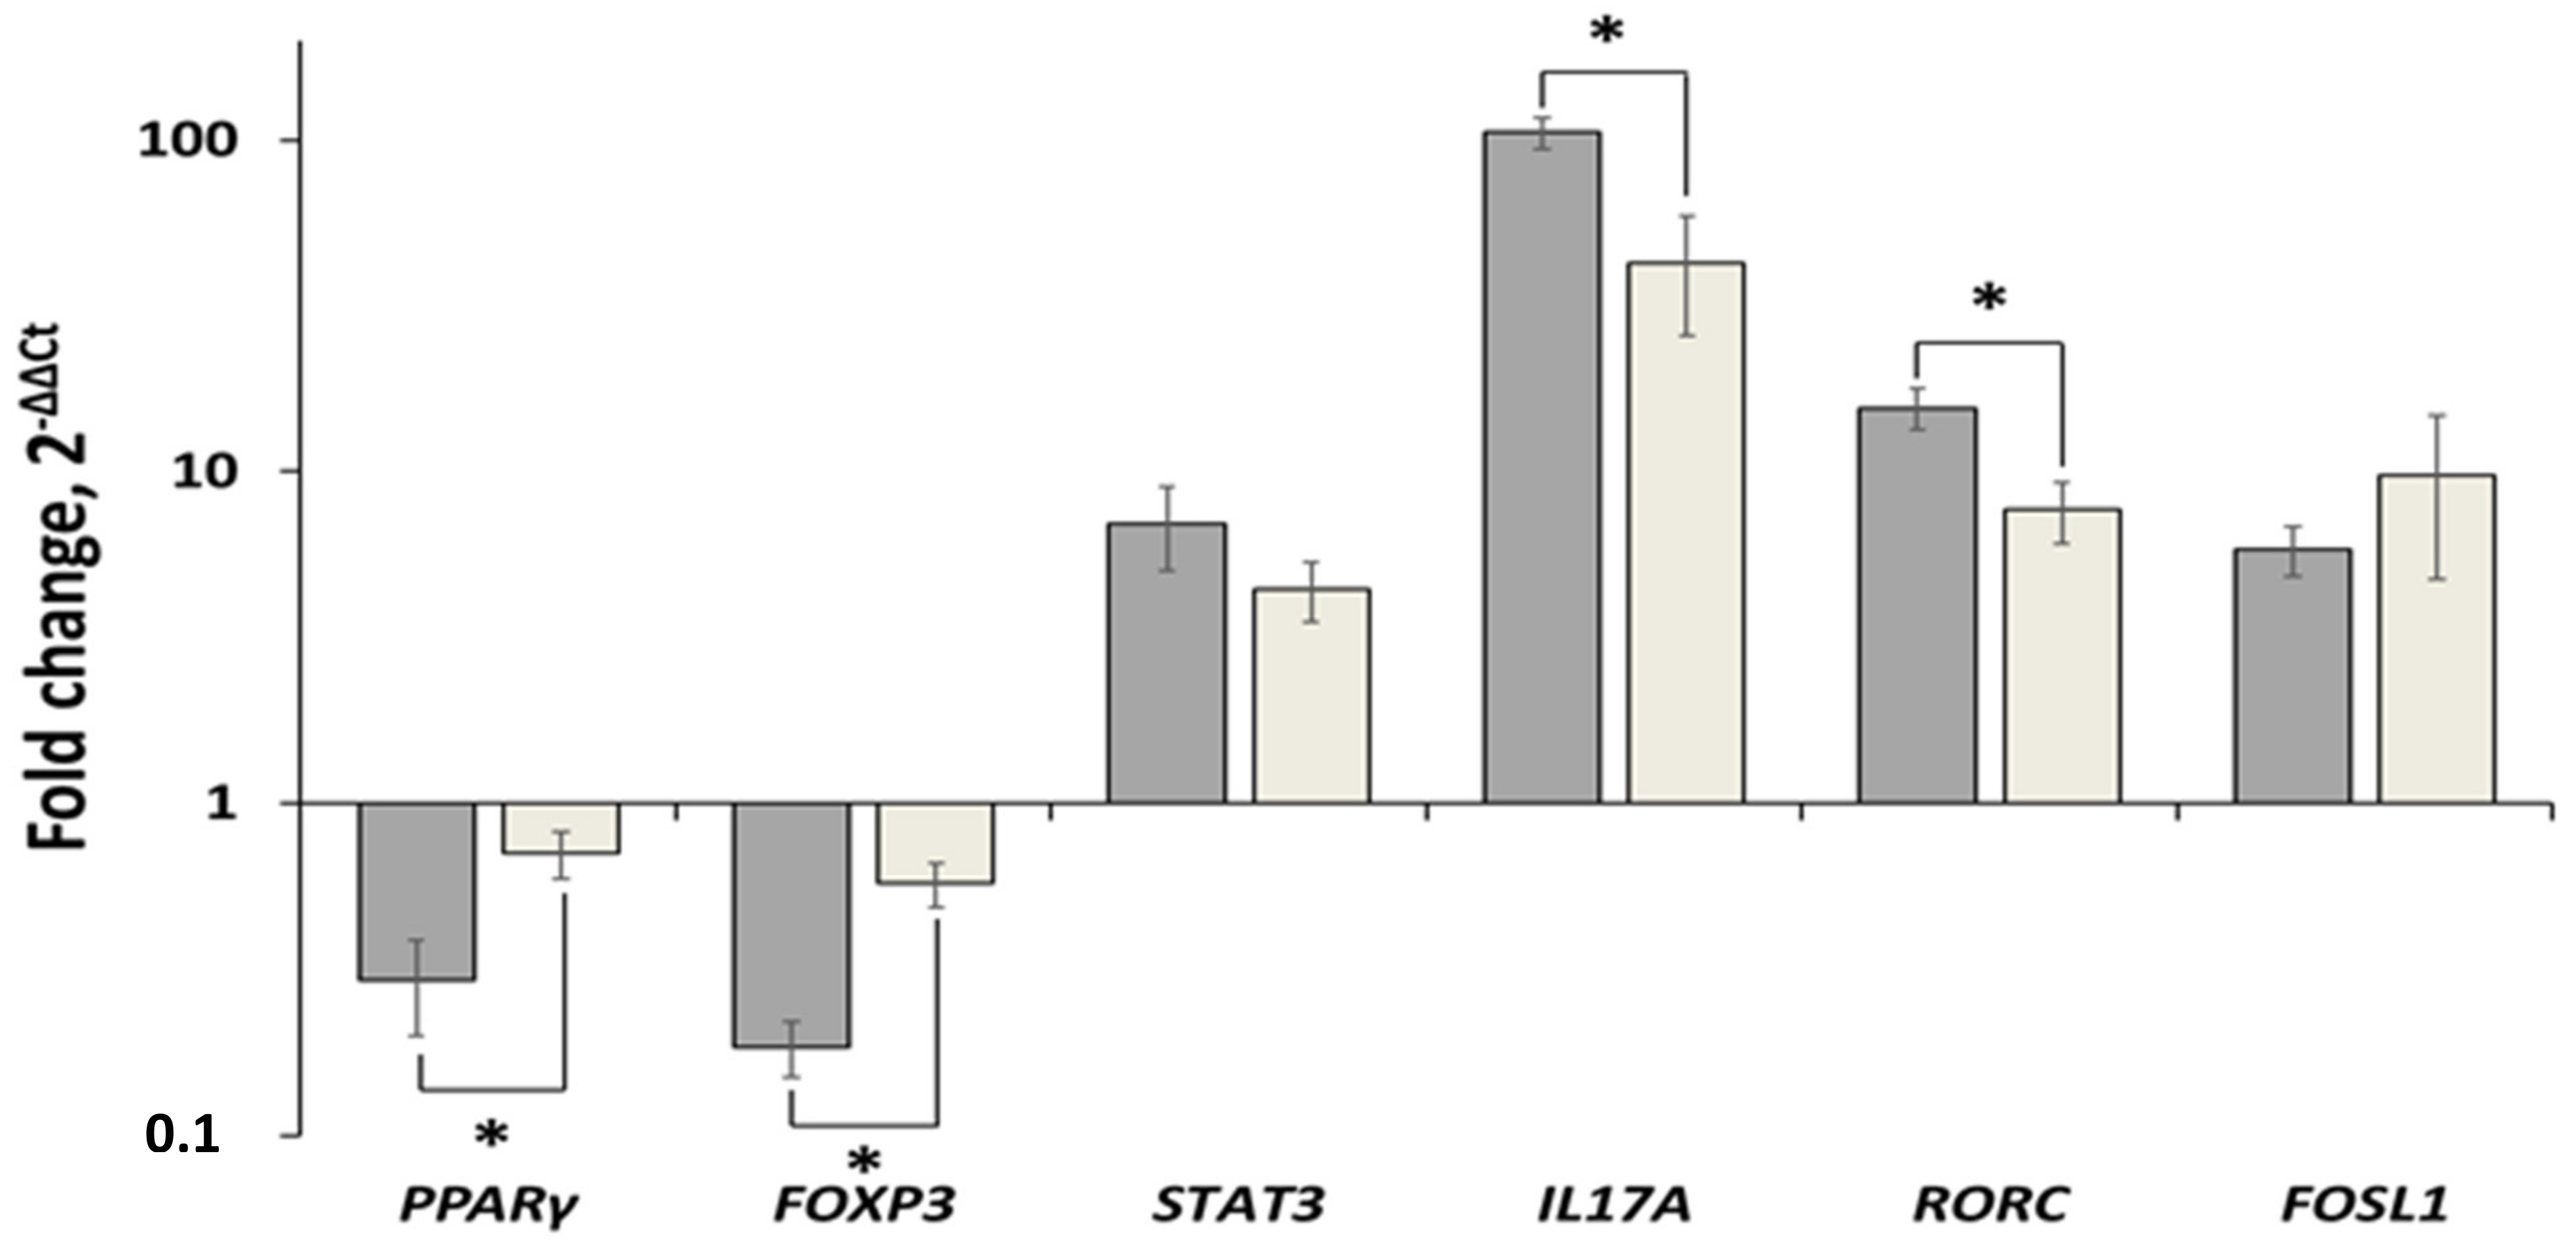
The results of real-time PCR showed that PPARγ was downregulated in lesional skin compared to uninvolved skin. The expression level of PPARγ in lesional skin was slightly reduced in 1.41 ± 0.27 times (Figure 2). We also found a significant increase in the expression levels of the following genes—IL17 (42.39 ± 16.68), STAT3 (4.42 ± 0.90), RORC (7.68 ± 1.62, and FOSL1 (9.72 ± 4.98). In contrast, the expression level of FOXP3 was decreased in 1.72 ± 0.14 times.
In the CD3+ T-cells of psoriasis patients, the expression level of PPARγ was reduced in 3.4 ± 0.4 times and FOXP3—in 5.4 ± 0.16 times compared to healthy volunteers (Figure 2). Moreover, the following genes were upregulated in CD3+ T cells of psoriasis patients—IL17 (105.2 ± 11.01), STAT3 (6.98 ± 1.96), RORC gene in 15.52 ± 2.18, and FOSL1 (5.79 ± 0.99).
Since we proposed that the pathogenicity of downregulated PPARγ-downstream signalling is different in various types of cells, where this pathway was active, we compared the expression levels of PPARγ and the related genes in the CD3+ T cells obtained from the blood of psoriasis patients and lesional skin with similar parameters in CD3+ T cells of healthy volunteers and uninvolved skin, respectively. We found that the expression levels of PPARγ and FOXP3 were decreased in psoriatic CD3+ T cells compared to lesional skin of the same individuals. The observed changes were statistically significant (p = 0.016 and >0.001, respectively). In contrast, the expression levels of four other genes were increased. The changes in the expression levels of IL17A and RORC were statistically significant (p = 0.004 and 0.033, respectively). In the same time, the changes in the expression levels of STAT3 and FOSL1 were not significantly different (p = 0.410 and 0.278, respectively).
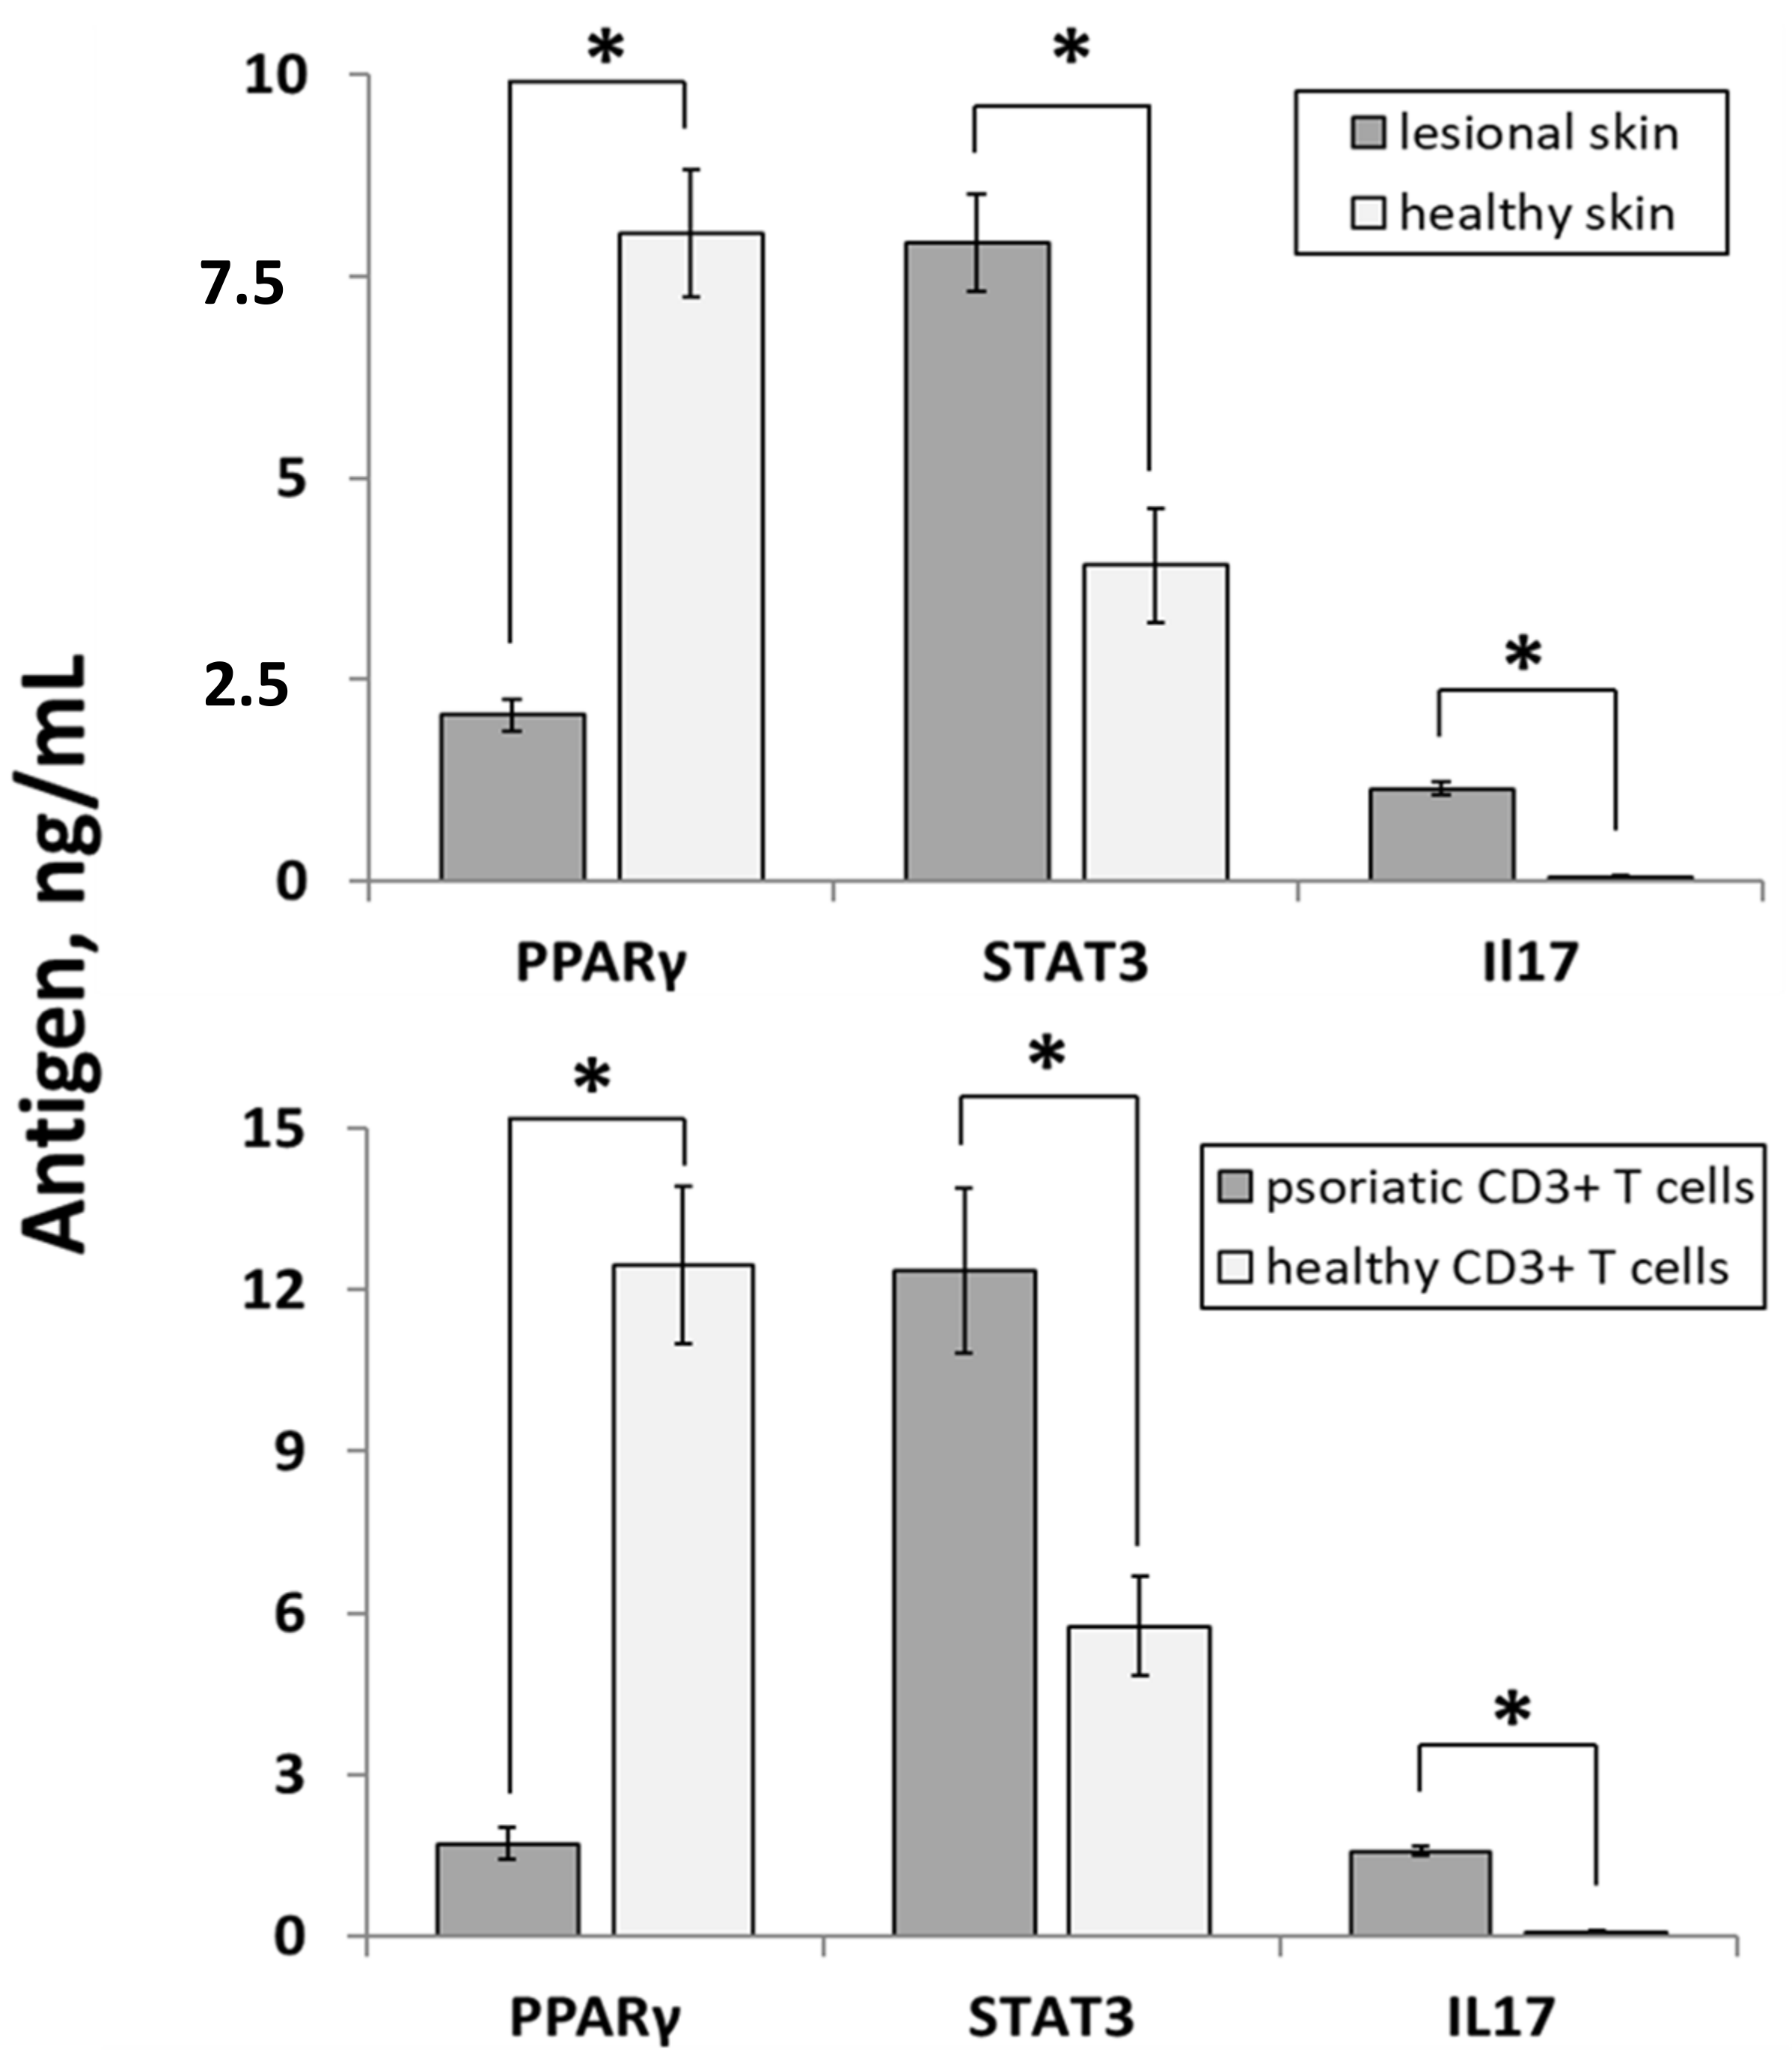
Using an independent method of analysis, we confirmed the differential expression of PPARγ, STAT3 and IL17 on protein level. The results of ELISA experiments performed on the same group of skin samples (Figure 3, upper panel) discovered significantly higher expression levels of STAT3 and IL17 in lesional skin. The expression levels of STAT3 were 7.91 ± 0.61 and 3.92 ± 0.70 ng/mL (p < 0.001) whereas the expression levels of IL17 were 1.15 ± 0.06 and 0.09 ± 0.01 ng/mL (p < 0.001), respectively. In contrast, the expression of PPARγ was reduced in lesional skin, compared to healthy skin 2.06 ± 0.20 and 8.02 ± 0.79 ng/mL, p < 0.001).
Expectedly, a similar expression pattern was discovered in CD3+ T-cells (Figure 3, lower panel). The expression levels of STAT3 were 12.35 ± 1.53 and 5.75 ± 0.95 ng/mL (p < 0.001) whereas the expression levels of IL17 were 1.57 ± 0.09 and 0.07 ± 0.02 ng/mL (p < 0.001) in psoriatic and healthy CD3+ T-cells, respectively. In the same time, the expression of PPARγ was reduced in psoriatic CD3+ T-cells, compared to same cells of healthy individuals (1.71 ± 0.29 and 12.46 ± 1.47 ng/mL, p < 0.001).
To reveal the differences in gene and protein expression between genders we compared the data obtained from male and female patients (Table 2), female patients with and without menopause (Table 3) as well as male and female healthy volunteers (Table 4). The following analysis did not reveal significant gender-specific changes with two exceptions. Firstly, female patients that did not experience menopause had a significantly higher expression of FOSL1 in CD3+ T-cells (Table 3). Secondarily, healthy female volunteers seemed to have a higher expression of IL17A compared to their male counterparts (Table 4).
However, we had several reasons to doubt the significance of these findings. Primarily, the differences reported in Table 3 and Table 4 were not confirmed independently. In the first case, the significance of qPCR data was not confirmed by ELISA (Table 3). In the second case, the significance of the findings discovered by ELISA was not confirmed by qPCR (Table 4). Moreover, there we noticed a high data variability within the groups. As we believed, the patients’ comorbidities and unreported health issues of volunteers might influence the gene and protein expression. We also have to acknowledge that levels of female sex hormones significantly vary on different stages of the menstrual cycle whereas we drew the blood a day prior discharging the patients and disregarded this matter when we tested healthy volunteers. In addition, the significance of the changes in the expression of IL17A could be questioned because of a relatively small sample size (Table 4). Thus, we suggest that there is no association between gene and protein expression and the participants’ gender. As we believe, the obtained results do not support the hypothesis that gender could be a risk determinant of psoriasis.
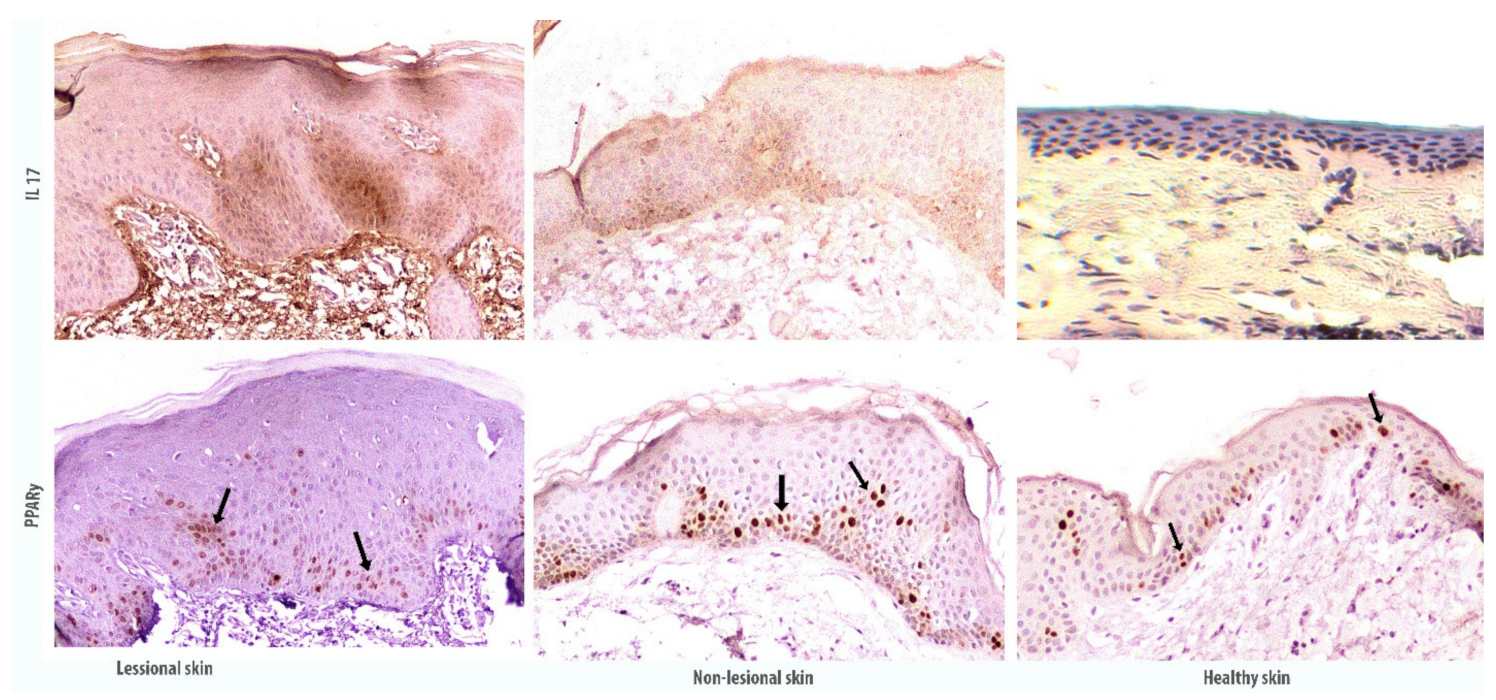
Immunohistochemical skin section profile show that the accumulation of IL17 is increased in the skin with the development of psoriatic plaque, as compared with the visually unaffected and healthy skin. Also, immunostaining of antibodies against IL17 showed the staining of the keratinocyte cytoplasm mostly in the suprabasal epidermal layer. In the hyperplastic epidermis, the accumulation of IL17 is more intense and heterogeneous. At the same time, IL17 accumulates to a lesser extent in the visually unaffected skin and is only slightly detected in the healthy skin.
In the sections presented, a more intense PPARy immunostaining is observed in differentiated suprabasal keratinocytes of the unaffected skin, and less in the tissues of the psoriatic plaque, despite keratinocyte proliferation and hyperplasia development (Figure 4).

3.2. Low Laser Treatment Stabilises PPARγ Related Signaling in Psoriatic Skin

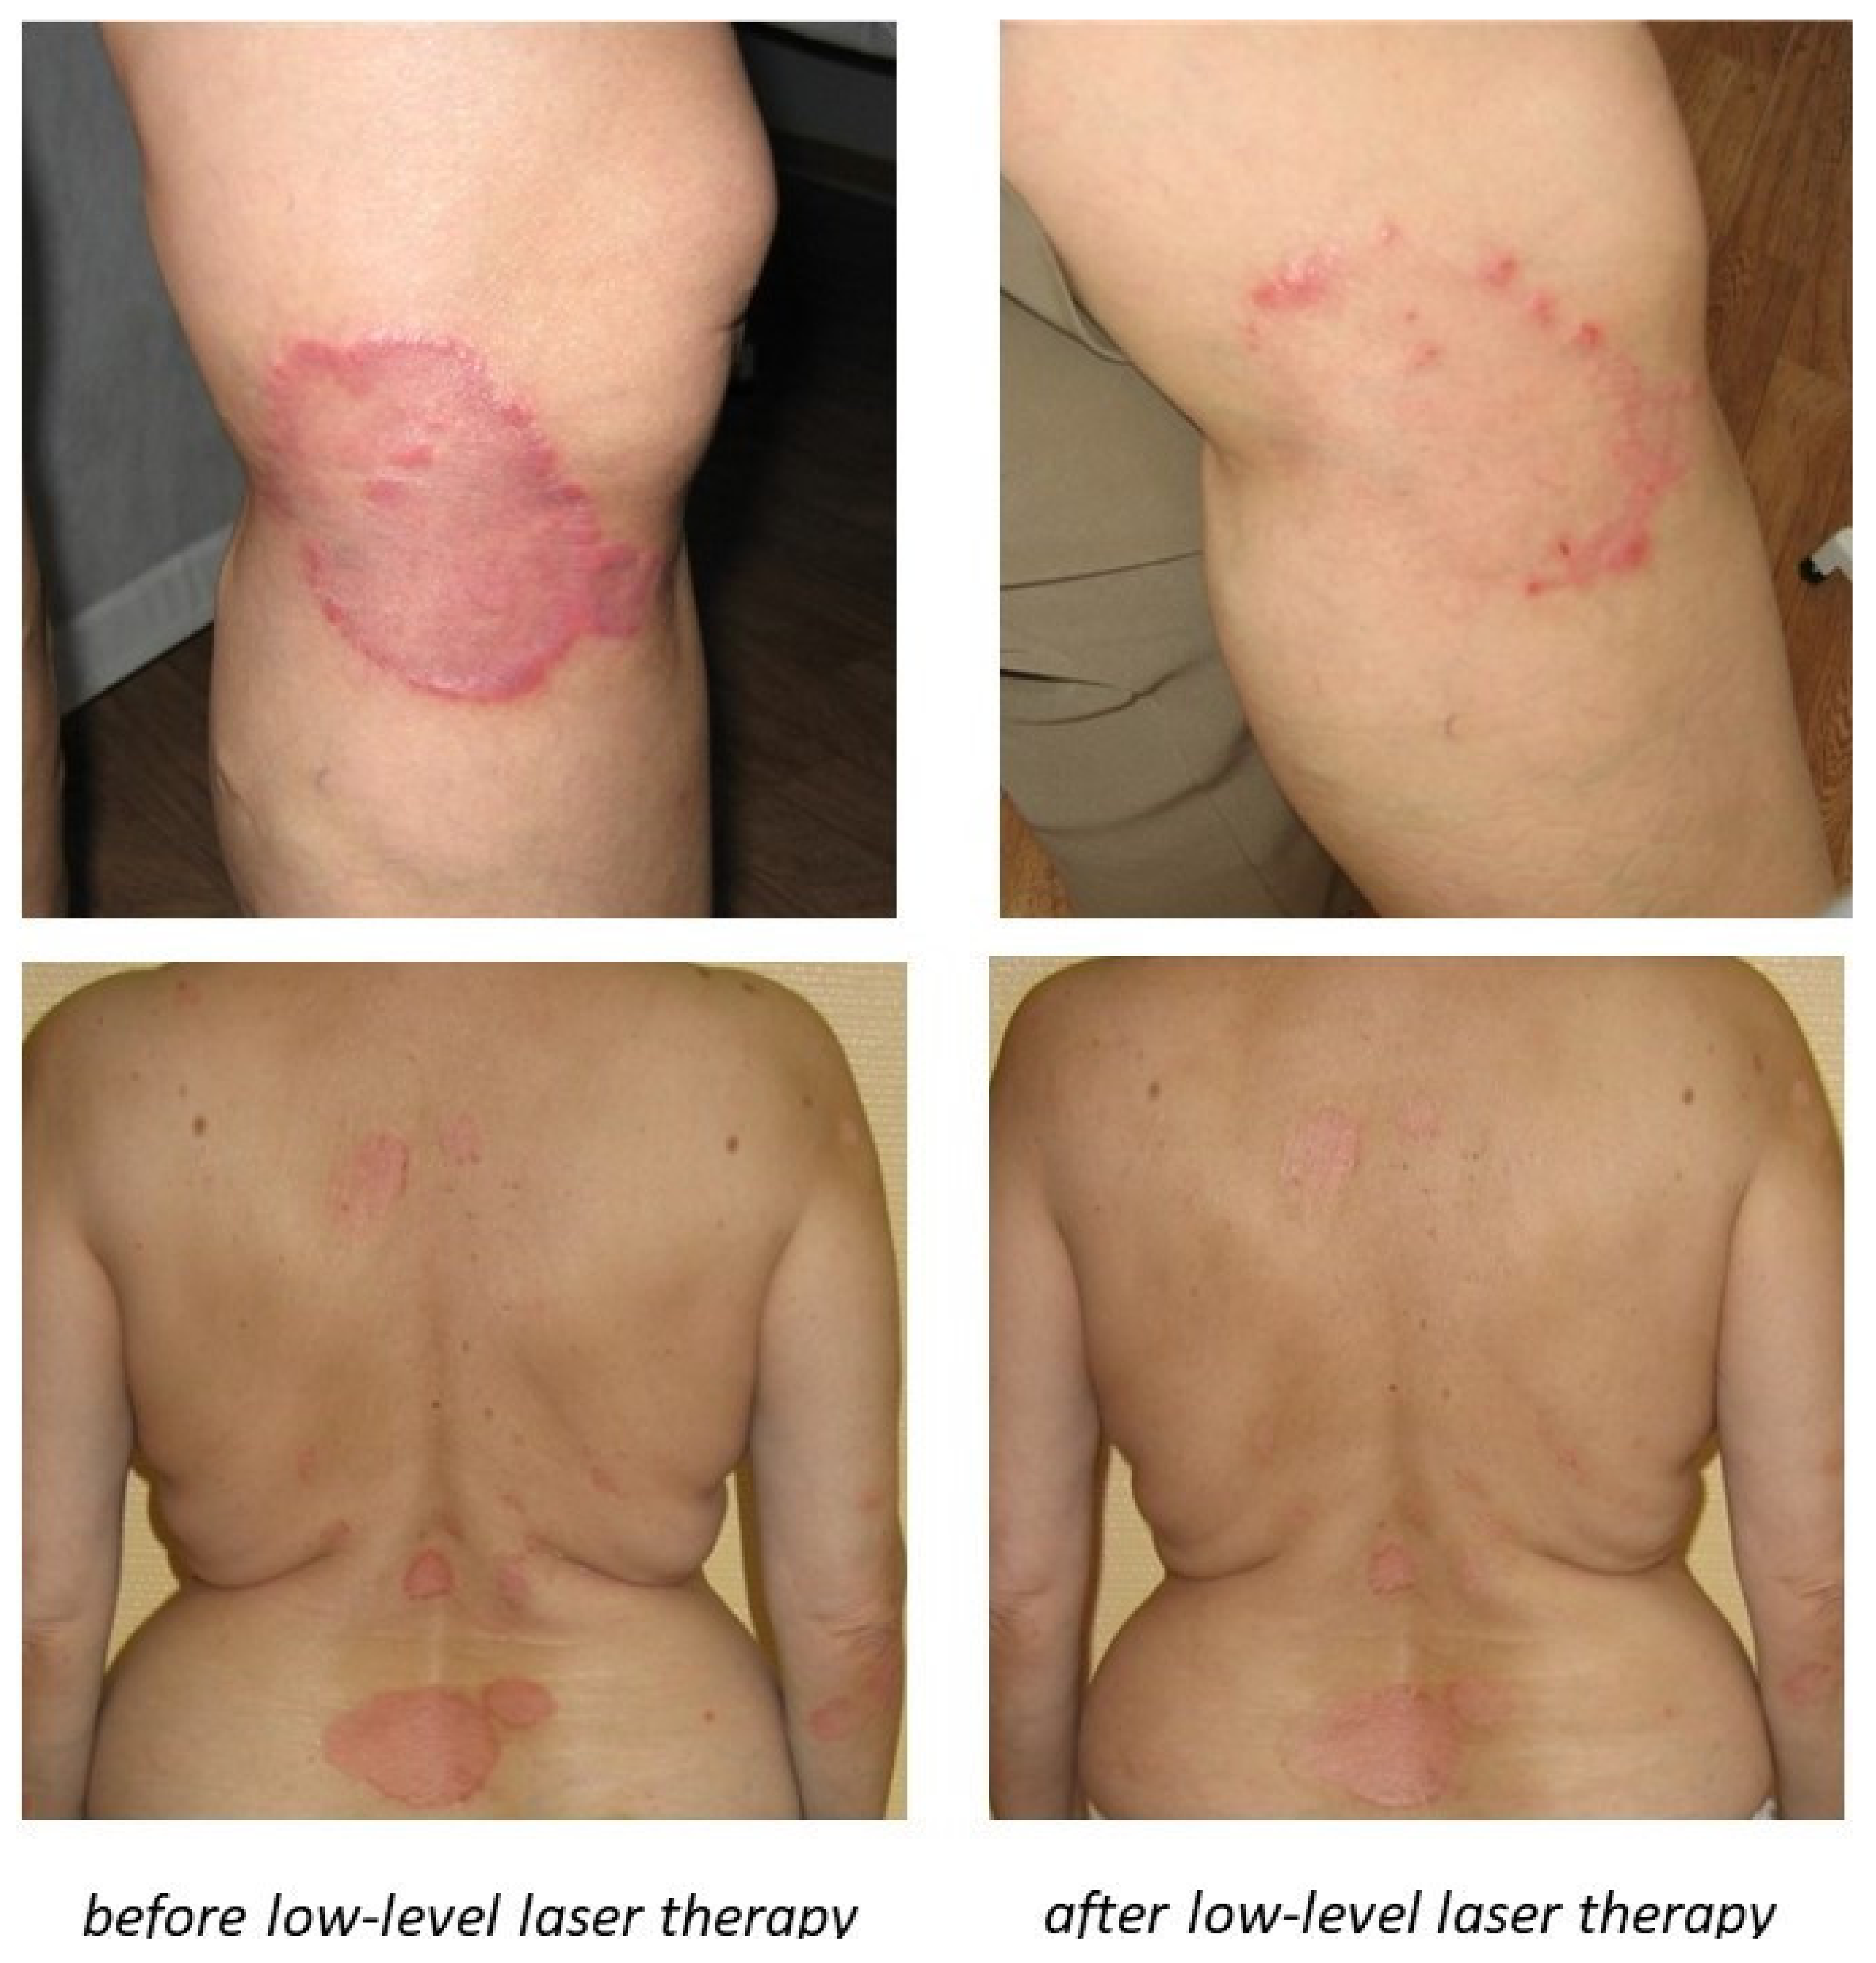
For the next step of validation, we studied the expression of PPARγ, STAT3, IL17A, RORC, FOXP3, and FOSL1 in human psoriatic skin samples and visually healthy skin samples before and after laser treatment. Patients received low-intensity laser treatment with 1.27 microns wavelength (infrared short waves). Similar to previously published results by different groups of medical researchers, the low-laser treatment had a positive effect on the health of observed patients and reduction of psoriatic skin inflammation was achieved (Figure 5).
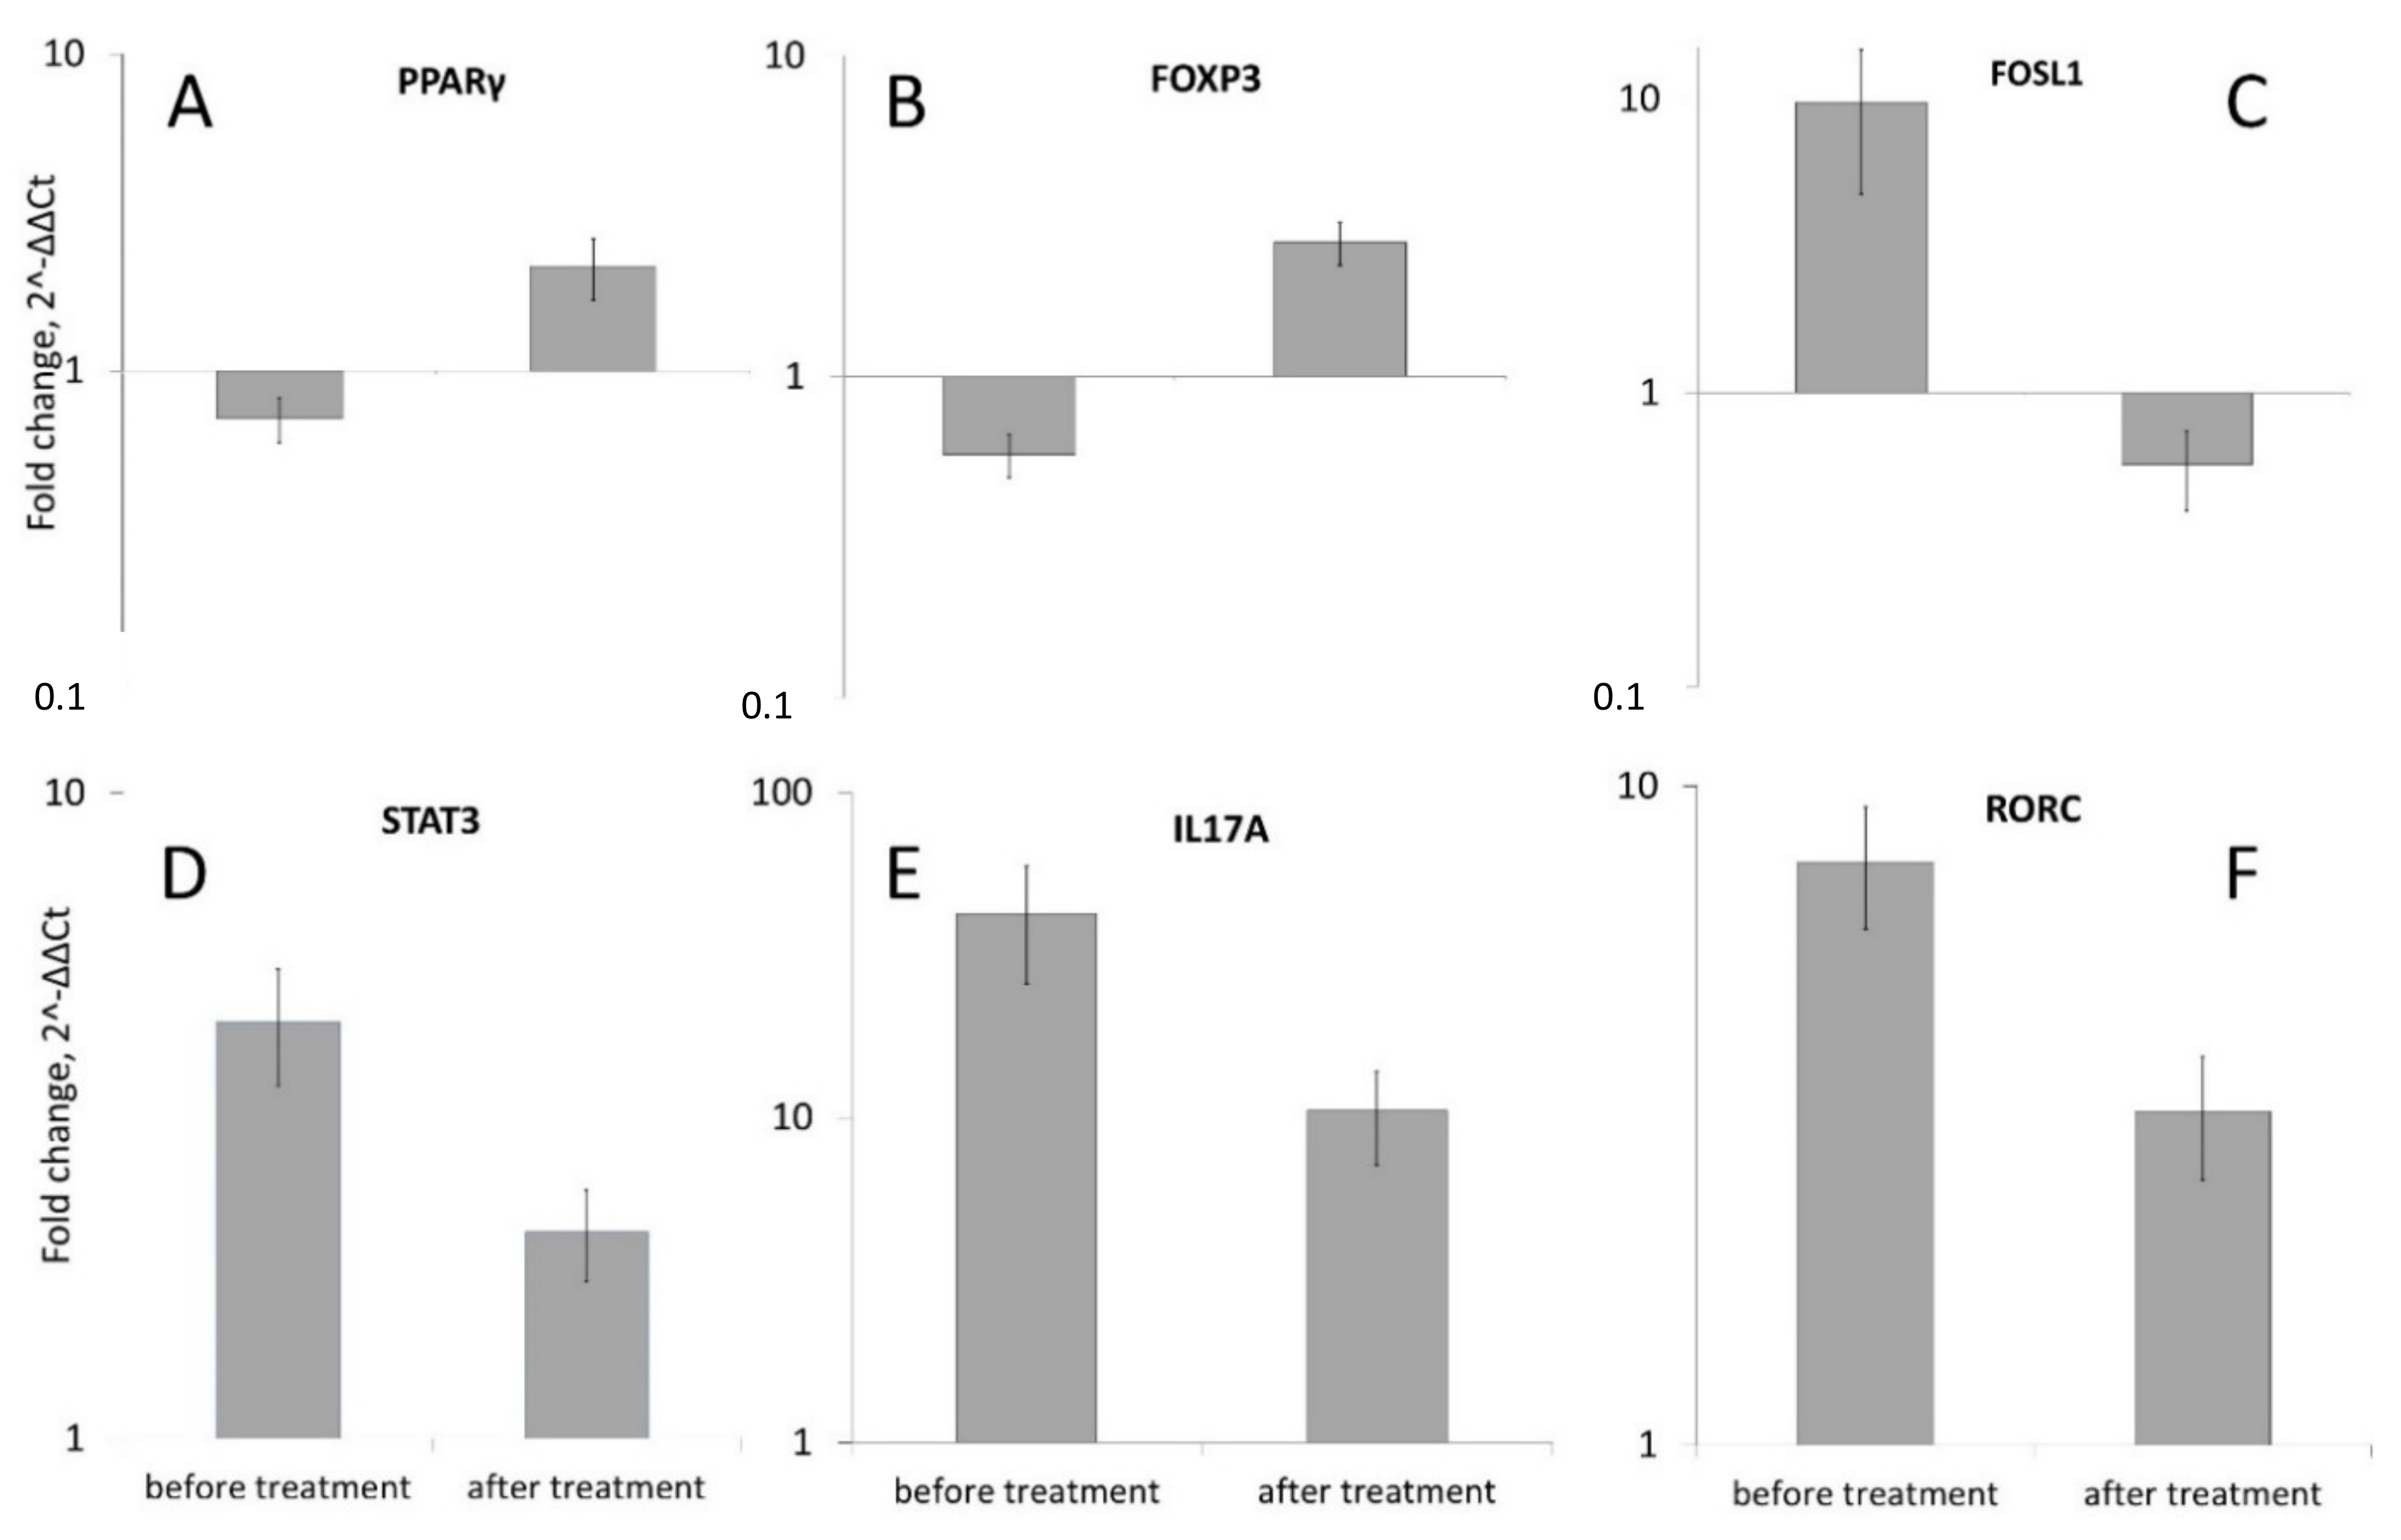
We detected a reliable reduction in the expression of studied PPARγ, STAT3, IL17A, RORC, FOXP3 and FOSL1 genes after low level (1.27 microns) laser treatment. The level of STAT3 expression was decreased in 2.08 ± 0.33 times (Figure 6D), IL17A in 10.48 ± 3.36 times (Figure 6E), RORC in 3.20 ± 0.68 times (Figure 6F) and FOSL1 in 0.57 ± 0.17 (Figure 6C). The level of the expression of PPARγ was increased 2.13 ± 0.47 times (Figure 6A). The level of FOXP3 was also increased in 2.62 ± 0.39 times (Figure 6B).
Therefore, low laser treatment caused significant growth of the PPARγ and FOXP3 expression while reducing the expression of STAT3, IL17A, and RORC.

4. Discussion

Previously, we built the model of PPARγ dependent pathways involved in the development of the psoriatic lesions. The model includes significant molecular cascades such as IL17 signaling, Toll like receptor and PI3K-AKT pathways from literature network analysis and public microarrays data. In this work we tested the model by measurement mRNA and protein levels of key molecular players in human psoriatic skin and T-cells.
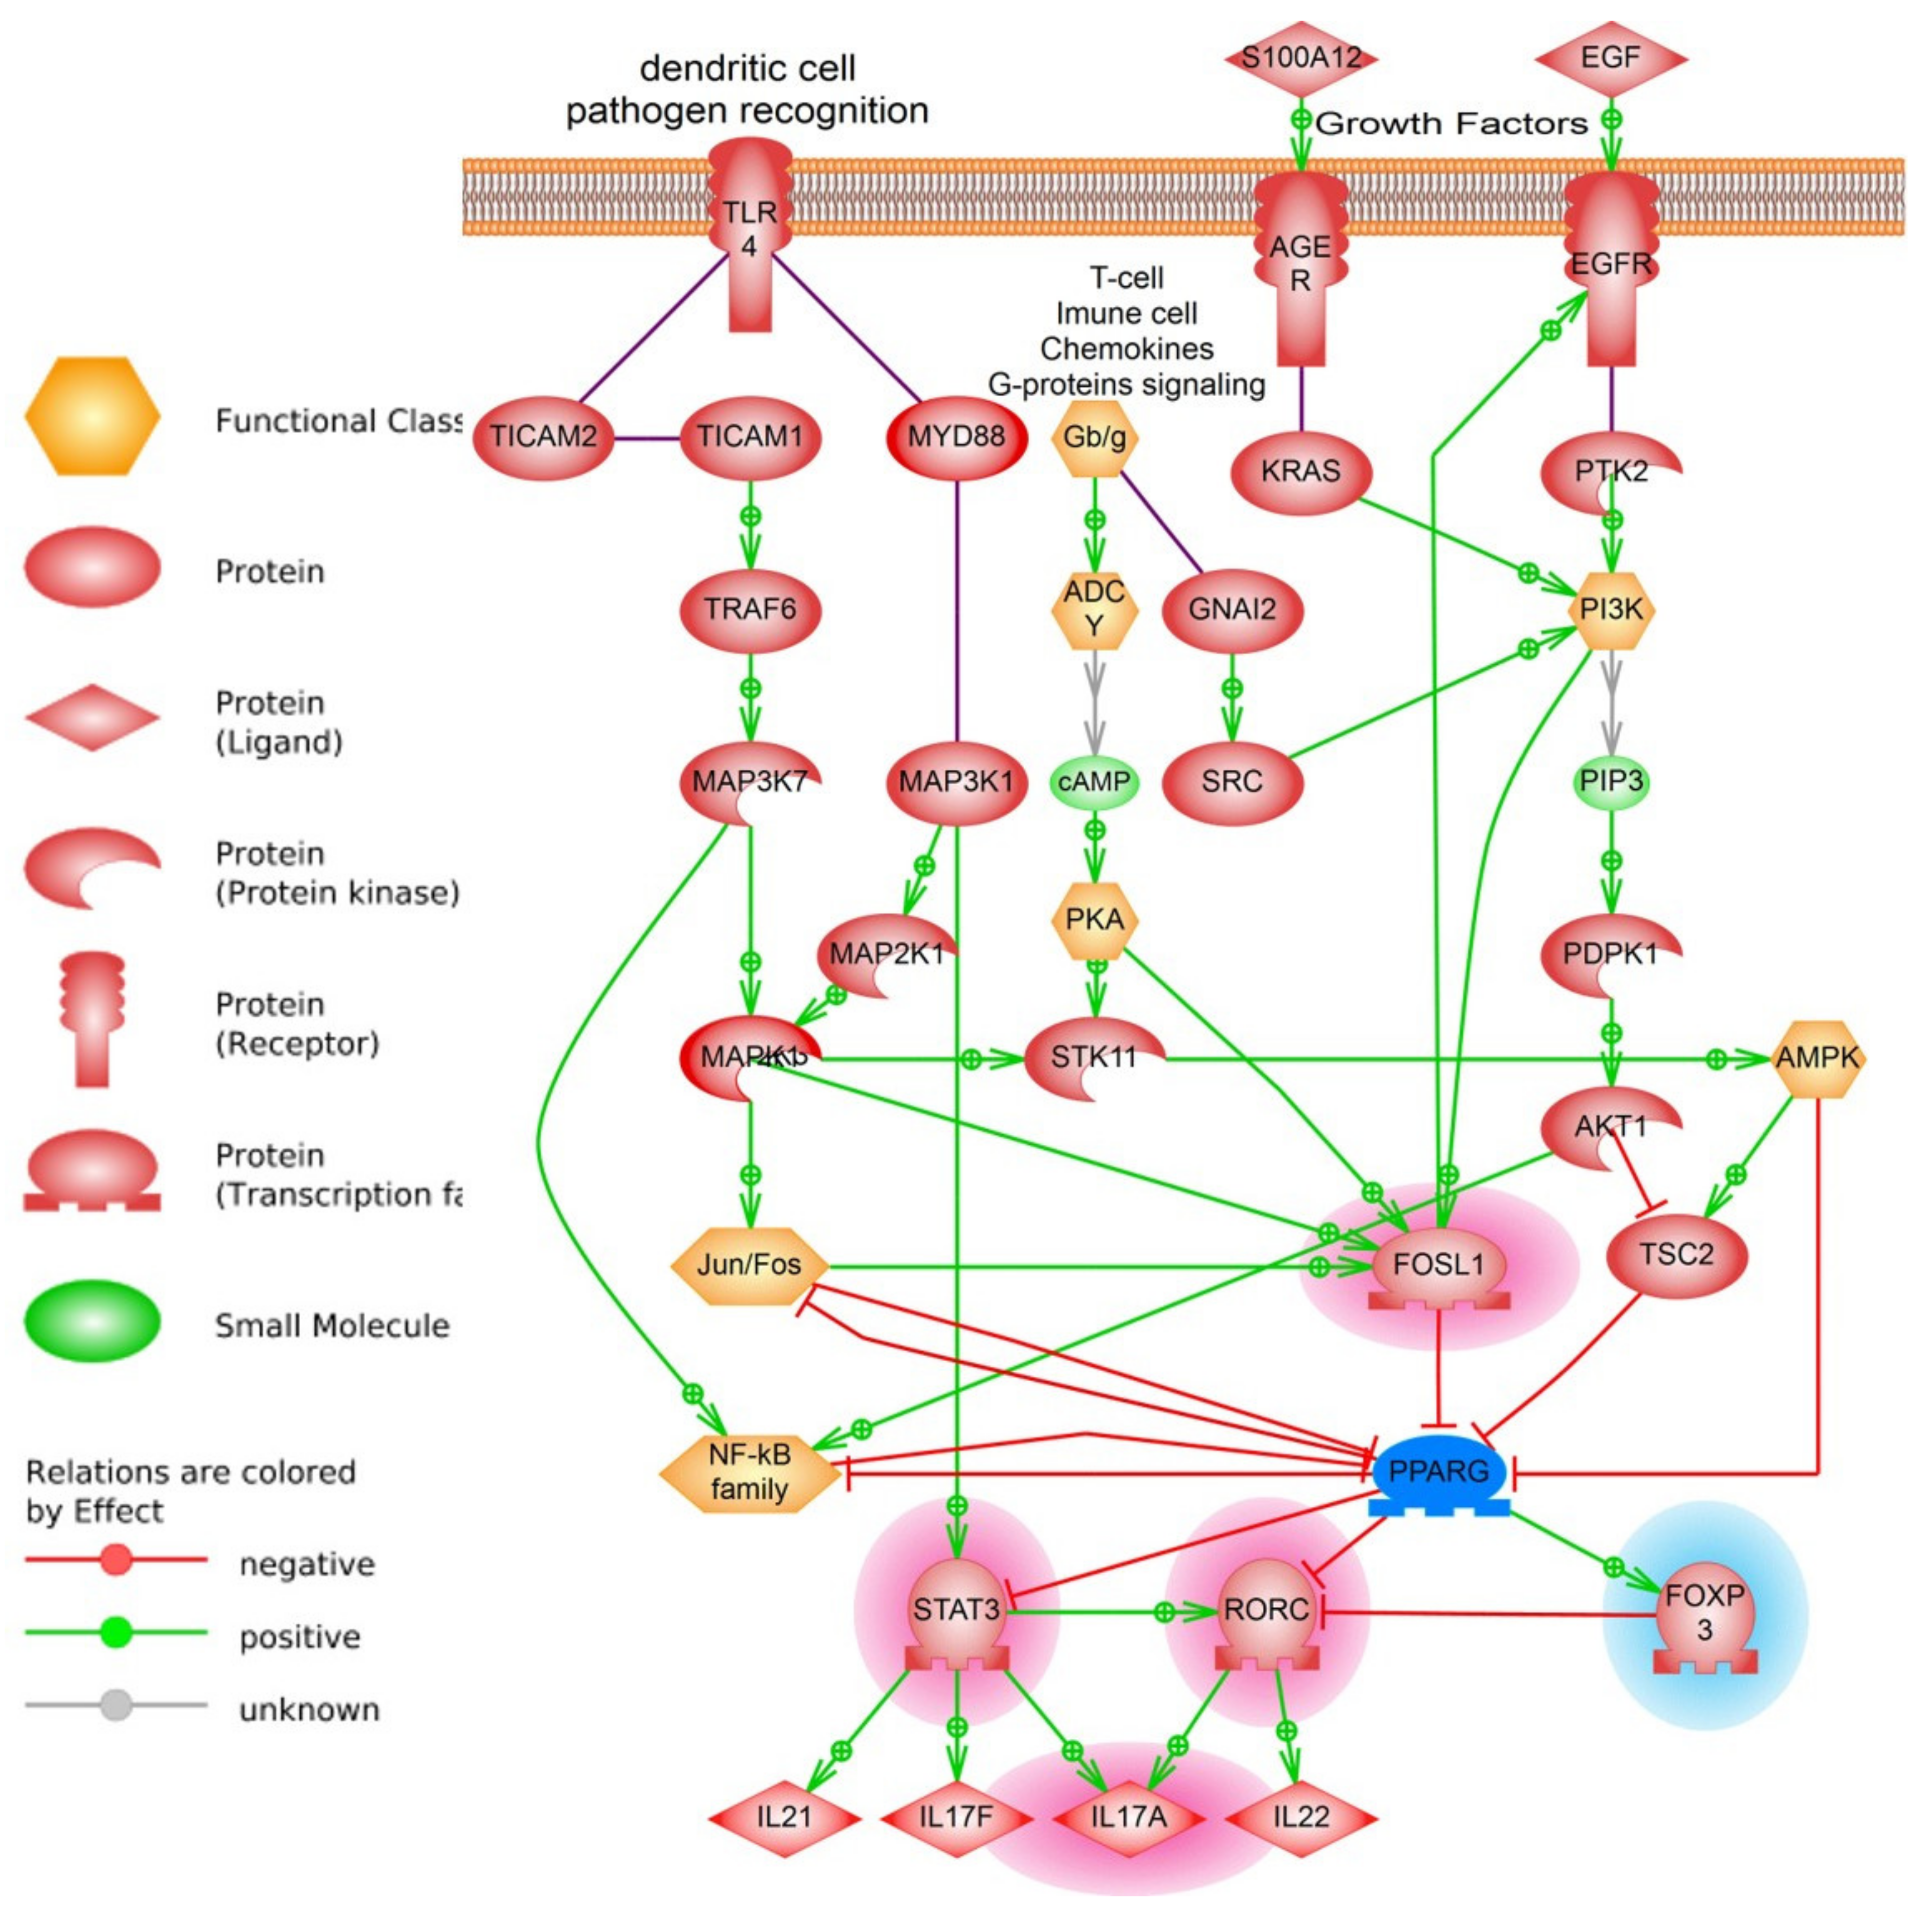
Several key players according to previously reconstructed models of the PPARγ signaling were selected for experimental validation of the hypothesis that low levels of PPARγ may contribute to the development of psoriatic lesions. There were IL17A gene (interleukin 17A), STAT3 gene (signal transducer and activator of transcription 3), RORC gene (retinoid-related orphan receptor-gamma), FOXP3 gene (forkhead box P3) and FOSL1 (FOS-like antigen 1) gene (Figure 7).
We detected the repression of PPARγ activity in human psoriatic skin and blood immune cells (CD3+ T cells) from 23 patients with real-time PCR method, ELISA and immunohistochemistry analysis. Our results are similar to data from microarray on 58 patients where average PPARγ gene expression also was slightly downregulated in psoriatic lesions [18]. Recently, low PPARγ expression in CD4+ T cells from 12 psoriasis patients than in healthy controls was reported [19]. Other authors however described the higher level of the PPARγ expression in human psoriatic skin compared to healthy skin. But the level of PPARγ mRNA was close to the detection limit in their research [20].
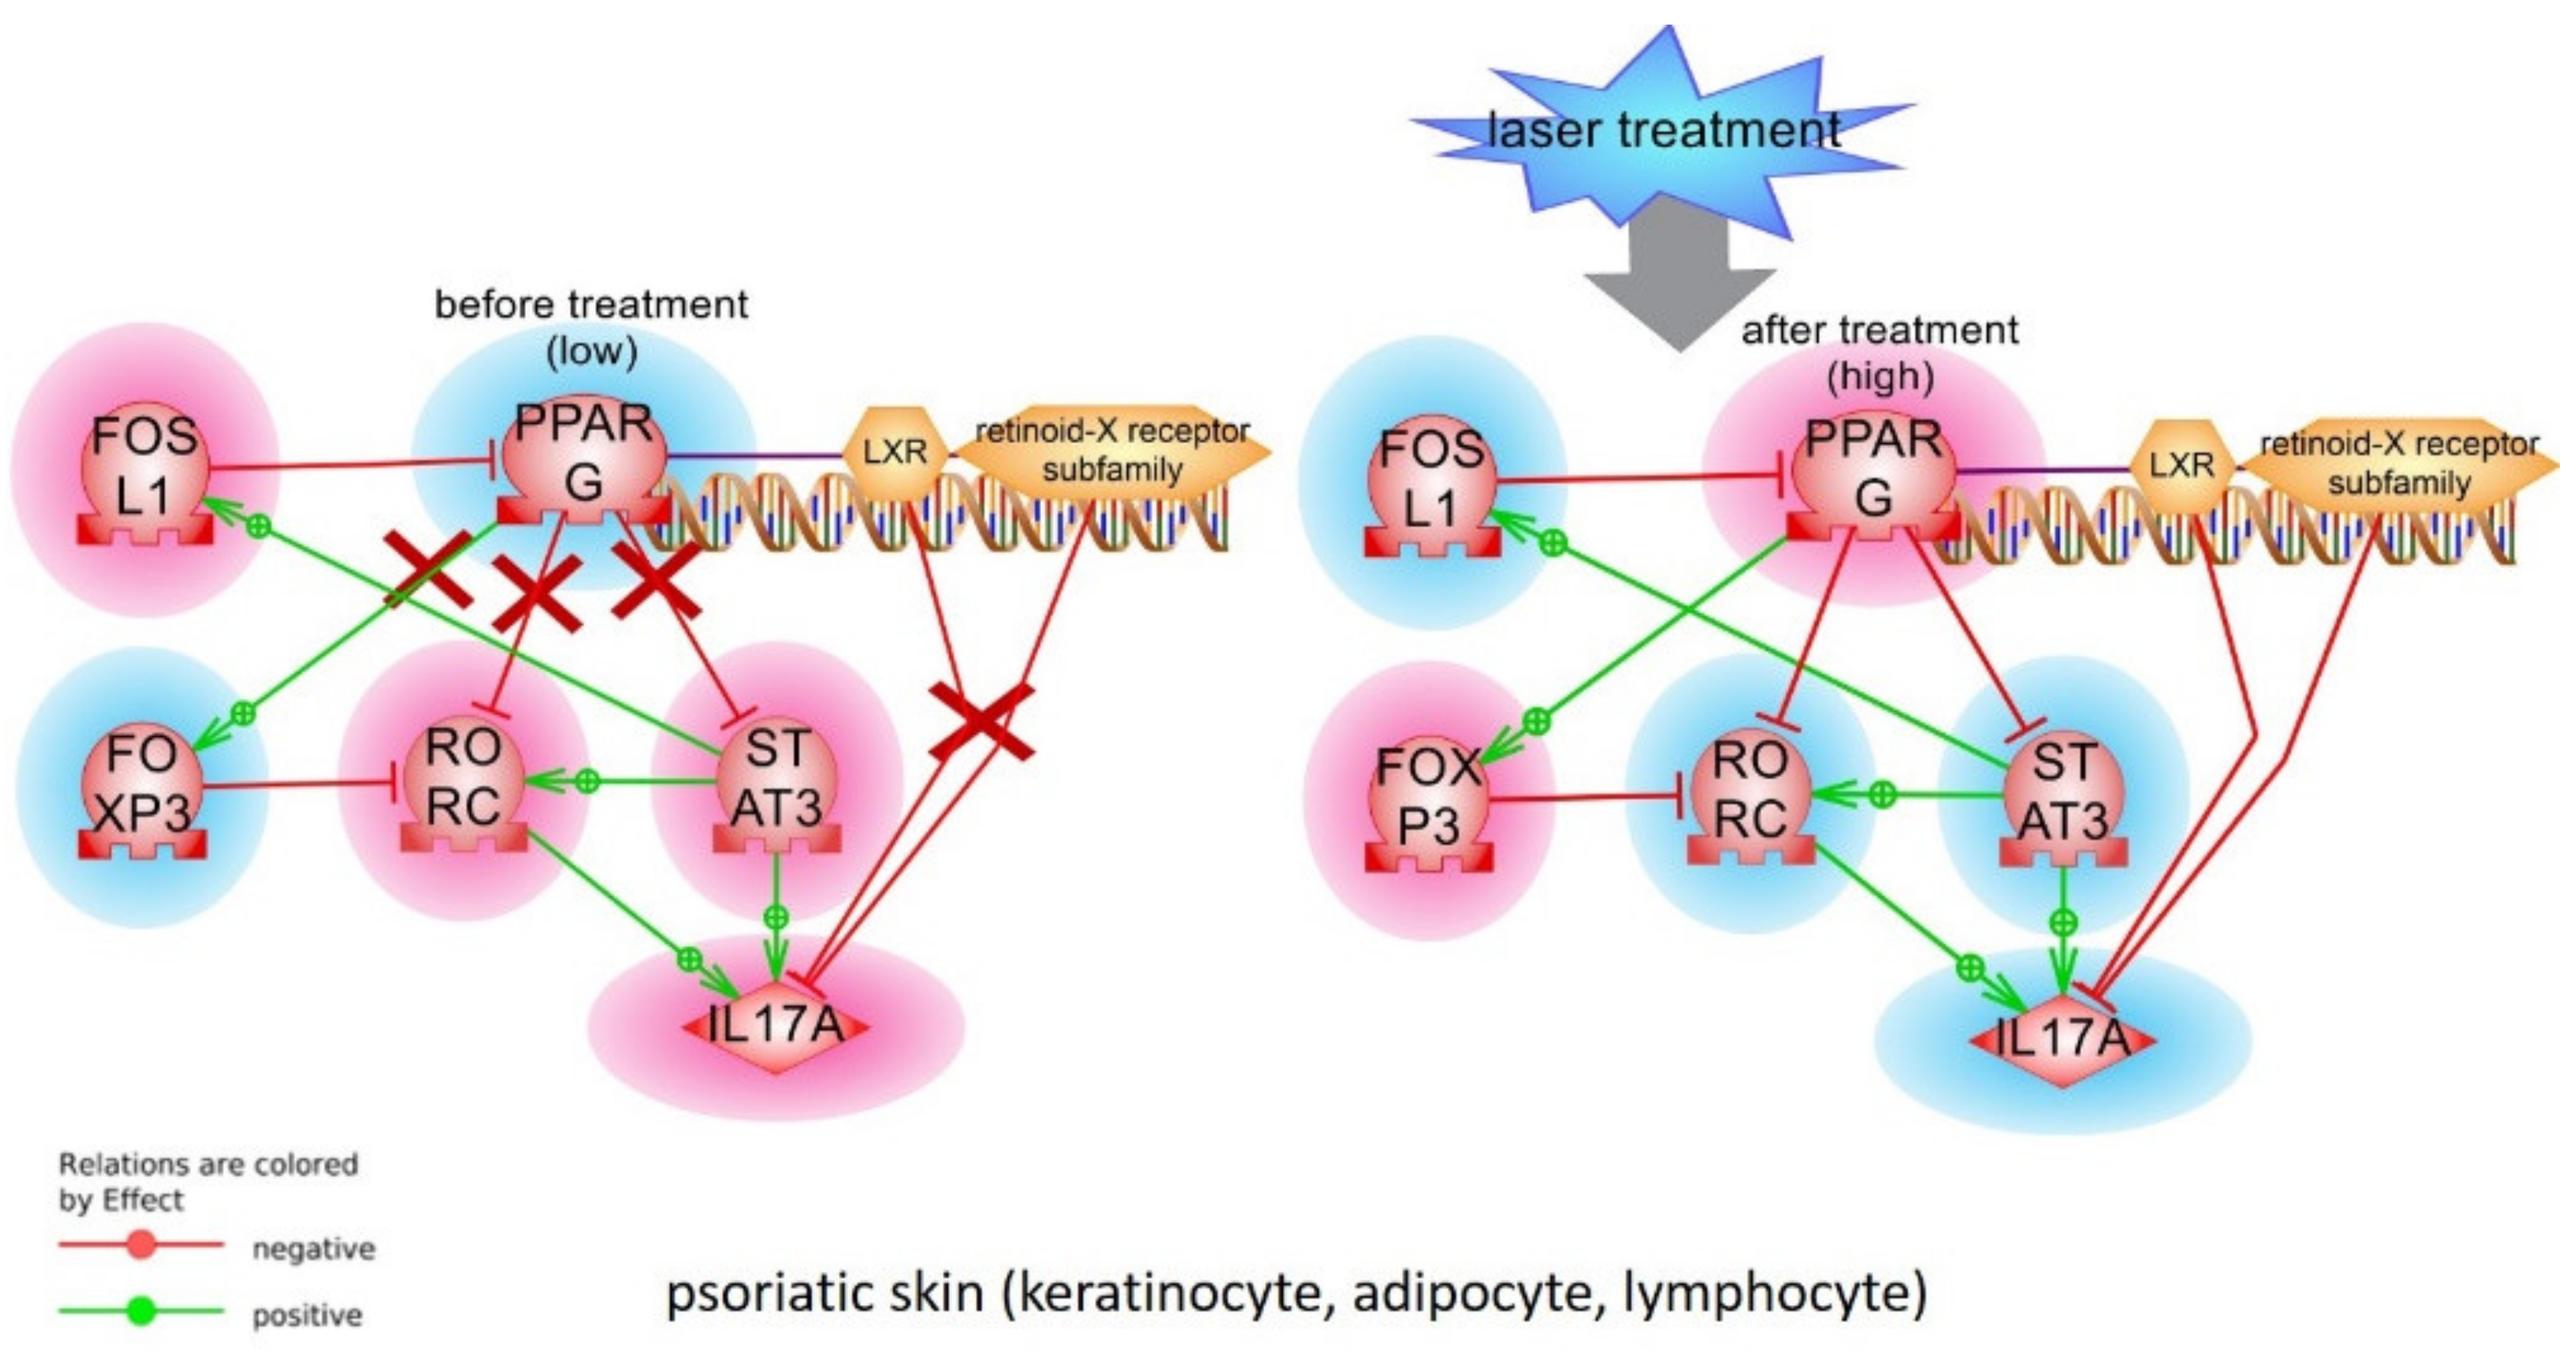
In the model we tested in this work IL17A, STATS3, and RORC are statistically significant negative targets of PPARγ. We expected that activity of these targets should be higher in psoriatic lesion and slightly decrease after laser treatment. Our experimental results support this idea and they are aligned well with detected low activity of PPARγ in psoriatic skin and CD3+ T cells, since PPARγ may act as a suppressor of the IL17 gene transcription by inhibiting his direct transcription factors RORC and STAT3 (Figure 8). In psoriatic cell STAT3 becomes more active than in healthy cell and, by providing feedback loop via FOSL1, further strengthens the downregulation of PPARγ expression (Figure 8).
While the prominent role of RORC in psoriasis as the major controller of Th17 cell differentiation is well described, however, the evidence of RORC expression in psoriasis is controversial. In mice T-cells and dendritic cells had increased STAT3/RORC expression [18] and patients with psoriasis had elevated level of RORC (RORG-t isoform) [20]. In published microarray data, the level of expression of RORC was downregulated in most of 58 patients [15,21].
Contrariwise, FOSL1 may be important for stabilization of psoriatic inflammation. FOSL1 was reported to have high level of expression in human psoriasis tissues [22,23] and be able to inhibit PPARγ directly [24].
Laser treatment diminishes the STAT3->FOSL1->PPARγ feedback loop and restores PPARγ activity and slightly reduce IL17 production (Figure 8). The molecular mechanism of laser treatment is not well understood. Low-intensity laser waves are absorbed by oxygen, CO2, water molecules switching them into an activated state. Proteins with activated molecules participate in interactions more intensively. There was shown that low laser treatment stimulates Ca2+-related signaling pathways including general membrane reparation and cell proliferation. There are expectations that low-level laser treatment will result in the replacement of “old” cells with new ones thus reducing the inflammation in the psoriatic lesion [25]. Interesting that ozonated autohemotherapy (OAHT) treatment also elevated PPARγ expression in CD4+ T cells of patients with psoriasis and decreased patients’ PASI scores [19].
Functions of IL17 and transcription factors we tested in this work are well studied in psoriasis (see more details in [22,26,27], and in our previous publications [28,29,30]). Other aspects of PPARγ related signalling pathways were also studied. For example, interactions between different PPARs isoforms are important for their functions. PPARδ directly inhibits PPARγ, and many pro-inflammatory factors, fatty acid signaling, and “regenerative skin phenotype” pathways (IFNG, TNFA) linked with PPARδ stimulation [31]. miRNAs may play important regulator role in PPARγ signaling as well [32].
Single nucleotide polymorphisms in PPARγ gene are commonly associated with insulin resistance and diabetes. There are no significant associations between mutations in PPARG with psoriasis (based on search in OMIM, ClinVAr and Resnet-2020 databases). However, the association between rs1801282 in PPARγ and psoriasis, and low level of PPARγ expression were reported in Egyptian patients with obesity and metabolic syndrome. Authors concluded that reduced PPARγ activity could be the factor responsible for translating the metabolic state among psoriatic patients [33,34].
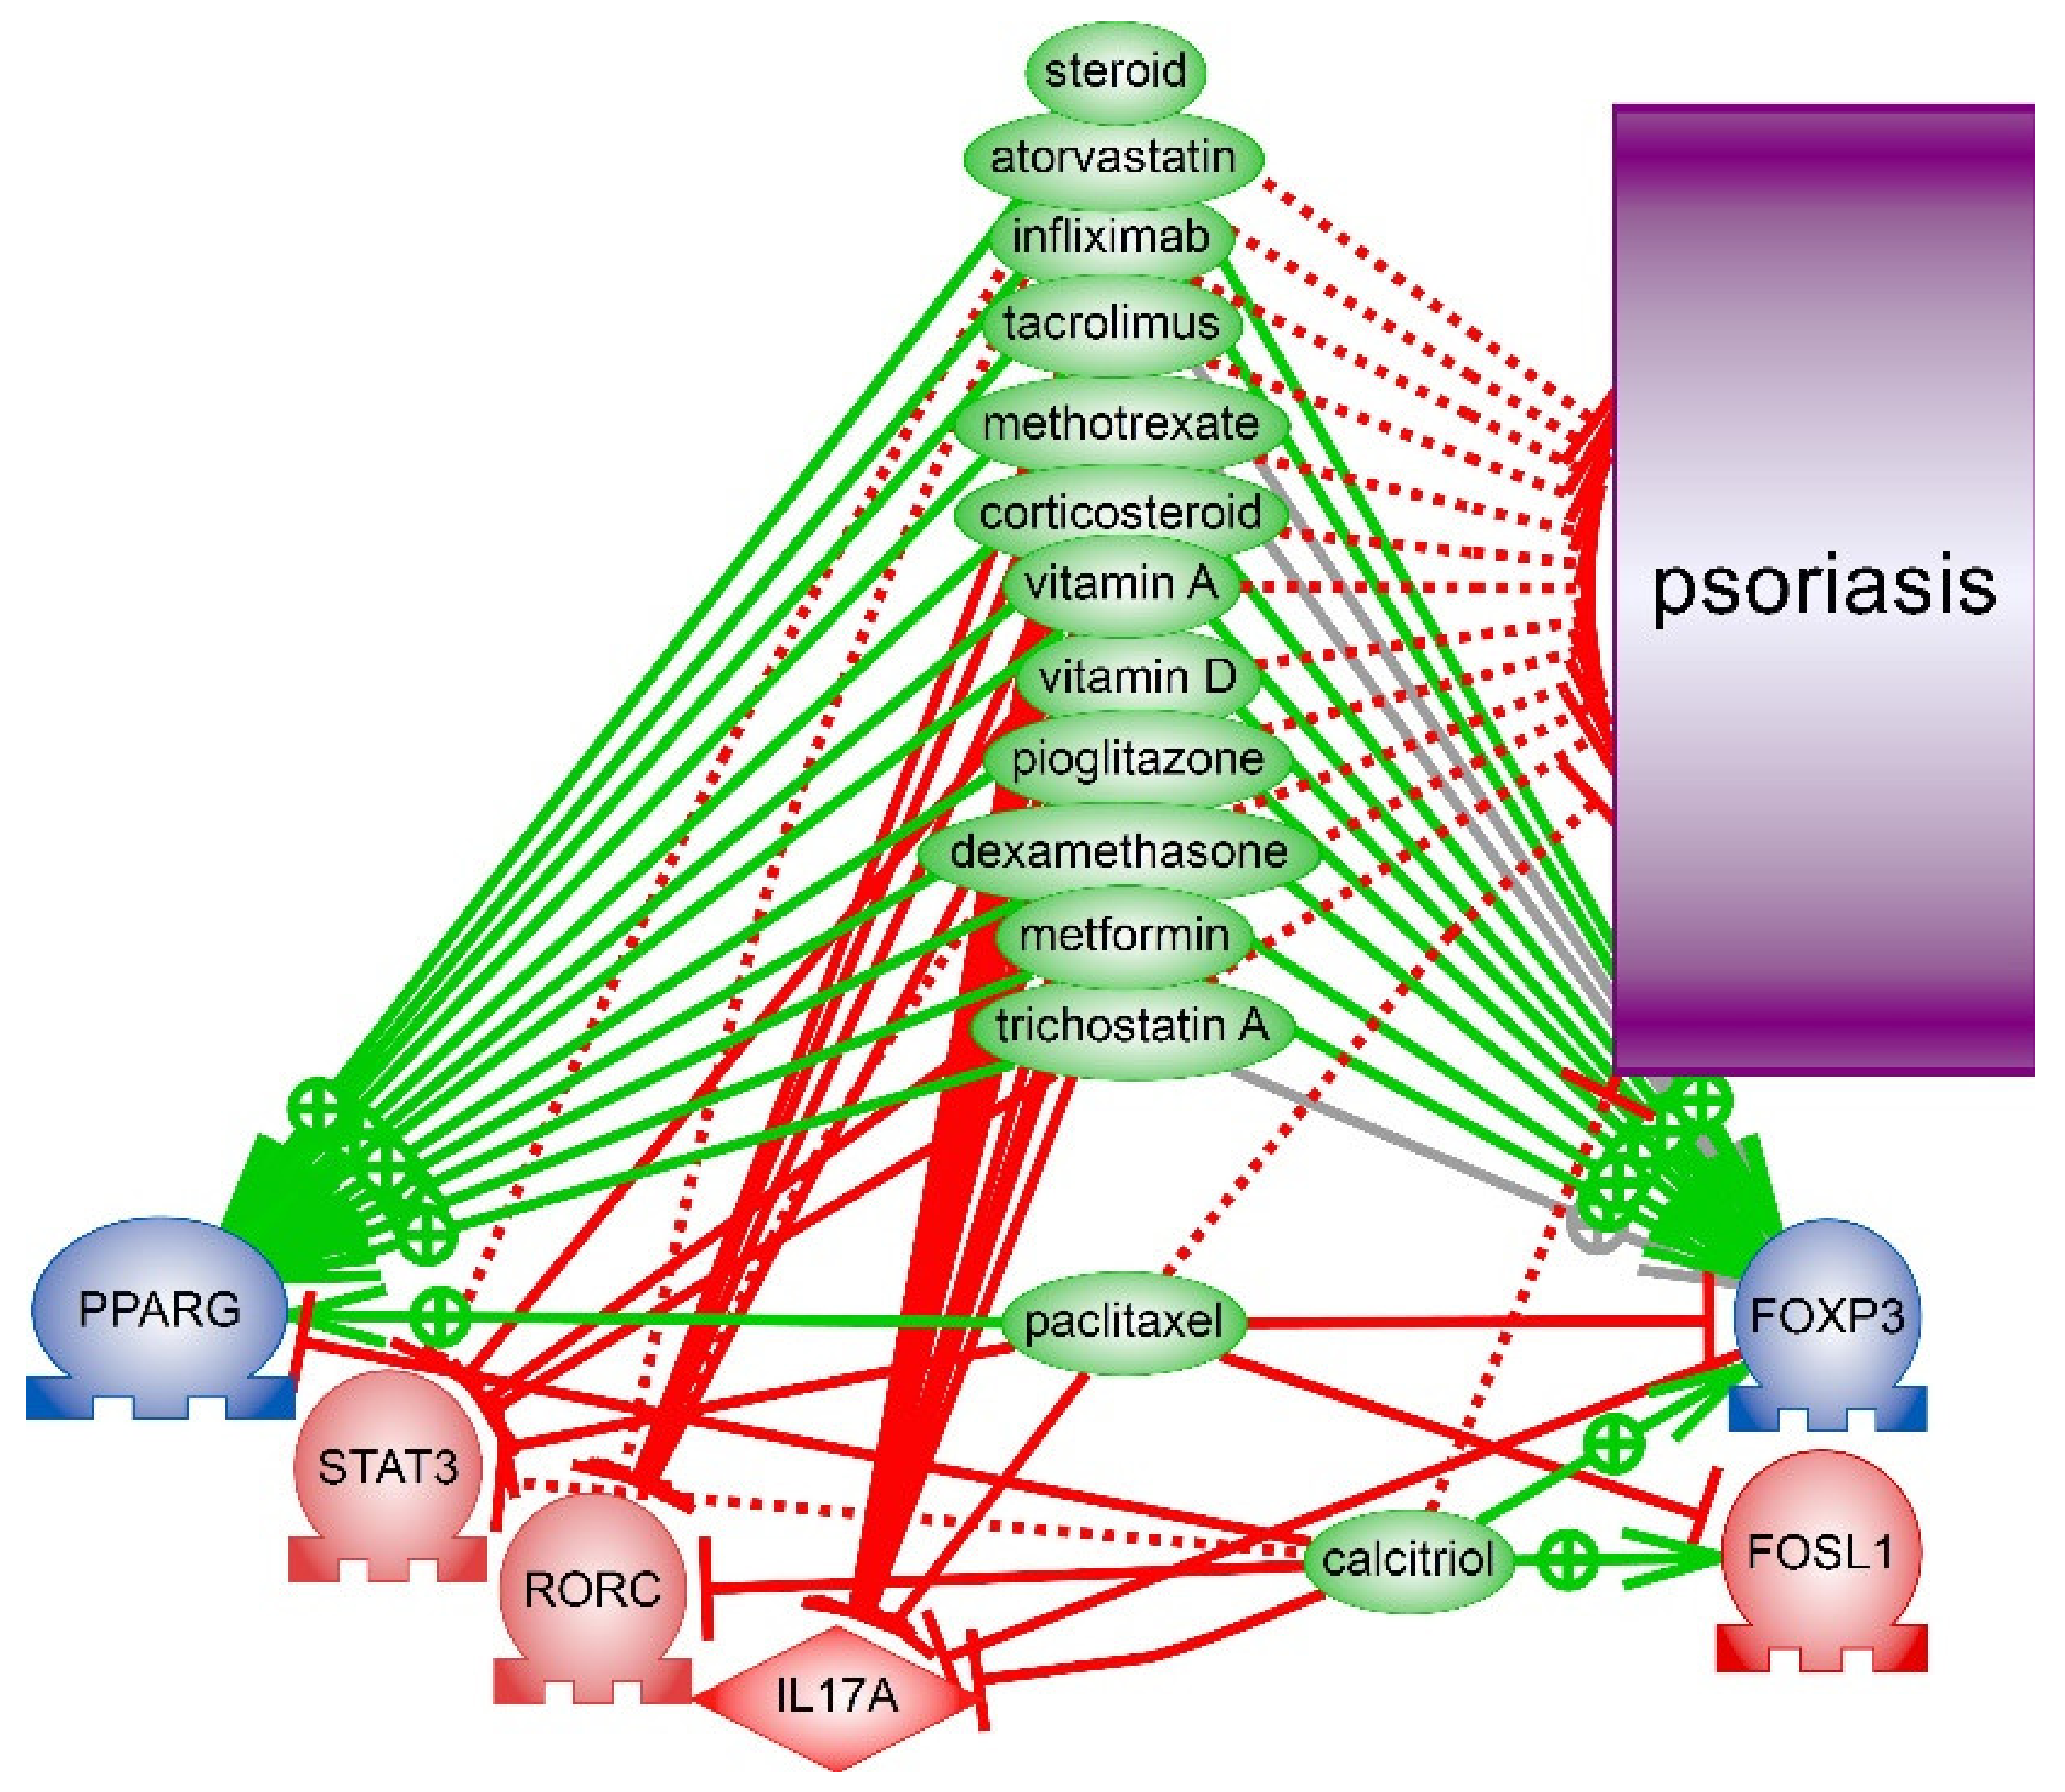
Can players of PPARG signalling be considered as drug targets for psoriasis treatment? We used enrichment analysis with literature biomedical network (Resnet—2020) helps to identify the significant differences in known drugs mechanisms associated with tested model of PPARγ signaling. We searched for drugs which were verified in clinical trials or reported in publications as drugs against psoriasis and simultaneously were reported as inhibitors of IL17, STAT3, FOSL1, RORC but not PPARγ or FOXP3. Several substances like corticosteroids and tacrolimus were identified by given criteria. We have found that two other drugs (calcitriol and paclitaxel) that indeed reduce inflammation in psoriasis, however, may not be very effective in psoriasis treatment because they inhibit PPARγ or FOXP3 (Figure 9). Anti-diabetes drugs such as biguanides (metformin) and thiazolidinediones (rosiglitazone and pioglitazone) were studied as additional treatment options for psoriasis. Moreover, it is known that thiazolidinediones act as direct ligand activators of PPARγ and it normalizes the histological features of psoriatic skin in vitro [35].

5. Conclusions

We detected the high level of RORC and STAT3 mRNA in the psoriatic skin of patients which were reduced after laser treatment. Protein level of STAT3 also were upregulated in psoriatic skin and CD3+ T cells. Also, we report the downregulation of FOXP3 mRNA expression which is a direct inhibitor of RORC and positive target of PPARγ. Though, low expression of PPARγ as well as high level of RORC expression is supported by down-regulated FOXP3 expression and validates reconstructed model. Experimental data we obtained support our model and the hypothesis that in psoriasis low level of PPARγ activity stimulates IL17 synthesis because STAT3 and RORC became less suppressed.
Our research has several limitations. The number of tested samples was relatively small. Not all proteins from the model were tested on protein levels. Also, additional analysis of receptors activation and intermediate cellular cascades may help to evaluate upstream triggers and regulators of PPARγ. Finally, the interaction of transcription factors and regulation of gene expression are more complex than tested model. Additional scaffolds proteins such as LXR-RXR complex, histones and chromatin remodelling complexes are involved in gene expression.
In summary, we report that PPARγ weakens the expression of genes that contribute in the development of psoriatic lesion. It is not clear what upstream pathway is the most important for PPARγ/IL17 regulation in psoriasis. Our data show that transcriptional regulation of PPARγ expression by FOSL1 and by STAT3/FOSL1 feedback loop may be central in the psoriatic skin and T-cells.

Supplementary Materials

The following are available online at https://www.mdpi.com/article/10.3390/ijms22168603/s1.

Author Contributions

Conceptualization, V.S. and A.N.; Methodology, V.S.; Project administration, V.S.; Resources, V.S. and I.K.; Investigation, A.S., E.D. (Evgenia Dvoriankova), A.P., E.D. (Elena Denisova), O.M., V.S.; Writing—original draft, V.S. and A.N.; Writing—review & editing, V.S. and A.N.; Visualization, A.N., A.S., A.M.; Data curation, A.M.; funding acquisition, I.K. All authors have read and agreed to the published version of the manuscript.

Funding

This research received no external funding.

Institutional Review Board Statement

The study was conducted according to the guidelines of the Declaration of Helsinki, and approved by the Ethics Committee (12/02/2020 #2) of Centre of Theoretical Problems of Physico-Chemical Pharmacology, Russian Academy of Sciences, Russian Federation.

Informed Consent Statement

Informed consent was obtained from all subjects involved in the study.

Data Availability Statement

Not applicable.

Conflicts of Interest

The authors declare no conflict of interest.

References

  1. Schmuth, M.; Moosbrugger-Martinz, V.; Blunder, S.; Dubrac, S. Role of PPAR, LXR, and PXR in epidermal homeostasis and inflammation. Biochim. Biophys. Acta 2014, 1841, 463–473. [Google Scholar] [CrossRef]
  2. Sher, T.; Yi, H.F.; McBride, O.W.; Gonzalez, F.J. cDNA cloning, chromosomal mapping, and functional characterization of the human peroxisome proliferator activated receptor. Biochemistry 1993, 32, 5598–5604. [Google Scholar] [CrossRef] [PubMed]
  3. Sertznig, P.; Reichrath, J. Peroxisome proliferator-activated receptors (PPARs) in dermatology: Challenge and promise. Dermatoendocrinology 2011, 3, 130–135. [Google Scholar] [CrossRef]
  4. Kliewer, S.A.; Umesono, K.; Noonan, D.J.; Heyman, R.A.; Evans, R.M. Convergence of 9-cis retinoic acid and peroxisome proliferator signalling pathways through heterodimer formation of their receptors. Nature 1992, 358, 771–774. [Google Scholar] [CrossRef]
  5. Ricote, M.; Glass, C.K. PPARs and molecular mechanisms of transrepression. Biochim. Biophys. Acta 2007, 1771, 926–935. [Google Scholar] [CrossRef] [Green Version]
  6. Jiang, C.; Ting, A.T.; Seed, B. PPAR-gamma agonists inhibit production of monocyte inflammatory cytokines. Nature 1998, 391, 82–86. [Google Scholar] [CrossRef]
  7. Yessoufou, A.; Wahli, W. Multifaceted roles of peroxisome proliferator-activated receptors (PPARs) at the cellular and whole organism levels. Swiss Med. Wkly. 2010, 140, w13071. [Google Scholar] [CrossRef]
  8. Nehrenheim, K.; Meyer, I.; Brenden, H.; Vielhaber, G.; Krutmann, J.; Grether-Beck, S. Dihydrodehydrodiisoeugenol enhances adipocyte differentiation and decreases lipolysis in murine and human cells. Exp. Dermatol. 2013, 22, 638–643. [Google Scholar] [CrossRef]
  9. Adachi, Y.; Hatano, Y.; Sakai, T.; Fujiwara, S. Expressions of peroxisome proliferator-activated receptors (PPARs) are directly influenced by permeability barrier abrogation and inflammatory cytokines and depressed PPARα modulates expressions of chemokines and epidermal differentiation-related molecules in keratinocytes. Exp. Dermatol. 2013, 22, 606–608. [Google Scholar] [PubMed]
  10. Henson, P. Suppression of macrophage inflammatory responses by PPARs. Proc. Natl. Acad. Sci. USA 2003, 100, 6295–6296. [Google Scholar] [CrossRef] [PubMed] [Green Version]
  11. Marx, N.; Kehrle, B.; Kohlhammer, K.; Grüb, M.; Koenig, W.; Hombach, V.; Libby, P.; Plutzky, J. PPAR activators as antiinflammatory mediators in human T lymphocytes: Implications for atherosclerosis and transplantation-associated arteriosclerosis. Circ. Res. 2002, 90, 703–710. [Google Scholar] [CrossRef] [Green Version]
  12. Demerjian, M.; Man, M.-Q.; Choi, E.-H.; Brown, B.E.; Crumrine, D.; Chang, S.; Mauro, T.; Elias, P.M.; Feingold, K.R. Topical treatment with thiazolidinediones, activators of peroxisome proliferator-activated receptor-gamma, normalizes epidermal homeostasis in a murine hyperproliferative disease model. Exp. Dermatol. 2006, 15, 154–160. [Google Scholar] [CrossRef]
  13. Nesterova, A.P.; Klimov, E.A.; Zharkova, M.; Sozin, S.; Sobolev, V.; Ivanikova, N.V.; Shkrob, M.; Yuryev, A. Diseases of the skin and subcutaneous tissue. In Disease Pathways; Elsevier: Amsterdam, The Netherlands, 2020; pp. 493–532. ISBN 978-0-12-817086-1. [Google Scholar] [CrossRef]
  14. Nesterova, A.P.; Yuryev, A.; Klimov, E.A.; Zharkova, M.; Shkrob, M.; Ivanikova, N.V.; Sozin, S.; Sobolev, V. Disease Pathways: An Atlas of Human Disease Signaling Pathways, 1st ed.; Elsevier: Waltham, MA, USA, 2019; ISBN 978-0-12-817086-1. [Google Scholar]
  15. Sobolev, V.; Nesterova, A.; Soboleva, A.; Dvoriankova, E.; Piruzyan, A.; Mildzikhova, D.; Korsunskaya, I.; Svitich, O. The Model of PPARγ-Downregulated Signaling in Psoriasis. PPAR Res. 2020, 2020, 6529057. [Google Scholar] [CrossRef] [PubMed]
  16. Livak, K.J.; Schmittgen, T.D. Analysis of Relative Gene Expression Data Using Real-Time Quantitative PCR and the 2−ΔΔCT Method. Methods 2001, 25, 402–408. [Google Scholar] [CrossRef] [PubMed]
  17. Yao, Y.; Richman, L.; Morehouse, C.; de los Reyes, M.; Higgs, B.W.; Boutrin, A.; White, B.; Coyle, A.; Krueger, J.; Kiener, P.A.; et al. Type I Interferon: Potential Therapeutic Target for Psoriasis? PLoS ONE 2008, 3, e2737. [Google Scholar] [CrossRef] [PubMed]
  18. Nadeem, A.; Al-Harbi, N.O.; Ansari, M.A.; Al-Harbi, M.M.; El-Sherbeeny, A.M.; Zoheir, K.M.A.; Attia, S.M.; Hafez, M.M.; Al-Shabanah, O.A.; Ahmad, S.F. Psoriatic inflammation enhances allergic airway inflammation through IL-23/STAT3 signaling in a murine model. Biochem. Pharmacol. 2017, 124, 69–82. [Google Scholar] [CrossRef]
  19. Zeng, J.; Tang, Z.; Zhang, Y.; Tong, X.; Dou, J.; Gao, L.; Ding, S.; Lu, J. Ozonated autohemotherapy elevates PPAR-γ expression in CD4+ T cells and serum HDL-C levels, a potential immunomodulatory mechanism for treatment of psoriasis. Am. J. Transl. Res. 2021, 13, 349–359. [Google Scholar]
  20. Mendoza, G.J.; Almeida, O.; Steinfeld, L. Intermittent fetal bradycardia induced by midpregnancy fetal ultrasonographic study. Am. J. Obstet. Gynecol. 1989, 160, 1038–1040. [Google Scholar] [CrossRef]
  21. Ding, J.; Gudjonsson, J.E.; Liang, L.; Stuart, P.E.; Li, Y.; Chen, W.; Weichenthal, M.; Ellinghaus, E.; Franke, A.; Cookson, W.; et al. Gene expression in skin and lymphoblastoid cells: Refined statistical method reveals extensive overlap in cis-eQTL signals. Am. J. Hum. Genet. 2010, 87, 779–789. [Google Scholar] [CrossRef] [Green Version]
  22. Zhu, W.; Li, J.; Su, J.; Li, J.; Li, J.; Deng, B.; Shi, Q.; Zhou, Y.; Chen, X. FOS-like antigen 1 is highly expressed in human psoriasis tissues and promotes the growth of HaCaT cells in vitro. Mol. Med. Rep. 2014, 10, 2489–2494. [Google Scholar] [CrossRef] [Green Version]
  23. Sobolev, V.V.; Zolotorenko, A.D.; Soboleva, A.G.; Elkin, A.M.; Il’ina, S.A.; Serov, D.N.; Potekaev, N.N.; Tkachenko, S.B.; Minnibaev, M.T.; Piruzyan, A.L. Effects of Expression of Transcriptional Factor AP-1 FOSL1 Gene on Psoriatic Process. Bull. Exp. Biol. Med. 2011, 150, 632–634. [Google Scholar] [CrossRef]
  24. Hasenfuss, S.C.; Bakiri, L.; Thomsen, M.K.; Williams, E.G.; Auwerx, J.; Wagner, E.F. Regulation of steatohepatitis and PPARγ signaling by distinct AP-1 dimers. Cell Metab. 2014, 19, 84–95. [Google Scholar] [CrossRef] [Green Version]
  25. Avci, P.; Gupta, A.; Sadasivam, M.; Vecchio, D.; Pam, Z.; Pam, N.; Hamblin, M.R. Low-level laser (light) therapy (LLLT) in skin: Stimulating, healing, restoring. Semin. Cutan. Med. Surg. 2013, 32, 41–52. [Google Scholar]
  26. Petit, R.G.; Cano, A.; Ortiz, A.; Espina, M.; Prat, J.; Muñoz, M.; Severino, P.; Souto, E.B.; García, M.L.; Pujol, M.; et al. Psoriasis: From Pathogenesis to Pharmacological and Nano-Technological-Based Therapeutics. Int. J. Mol. Sci. 2021, 22, 4983. [Google Scholar] [CrossRef]
  27. Calautti, E.; Avalle, L.; Poli, V. Psoriasis: A STAT3-Centric View. Int. J. Mol. Sci. 2018, 19, 171. [Google Scholar] [CrossRef] [Green Version]
  28. Sobolev, V.V.; Denisova, E.V.; Korsunskaya, I.M. Alteration of STAT3 gene expression in psoriasis treatment. Meditsinskiy Sov. Med. Counc. 2020, 12, 71–74. [Google Scholar] [CrossRef]
  29. Sobolev, V.V.; Soboleva, A.G.; Potekaev, N.N.; Melnichenko, O.O.; Korsunskaya, I.M.; Artemyeva, S.I. PPARγ gene expression analysis in psoriasis treatment. Meditsinskiy Sov. Med. Counc. 2021, 8, 82–87. [Google Scholar] [CrossRef]
  30. Sobolev, V.V.; Mezentsev, A.V.; Ziganshin, R.H.; Soboleva, A.G.; Denieva, M.; Korsunskaya, I.M.; Svitich, O.A. LC-MS/MS analysis of lesional and normally looking psoriatic skin reveals significant changes in protein metabolism and RNA processing. PLoS ONE 2021, 16, e0240956. [Google Scholar] [CrossRef] [PubMed]
  31. Romanowska, M.; al Yacoub, N.; Seidel, H.; Donandt, S.; Gerken, H.; Phillip, S.; Haritonova, N.; Artuc, M.; Schweiger, S.; Sterry, W.; et al. PPARδ Enhances Keratinocyte Proliferation in Psoriasis and Induces Heparin-Binding EGF-Like Growth Factor. J. Investig. Dermatol. 2008, 128, 110–124. [Google Scholar] [CrossRef] [PubMed] [Green Version]
  32. Xiuli, Y.; Honglin, W. miRNAs Flowing Up and Down: The Concerto of Psoriasis. Front. Med. 2021, 8, 646796. [Google Scholar] [CrossRef] [PubMed]
  33. Hegazy, R.A.; Abdel Hay, R.M.; Shaker, O.; Sayed, S.S.; Abdel Halim, D.A. Psoriasis and metabolic syndrome: Is peroxisome proliferator-activated receptor-γ part of the missing link? Eur. J. Dermatol. 2012, 22, 622–628. [Google Scholar] [CrossRef] [PubMed]
  34. Seleit, I.; Bakry, O.; Abd El Gayed, E.; Ghanem, M. Peroxisome proliferator-activated receptor-γ gene polymorphism in psoriasis and its relation to obesity, metabolic syndrome, and narrowband ultraviolet B response: A case–control study in Egyptian patients. Indian J. Dermatol. 2019, 64, 192. [Google Scholar] [PubMed]
  35. Ellis, C.N.; Varani, J.; Fisher, G.J.; Zeigler, M.E.; Pershadsingh, H.A.; Benson, S.C.; Chi, Y.; Kurtz, T.W. Troglitazone Improves Psoriasis and Normalizes Models of Proliferative Skin Disease: Ligands for Peroxisome Proliferator-Activated Receptor-γ Inhibit Keratinocyte Proliferation. Arch. Dermatol. 2000, 136, 609–616. [Google Scholar] [CrossRef] [PubMed] [Green Version]
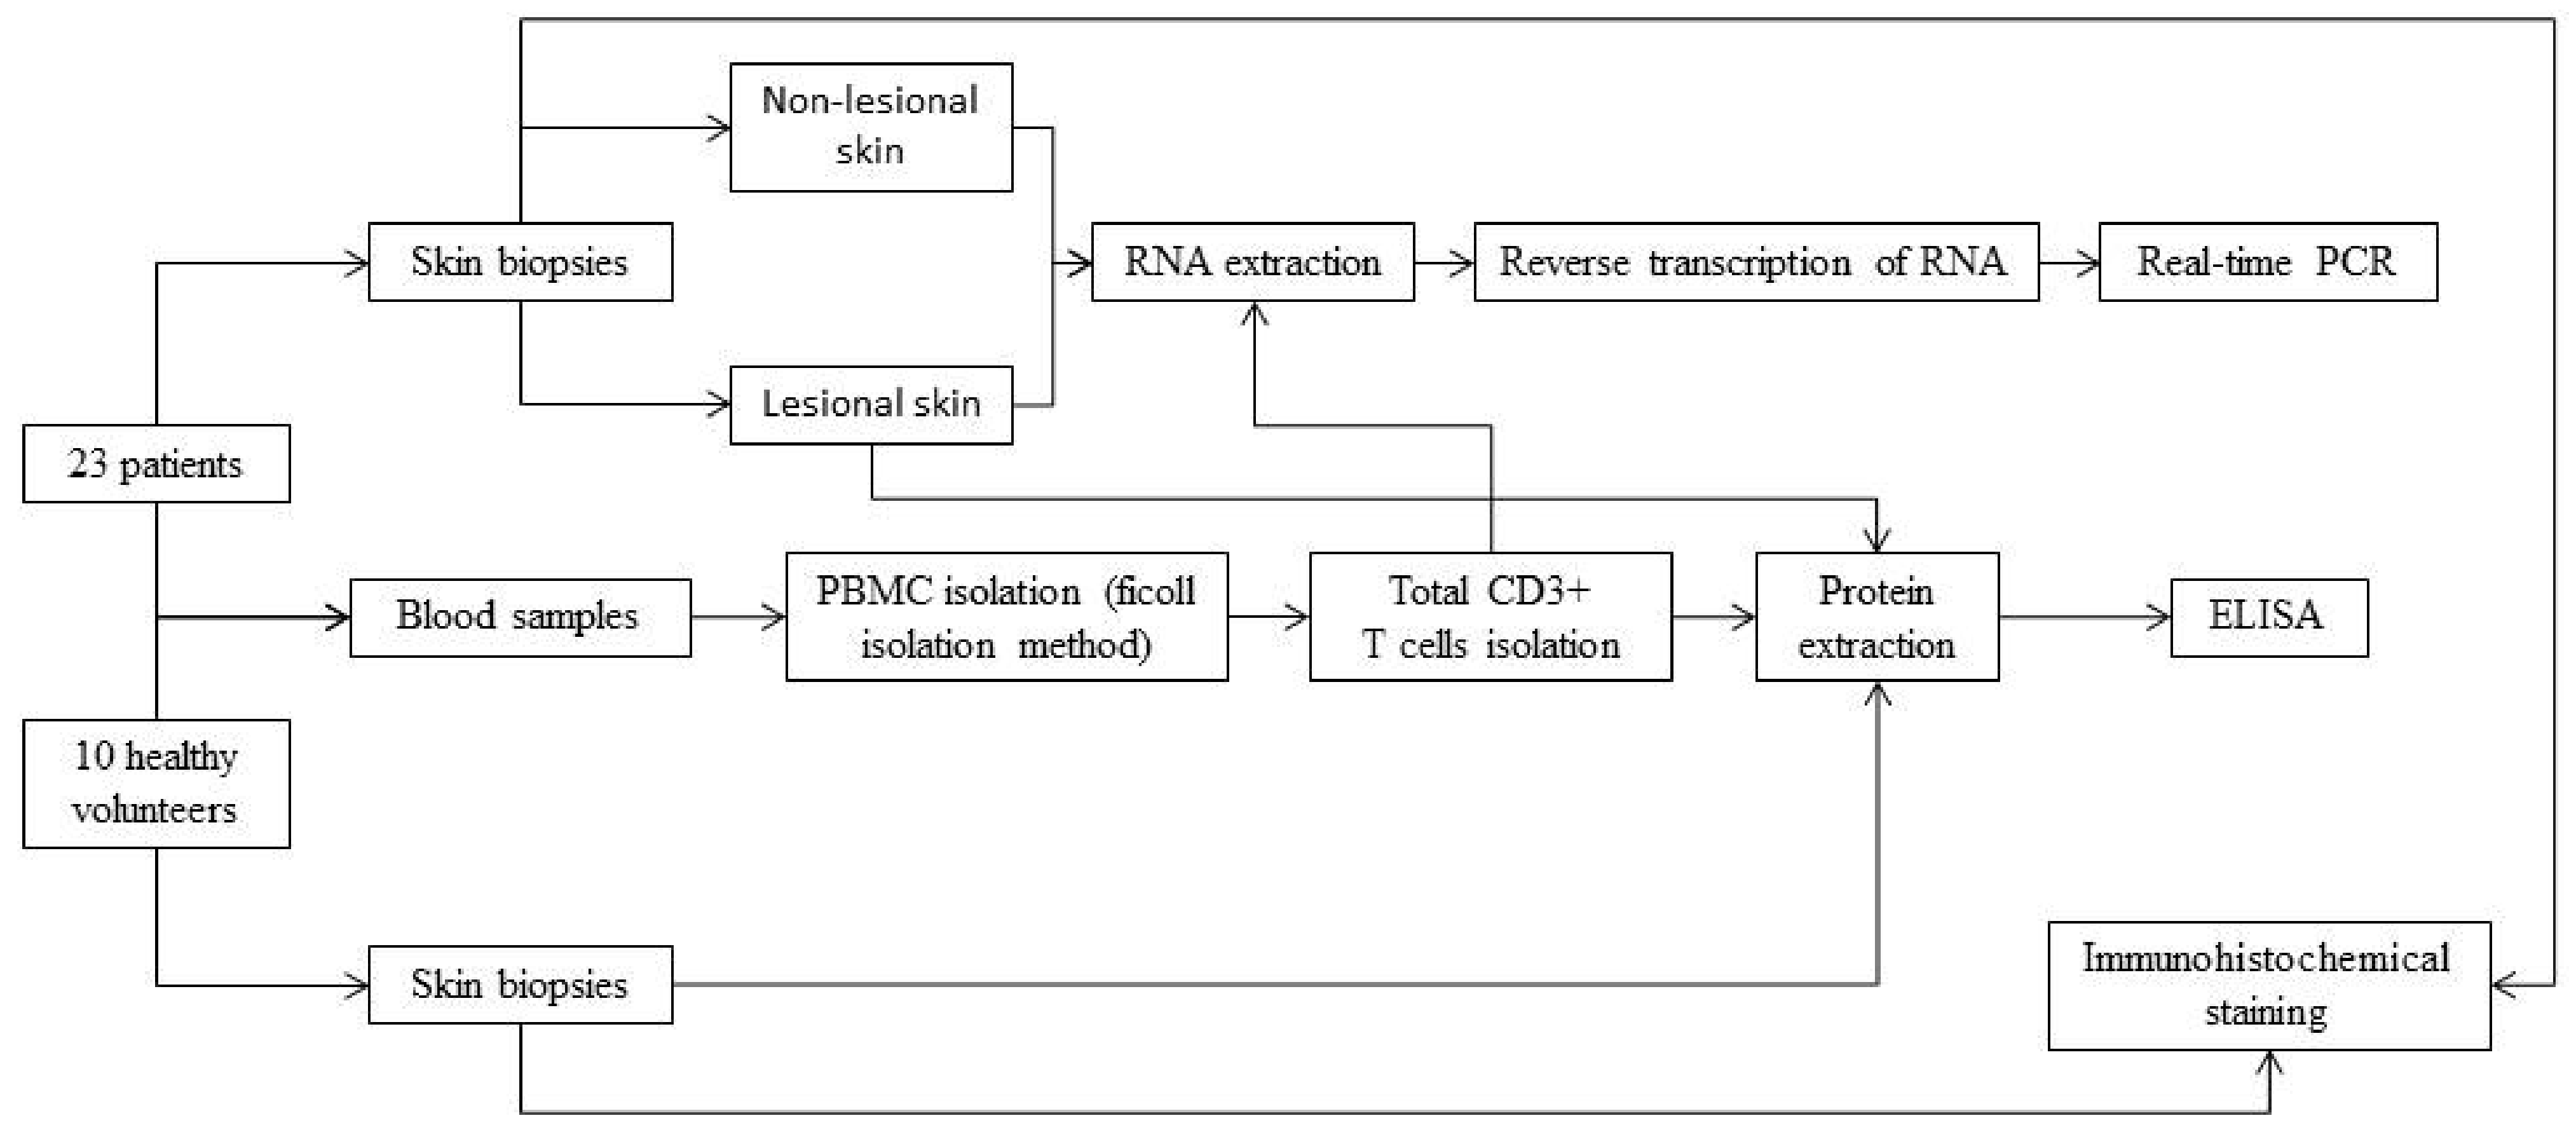
Figure 1. Scheme of experiment procedure.
Ijms 22 08603 g001
Figure 2. Comparative analysis of changes in the expression levels of PPARγ, STAT3, IL17A, RORC, FOXP3 and FOSL1 in lesional skin and CD3+ T cells of psoriasis patients. Dark grey bars—lesional vs. uninvolved skin; Light grey bars—CD3+ cells of psoriasis patients vs. same cells of healthy volunteers. The level of gene expression in control group was set to 1. Statistically significant changes in gene expression (p < 0.05) are marked with asterisk sign (*).
Ijms 22 08603 g002
Figure 3. The expression levels of selected proteins in the samples obtained from psoriasis patients (n = 23) and healthy volunteers (n = 10) assessed by ELISA. The upper panel—lesional vs. healthy skin. The lower panel—samples of CD3+ T cells of psoriasis patients and healthy volunteers. Statistically significant changes in gene expression (p < 0.05) are marked with asterisk sign (*).
Ijms 22 08603 g003
Figure 4. Immunohistochemical staining of antigens in the affected and non-affected psoriatic skin in comparison with the skin of healthy donors. The image was magnified 100×. Black arrows indicate PPARy accumulation in the suprabasal layer of epidermal keratinocytes.
Ijms 22 08603 g004
Figure 5. Visual positive effect after low-level laser therapy. Reduction of psoriatic skin inflammation was achieved.
Ijms 22 08603 g005
Figure 6. Comparison of PPARγ (A), FOXP3 (B), FOSL1 (C), STAT3 (D), IL17A (E) and RORC (F) genes expression in the skin of 23 patients with psoriasis before and after low-level laser therapy. The levels of mRNA concentration for genes in psoriatic skin samples was calculated in relation to the level of the same genes in unaffected skin samples (which was taken as conditional 1, p < 0.05). See supplemental materials for detailed statistics (“PPARG expression file”).
Ijms 22 08603 g006
Figure 7. Model of PPARγ pathway in psoriasis (simplified version). Changes in gene expression are highlighted according to results of analysis in red (over-expressed genes) and in blue (down-expressed genes). In psoriatic lesion, cytokines, growth factors, pathogens, apoptotic debris as well as dendritic cells activates TLRs, AGER and EGFR among other receptors on the surface of keratinocytes and T-cells. Activates receptors transfer the signal to their canonical cascades such as G-couple proteins, PI3K, PKA, MAPK1, or calcium (not shown). As a result, several direct inhibitors of PPARG protein such as TSC2 or inhibitors of PPARG expression (FOSL1, Jun/Fos) became over activated. When PPARG is inhibited on both RNA expression and protein levels, this causes higher than normal expression of interleukins (such as IL17A) via STAT3 and RORC transcription factors. See supplemental materials for references and links to publications that support protein-protein interactions in the model.
Ijms 22 08603 g007
Figure 8. Alignment of tested changes in PPARγ signaling before and after laser treatment with the model. Changes in gene expression after treatment are marked with highlights (red—elevated; blue—lowered). Red X symbolise non-functional protein-protein interactions. LXR-RXR complex activity was not tested.
Ijms 22 08603 g008
Figure 9. Anti-psoriatic drugs that may stabilize PPARγ signaling and supress IL17 expression. Calcitriol and paclitaxel however have been reported to inhibit PPARγ or FOXP3. See details of interactions and references in files with models in Supplemental materials.
Ijms 22 08603 g009
Table 1. Clinical parameters of patients with psoriasis (Psoriasis vulgaris).
Sex, n (%)AgePASIDisease History in Years
Patients
M/F (n = 23)43.5 ± 8.822 ± 6.217.4 ± 5.7
M, 10 (43.5%)42.9 ± 9.918.4 ± 5.515.9 ± 4.7
F, 13 (56.5%)44.9 ± 9.224.8 ± 4.217.6 ± 6.7
Healthy volunteers
M/F (n = 10)40.9 ± 9n/an/a
M, 4 (40%)40.2 ± 7.3n/an/a
F, 6 (60%)41.3 ± 10.6n/an/a
Table 2. Comparative analysis of gene and protein expression in male (n = 10) and female (n = 13) patients.
GroupFOSL1PPARγFOXP3STAT3IL17ARORC
(a) qPCR of skin samples, folds;
males7.36 ± 3.500.66 ± 0.060.61 ± 0.074.52 ± 0.6631.27 ± 7.426.87 ± 1.26
females12.29 ± 3.730.74 ± 0.100.56 ± 0.064.39 ± 0.6947.93 ± 14.027.78 ± 1.02
p0.360.520.590.900.350.58
(b) qPCR of CD3+ cells, folds;
males5.80 ± 1.690.27 ± 0.150.22 ± 0.069.83 ± 3.94123.99 ± 20.3813.84 ± 3.65
females5.79 ± 1.240.31 ± 0.130.16 ± 0.044.79 ± 1.6290.82 ± 10.6916.82 ± 2.73
p1.000.860.380.210.140.51
(c) ELISA of skin samples, ng/mL;
malesN.D.1.94 ± 0.30N.D.7.20 ± 1.011.23 ± 0.15N.D.
femalesN.D.2.16 ± 0.29N.D.8.46 ± 0.781.08 ± 0.12N.D.
p 0.61 0.330.45
(d) ELISA of CD3+, ng/mL;
malesN.D.2.05 ± 0.55N.D.14.33 ± 2.491.50 ± 0.13N.D.
femalesN.D.1.46 ± 0.32N.D.10.82 ± 1.971.63 ± 0.13 N.D.
p 0.33 0.270.49
Table 3. Comparative analysis of gene and protein expression in female patients have (n = 6) and do not have (n = 7) menopause.
GroupFOSL1PPARγFOXP3STAT3IL17ARORC
(a) qPCR of skin samples, folds;
no menopause7.15 ± 1.390.76 ± 0.120.57 ± 0.104.79 ± 1.1043.86 ± 10.548.71 ± 1.37
menopause16.69 ± 7.520.73 ± 0.160.52 ± 0.073.83 ± 0.7159.23 ± 28.357.84 ± 1.93
p0.210.880.700.410.600.71
(b) qPCR of CD3+ cells, folds;
no menopause8.04 ± 1.870.24 ± 0.140.14 ± 0.047.07 ± 2.7782.59 ± 14.8816.98 ± 4.68
menopause3.17 ± 0.750.39 ± 0.240.18 ± 0.082.12 ± 0.60100.43 ± 15.8016.64 ± 2.85
p0.0470.590.610.130.430.95
(c) ELISA of skin samples, ng/mL;
no menopauseN.D.2.45 ± 0.46N.D.7.69 ± 0.490.98 ± 0.16N.D.
menopauseN.D.1.81 ± 0.30N.D.9.36 ± 1.581.21 ± 0.18N.D.
p 0.29 0.300.36
(d) ELISA of CD3+, ng/mL;
no menopauseN.D.1.80 ± 0.42N.D.11.41 ± 2.871.55 ± 0.21N.D.
menopauseN.D.1.05 ± 0.48N.D.10.13 ± 2.901.72 ± 0.15 N.D.
p 0.26 0.760.55
Table 4. Comparative analysis of gene and protein expression in healthy male (n = 4) and female (n = 6) volunteers.
GroupFOSL1PPARγFOXP3STAT3IL17ARORC
(a) qPCR of CD3+ cells, folds;
males1.23 ± 0.521.34 ± 0.651.26 ± 0.291.02 ± 0.550.91 ± 0.380.47 ± 0.14
females0.85 ± 0.180.77 ± 0.130.83 ± 0.160.99 ± 0.241.06 ± 0.231.35 ± 0.46
p0.440.410.200.960.730.17
(b) ELISA of skin samples, ng/mL;
malesN.D.9.16 ± 1.64N.D.3.95 ± 0.730.04 ± 0.01N.D.
femalesN.D.7.27 ± 0.77N.D.3.89 ± 1.150.07 ± 0.01N.D.
p 0.27 0.970.049
(c) ELISA of CD3+, ng/mL;
malesN.D.13.93 ± 1.37N.D.6.45 ± 2.090.05 ± 0.02N.D.
femalesN.D.11.47 ± 2.35N.D.5.28 ± 0.890.09 ± 0.03N.D.
p 0.46 0.570.29
Publisher’s Note: MDPI stays neutral with regard to jurisdictional claims in published maps and institutional affiliations.