
ABCB1 Does Not Require the Side-Chain Hydrogen-Bond Donors Gln347, Gln725, Gln990 to Confer Cellular Resistance to the Anticancer Drug Taxol

 and
and 
Abstract
:
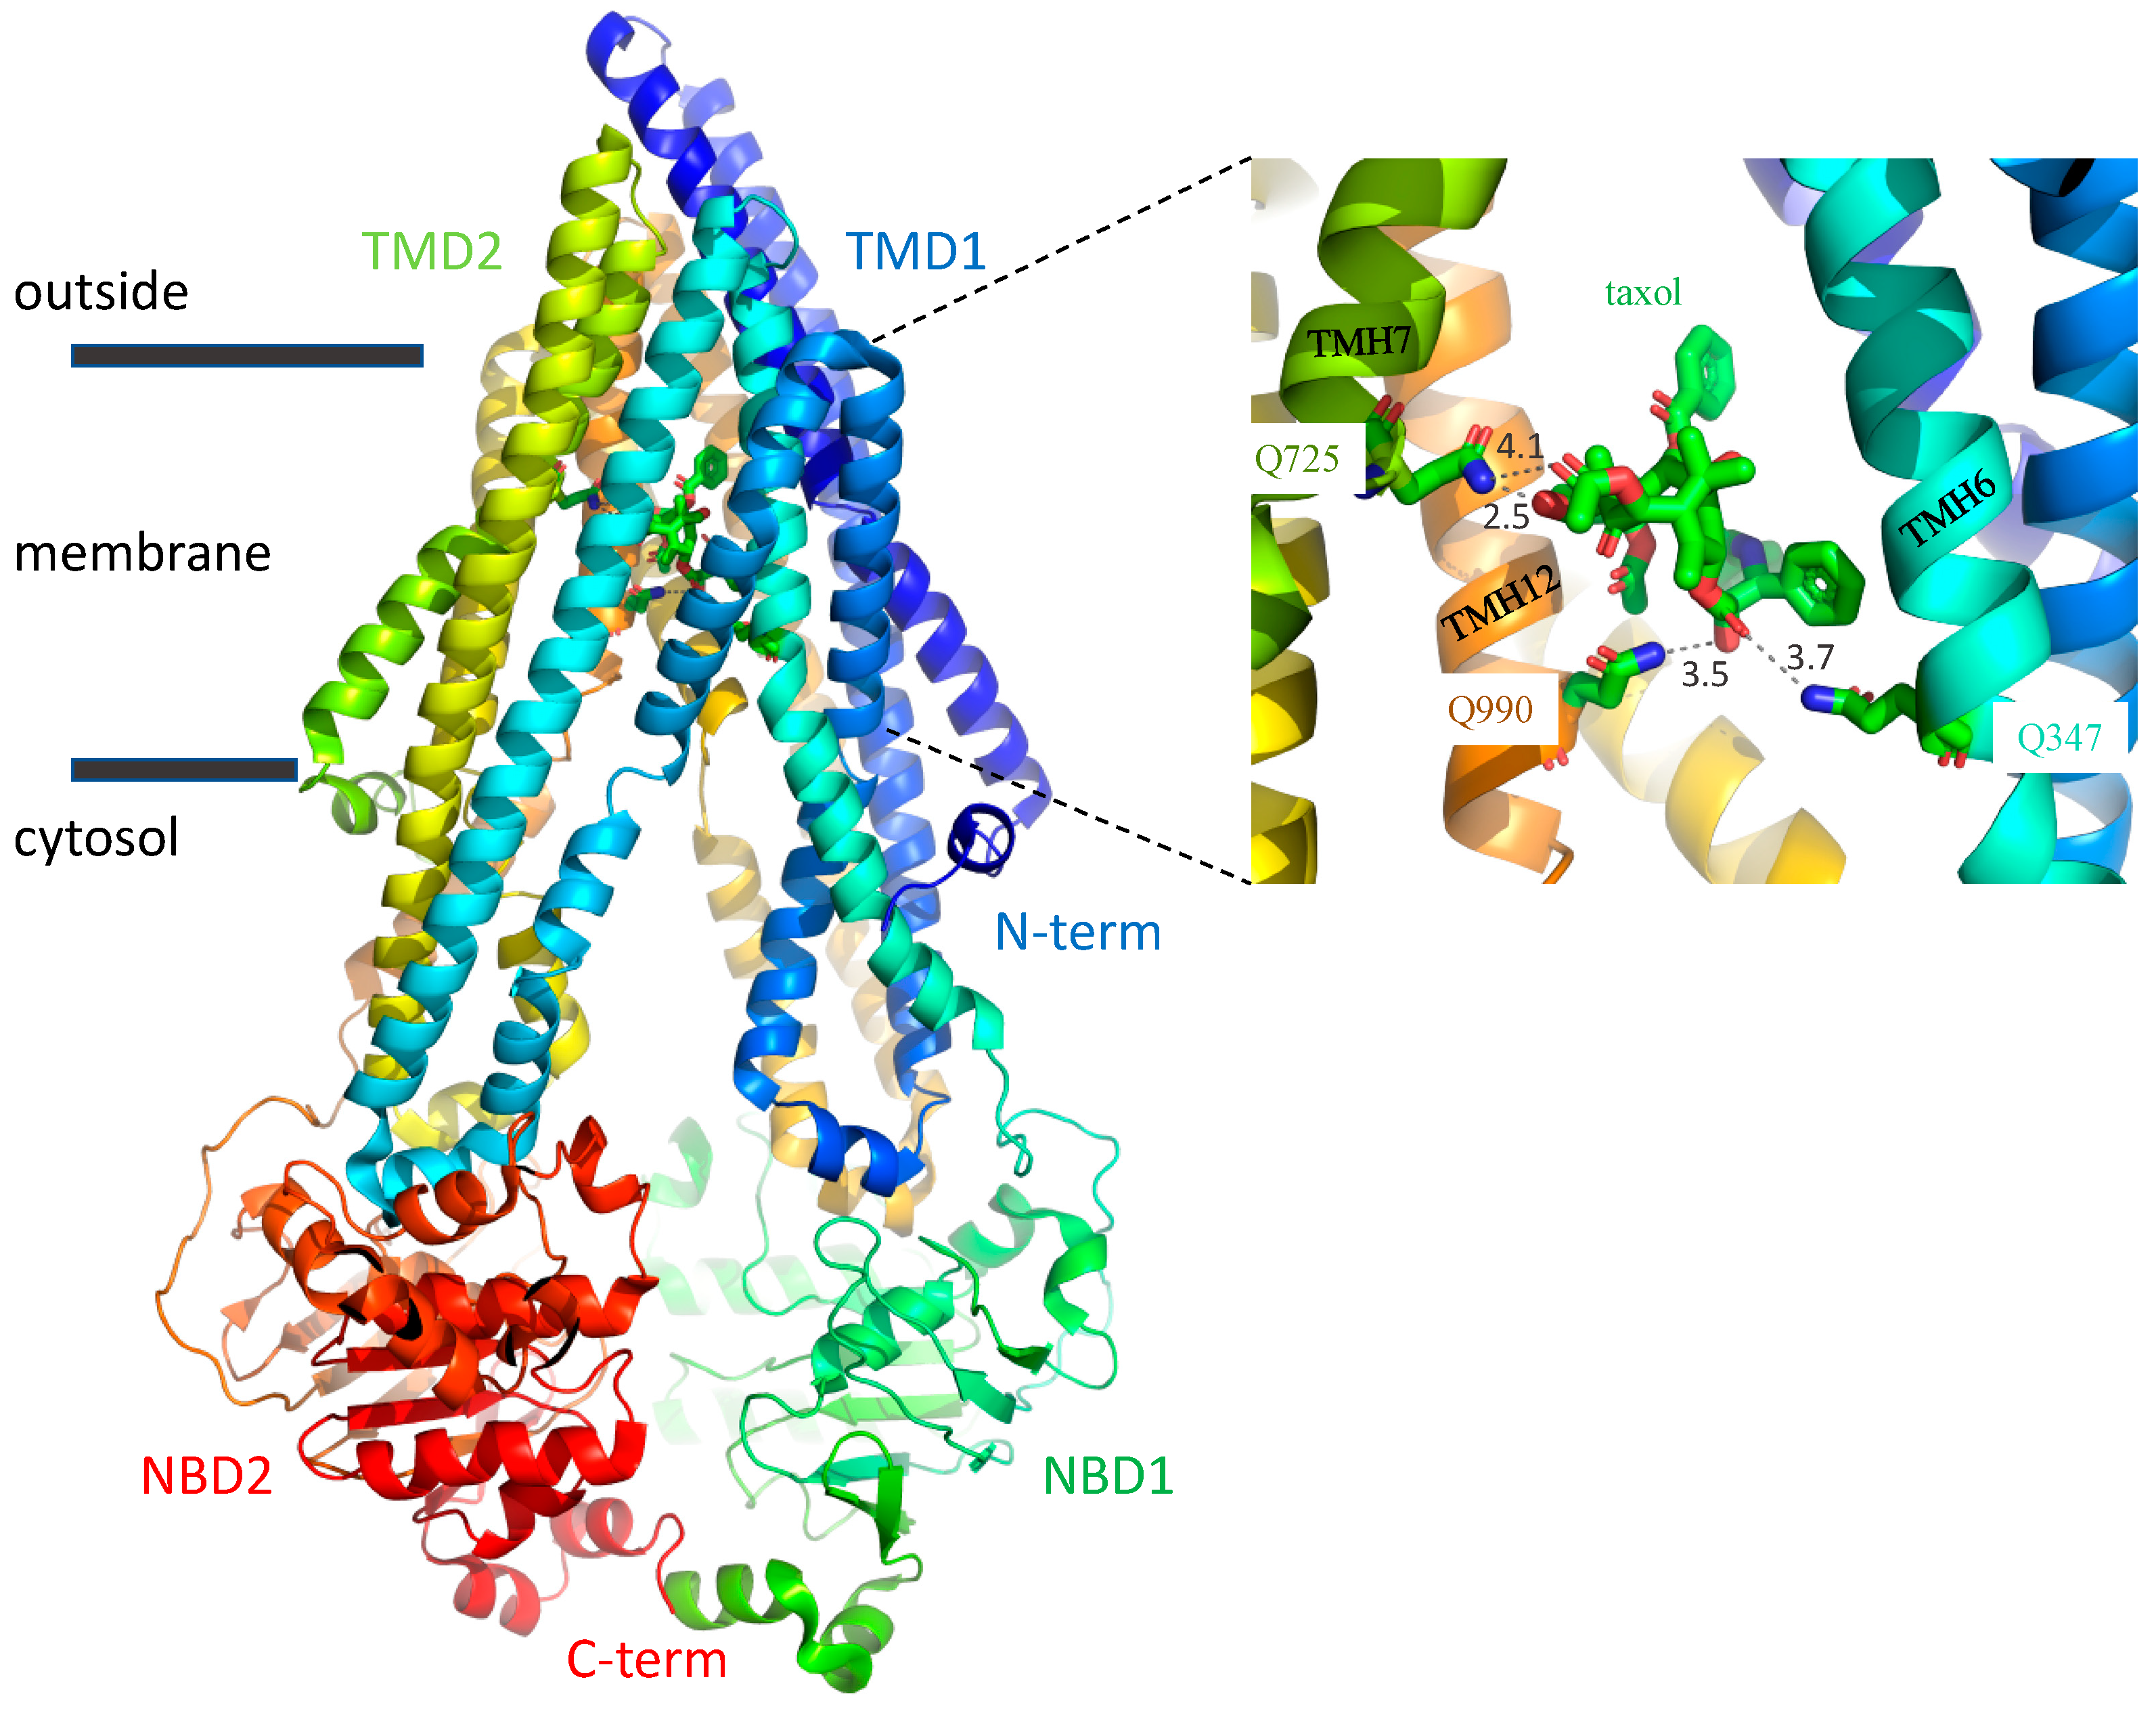
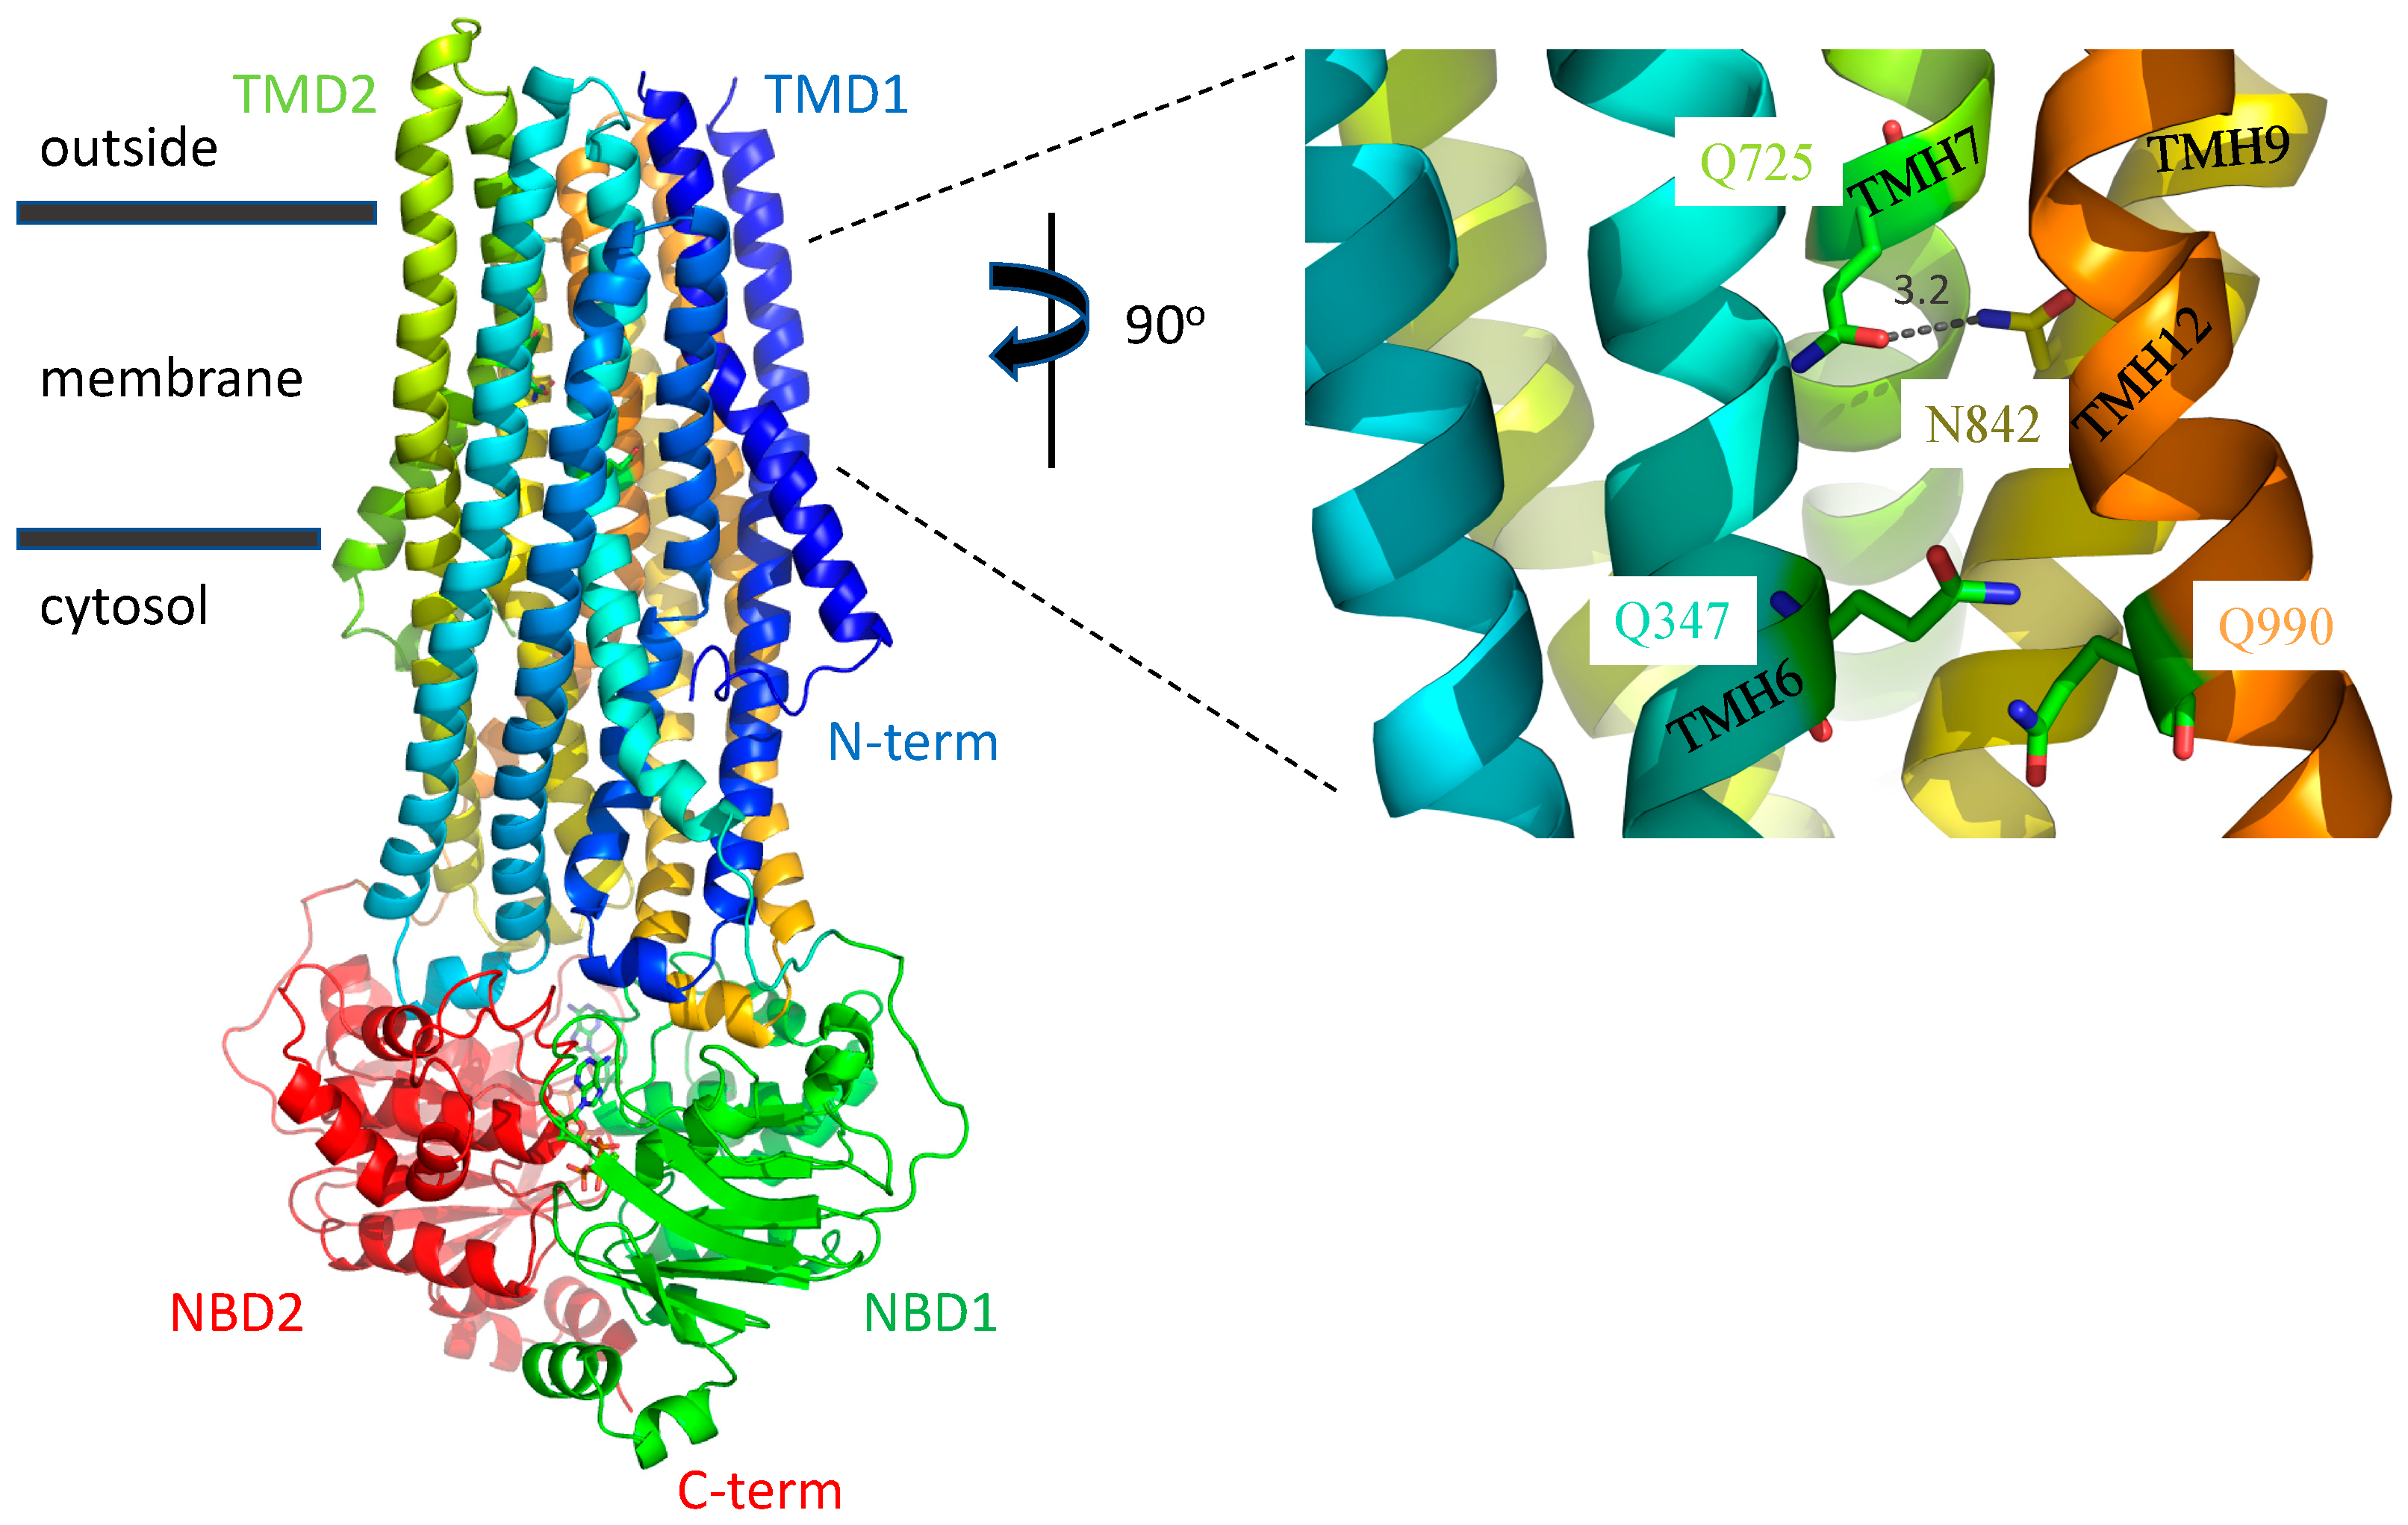
1. Introduction
2. Results
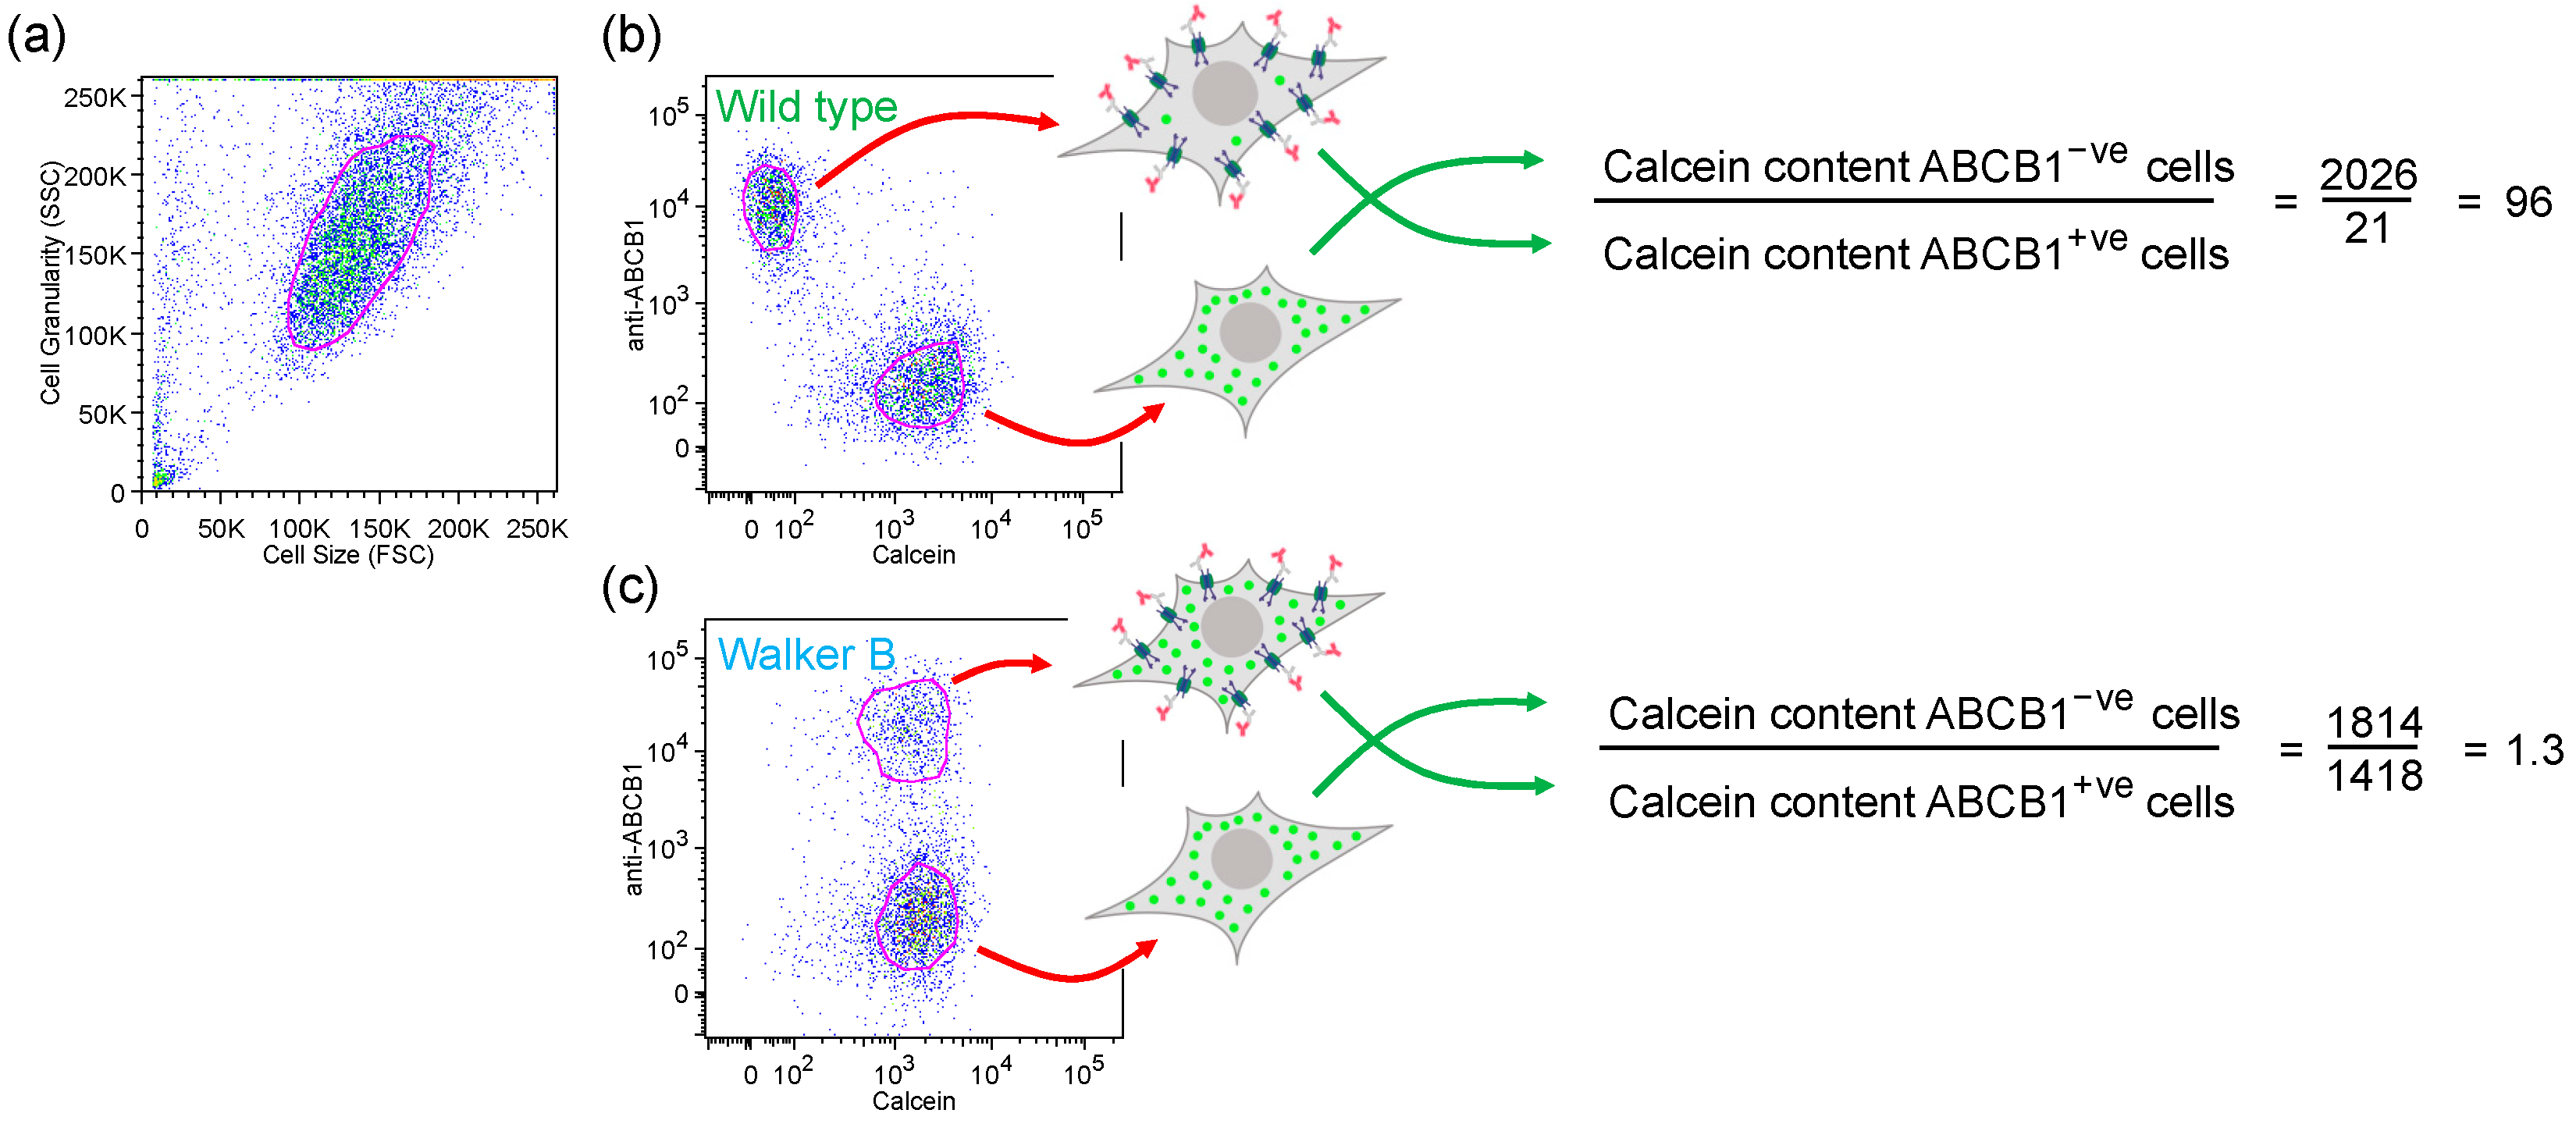
2.1. Endpoint Two-Colour Flow Cytometry Assay Measures the Function of ABCB1 in Live Cells
2.2. Gln347, Gln725 and Gln990 Modulate the Transport of the Xanthene Dye Calcein-AM
2.2.1. Of the Single Mutants, Only Q347A Shows a Statistically Significant Reduction in Calcein-AM Transport
2.2.2. Q347A and Q990A Act Synergistically to Reduce the Transport of Calcein-AM
2.2.3. The Q725A Mutation Improves the Efficiency of Transport of Calcein-AM
2.3. Gln347, Gln725 and Gln990 Also Modulate the Transport of the Phenylalkylamine BODIPY-Verapamil
2.3.1. Q725A Improves the Transport of BODIPY-Verapamil in Any Background
2.3.2. Q347A and Q990A Also Act Synergistically to Reduce the Transport of BODIPY-Verapamil
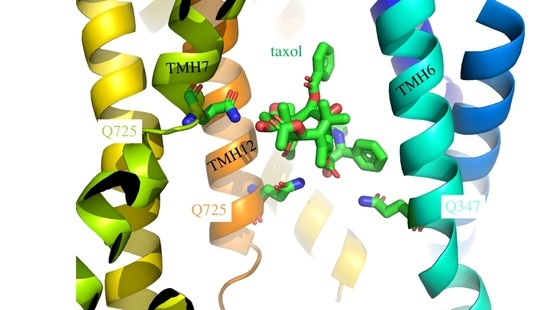
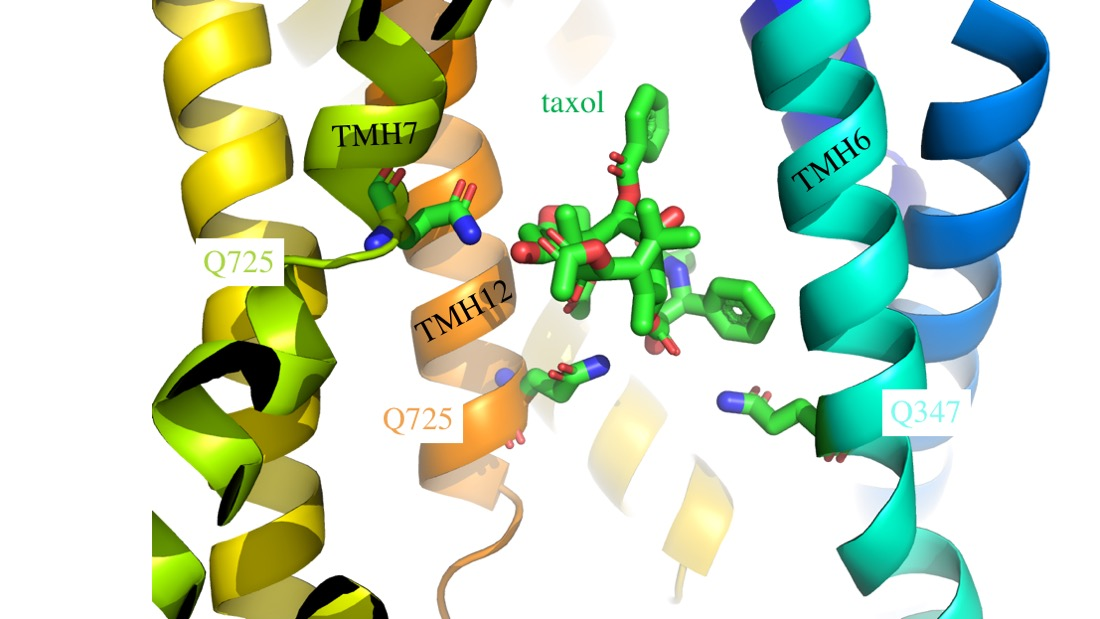
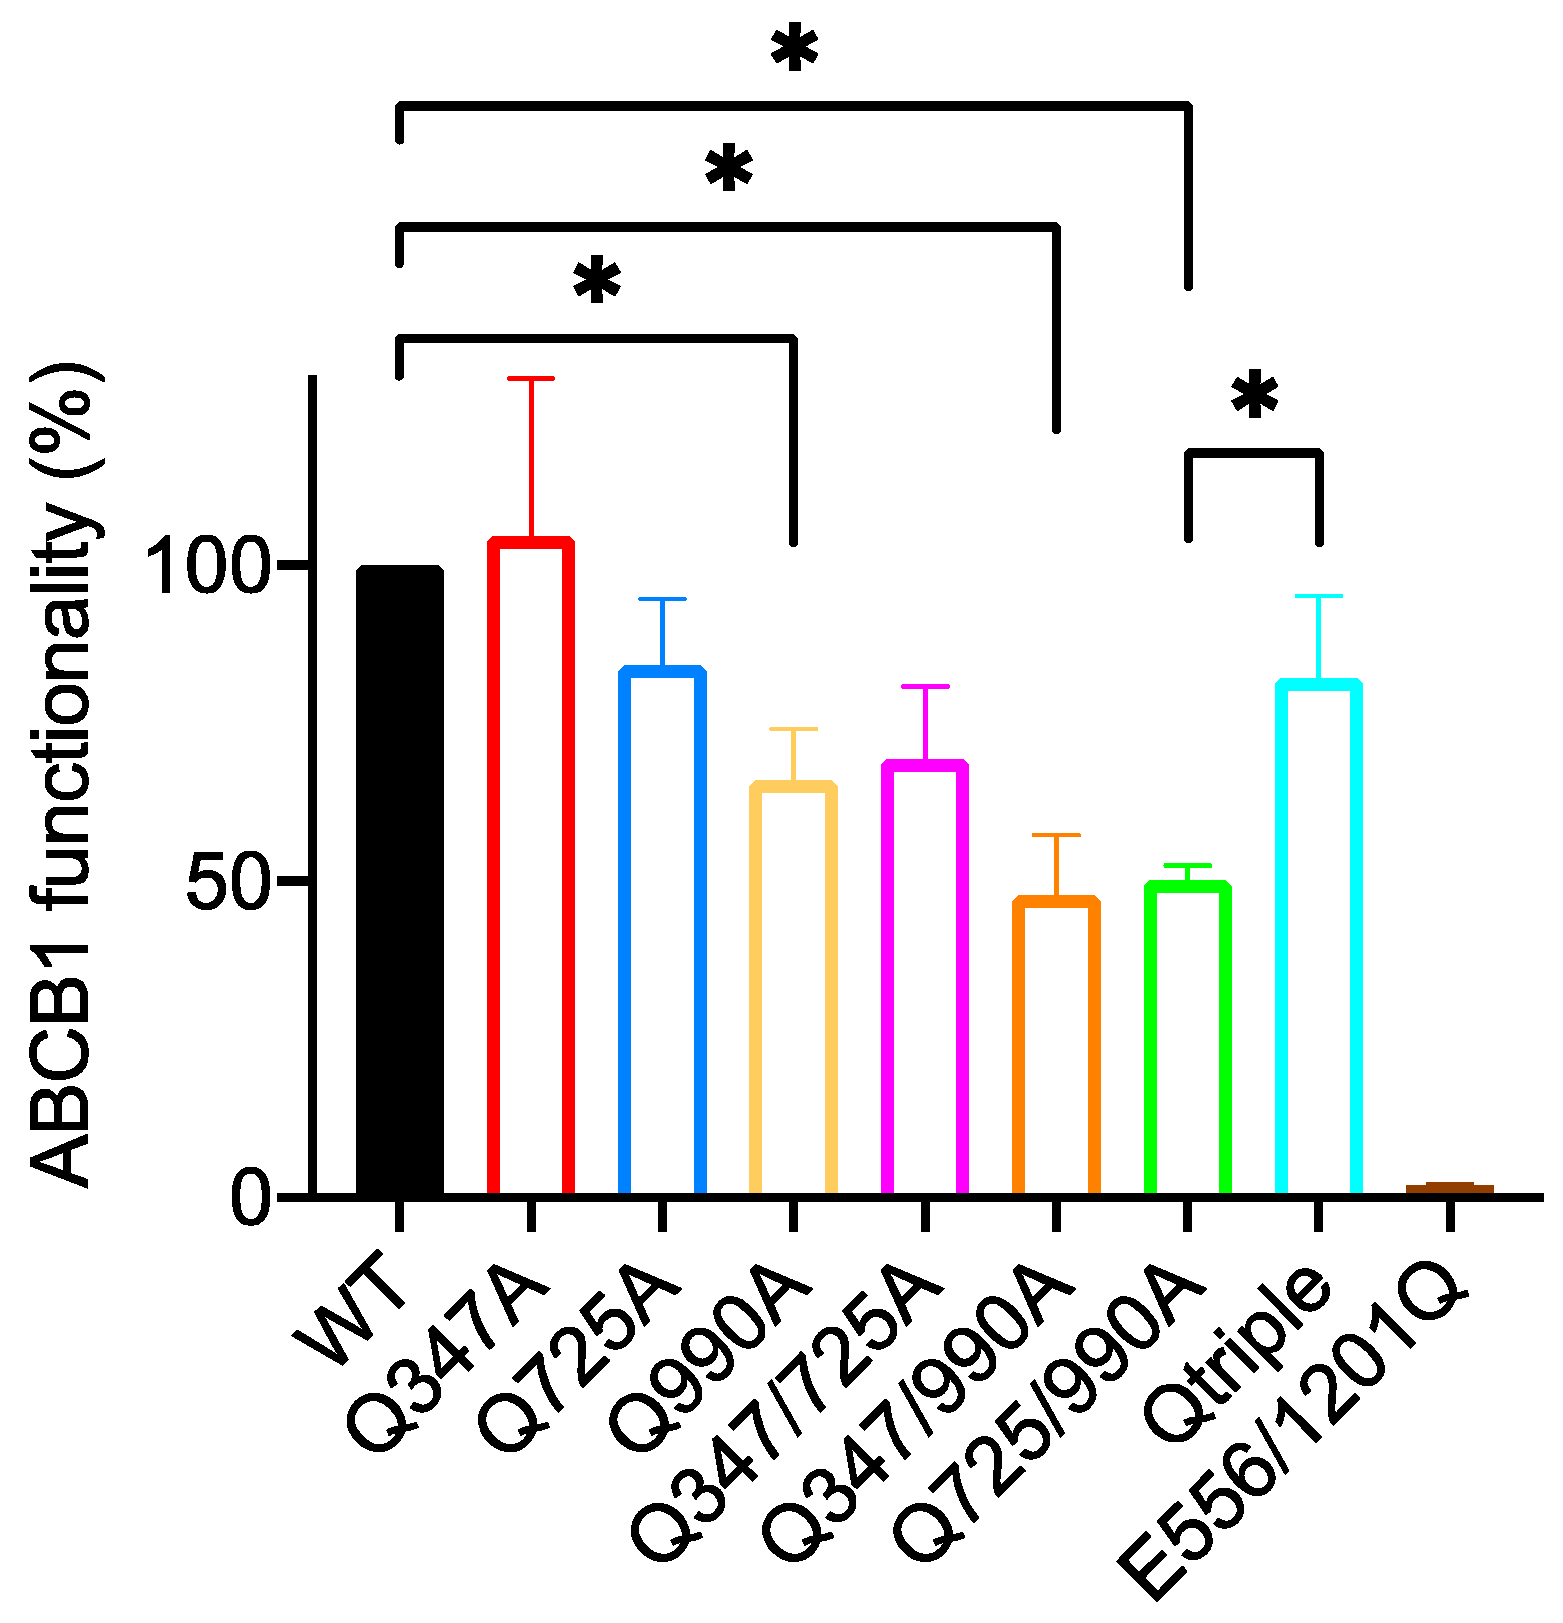
2.4. Gln347, Gln725 and Gln990 Have a More Limited Effect on the Transport of the Taxane Diterpenoid Derivative OG-Taxol
2.4.1. Of the Single Mutants Only Q990A Appears to Reduce the Transport of OG-Taxol
2.4.2. The Double Mutants Q347/990A and Q725/990A Reduce the Transport Activity Further but the Triple Mutant Restores Wild-Type Levels of OG-Taxol Transport
2.4.3. There Is No Indication That Gln725 Is Inhibitory for the Transport of OG-Taxol
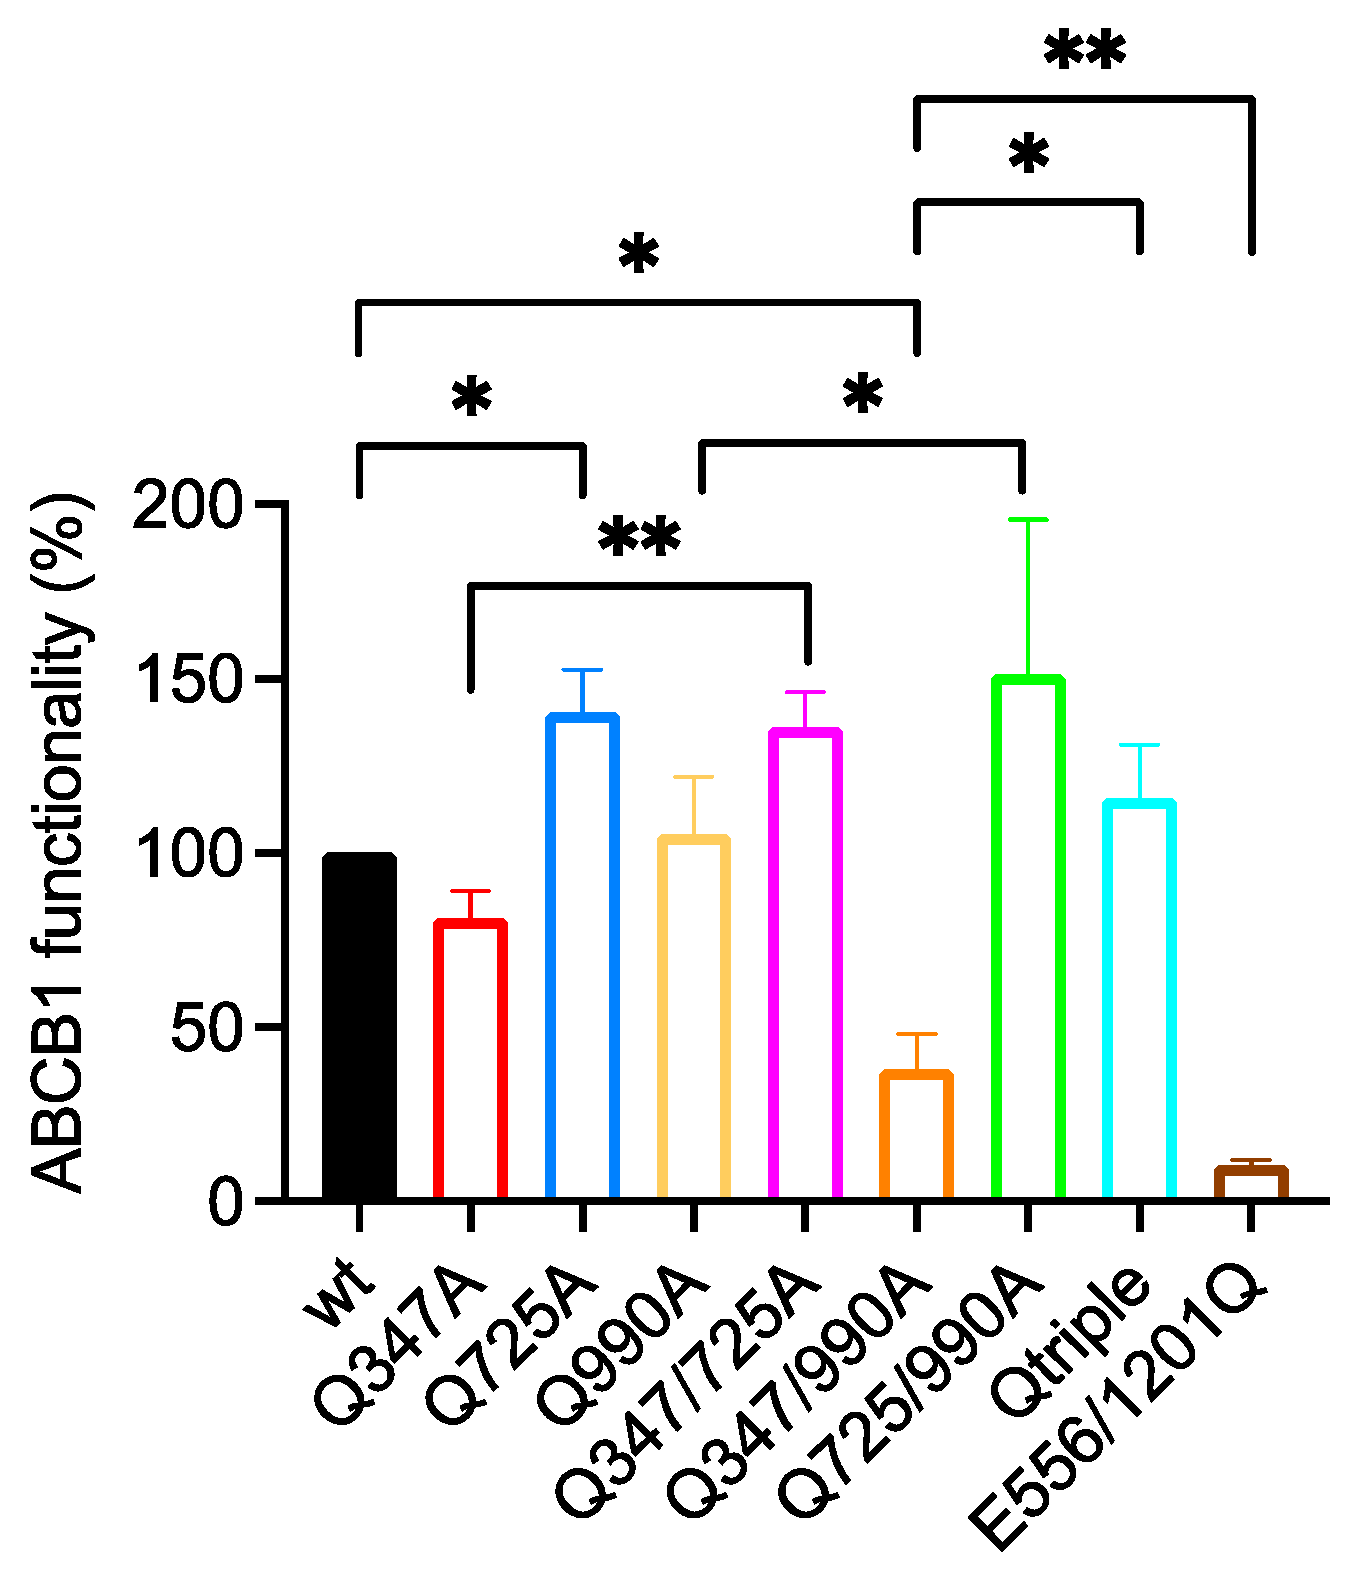
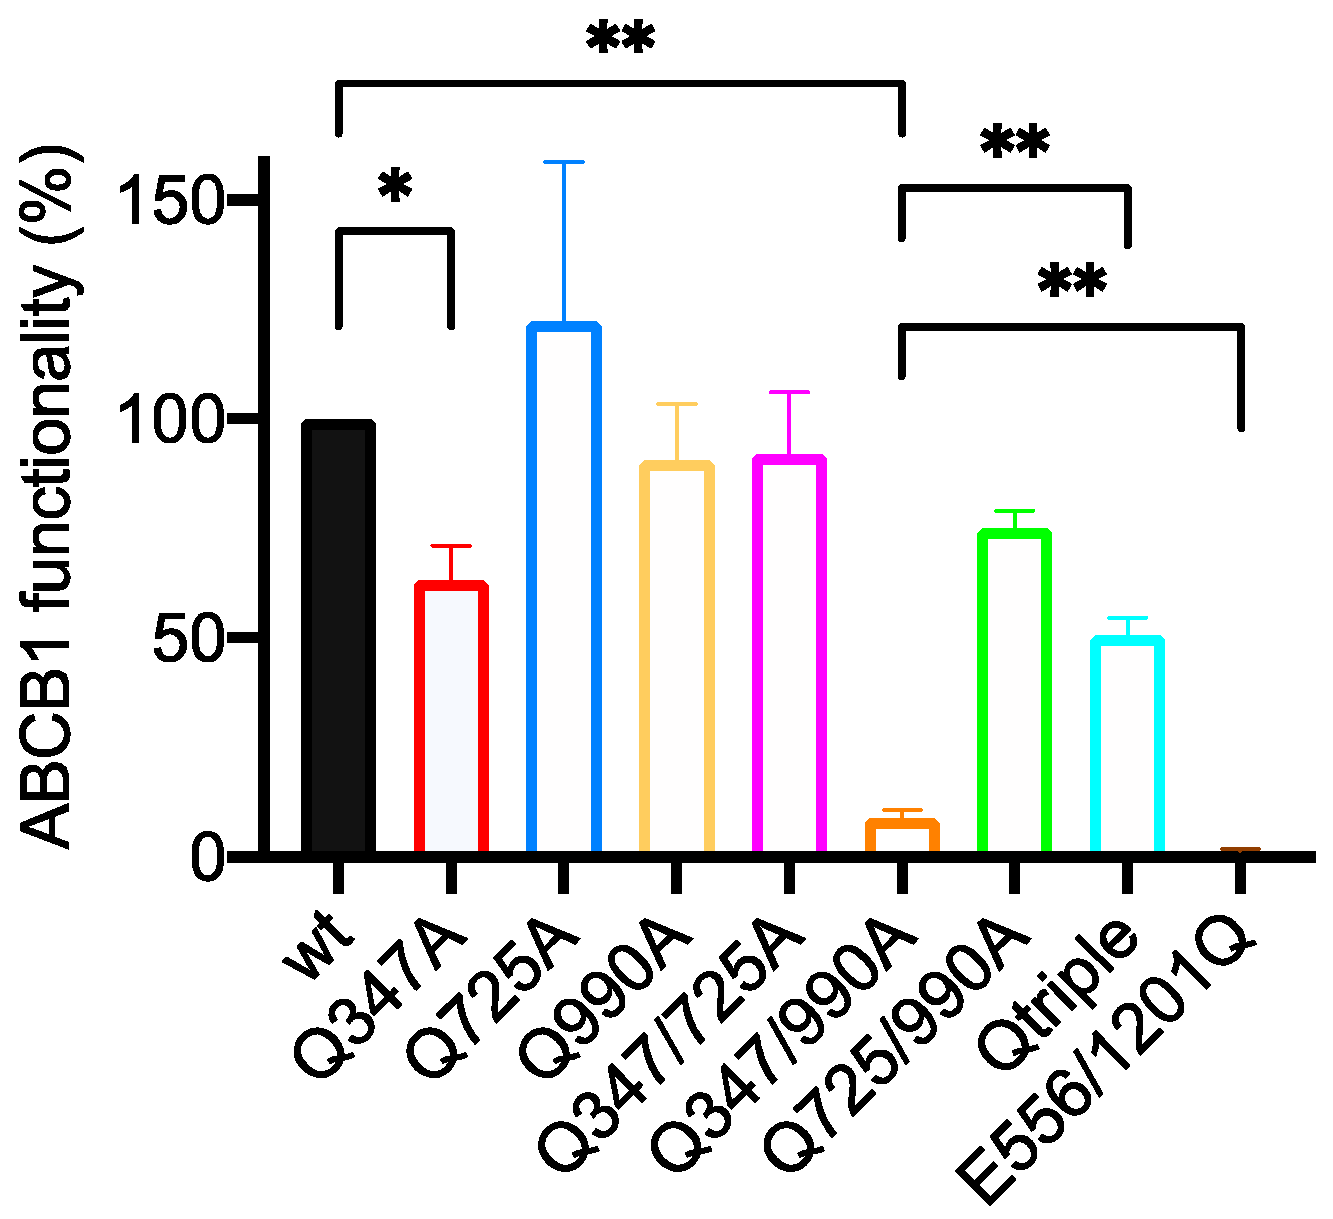
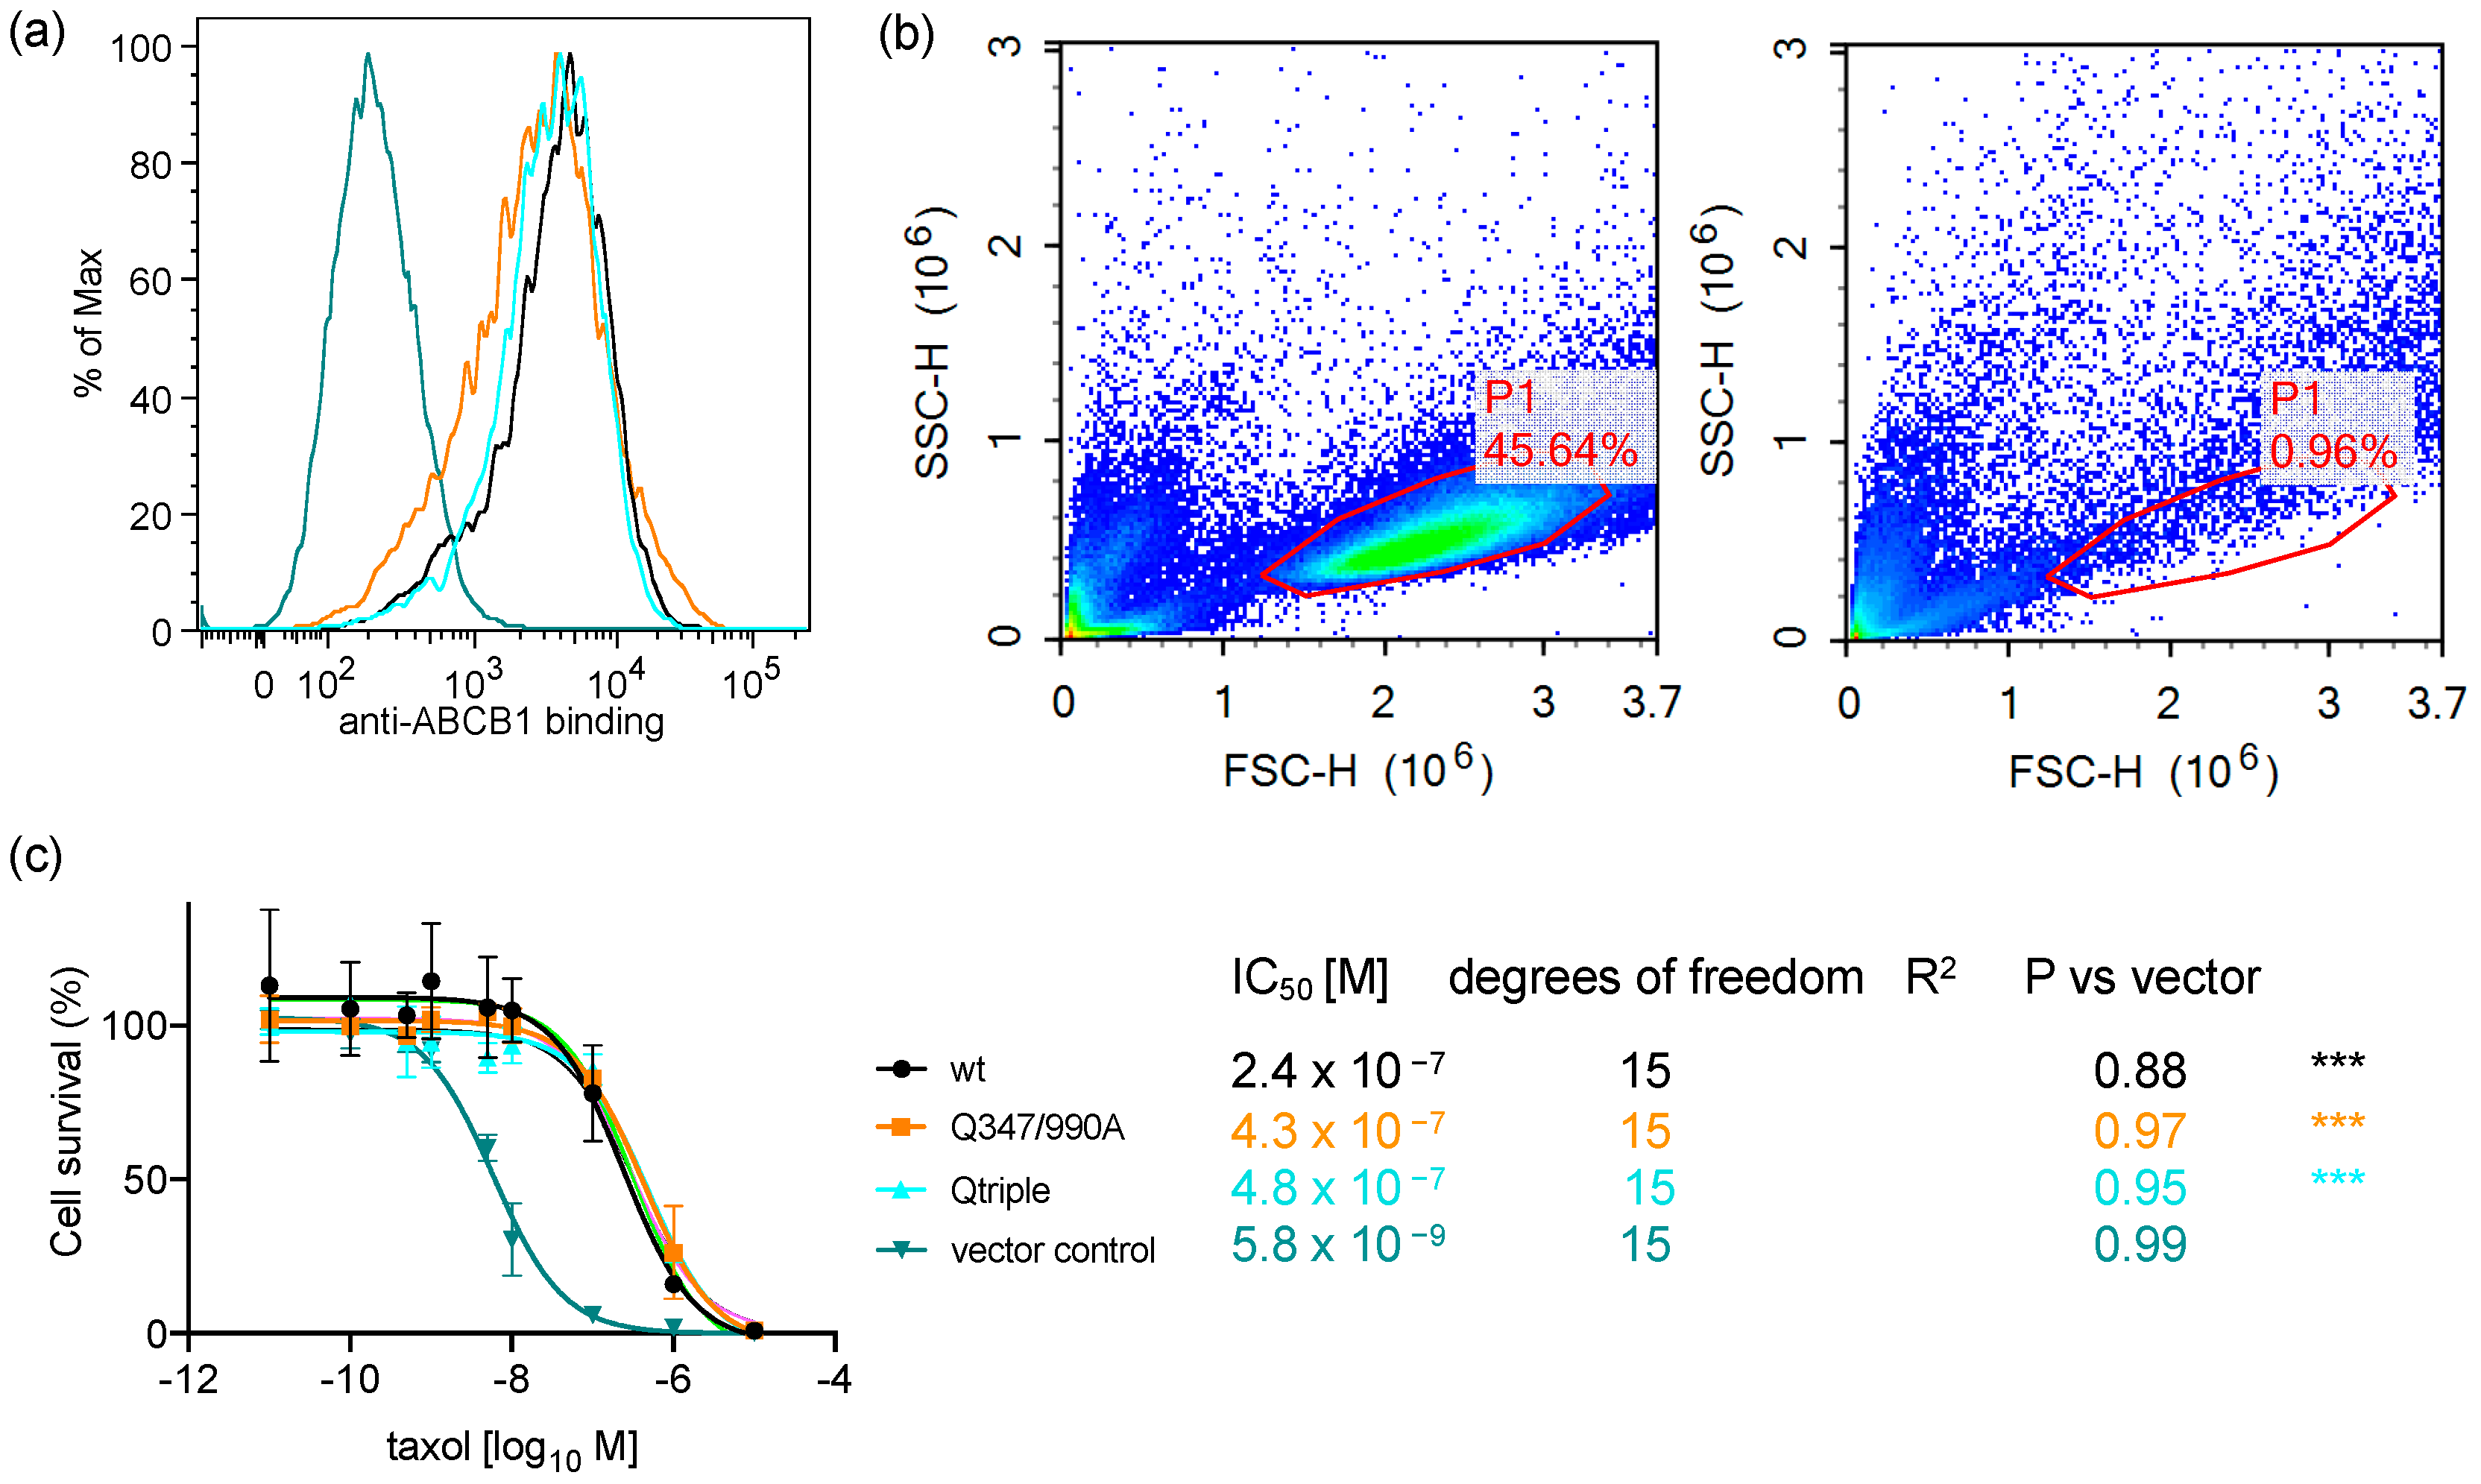
2.5. The Q347/990A and the Qtriple Mutant Are Indistinguishable from the Wild-Type Transporter in Conferring Taxol Resistance to Cells in Culture
3. Discussion
3.1. A Possible Allosteric Explanation for the Increased Transport Activity of Q725A
3.2. Induced Fit of the TMDs around the Transport Substrate Likely Explains the Lack of Importance of Gln347, Gln725 and Gln990 in Conferring Resistance to Taxol
4. Materials and Methods
4.1. Site-Directed Mutagenesis
4.2. Transient Expression of ABCB1
4.3. Drug Transport Assay
4.4. Stable Expression of ABCB1 in HEK293 Flp-in Cells
4.5. Taxol Survival Curve
Supplementary Materials
Author Contributions
Funding
Institutional Review Board Statement
Informed Consent Statement
Data Availability Statement
Acknowledgments
Conflicts of Interest
Appendix A

| Wild Type 100% | E556/1201Q 1.3 ± 0.6 | Q347A 63.1 ± 8.0 | Q725A 122.3 ± 36.4 | Q990A 90.7 ± 12.8 | Q347/725A 92.1 ± 14.2 | Q347/990A 8.8 ± 1.8 | Q725/990A 75.1 ± 4.0 | |
|---|---|---|---|---|---|---|---|---|
| E556/1201Q 1.3 ± 0.6 | <0.0001 **** | - | ||||||
| Q347A 63.1 ± 8.0 | 0.0363 * | 0.0061 ** | - | |||||
| Q725A 122.3 ± 36.4 | ns | 0.0379 * | ns | - | ||||
| Q990A 90.7 ± 12.8 | ns | 0.0025 ** | 0.0485 * | ns | - | |||
| Q347/725A 92.1 ± 14.2 | ns | 0.0002 *** | ns | ns | ns | - | ||
| Q347/990A 8.8 ± 1.8 | 0.0097 ** | 0.0024 ** | 0.0025 ** | 0.0358 * | 0.0031 ** | 0.0010 ** | - | |
| Q725/990A 75.1 ± 4.0 | 0.0301 * | 0.0005 *** | ns | ns | ns | ns | 0.0106 * | - |
| Qtriple 50.7 ± 4.0 | 0.0131 * | 0.0031 ** | ns | ns | ns | 0.0296 * | 0.0055 ** | ns |
| Wild Type 100% | E556/1201Q 10.5 ± 1.6 | Q347A 81.4 ± 7.7 | Q725A 140.5 ± 12.3 | Q990A 105.6 ± 16.3 | Q347/725A 136.3 ± 10.0 | Q347/990A 37.9 ± 10.1 | Q725/990A 151.3 ± 44.3 | |
|---|---|---|---|---|---|---|---|---|
| E556/1201Q 10.5 ± 1.6 | <0.0001 **** | - | ||||||
| Q347A 81.4 ± 7.7 | ns | 0.0007 *** | - | |||||
| Q725A 140.5 ± 12.3 | 0.0410 * | <0.0001 **** | 0.0061 ** | - | ||||
| Q990A 105.6 ± 16.3 | ns | 0.0026 ** | ns | ns | - | |||
| Q347/725A 136.3 ± 10.0 | ns | 0.0040 ** | 0.0089 ** | ns | 0.0422 * | - | ||
| Q347/990A 37.9 ± 10.1 | 0.0258 * | 0.0042 ** | ns | 0.0029 ** | ns | ns | - | |
| Q725/990A 151.3 ± 44.3 | ns | 0.0032 ** | 0.0018 ** | 0.0286 * | 0.0182 * | ns | 0.0225 * | - |
| Qtriple 115.7 ± 15.3 | ns | 0.0008 *** | 0.0022 ** | ns | ns | ns | 0.0300 * | ns |
| Wild Type 100 % | E556/1201Q 2.0 ± 0.2 | Q347A 104 ± 25 | Q725A 84 ± 10 | Q990A 66 ± 8 | Q347/725A 69 ± 11 | Q347/990A 48 ± 9 | Q725/990A 50 ± 2 | |
|---|---|---|---|---|---|---|---|---|
| E556/1201Q 2.0 ± 0.2 | 0.0075 ** | - | ||||||
| Q347A 104 ± 25 | ns | 0.0148 * | - | |||||
| Q725A 84 ± 10 | ns | 0.0032 ** | ns | - | ||||
| Q990A 66 ± 8 | 0.0467 * | 0.0034 ** | ns | ns | - | |||
| Q347/725A 69 ± 11 | ns | 0.0003 *** | ns | ns | ns | - | ||
| Q347/990A 48 ± 9 | 0.0184 * | 0.0001 *** | ns | ns | ns | 0.0292 * | - | |
| Q725/990A 50 ± 2 | 0.0290 * | 0.028 * | 0.0203 * | 0.0305 * | ns | 0.0234 * | ns | - |
| Qtriple 82 ± 13 | ns | 0.0231 * | ns | ns | ns | ns | ns | 0.027 * |
References
- Robey, R.W.; Pluchino, K.M.; Hall, M.D.; Fojo, A.T.; Bates, S.E.; Gottesman, M.M. Revisiting the role of ABC transporters in multidrug-resistant cancer. Nat. Rev. Cancer 2018, 18, 452–464. [Google Scholar] [CrossRef]
- Gottesman, M.M. Mechanisms of cancer drug resistance. Annu. Rev. Med. 2002, 53, 615–627. [Google Scholar] [CrossRef] [Green Version]
- Maloney, S.M.; Hoover, C.A.; Morejon-Lasso, L.V.; Prosperi, J.R. Mechanisms of Taxane Resistance. Cancers 2020, 12, 3323. [Google Scholar] [CrossRef]
- Gottesman, M.M.; Pastan, I.H. The Role of Multidrug Resistance Efflux Pumps in Cancer: Revisiting a JNCI Publication Exploring Expression of the MDR1 (P-glycoprotein) Gene. J. Natl. Cancer Inst. 2015, 107, djv222. [Google Scholar] [CrossRef] [Green Version]
- Nigam, S.K. What do drug transporters really do? Nat. Rev. Drug. Discov. 2015, 14, 29–44. [Google Scholar] [CrossRef] [Green Version]
- Alam, A.; Kowal, J.; Broude, E.; Roninson, I.; Locher, K.P. Structural insight into substrate and inhibitor discrimination by human P-glycoprotein. Science 2019, 363, 753–756. [Google Scholar] [CrossRef] [Green Version]
- Seelig, A. A general pattern for substrate recognition by P-glycoprotein. Eur. J. Biochem. 1998, 251, 252–261. [Google Scholar] [CrossRef]
- Seelig, A.; Blatter, X.L.; Wohnsland, F. Substrate recognition by P-glycoprotein and the multidrug resistance-associated protein MRP1: A comparison. Int. J. Clin. Pharmacol. Ther. 2000, 38, 111–121. [Google Scholar] [CrossRef]
- Seelig, A.; Landwojtowicz, E. Structure-activity relationship of P-glycoprotein substrates and modifiers. Eur. J. Pharm. Sci. 2000, 12, 31–40. [Google Scholar] [CrossRef]
- Zolnerciks, J.K.; Wooding, C.; Linton, K.J. Evidence for a Sav1866-like architecture for the human multidrug transporter P-glycoprotein. Faseb. J. 2007, 21, 3937–3948. [Google Scholar] [CrossRef]
- Shapiro, A.B.; Ling, V. Extraction of Hoechst 33342 from the cytoplasmic leaflet of the plasma membrane by P-glycoprotein. Eur. J. Biochem. 1997, 250, 122–129. [Google Scholar] [CrossRef] [Green Version]
- Mora Lagares, L.; Minovski, N.; Novic, M. Multiclass Classifier for P-Glycoprotein Substrates, Inhibitors, and Non-Active Compounds. Molecules 2019, 24, 2006. [Google Scholar] [CrossRef] [PubMed] [Green Version]
- Loo, T.W.; Bartlett, M.C.; Clarke, D.M. Transmembrane segment 7 of human P-glycoprotein forms part of the drug-binding pocket. Biochem. J. 2006, 399, 351–359. [Google Scholar] [CrossRef]
- Kim, Y.; Chen, J. Molecular structure of human P-glycoprotein in the ATP-bound, outward-facing conformation. Science 2018, 359, 915–919. [Google Scholar] [CrossRef] [Green Version]
- Higgins, C.F.; Linton, K.J. The ATP switch model for ABC transporters. Nat. Struct. Mol. Biol. 2004, 11, 918–926. [Google Scholar] [CrossRef]
- Thomas, C.; Tampe, R. Structural and Mechanistic Principles of ABC Transporters. Annu. Rev. Biochem. 2020, 89, 605–636. [Google Scholar] [CrossRef] [PubMed]
- Raviv, Y.; Pollard, H.B.; Bruggemann, E.P.; Pastan, I.; Gottesman, M.M. Photosensitized labeling of a functional multidrug transporter in living drug-resistant tumor cells. J. Biol. Chem. 1990, 265, 3975–3980. [Google Scholar] [CrossRef]
- Nosol, K.; Romane, K.; Irobalieva, R.N.; Alam, A.; Kowal, J.; Fujita, N.; Locher, K.P. Cryo-EM structures reveal distinct mechanisms of inhibition of the human multidrug transporter ABCB1. Proc. Natl. Acad. Sci. USA 2020, 117, 26245–26253. [Google Scholar] [CrossRef]
- Loo, T.W.; Bartlett, M.C.; Clarke, D.M. Substrate-induced conformational changes in the transmembrane segments of human P-glycoprotein. Direct evidence for the substrate-induced fit mechanism for drug binding. J. Biol. Chem. 2003, 278, 13603–13606. [Google Scholar] [CrossRef] [Green Version]
- Akkaya, B.G.; Zolnerciks, J.K.; Ritchie, T.K.; Bauer, B.; Hartz, A.M.; Sullivan, J.A.; Linton, K.J. The multidrug resistance pump ABCB1 is a substrate for the ubiquitin ligase NEDD4-1. Mol. Membr. Biol. 2015, 32, 39–45. [Google Scholar] [CrossRef] [PubMed] [Green Version]
- Zolnerciks, J.K.; Akkaya, B.G.; Snippe, M.; Chiba, P.; Seelig, A.; Linton, K.J. The Q loops of the human multidrug resistance transporter ABCB1 are necessary to couple drug binding to the ATP catalytic cycle. Faseb. J. 2014, 28, 4335–4346. [Google Scholar] [CrossRef] [PubMed] [Green Version]
- Tombline, G.; Bartholomew, L.A.; Urbatsch, I.L.; Senior, A.E. Combined mutation of catalytic glutamate residues in the two nucleotide binding domains of P-glycoprotein generates a conformation that binds ATP and ADP tightly. J. Biol. Chem. 2004, 279, 31212–31220. [Google Scholar] [CrossRef] [PubMed] [Green Version]


| Q347A | |
|---|---|
| Forward | 5′-ttaattggggcttttagtgttggagcggcatctccaagcat-3′ |
| Reverse | 5′-atgcttggagatgccgctccaacactaaaagccccaattaa-3′ |
| Q725A | |
| Forward | 5′-gtgccattataaatggaggcctggcaccagcatttgcaataatatttt-3′ |
| Reverse | 5′-aaaatattattgcaaatgctggtgccaggcctccatttataatggcac-3′ |
| Q990A | |
| Forward | 5′-gccatggccgtgggggcagtcagttcatttgc-3′ |
| Reverse | 5′-gcaaatgaactgactgcccccacggccatggc-3′ |
Publisher’s Note: MDPI stays neutral with regard to jurisdictional claims in published maps and institutional affiliations. |
© 2021 by the authors. Licensee MDPI, Basel, Switzerland. This article is an open access article distributed under the terms and conditions of the Creative Commons Attribution (CC BY) license (https://creativecommons.org/licenses/by/4.0/).
Share and Cite
Sasitharan, K.; Iqbal, H.A.; Bifsa, F.; Olszewska, A.; Linton, K.J. ABCB1 Does Not Require the Side-Chain Hydrogen-Bond Donors Gln347, Gln725, Gln990 to Confer Cellular Resistance to the Anticancer Drug Taxol. Int. J. Mol. Sci. 2021, 22, 8561. https://doi.org/10.3390/ijms22168561
Sasitharan K, Iqbal HA, Bifsa F, Olszewska A, Linton KJ. ABCB1 Does Not Require the Side-Chain Hydrogen-Bond Donors Gln347, Gln725, Gln990 to Confer Cellular Resistance to the Anticancer Drug Taxol. International Journal of Molecular Sciences. 2021; 22(16):8561. https://doi.org/10.3390/ijms22168561
Chicago/Turabian StyleSasitharan, Keerthana, Hamzah Asad Iqbal, Foteini Bifsa, Aleksandra Olszewska, and Kenneth J. Linton. 2021. "ABCB1 Does Not Require the Side-Chain Hydrogen-Bond Donors Gln347, Gln725, Gln990 to Confer Cellular Resistance to the Anticancer Drug Taxol" International Journal of Molecular Sciences 22, no. 16: 8561. https://doi.org/10.3390/ijms22168561
APA StyleSasitharan, K., Iqbal, H. A., Bifsa, F., Olszewska, A., & Linton, K. J. (2021). ABCB1 Does Not Require the Side-Chain Hydrogen-Bond Donors Gln347, Gln725, Gln990 to Confer Cellular Resistance to the Anticancer Drug Taxol. International Journal of Molecular Sciences, 22(16), 8561. https://doi.org/10.3390/ijms22168561