Article

A Fork Trap in the Chromosomal Termination Area Is Highly Conserved across All Escherichia coli Phylogenetic Groups

by
Daniel J. Goodall
1,
Katie H. Jameson
2,
Michelle Hawkins
2 and
Christian J. Rudolph
1,*
1
Division of Biosciences, College of Health, Medicine and Life Sciences, Brunel University London, Uxbridge UB8 3PH, UK
2
Department of Biology, University of York, Wentworth Way, York YO10 5DD, UK
*
Author to whom correspondence should be addressed.
Int. J. Mol. Sci. 2021, 22(15), 7928; https://doi.org/10.3390/ijms22157928
Submission received: 25 June 2021 / Revised: 21 July 2021 / Accepted: 22 July 2021 / Published: 25 July 2021
(This article belongs to the Special Issue DNA Dynamics)

Abstract

:
Termination of DNA replication, the final stage of genome duplication, is surprisingly complex, and failures to bring DNA synthesis to an accurate conclusion can impact genome stability and cell viability. In Escherichia coli, termination takes place in a specialised termination area opposite the origin. A ‘replication fork trap’ is formed by unidirectional fork barriers via the binding of Tus protein to genomic ter sites. Such a fork trap system is found in some bacterial species, but it appears not to be a general feature of bacterial chromosomes. The biochemical properties of fork trap systems have been extensively characterised, but little is known about their precise physiological roles. In this study, we compare locations and distributions of ter terminator sites in E. coli genomes across all phylogenetic groups, including Shigella. Our analysis shows that all ter sites are highly conserved in E. coli, with slightly more variability in the Shigella genomes. Our sequence analysis of ter sites and Tus proteins shows that the fork trap is likely to be active in all strains investigated. In addition, our analysis shows that the dif chromosome dimer resolution site is consistently located between the innermost ter sites, even if rearrangements have changed the location of the innermost termination area. Our data further support the idea that the replication fork trap has an important physiological role that provides an evolutionary advantage.

Graphical Abstract

1. Introduction

In all domains of life, chromosome duplication initiates at origins of replication by the assembly of two multi-subunit ‘replisomes’. These replisome–DNA replication fork complexes (called ‘replication forks’ from here onwards for simplicity) move in opposite directions until they either merge with another replication fork or reach a chromosome end [1,2,3]. In bacteria, the number of fork fusions is restricted by the overall chromosomal architecture. The majority of bacteria carry a single circular chromosome that is replicated from a single origin called oriC. Bacterial chromosomes are therefore replicated by two replication forks, each duplicating one chromosomal half or ‘replichore’ [3,4,5].
In addition to the replichore structure, the Escherichia coli chromosome is further structured into four macrodomains, which are called Ori, Ter, Left and Right, as well as two more flexible and non-structured regions called NS-Left (NS-L) and NS-Right (NS-R), which flank the Ori macrodomain (Figure 1A) [6,7,8]. DNA replication is completed once the two replication forks merge opposite oriC in the terminus area of the chromosome, which is located in the Ter macrodomain. The main protein involved in the organisation of the Ter macrodomain is the DNA-binding protein MatP, which binds to matS sequences located in the Ter domain [9]. MatP is also involved in linking the Ter macrodomain to the Z-ring involved in septation [10].
Besides matS, additional genetic elements involved in the final stages of the cell cycle are located in the origin-distal half of the chromosome. For example, FtsK-Orienting Polar Sequences (KOPS) are found in a wide variety of bacterial species and direct FtsK DNA translocase towards the terminus region, where it plays an important role in chromosome segregation [11,12]. In addition, FtsK is required for the resolution of chromosomal dimers, which can form as a consequence of an odd number of recombination events. FtsK controls a site-specific recombination system that resolves chromosomal dimers via the dif chromosome dimer resolution site and the site-specific XerCD recombinase [11,12,13,14].
In E. coli, the chromosomal terminus area also contains a specialised ‘replication fork trap’ (Figure 1A). This system is generated by a series of polar blocks, which allow replisomes to pass in one direction, but block replisome progression in the other [16]. Ten non-palindromic ter sequences (terA–J) are symmetrically located either side of the terminus area of the chromosome (Figure 1A). If a 23 bp ter site is bound by Tus terminator protein, a polar block is generated (Figure 1B) due to the asymmetric binding of Tus [15,17]. In E. coli K-12, each replisome will replicate through the first five ter sites it encounters in the permissive direction by displacing Tus protein. However, the replisome will be paused by the first ter/Tus complex encountered in the non-permissive orientation on the other side of the termination area [3,5,15,16]. Forks are paused at ter/Tus complexes for a considerable period [18,19]. Indeed, in cells in which the replichore arrangement is skewed due to the presence of a second ectopic replication origin, which forces forks to be arrested at ter/Tus complexes every single cell cycle, very little indication is seen that forks proceed past the first ter/Tus complex encountered on a regular basis [3,20]. However, ter/Tus complexes can be overcome if forks are stalled for long periods of time [18,21], and it was suggested that the multiple ter sites introduce a level of redundancy, so that if a fork overcomes a ter/Tus complex, proceeding synthesis is arrested again at the next ter/Tus complex, in line with a reduced number of forks at the second ter sites B and D [15].
The fork trap system dictates that fork fusions take place between the innermost ter sites (terA and C in E. coli). However, in normally growing cells, the majority of fusions typically occur away from ter/Tus complexes, as demonstrated by labelling experiments [22], and, more recently, by marker frequency analysis produced by Whole Genome Sequencing (WGS) [23].
Recent analysis illustrated that replication fork traps are a specialised feature of a relatively small group of bacteria. They can be found in most Enterobacteriales, the Pseudoalteromonas and most Aeromonadales [24]. A similar fork trap system has been demonstrated to operate in the Gram-positive Bacillus subtilis. However, while working in a similar fashion, this fork trap system shows no significant sequence or structural similarity to the fork trap system in the Enterobacteriales, indicating that they have evolved via convergent evolution [16]. Convergent evolution often suggests a particularly important physiological function. However, phenotypes observed in cells in which only the replication fork trap is inactivated are very mild [25,26] unless other mutations are introduced.
In E. coli, the primary ter sites A–J span a significant area of the chromosome (almost 45%) (Figure 1A). In contrast, the fork trap system in B. subtilis is smaller (9.9%). More recently, four additional ter sites, K, L, Y and Z, were identified in E. coli [15]. However, fork pausing efficiencies for these four ter sites were established to be very low, and two of them, terY and terZ, are in fact in the blocking orientation for forks coming from oriC [15]. We will refer to these as secondary ter sites. In E. coli, the most significant levels of blocked forks were found at the four inner-most sites during normal chromosome replication, even though all primary ter sites can block fork progression if bound by Tus [15]. The innermost ter sites A–D therefore form the primary fork trap, which spans ~8% of the chromosome (Figure 1A), an area similar to the B. subtilis termination area. The area between the innermost ter sites A and C where forks will fuse spans approximately 6% of the chromosome.
In their recent study, Galli and co-workers based their conclusions about the presence of a replication fork trap on the presence of the terminator proteins Tus (E. coli) and RTP (B. subtilis) [24]. Here, we have directly investigated the replication fork trap area in a variety of different E. coli strains across all phylogroups, including Shigella, to analyse the variability of the 10 primary and four secondary ter sites. The majority of the past analysis has been conducted in E. coli K12 and, given the mild phenotype of cells lacking Tus, other phylogenetic groups might be expected to show considerable variation in the number and location of ter sites if the inactivation of the replication fork trap does not have a major impact on the cells.
Our analysis shows that all 10 primary ter sites are present in the E. coli genomes analysed, with only Shigella showing some variability. For the majority of ter sites in the various E. coli phylogenetic groups, the inner core matches the consensus sequence derived from the ter sequences in MG1655, strongly indicating that these ter sites are fully functional. We found that for all strains analysed, the dif chromosome dimer resolution site is consistently present next to terC within the innermost termination area. In Shigella, which has arisen multiple independent times from E. coli [27,28], we found some strains where the relative location of dif to the innermost ter sites differs. However, in these strains, specific ter sites are flipped, placing dif again in the innermost termination area. Finally, we extend our analysis to some Salmonella and Klebsiella genomes, showing that a fork trap is likely to be present. The fact that a distinct fork trap area is consistently maintained supports the idea that it provides a distinct evolutionary advantage and highlights the urgent need to establish what its specific physiological function is.

2. Material and Methods

2.1. Strains, Media and General Methods

For Escherichia coli K12 strains used in this study, see Table S1. Strains were constructed via P1vir transductions [29] or by single-step gene disruptions [30]. Luria broth (LB) and agar was modified from Luria and Burrous [31] as follows: 1% tryptone (Bacto™, BD Biosciences, Wokingham, Berkshire, UK), 0.5% yeast extract (Bacto™, BD Biosciences) and 0.05% NaCl (Sigma Aldrich, St Louis, MO, USA). The pH was adjusted to 7.4.

2.2. Growth Curves

Fresh overnight cultures of strains of interest were diluted 100-fold in fresh LB broth and incubated with vigorous aeration at 37 °C until A600 reached 0.48. The culture was then diluted 100-fold in prewarmed fresh broth and grown as before. Samples were taken every 30 min, diluted to 10−7 in M9 minimal medium without added glucose, and 10 μL aliquots of each dilution were immediately dropped onto LB agar plates. For each dilution series, two sets of drops were spotted. Colonies were counted after incubation for 18–24 h at 37 °C. Mean colony numbers from both spots were calculated and a growth curve plotted. A suitable period where growth was exponential was selected (usually between 30 and 180 min following dilution into fresh LB). For calculation of the doubling time, the LINEST function in Microsoft Excel (version 1808) was used to determine linear regression parameters for data points, which were calculated from averages per time point of seven independent experiments.

2.3. Genome Sequences

All Escherichia coli and Shigella genomic sequences were downloaded from the NCBI nucleotide database. Accession numbers for all genome sequences used in this study are included in Tables S2 and S3.

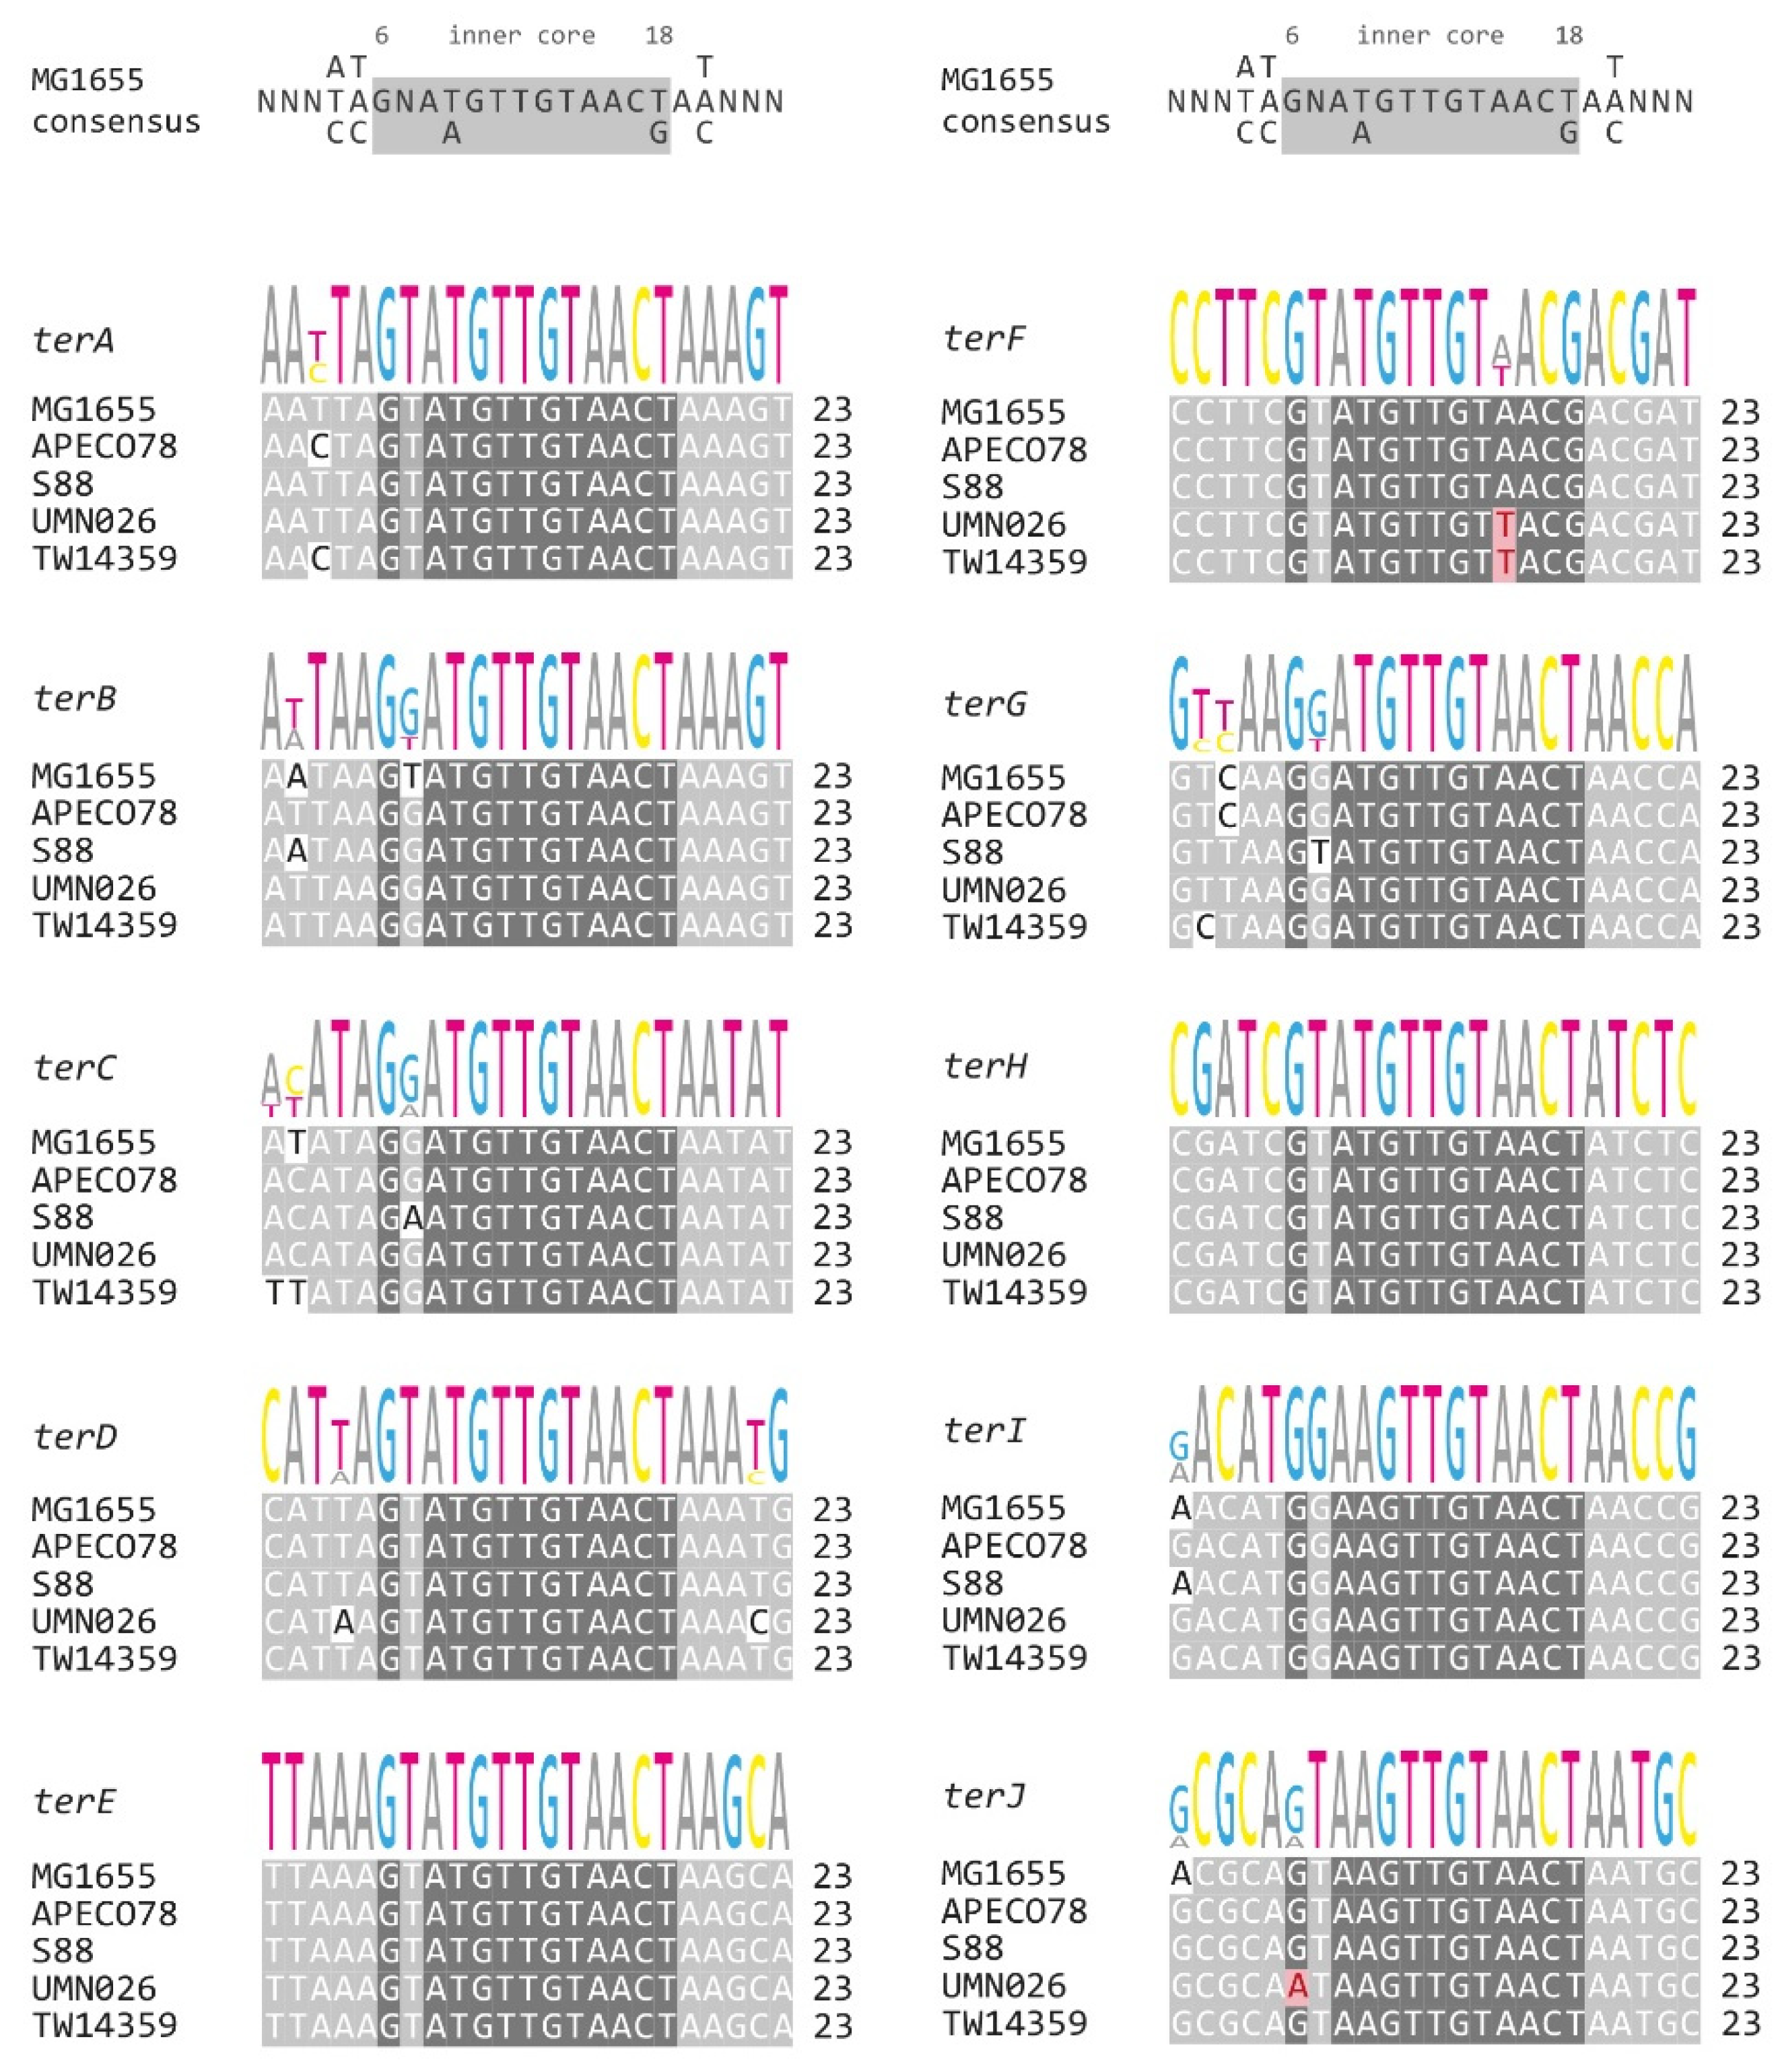
2.4. Alignment of ter Sequences

Concatenated FASTA files for the 17 E. coli genomes (Table S2) and 11 Shigella genomes (Table S3), respectively, were turned into indexes using BOWTIE2 processed with R (version 4.0.3) and the RBowtie2 package (version 1.10.1). FASTQ files containing the 10 primary ter sequences (A–J) were aligned against the index databases, relaxing the maximum penalty to 4 to get a hit for all ter sites. The resulting SAM files were converted into BAM format using the Rsamtools package (version 2.4.0) then cleaned using the Bioconductor package Biostrings (version 2.56.0) and dplyr (version 1.0.5). Using the start positions obtained from BOWTIE2, the Biostrings subseq function was used to extract genome-specific ter sequences. Finally, the sequence outputs were aligned with the DECIPHER (version 2.16.1) and MSA (version 1.20.1) packages utilising the Muscle alignment algorithm, which allowed filtering of illegitimate ter sites. For sequences to be recognised as legitimate, they needed to contain the crucial C6 base and have fewer than 5 mismatches compared with the MG1655 reference, while retaining inner core bases also known to be important for binding of Tus. Aligned ter site sequences were then visualised highlighting identical bases using the msaPrettyPrint function within MSA.

2.5. Architecture of the Termination Area across Phylogroups

The position of each ter site with strand information was contained in the Bowtie2 output file using the above method then cleaned with the dplyr, following the ter site filtering process. Cleaned dataframes containing sequence and position information were turned into dna_seg objects using the genoPlotR library (version 0.8.10) where shapes were specified based on an in-house function to show ter sites in either permissible or blocking orientations, with the triangles pointing in the permissible direction. To visualise the termination area in the context of other important genes, many individual dna_seg dataframes were concatenated to generate genome maps with overlapping gene information (e.g., tRNA) and other sites of interest (e.g., matS).

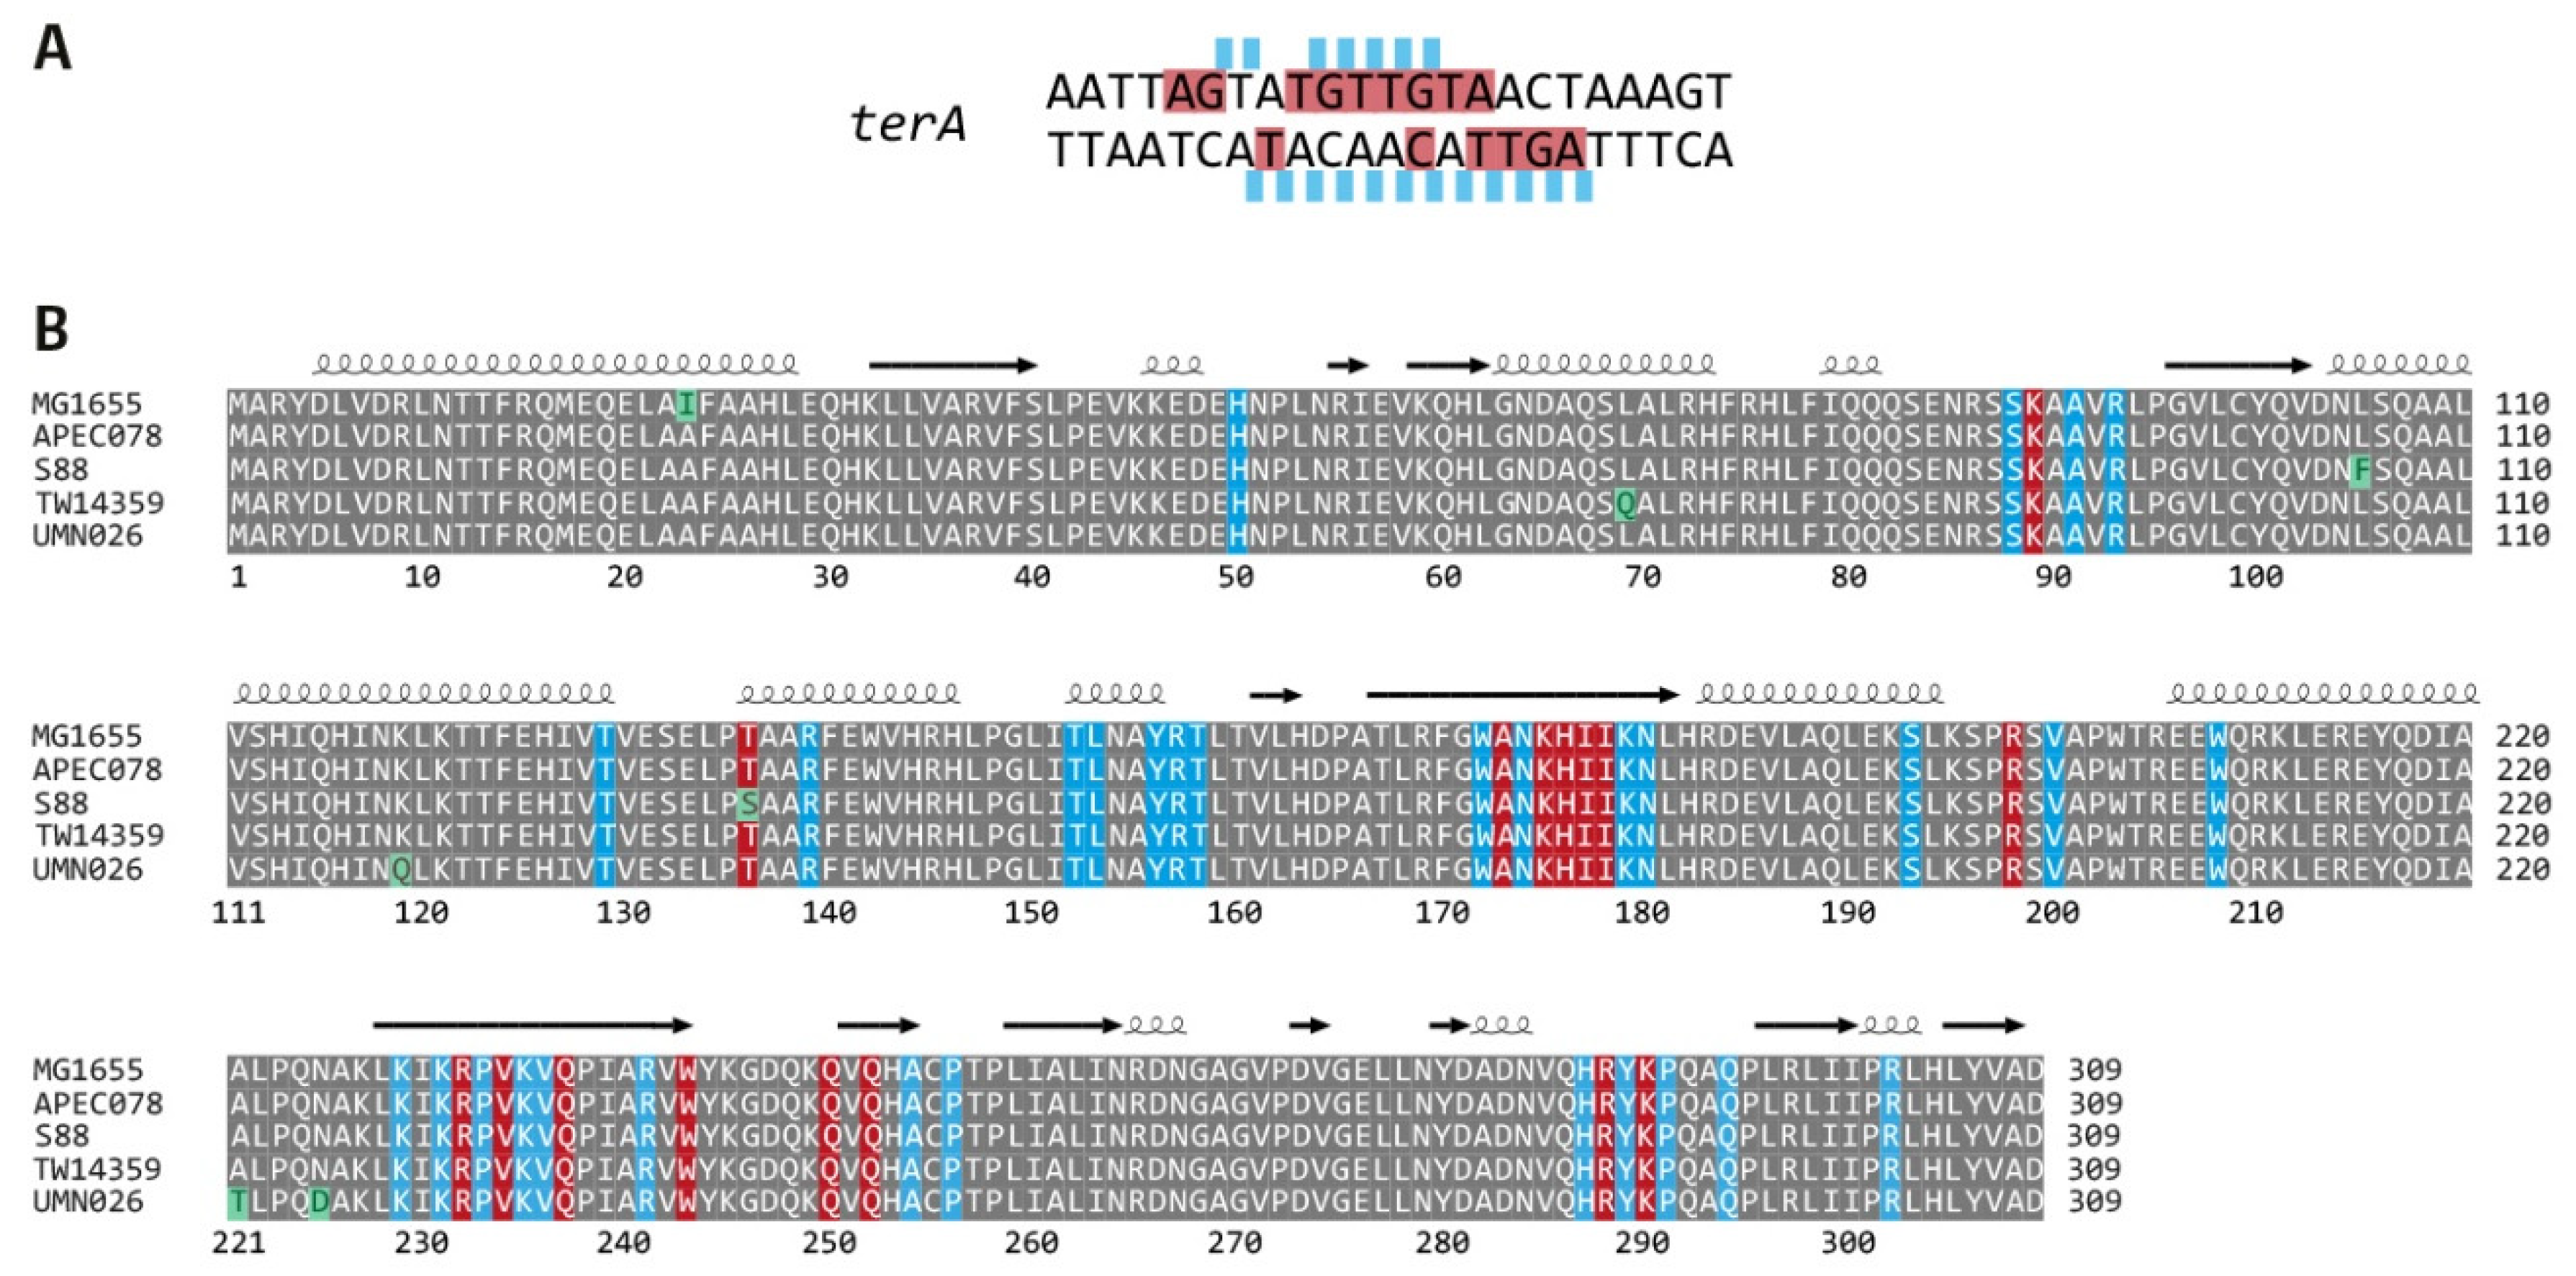
2.6. Sequence Alignment of Tus Proteins from All Phylogroups

Databases that included the genomes of interest were generated in the command line and the TBLASTN program was executed to align Tus from MG1655 against the genomes, with an E value specified as 1 × 10⁻¹⁹. Raw CSV outputs were read into R and cleaned using Biostrings to manipulate the proteomic data into alignment objects using the DECIPHER and MSA packages, as mentioned above. By using the msaPrettyPrint function once again, the Tus alignment figures were generated highlighting identical amino acid residues.

2.7. Detection of ter Sites within Coding Sequences

For the prediction of coding sequences, the Glimmer plugin [32] was used through Geneious Prime to annotate each genome that contained separate tracks of ter sequences. The ter sequences that showed overlap with a predicted gene were recorded in Excel.

2.8. Availability of Scripts Used in This Study
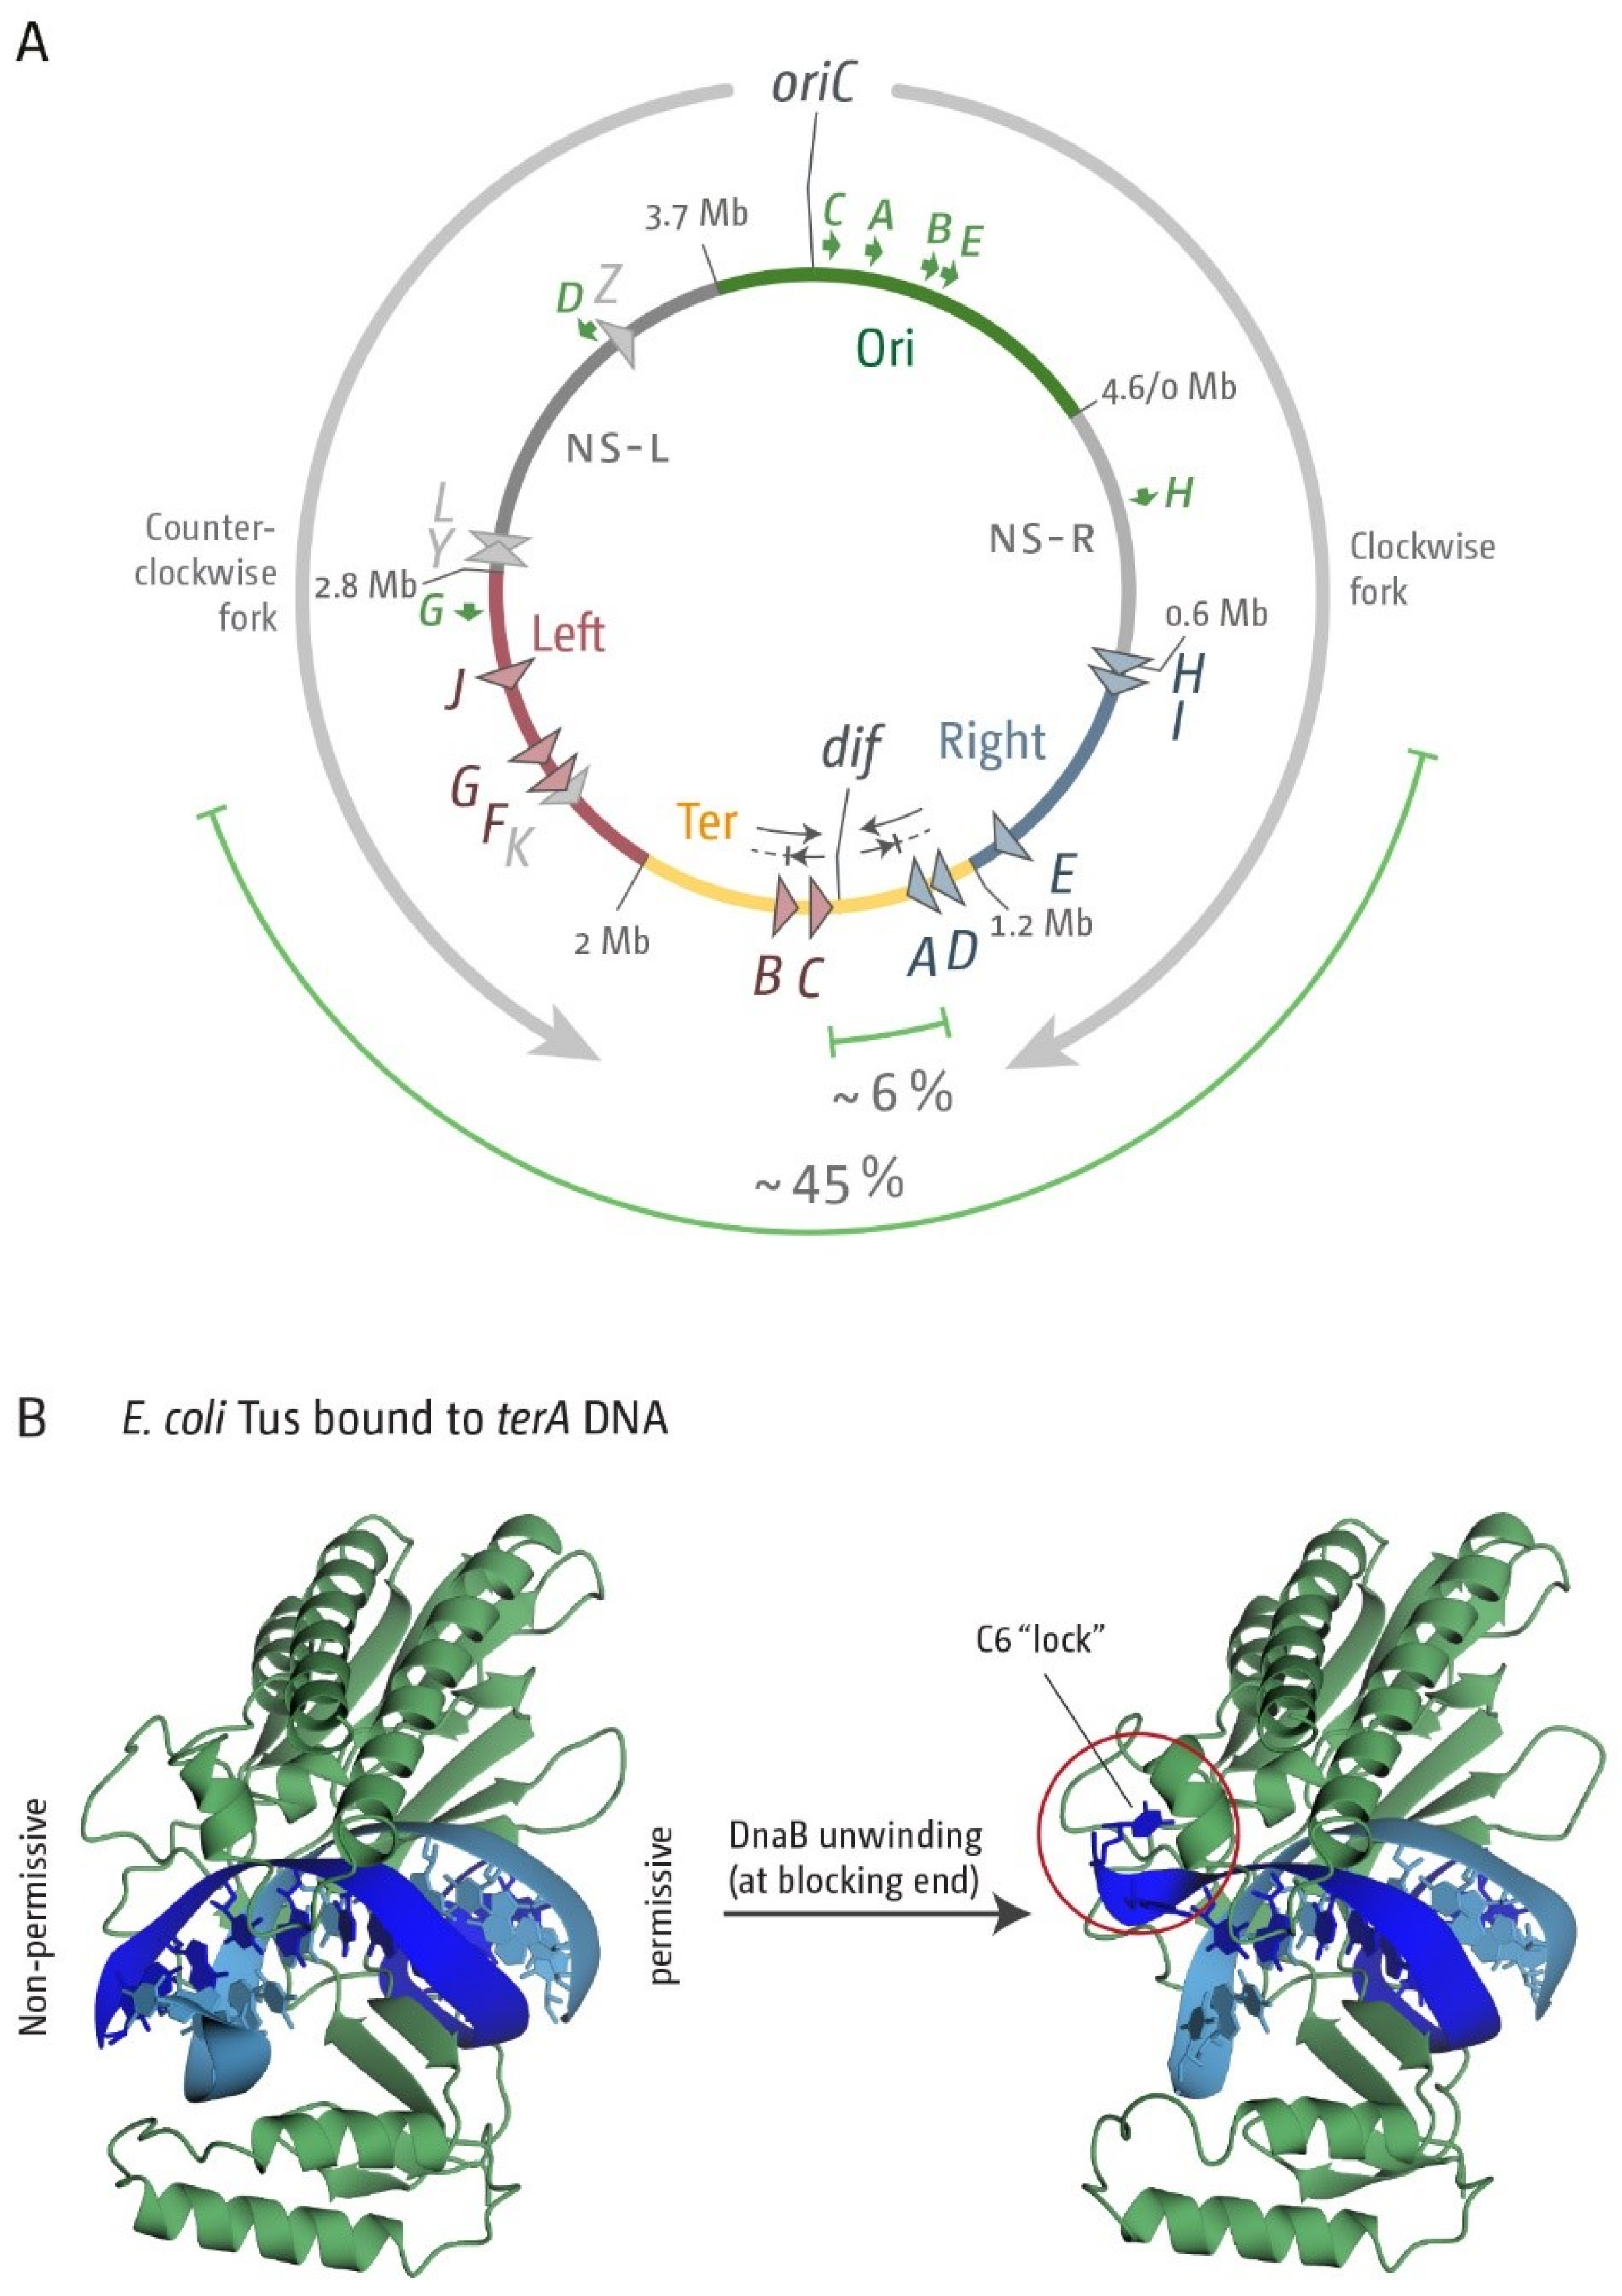
All scripts used for the analyses described above are available in the GitHub repository and can be accessed here: https://github.com/DanielGoodall/Goodall_etal2021.

3. Results

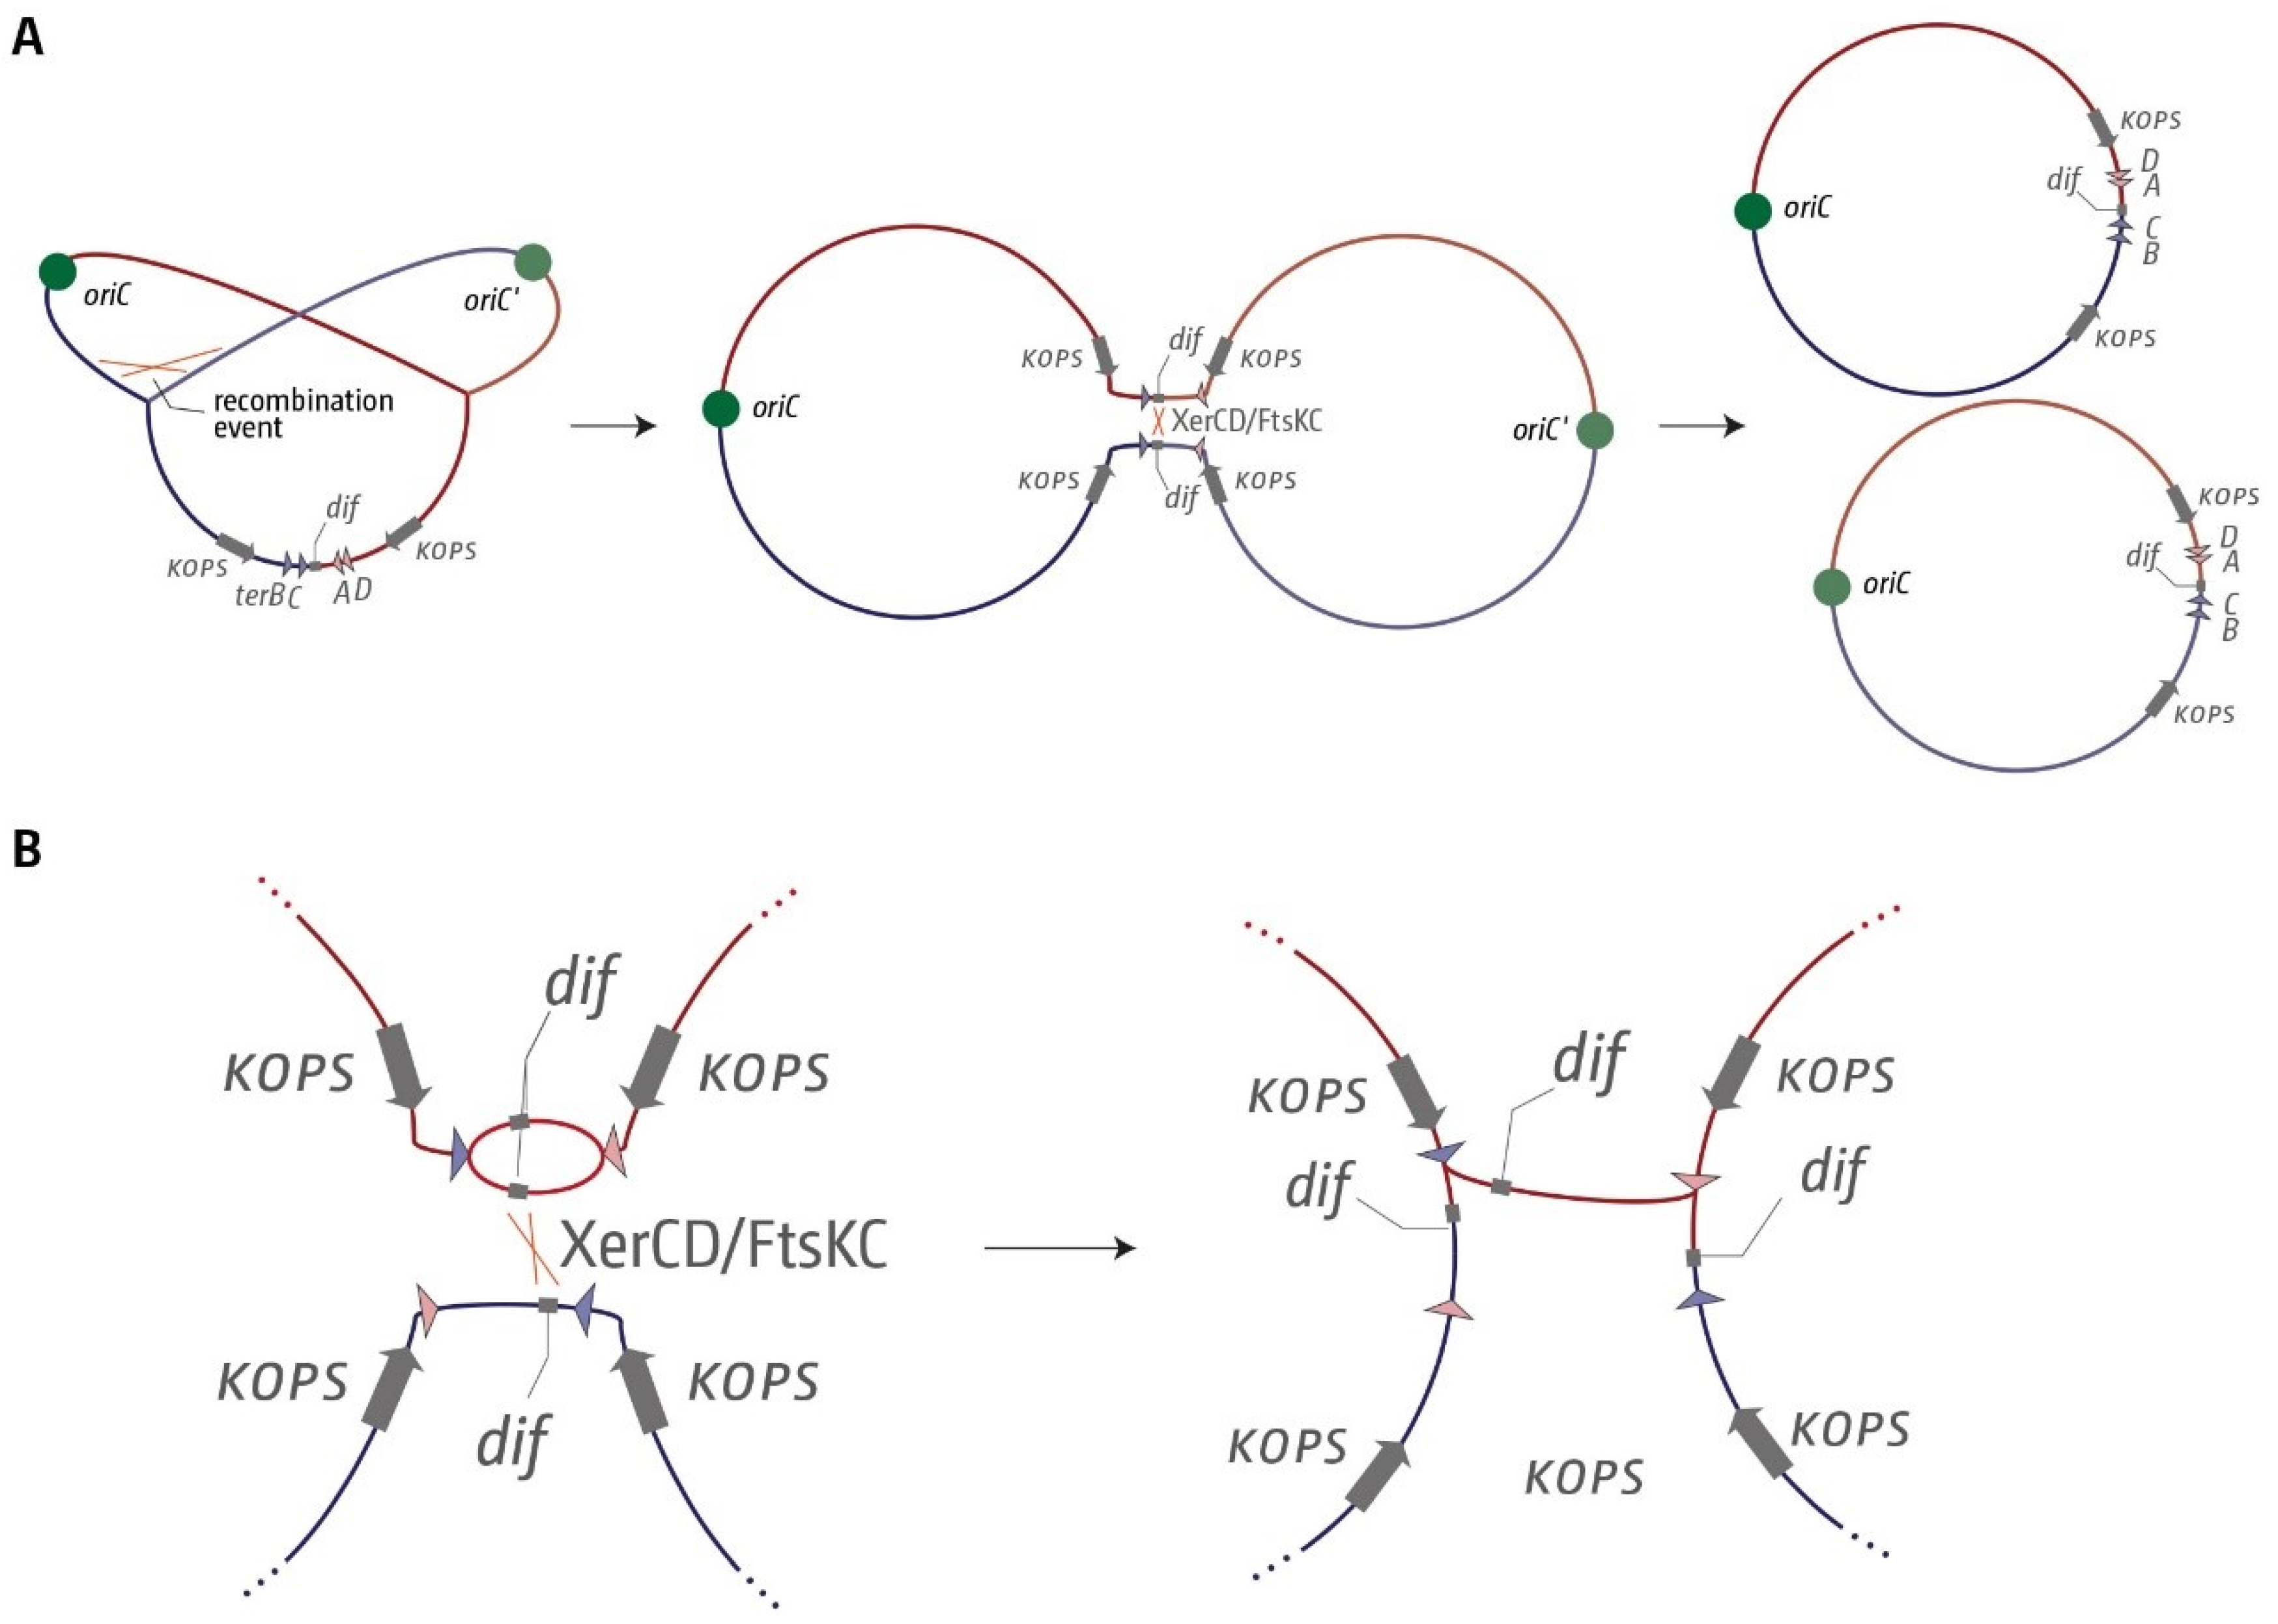
3.1. A Functional Replication Fork Trap Might Provide a Growth Advantage in E. coli

While in E. coli the initial analysis of cells lacking Tus protein did not reveal any major phenotypes [25,26], clear effects of the absence of Tus were subsequently reported [16,17]. Notably, the absence of Tus protein can result in low but detectable levels of chromosomal over-replication [33], an effect also observed in high-resolution replication profiles generated via WGS [23] (Figure S1). Over-replication of the termination area can be significantly exacerbated by additional mutations in PolI, RecG or 3′ exonucleases [23,33,34,35,36,37]. Moreover, the over-replication observed in these particular mutants is not a consequence of lacking Tus, as it can be observed in the presence of Tus [23,34,35,36,37].
In our recent work with strains containing multiple ectopic replication origins, we observed that Δtus single mutants consistently showed a mild elongation of the doubling time by between 1 and 2 minutes in LB broth [20,38]. This longer doubling time might indicate that cells lacking Tus have a mildly reduced fitness, as recently suggested [24]. However, the presence of an ectopic replication origin distorts the normal replichore arrangement. Because the ectopic origin is closer to the replication fork trap, one of the replication forks is arrested every cell cycle [3,20,38]. Thus, the mildly elongated doubling time could be caused by forks stalled at ter/Tus complexes requiring additional processing steps, rather than the presence or absence of Tus. Cells with a gross asymmetry of replichore lengths were shown to require the RecA main recombinase for survival [39], in line with the observed formation of double-strand breaks at ectopically inserted ter sites [18].
To avoid the complication of additional origins, we measured the doubling time of MG1655 versus a ∆tus single mutant. As before, we found an elongation of the doubling time. However, the effect is less pronounced than in our constructs with additional ectopic origins (compare doubling times in Table 1). However, even though we saw some variation in the actual doubling times on different days, which lead to a relatively large standard deviation, our Δtus strain always grew more slowly than the Tus+ control run in parallel in all seven experiments, and a Wilcoxon signed-rank test confirmed statistical significance for p = 0.05. Thus, Δtus cells have a very subtle growth defect, which becomes more apparent if the replichore arrangement becomes skewed (Table 1) [20,38].

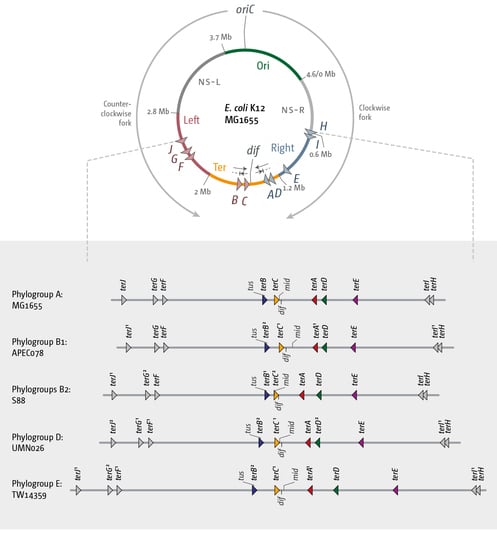
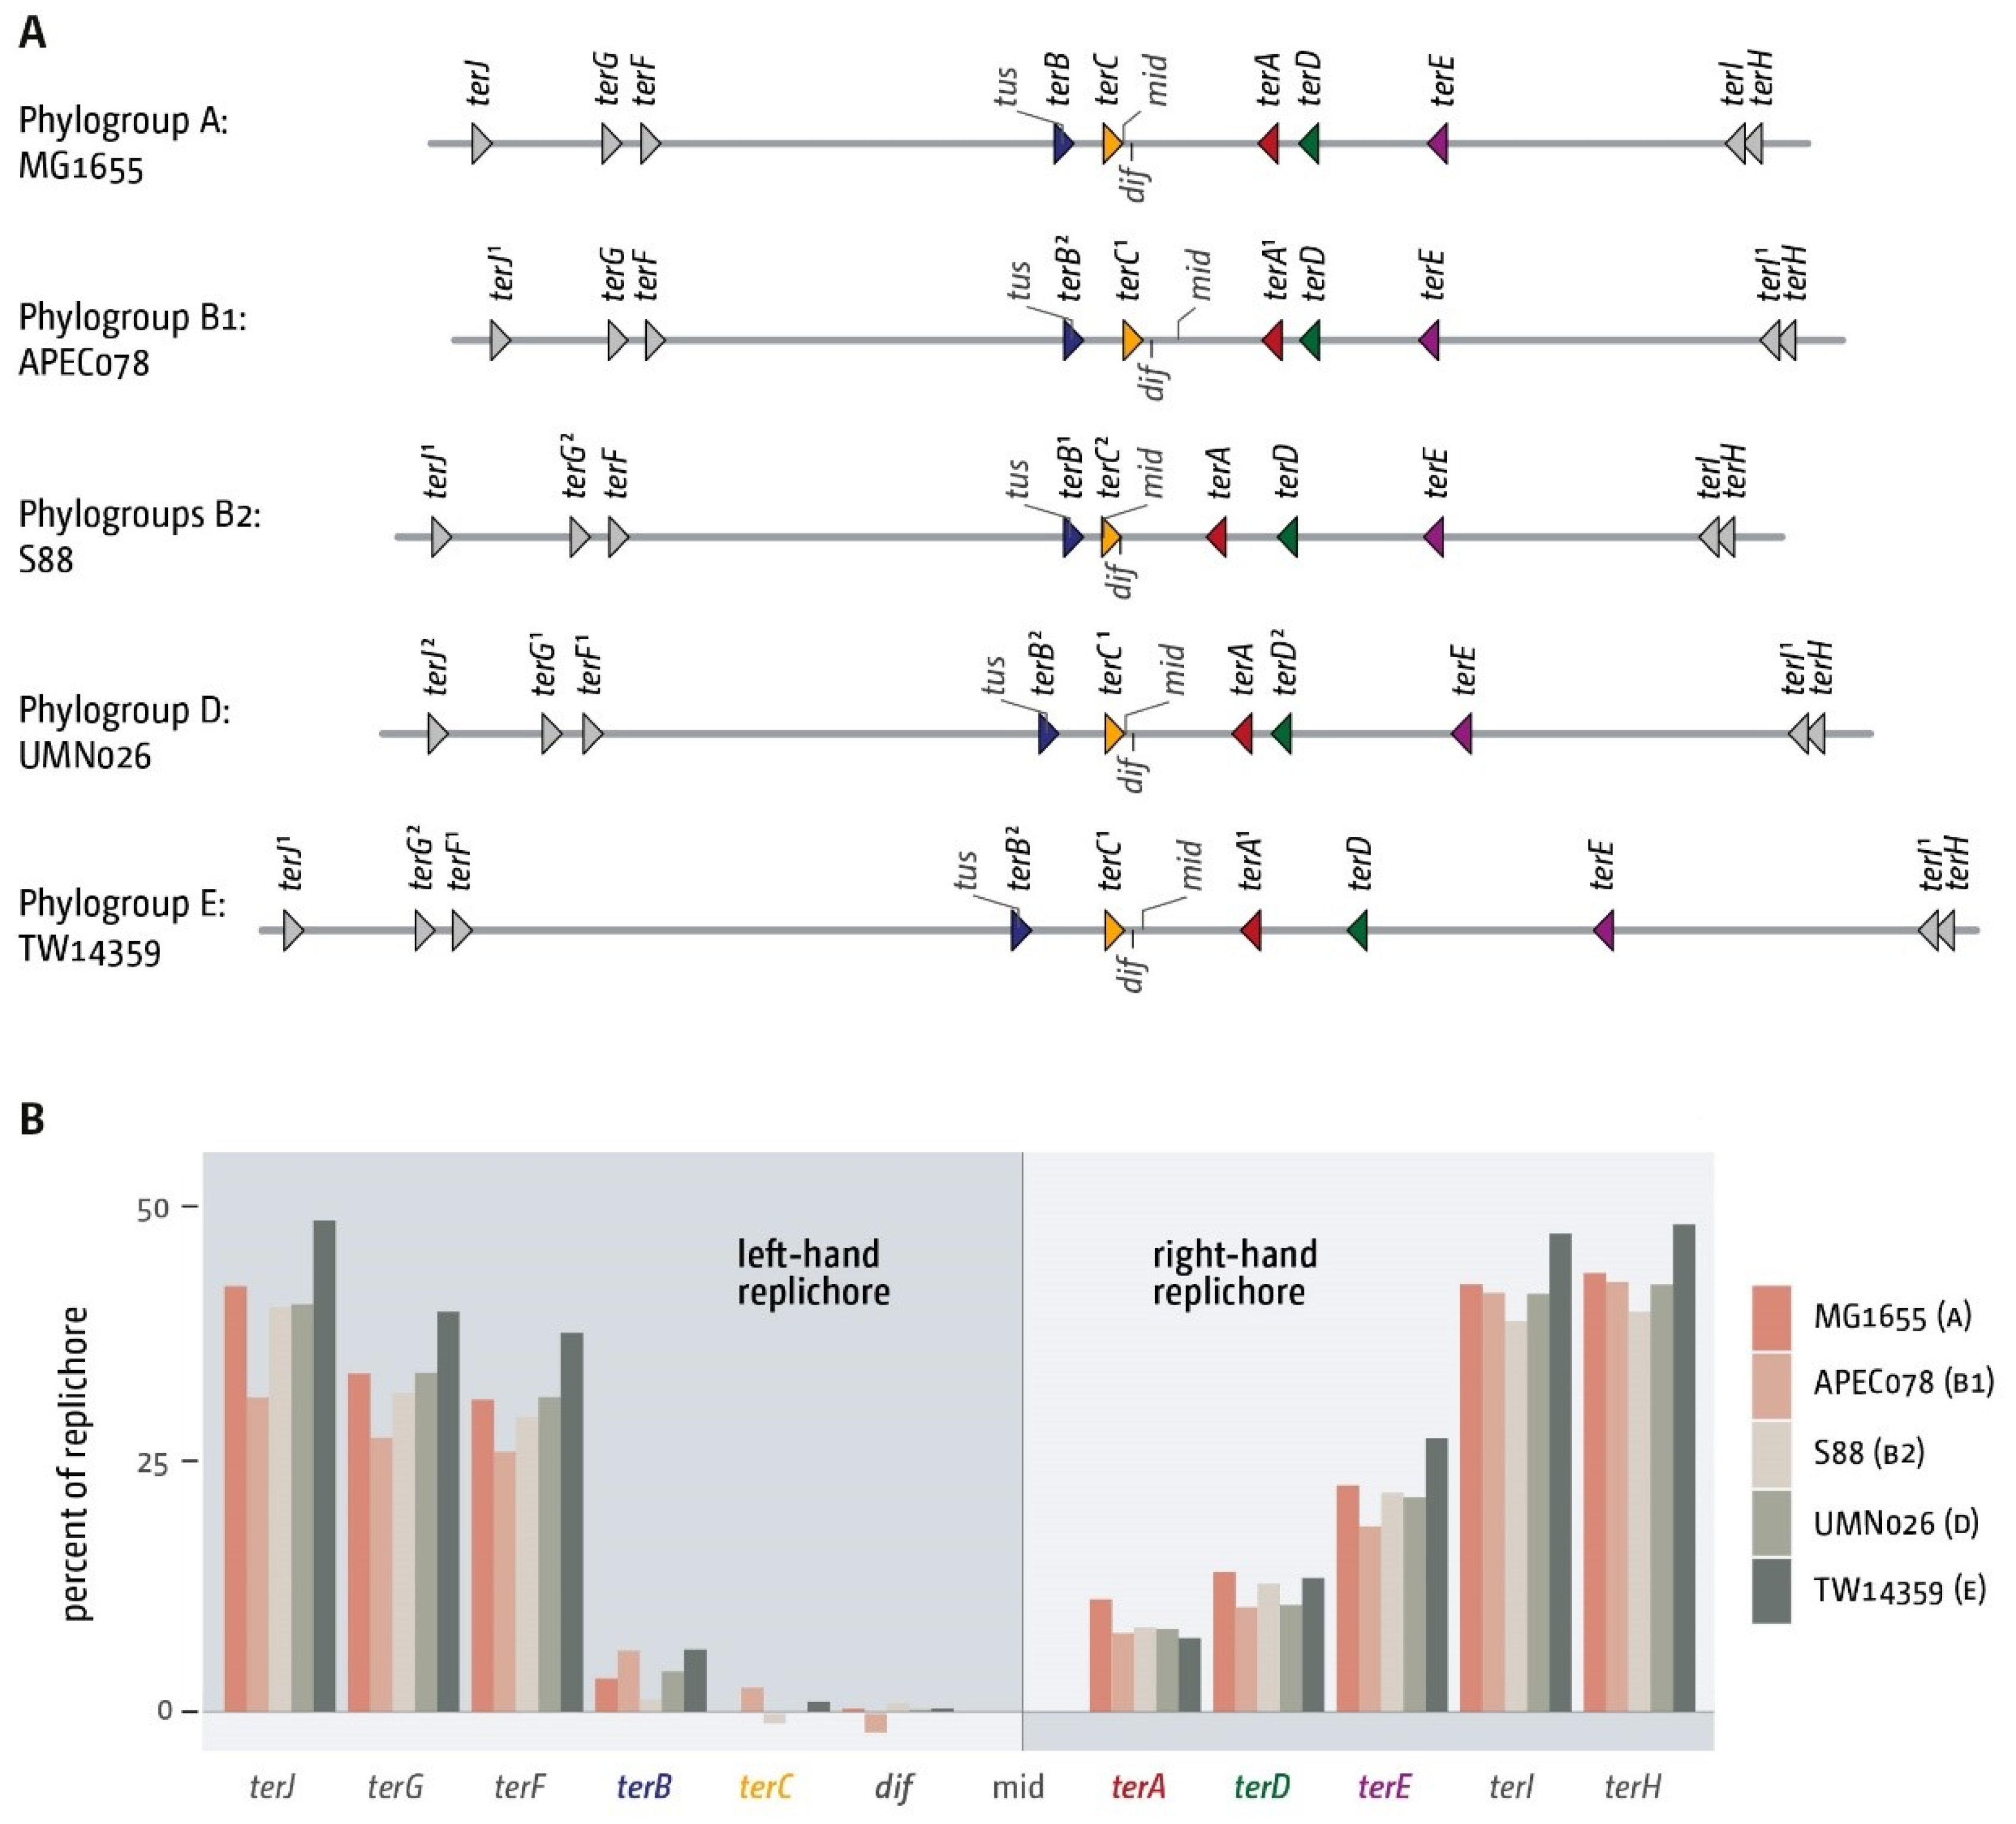
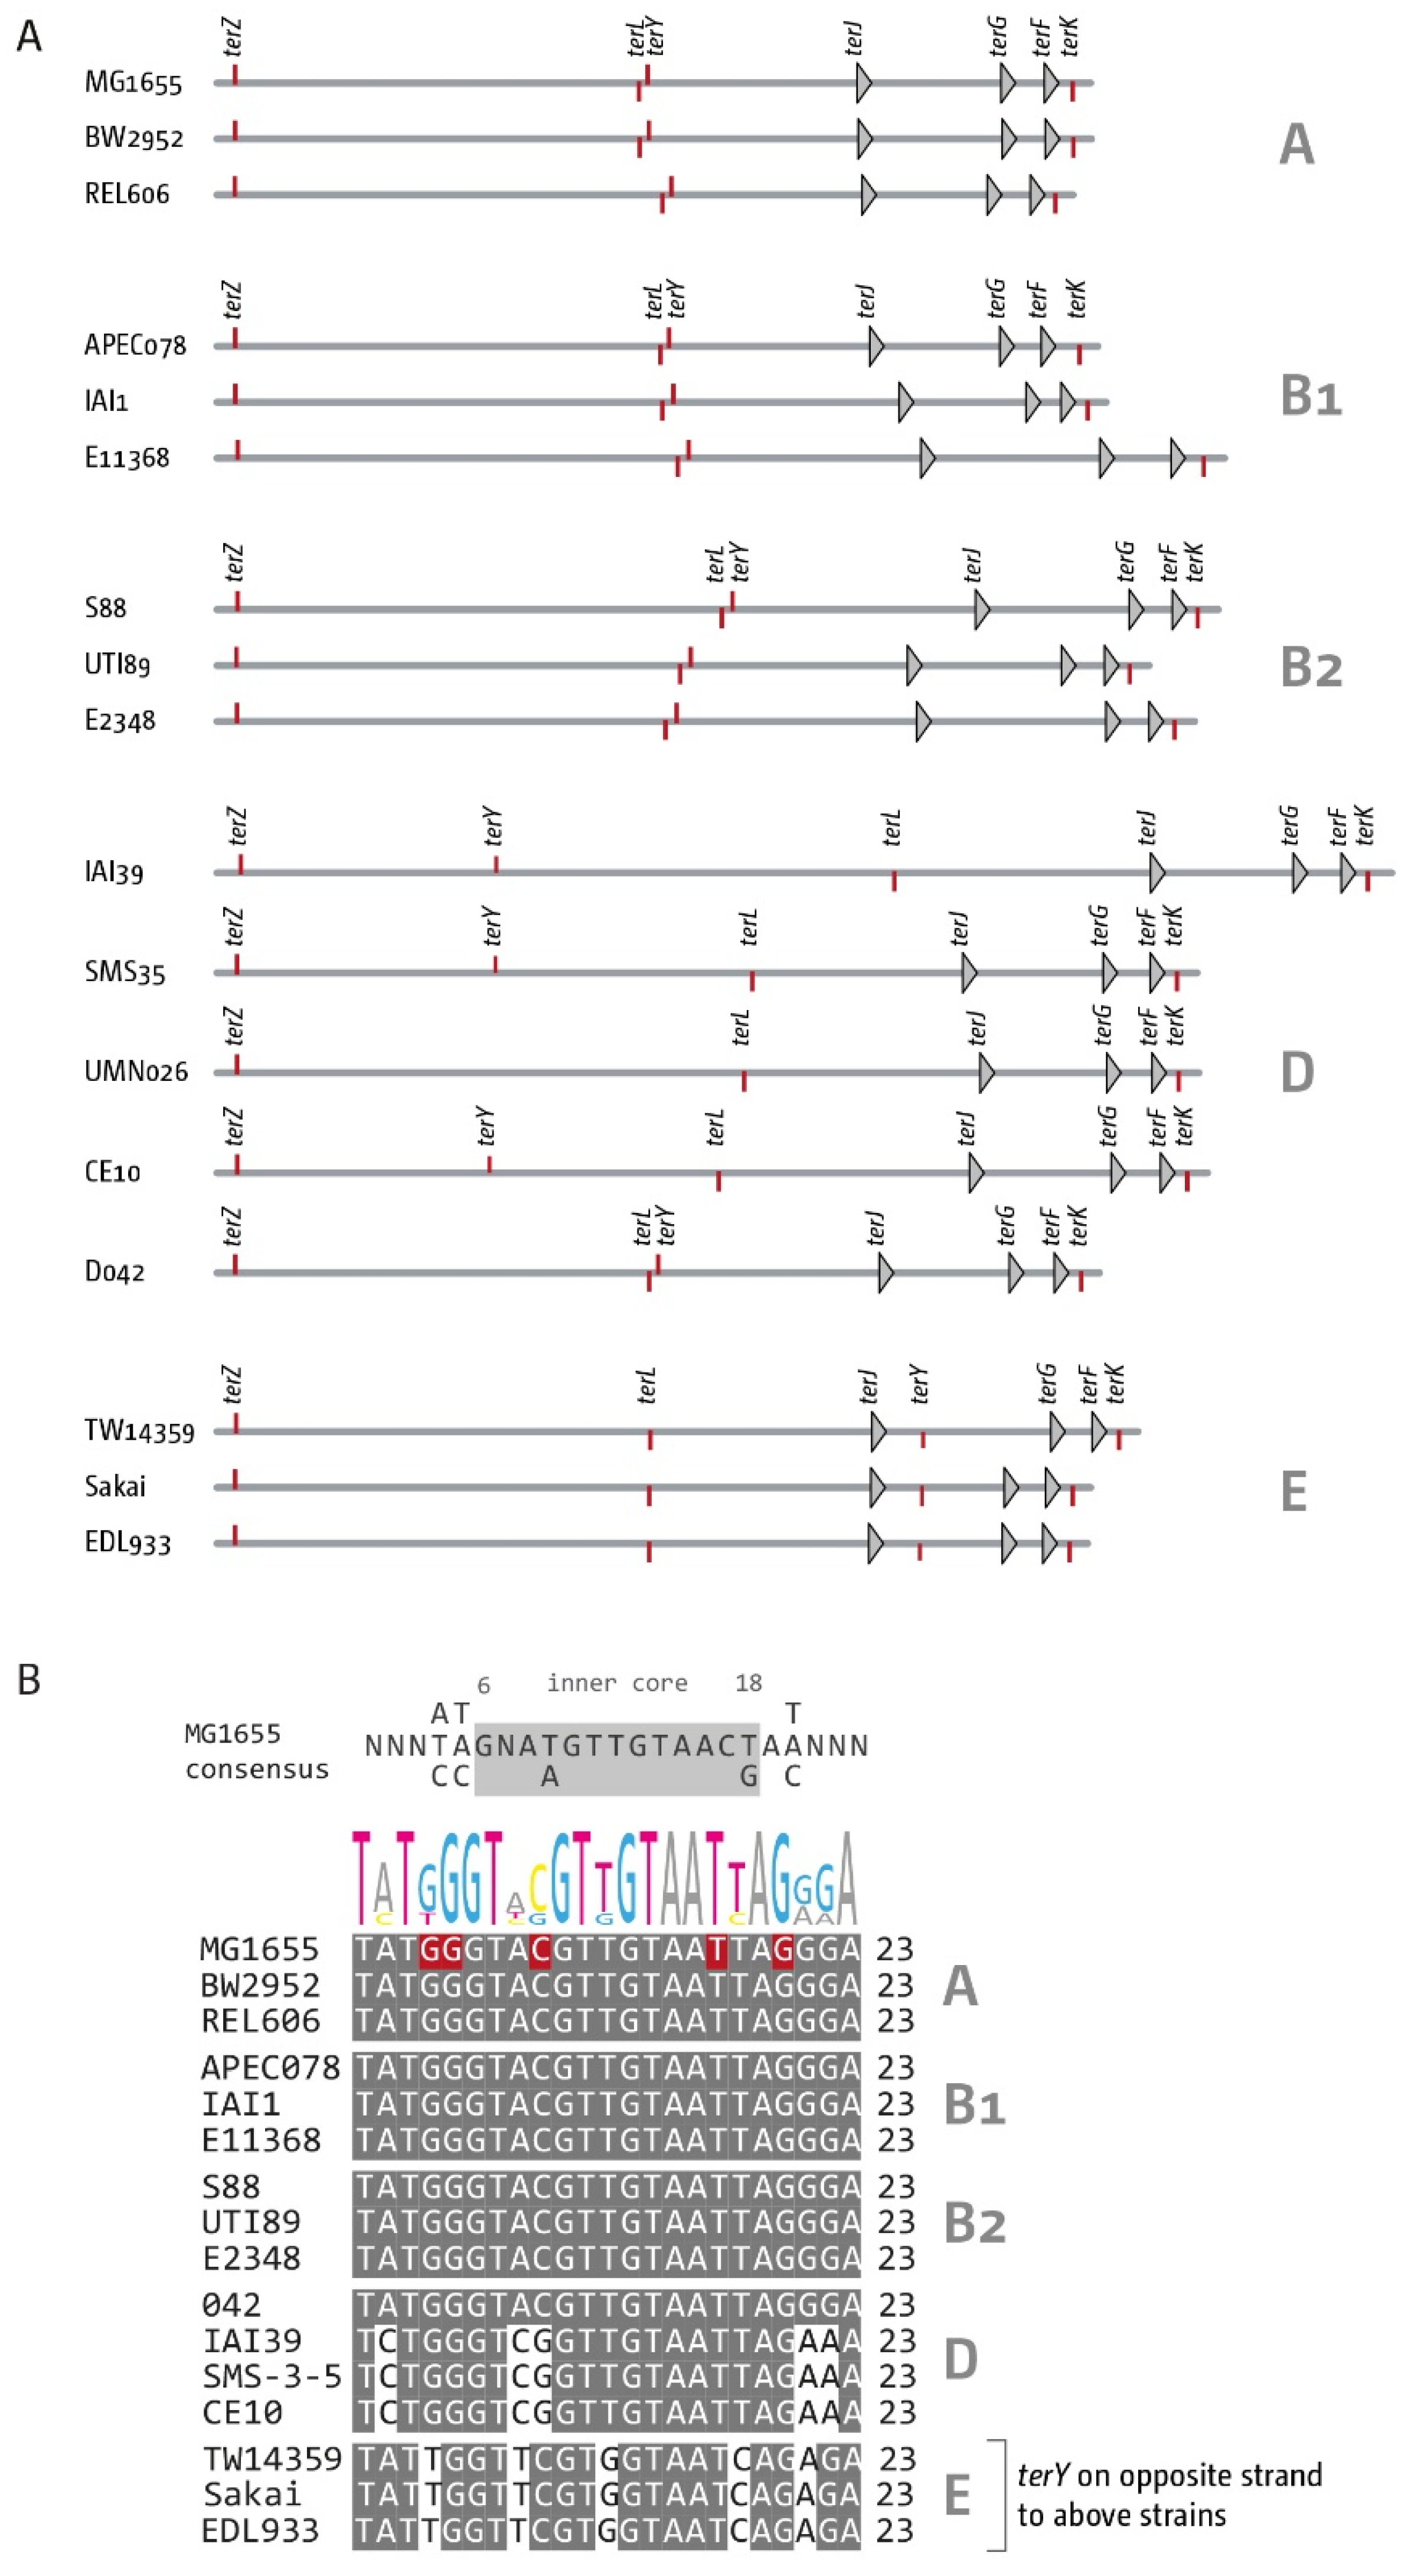
3.2. The Number and Distribution of ter Sites Is Similar in All E. coli Phylogroups

E. coli can be found in the gastrointestinal tract of a variety of warm-blooded animals, and host populations are strongly shaped by both factors specific to the host as well as the environment [40]. Consequently, E. coli populations can be quite diverse. Comparison of an increasing number of fully sequenced E. coli genomes revealed a core of approximately 2200 genes which are conserved in all isolates [41]. However, the systematic analysis of a larger number of strains revealed a pan-genome of more than 13,000 genes [41].
E. coli strains have been classified, revealing a variety of phylogenetic groups [42], the most prominent of which are A, B1, B2, D, E and S [43,44]. Commensal strains in humans belong mostly to phylogroup A [40], while pathogenic strains belong mostly to phylogroups B2 and D [44,45]. The enterohemorrhagic O157:H7 strains are in group E, whereas Shigella falls into the additional group S [46]. In a recent analysis, over 100,000 E. coli genomes were used for an extensive phylogenetic analysis [42]. This analysis allowed the more detailed definition of 14 phylogroups G, B2-1, B2-2, F, D1, D2, D3, E2, E1, A, C, B1, Shig1 and Shig2. The phylogenetic analysis showed an early separation of phylogroup D (D1–3), followed by a separation of phylogroups F, G, B2-1 and B2-2 from the remaining groups. Eventually phylogroups E, A, S, C and B1 separated [42]. The analysis of gene gain, gene loss and gene duplication ratios showed significantly different gain/loss/duplication ratios of all phylogroups, even between phylogroups that are thought to share an ancestral history, highlighting the significant divergence across the different phylogroups [42]. In this study, we restricted our analysis to the phylogroups A, B1, B2, D, E and S. Despite slightly less differentiation, our analysis still covers the divergence across the entire phylogenetic tree [42].
In E. coli K12, which belongs to phylogroup A, the innermost ter sites A, B, C, D and E are not part of open reading frames, while the outer ter sites F, G, H, I and J are [15]. Thus, ter sites F–J might be conserved mainly due to the conservation of the genes they are part of [15]. Nevertheless, the variability of ter sites A–E should give us an indication of how much they contribute to the fitness in E. coli. The very mild effect on the doubling time (Table 1) might suggest that the absence of a fork trap is of little consequence. In this case, we would expect to see increased variability of the sequence and location of these ter sites, as such variability would come at little cost.
We started with the analysis of a single genome for each of the phylogroups B1, B2, D and E, with MG1655 (A) as a reference (Figure 2). This initial analysis revealed some variability of genome sizes (Table 2), but all ter sites could be identified (Figure 2A). As in MG1655, the innermost ter sites A, B, C and D are present and form a relatively small termination area which spans between 4% and 6% of the chromosome, as observed in MG1655 (Table 2). To take the different genome sizes into consideration, we calculated the arithmetic mid-point of each chromosome, based on oriC, and calculated the positions of ter sites as percentage of the replichore (Figure 2B). The analysis revealed that for four of the five genomes investigated, the arithmetic mid-point is located between the innermost ter sites, in close proximity to the chromosome dimer resolution site dif. Only in one strain, S88, was the arithmetic mid-point located just outside of terC, between ter sites C and B and therefore outside of the innermost termination area. However, as forks in E. coli do not proceed absolutely symmetrically [47], it is not clear without experimental work whether forks regularly get arrested by terC in S88. The analysis revealed some variations in the relative positions of some ter sites, but especially the relative location of the innermost ter sites is quite similar (Figure 2B).
Next, we analysed the sequence variations of all primary ter sites. For some ter sites, we observed sequence variabilities of 1 or 2 bp. However, variations were mostly restricted to the outer sections of the ter sequences (Figure 3), which are not directly in contact with the Tus protein (Figure 4A) [16,49]. Some variability was also observed for position 7, but while lying in the core ter sequence, it has been shown before that this position can be changed, with little effect on the stability of the protein-DNA interaction, as it does not make any base specific contacts with Tus in either the bound or locked structure [50].
There were only three changes that are likely to reduce the stability of the protein-DNA complex. G6 of terJ in UMN026 showed a G to A transition mutation (Figure 3), which is likely to substantially reduce stability of the ter/Tus complex and therefore the ability to block replisome progression [16,50]. Similarly, terF showed an A to T transversion at position 15 both in UMN026 and TW14359 (Figure 3). This inner core region interacts significantly with Tus protein and any change introduced reduced Tus binding [50]. Thus, it seems likely that terF has a reduced binding affinity in these two backgrounds. However, both terJ and terF are a considerable distance from the fork fusion area, and it is not clear how often replisomes will be blocked here in normally growing cells [15].
In the five genomes analysed, we found that almost 90% of all variations (18 out of 21 SNPs total) occurred within the outer base pairs 1 to 5 and 19 to 23, which have little or no interaction with Tus protein based on the crystal structure [16,49], or at the variable position 7. More than half (11 out of 21) of these changes were observed in the four innermost ter sites, which are not part of open reading frames, while some of the outer ter sites (terE and terH) showed no changes whatsoever. This high degree of similarity of ter sites F to J is likely to be influenced by the need to maintain the genes these ter sites are part of. In contrast, this particular selection pressure does not apply for the innermost ter sites, explaining why for these ter sites, especially the outer sequences that do not interact directly with Tus, can be quite variable.
To establish that we had not selected unrepresentative members of the phylogroups in our initial analysis, we did an in-group comparison of the ter site patterns of three members of phylogroups A, B1, B2, and E, as well as five for phylogroup D (Figure S2), based on the recent phylogenetic analysis of these groups [42,46,51,52]. For phylogroups A, B1, B2 and E we again found variations of the overall genome size and proportion covered by the fork trap, but the order of ter sites appeared identical in all genomes analysed (Figure S2). Only in strain EDL933 from phylogroup E we observed what appears to be an inversion of the inner termination area, spanning terA, terC and dif. However, as two ter sites with opposite orientation are flipped, this inversion will not alter the functionality of the fork trap in this strain. Forks will still be forced to fuse in between terA and terC in EDL933.
Within phylogroup D, we found more variability. Three of the genomes analysed had a pattern of ter sites that matched the pattern observed in all other strains. However, two particular genomes differed. SMS-3-5 appears to have a large inversion of the termination area, which spans ter sites E, D, A, C and B. As for EDL933, this inversion will not interfere with the functionality of the fork trap: replication will still be blocked between ter sites A and C, as both of them are inverted. The only change from this pattern was observed in IAI39, in which ter sites A, D and C are, in terms of orientation and relative location, as in MG1655, while ter sites B and E are swapped. In MG1655, terB overlaps the promoter of the tus gene [25] and in IAI39, we found indeed both terB and tus in the new location. IAI39 is the only genome where we do not see an inner termination area that is flanked by a relatively tight cluster of two ter sites. The ter sites D, A, C and E will still act as a fork trap (Figure S2), but terC and E are much further apart than terC and B normally are.

3.3. Functionality of the Fork Trap in the Phylogroups

We have not established experimentally whether the ter sites identified in the various E. coli strains are functional. However, the sequence comparison of all ter sequences (Figure S3) highlights that the vast majority of SNPs found are in the outer variable ter region. The crystal structure of E. coli Tus protein [49] shows that the main interactions are with the inner core of the ter sequence. The outer sequences are not resolved in the structure and will contribute little to binding, both in bound and in the locked structure [53], explaining the higher degree of variability observed.
We also analysed Tus sequence alignments from the five E. coli phylogroups (Figure 4). Tus is 309 amino acids long and highly conserved—we observed a total of seven changes across the five phylogroups (Figure 4B), with individual strains having between one and three changed positions. Six of the seven changes observed are solvent exposed. Only one variant, Thr/Ser at position 136 in S88, is a residue close to the ter binding site. This residue makes minimal contacts with the DNA backbone (at position 10) and is a highly conservative variation, which is unlikely to affect binding. Thus, the Tus proteins from all five phylogroups are highly likely to form fully functional ter/Tus complexes. Given that the core of all ter sequences is unchanged and Tus is likely to be fully functional, we conclude that all strains contain a fully active replication fork trap, with only some minor variations.

3.4. Analysis of Secondary ter Sites

One key question is how much variability would be expected for sequence elements such as ter sites. To investigate this question, we analysed whether the order of other chromosomal markers is conserved. We analysed the presence and locations of rrn operons, genes coding for ribosomal proteins, tRNA genes and aminoacyl-tRNA synthetase genes before [5]. tRNA and aminoacyl-tRNA synthetase genes are particularly evenly distributed throughout the MG1655 chromosome [5], and we were interested to see how much variability is observed in the order of these genes.
We found that the order of genes shows, with few exceptions, very little variation across the phylogroups (Figure S4 for an overview, Figure S5 for some details), suggesting that the conserved order of the ter sites might not be very informative.
However, plotting these genes revealed their absence from the inner termination area. For example, aminoacyl-tRNA synthetase genes are relatively evenly spread, with the exception of three broad gaps with a reduced density (shown by light grey areas for MG1655 in Figure S4). These gaps coincide with (a) the area where rrn operons C, A, B and E are located, (b) the location of a cluster of genes encoding for ribosomal proteins and (c) the termination area (Figure S4). Analysis of all matS sites, which bind MatP and define the Ter domain of the chromosome, are specifically located in the termination area, but some overlap between matS sites and aminoacyl-tRNA synthetase genes is evident. ter sites appear to be a more defining factor: the density of these particular genes is very low between the innermost ter sites B, C, A and D, and none are located in between the innermost ter sites C and A (Figure S4).
The conclusion that the order of essential genes shows little variability even between the distant phylogroups fits with the observation that bacterial genome plasticity is often found in defined regions (“Regions of Genome Plasticity”, RGPs), such as pathogenicity clusters, prophages and regions encoding recombinases [55]. Indeed, for prophages in the E. coli genome, the mutational decay was reported to be high [56]. Deletion rates of materials not actively selected for were also shown to be high, leading to the typical compact bacterial genomes with a low number of pseudogenes [57]. From this perspective, the similar order of all primary ter sites is not too surprising. However, the consistent presence of the inner ter sites, which are outside of open reading frames, suggests that they have an important physiological role.
As the order of genes offers relatively little insight, we took two different approaches. Firstly, we included 25 bp upstream and downstream of all ter sequences in our sequence alignments (Figure S6). If it is specifically the binding of Tus that drives conservation of ter sites, we would expect for the ter sites outside of ORFs to see a relatively high degree of variability of the sequences surrounding the ter site, while variation of the actual ter site should be lower. This is indeed the case in the first approximation, as for example ter sites A and D have a much higher variability of the surrounding sequences than ter sites F to J, which all show a high degree of similarity (Figure S6). However, the analysis comes with some caveats. For terB, a relatively high degree of similarity is observed, but terB is located in the promoter of the tus gene [25], which will result in a higher degree of similarity. We were surprised to find a high degree of sequence similarity for terE (Figure S6). terE is not part of the innermost ter sites on most genomes analysed, and for that reason it is not very surprising that arrested forks could not be detected at terE in wild type cells [15]. However, terE is not part of known or predicted ORFs (Table S4), and yet terE itself and the surrounding sequences are highly similar. It will be interesting to analyse this particular region in the future to establish whether the sequences might be conserved due to an unpredicted ORF or other functional elements.
Secondly, we analysed the variability of the secondary ter sites K, L, Y and Z. The ter sites K and L are in the same replichore as ter sites C, B, F, G and J and share their direction (Figure 1A), but both have very low fork arresting activity [15]. ter sites Y and Z are both origin-proximal and in blocking orientation for forks coming from oriC (Figure 1A). Fork blocking activity is, again, very low unless tus is over-expressed [15]. ter sites K, L and Z are part of open reading frames in MG1655 [15], whereas terY is not. Thus, the analysis especially of terY might give us a better idea of the expected level of variability for a relatively short sequence with low or no selection pressure at the sequence level.
As might be expected, given their associations with ORFs, ter sites K, L and Z were found in all the analysed genomes (Figure 5A). The presence of terY, however, was more variable. Out of the 17 genomes analysed, we were able to find it in 10 by using the same parameters as for the primary ter sites. When we allowed for five mismatches, we were able to find it in all but one genome (UMN026). The strains from phylogroups A, B1 and B2 all showed little sequence variation. However, considerable differences were observed in strains from phylogroups D and E (Figure 5). terY already shows some changes in the core sequence in comparison to the ter consensus sequence (highlighted in red in Figure 5), explaining the low fork blocking activity of terY [15]. In some strains within phylogroups D and E, we found a number of additional sequence changes, which were not restricted to the outer parts of the ter sites but occurred through the core as well. It is noteworthy that E. coli strain 042, which is part of phylogroup D, shows a sequence identical to MG1655 (Figure 5), showing that there is not absolute consistency across phylogroups.
The variability observed supports the idea that, without selection pressure, ter sites outside of open reading frames would be expected to be far more variable or become lost from the genome. The strict conservation of the core sequences of ter sites A–E supports the idea that these ter sites indeed play an important role. However, the consistent presence of the secondary ter sites K, L and Z, which have only an extremely weak fork blocking activity, also emphasises that ter sites that are part of ORFs are likely to be pseudo ter sites that are retained via the selection pressure for the associated genes, as suggested [15].

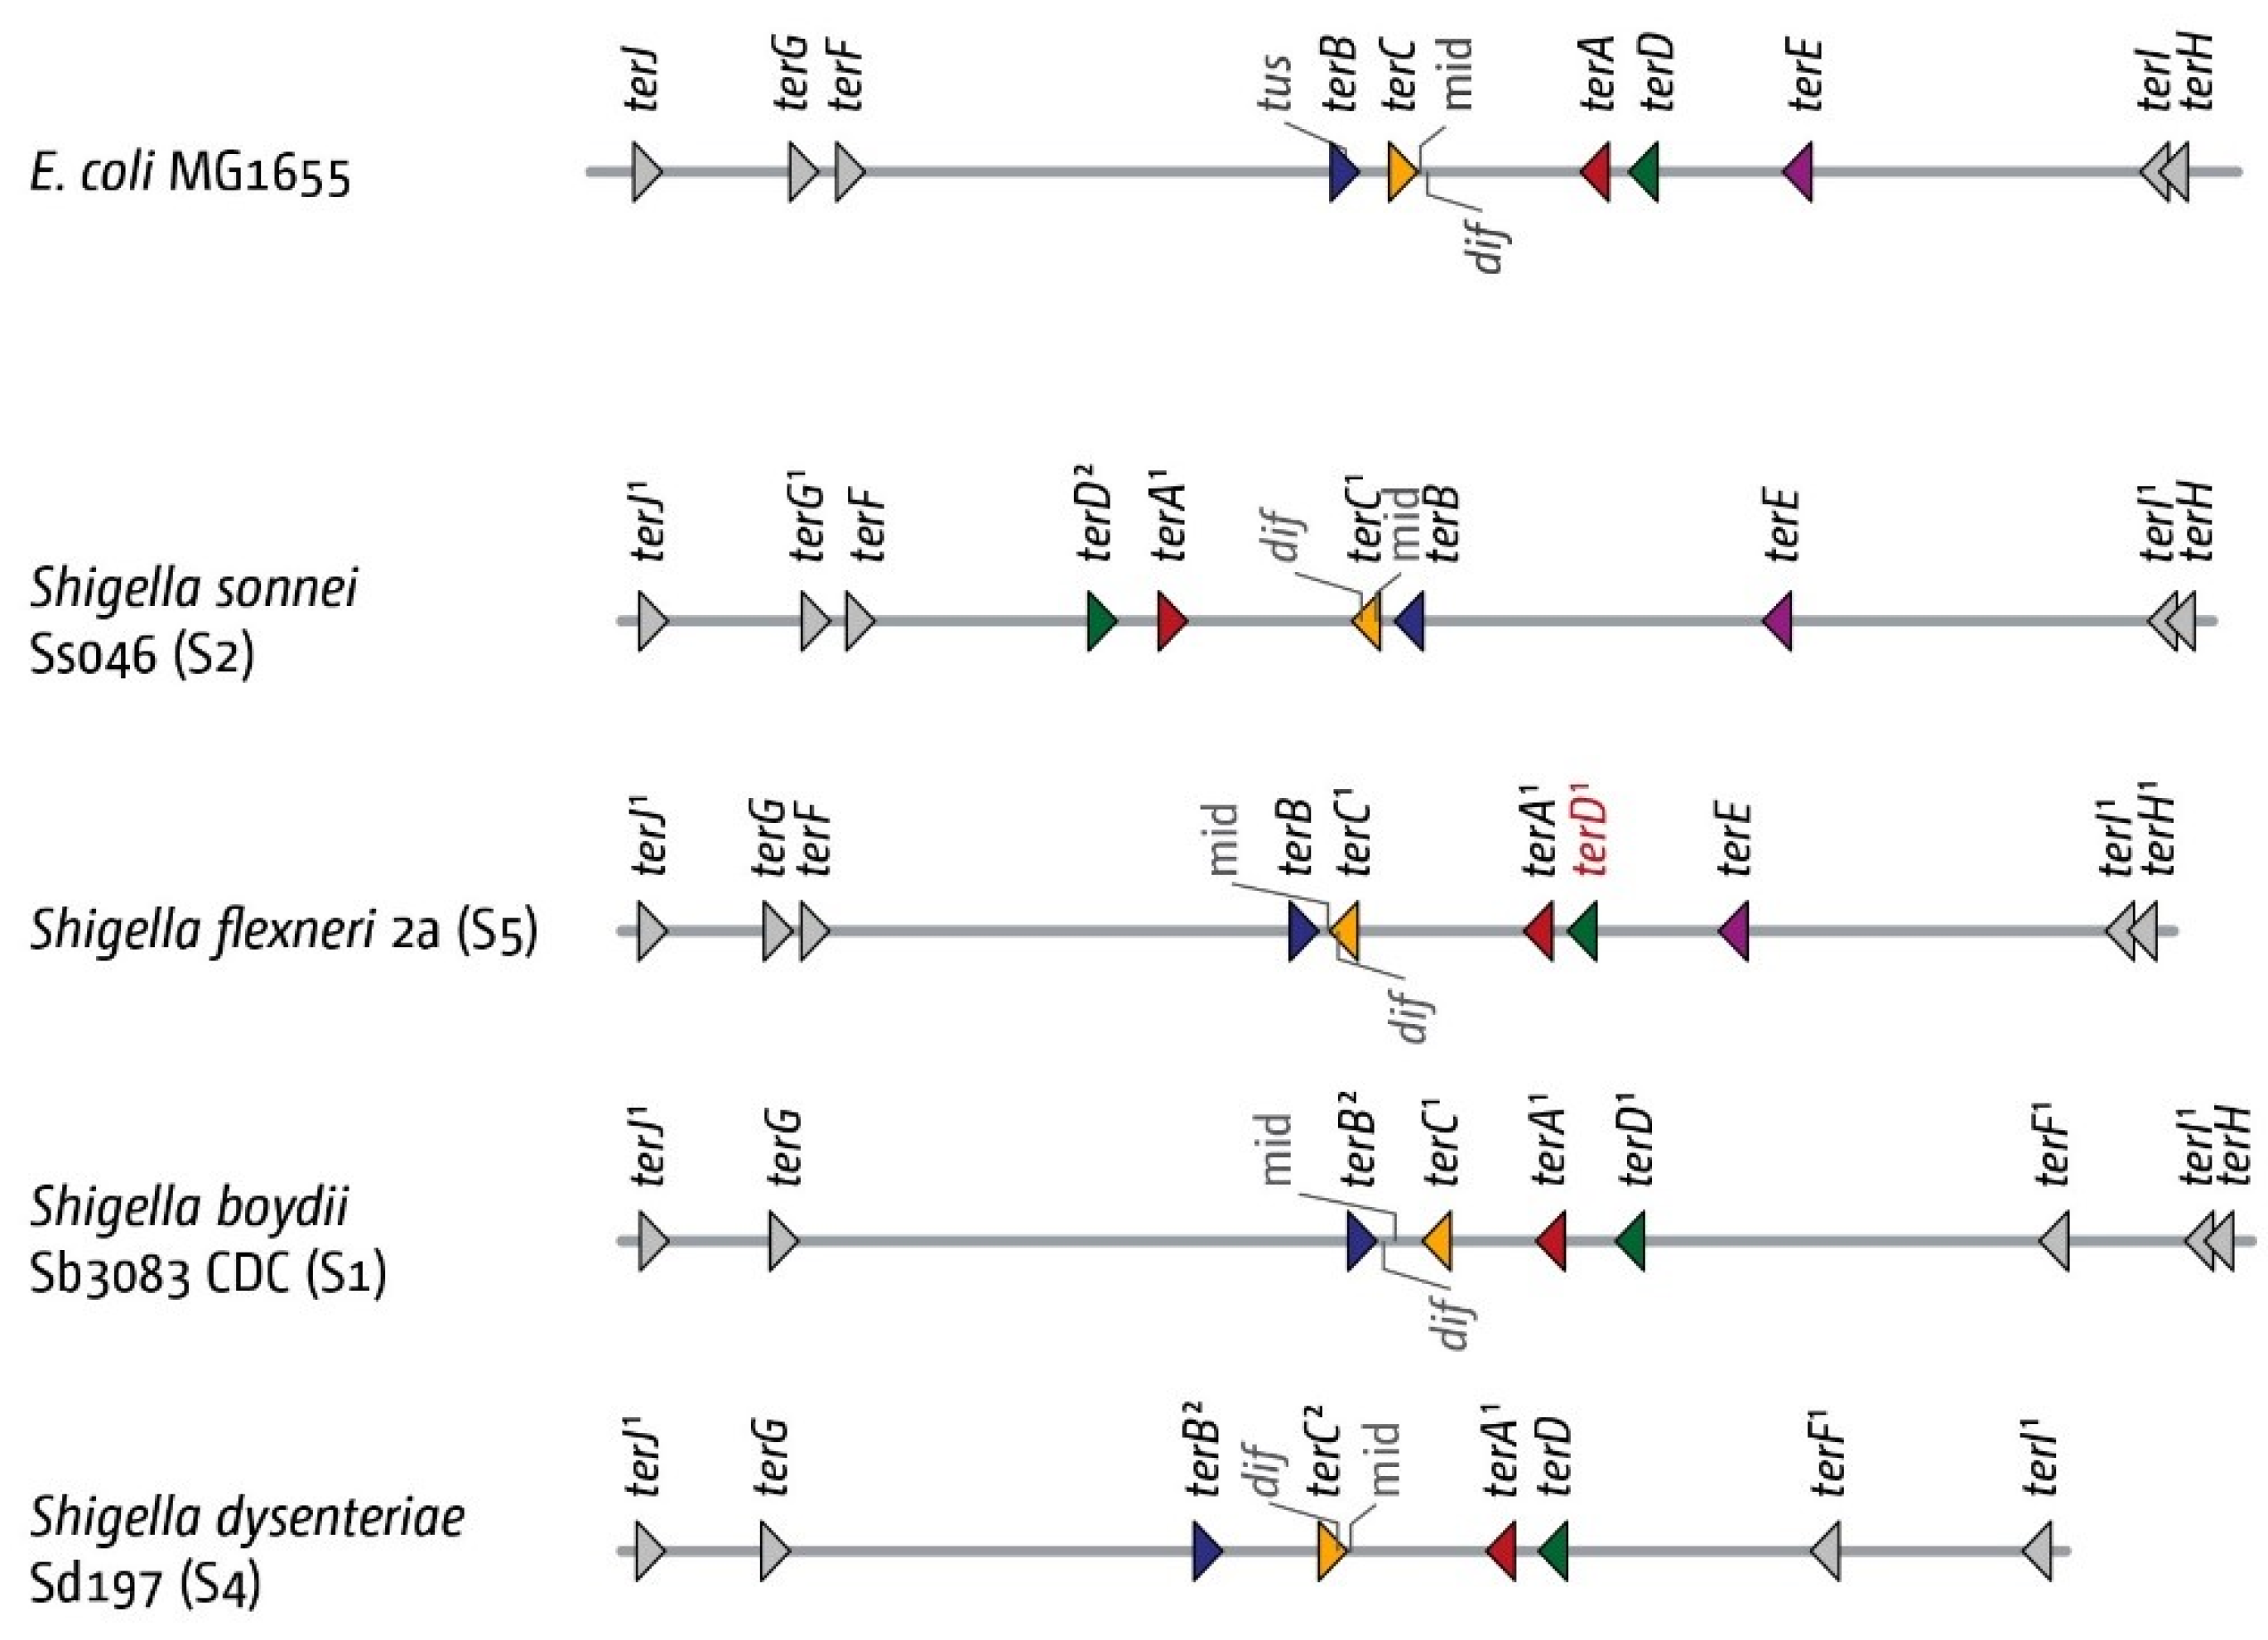
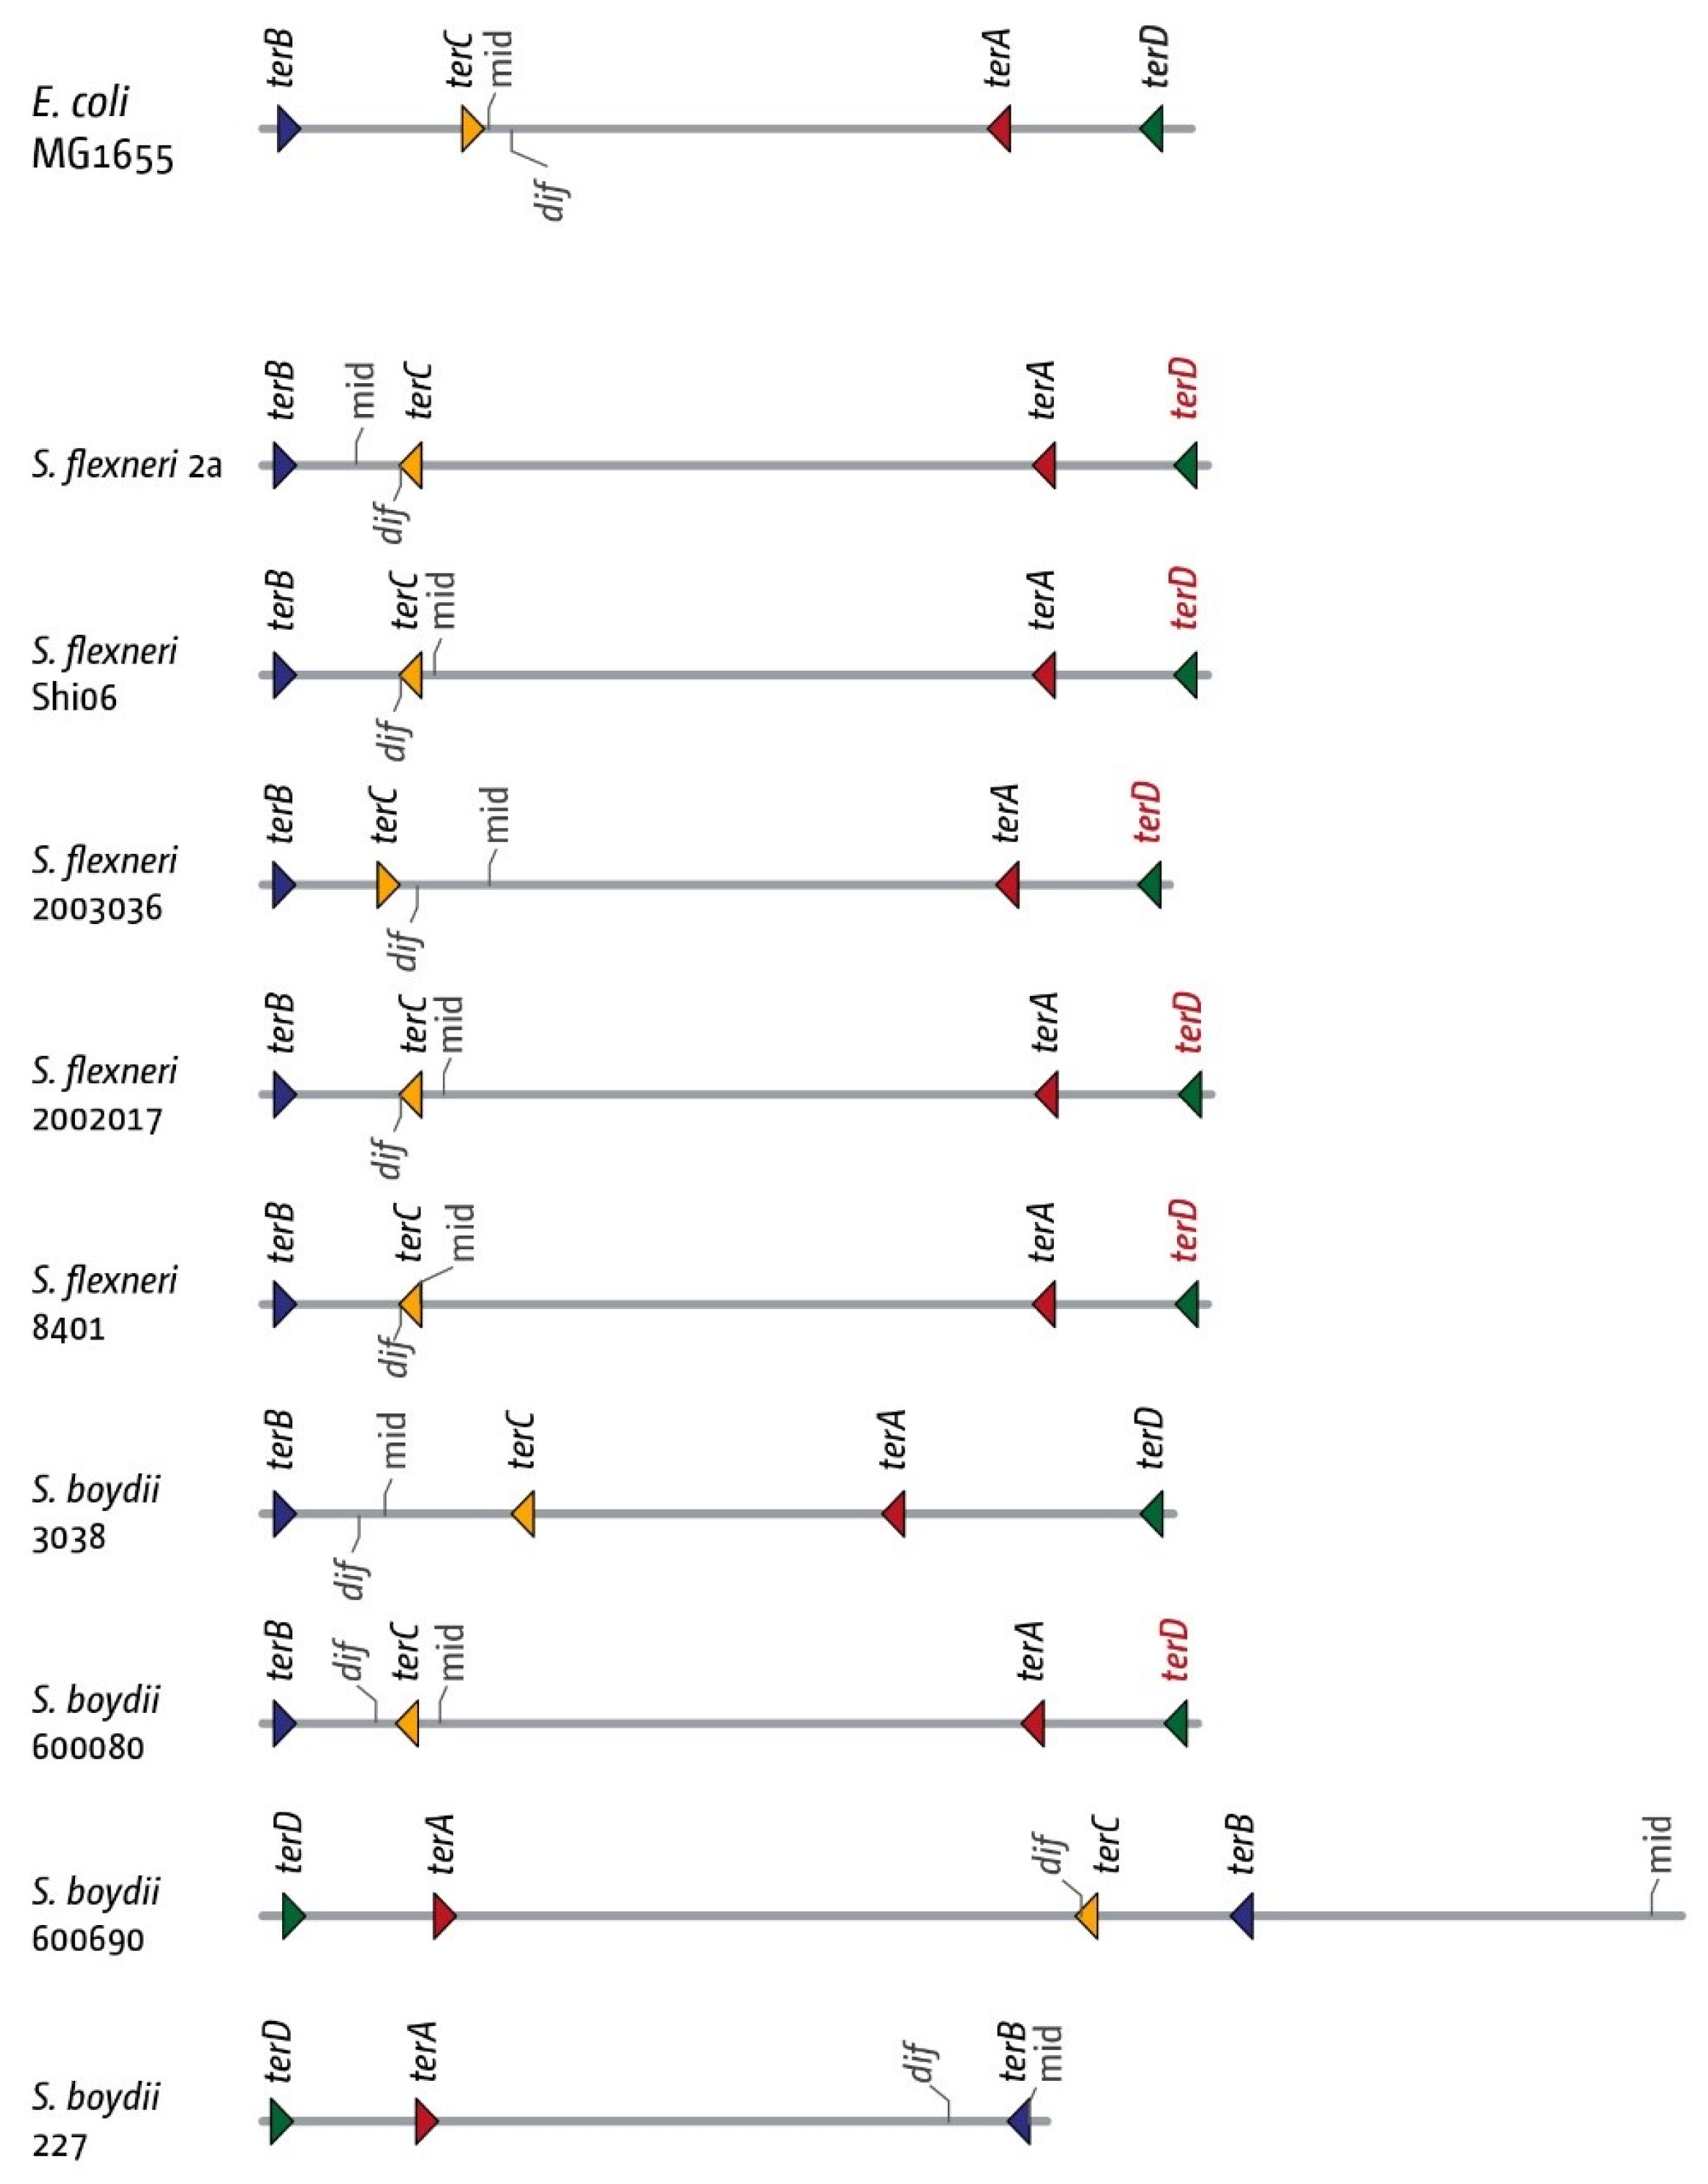
3.5. The Replication Fork Trap in Shigellae

Similar to E. coli, Shigellae can cause a wide range of illnesses in human and non-human primates. Shigellae are facultatively anaerobic, Gram-negative, rod-shaped bacteria that are non-motile [58]. Early studies based on population genetics have shown that Shigella strains fall within the E. coli clade [59]. A more detailed analysis has revealed that Shigella strains do not form a discrete group, but likely have arisen multiple independent times [27,28]. We therefore analysed the replication trap in Shigella flexneri, S. boydii, S. sonnei and S. dysenteriae, serotypes that were suggested to have arisen independently [28].
We found the four innermost ter sites in our initial analysis without difficulty (Figure 6), with exception of S. boydii 227, where we could not identify terC (Figure 7). Overall, there appears to be a higher degree of variability. In S. sonnei Ss046, we found all 10 ter sites, but the inner termination area appears to be inverted. While the inversion changes the relative architecture of the termination area, it leaves the fork trap intact. In S. flexneri, we were also able to identify all 10 ter sites, but for the terD sequence, the highly conserved G6 is changed to an A (Figure S7), suggesting that Tus binding as well as blocking activity will be much reduced [50]. terE was missing from all S. boydii genomes we analysed, and terF appears to have moved into the opposite replichore, an effect also seen in S. dysenteriae. We have not further analysed whether this was based on a translocation event or a change in the terE sequence, which, in E. coli, would be located between ter sites I and D. terH also appears to be missing in S. dysenteriae (Figure 6). Despite the increased variability in the relative positions of the ter sites, we have no indication that the existing ter sites might be inactive in Shigellae, as their ter core match the MG1655 consensus sequence (Figure S7).
The analysis of the Shigella genomes revealed an additional feature. In both S. boydii 3083 and S. flexneri 2a, the dif chromosome dimer resolution site is located between terC and B, rather than terA and C (Figure 6). In all E. coli genomes analysed, dif is located in between the innermost ter sites A and C. Indeed, it was proposed that the majority of fork fusions might take place at chromosome dimer resolution site dif, because the inversion point of the chromosomal GC skew indicated that replication must frequently terminate at dif [60]. Following this suggestion, both computer simulation studies and marker frequency analysis have provided data arguing against dif as the main fork fusion point [20,23,61,62].
However, the changed location of dif in some Shigella strains adds an additional argument to the discussion. In both S. boydii 3083 and S. flexneri 2a, the orientation of terC is changed: forks are forced to fuse between terB and C, rather than terA and C, as in E. coli. Thus, even though the relative position of dif has changed, it remains in the innermost termination area where forks fuse (Figure 6).
Following this observation, we analysed the termination area in a total of five S. flexneri and four S. boydii genomes. Out of five S. flexneri genomes, we found one where the architecture of the fork trap reflects the one found in MG1655. In all others, dif is located between ter sites C and B, with terC having changed orientation so that forks are trapped in between terC and terB. This change is often associated with a terD site where G6 is changed to an A (Figure S7). For S. boydii, we found one genome where dif is located in between terC and terA, as in MG1655. For this strain, the entire inner termination area is inverted, which leaves the functionality unaffected. In two further strains, we found dif to be located between terC and terB, and, as for S. flexneri, terC had a changed orientation, forcing forks to be trapped between terC and terB. Finally, in one strain we were unable to find terC (Figure 7; S. boydii 227).
As both dif and ter sites are asymmetric, their relative position can be easily determined. If terC is notated as in Figure 3, and dif is notated as GGTGCCATAATGTATATTATGTTAAAT [48], then in MG1655 both are located on different strands. Thus, the situation observed could have arisen from a small inversion that spans both terC and dif. Indeed, for S. boydii 600080, we observed that both terC and dif are on opposite strands to MG1655 (Figure 7). However, for all other S. boydii and S. flexneri genomes where dif is located between terC and terB, we found that only the relative location of terC has changed, placing terC and dif on the same strand (Figure 7). Thus, a more complex change must have taken place to lead to this arrangement, which makes it tempting to speculate that not only the replication fork trap per se but also the relative location of dif within it are an important feature of chromosomal architecture.

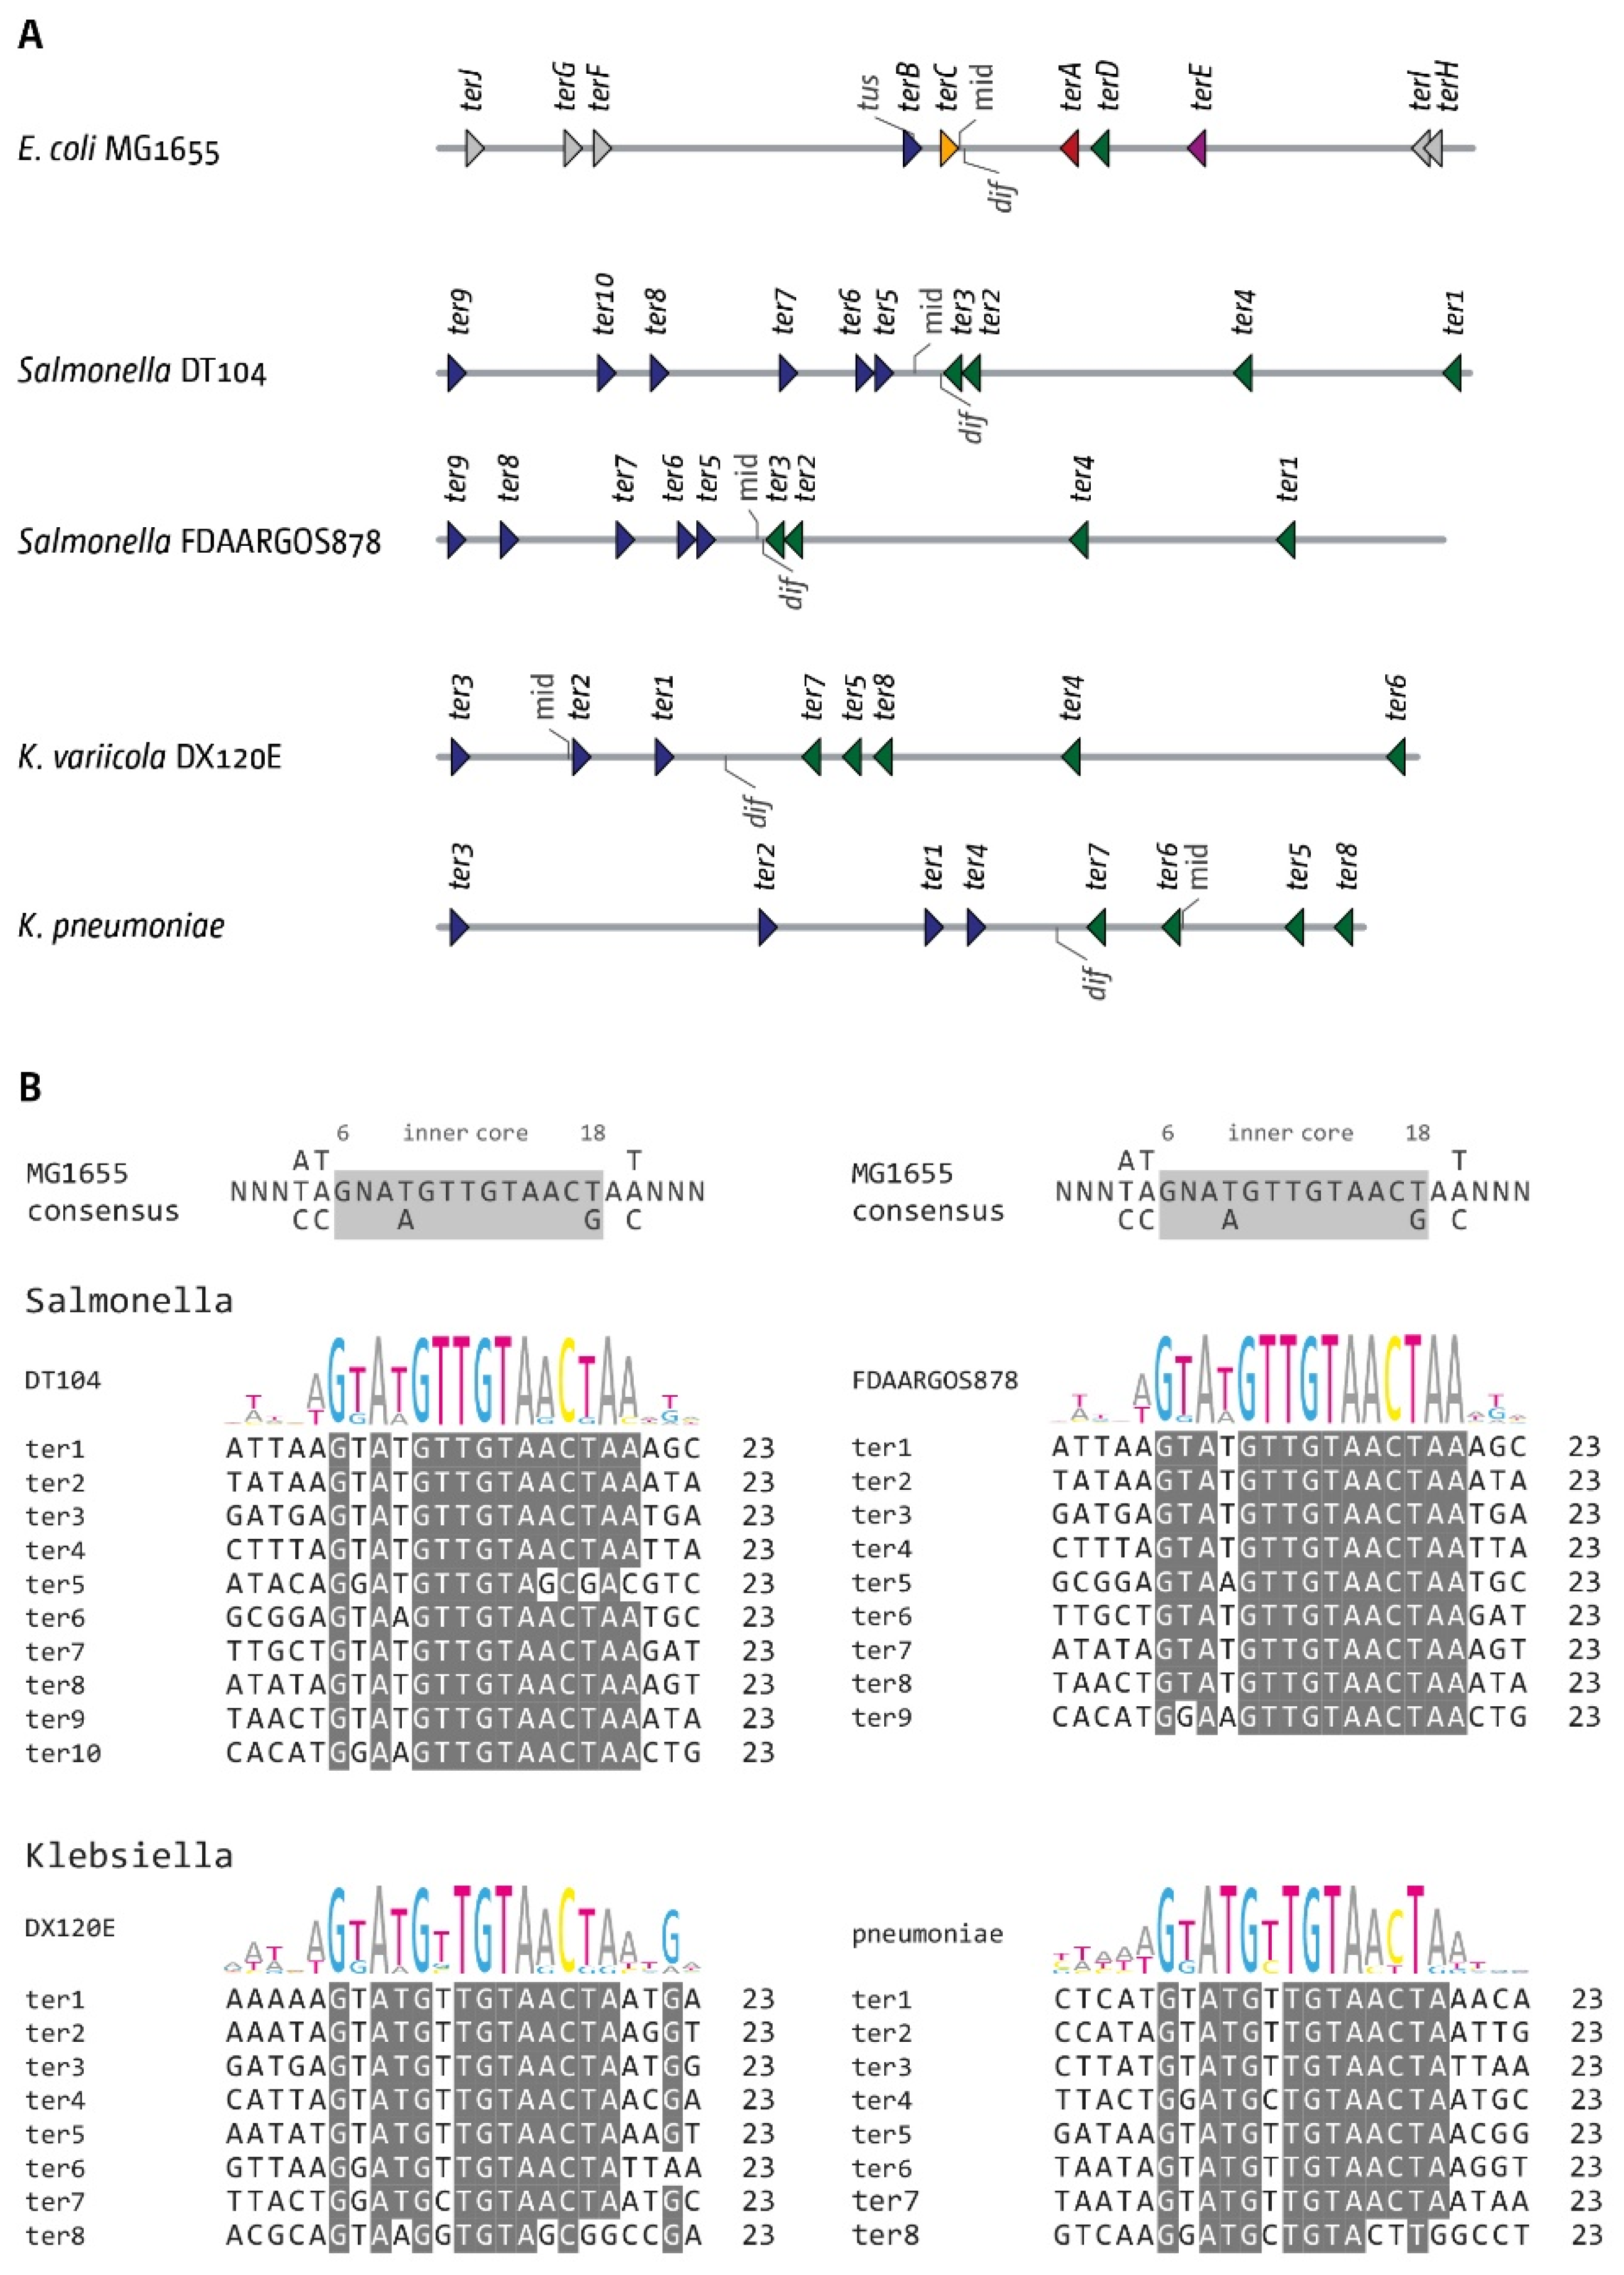
3.6. The Replication Fork Trap in Salmonella and Klebsiella

Another important question is how the replication fork trap might be structured in other bacterial species. tus-related sequences have been found in most Enterobacteriales [24], and it has been shown before that the expression of tus genes from Salmonella enterica, Klebsiella ozaenae and Yersinia pestis in E. coli resulted in the formation of functional ter/Tus complexes, even though the blocking activity of the heterologous complexes were not as strong [25,63]. However, the sequences of Tus from Salmonella, Klebsiella and Yersinia show substantial differences, and without a biochemical analysis it is not possible to deduce whether sequence variations seen in potential ter sites might lead to inactivation or are based on different interactions with the species-specific Tus protein.
To get at least some insight into the structure of fork traps in other species, we investigated two Salmonella enterica genomes, as well as Klebsiella variicola and Klebsiella pneumoniae genomes. To identify potential ter sites, we used precisely the same parameters as for Shigella, allowing a maximum of five mismatches. For all genomes, we excluded ter sites that had a number of mismatches throughout and, in addition, missed the critical G at position 6. All other potential ter sites found were included (Figure 8A). Given that a significant number of mismatches were observed in all putative ter sites (Figure 8B), we numbered them, rather than using the nomenclature used in E. coli.
Without the biochemical characterisation that the ter sites found are indeed active, the analysis must remain limited. However, all genomes show a pattern of putative ter sites that is strikingly similar to what is observed in E. coli. In both Salmonella genomes, we found an area opposite to oriC that is flanked by a tight pair of clustered ter sites. The chromosomal mid-point and dif chromosome dimer resolution site both are located between the innermost ter sites. We noted that the pair of ter sites on the left-hand side in Figure 8A is followed by another ter site, a pattern reminiscent of ter sites A, D and E in E. coli. Similarly, both in Klebsiella variicola and K. pneumoniae we found that the dif chromosome dimer resolution site was flanked by at least two ter sites which would form a trap. Interestingly, in these genomes, we found that the arithmetic mid-point is not located within the innermost ter sites. If these ter sites were to form functional ter/Tus complexes, this would be in line with our hypothesis that keeping the dif chromosome dimer resolution site close to the fork fusion point is one of the important functions of the replication fork trap. It will be intriguing to investigate this point further in future studies.

4. Discussion

While the biochemical aspects of ter/Tus complexes have been studied extensively, we still know surprisingly little about the precise physiological function of the replication fork trap. tus-related sequences have been found in most Enterobacteriales, in the Pseudoalteromonas and in most Aeromonadales [24]. A fork trap system is also present in the Bacillales, which involves ter sequences and the terminator protein RTP [24]. However, no similarity is found between the ter sequences in E. coli and B. subtilis nor between Tus and RTP, suggesting that these fork trap systems have evolved via convergent evolution [16]. These findings suggest that fork trap systems have an important role in DNA replication. However, early studies did not report any phenotype of cells lacking Tus [25], and our own growth curves showed only a very mild growth delay of cells lacking Tus protein (Table 1). Delays are slightly more pronounced in cells in which one fork almost always gets blocked at a ter/Tus complex [20,38], suggesting perhaps that the fork trap might be of particular importance in cells in which individual forks proceed beyond the boundaries of the termination area. Indeed, in normal growing cells, the majority of fork fusions take place at the chromosomal midpoint, away from any ter/Tus complexes [3,15,22,23].
If ter/Tus complexes do not normally contribute to the fork fusion process, when do they block fork progression, and of which forks? There is no doubt that the delay of one fork coming from oriC will result in the other being arrested at ter/Tus complexes. In normally growing wild-type cells, this scenario can be easily detected in vivo within a population, even though the numbers of arrested forks are relatively low [15]. One of the early hypotheses about the fork trap was that it prevents forks from entering the opposite replichore if the second fork is delayed at an obstacle, thereby preventing head-on clashes between replication and ongoing transcription [64]. However, why would this require a replication fork trap in E. coli that spans ~45% of the entire chromosome [5,16,17]? As the outer ter sites all are part of open reading frames, Duggin and Bell have predicted that these are pseudo ter sites that are conserved by selection pressure for the genes they are part of, rather than their functionality as a fork trap [15]. Our analysis of the secondary ter sites supports this idea (Figure 5). While the secondary ter sites K, L, Y and Z all have a very low fork blocking activity [15], the three ter sites associated with open reading frames are conserved. In contrast, terY is far more variable, both in terms of location and its precise sequence (Figure 5). The finding that ter sites with a low fork blocking activity are quite conserved if they are associated with ORFs supports the idea that the outer ter sites F–J might indeed be pseudo ter sites, as suggested by [15]. Interestingly, in MG1655, terE is not part of any ORF, but our analysis has shown that both terE as well as the surrounding sequences are surprisingly similar in all genomes investigated (Figure S6). Given that in wild-type cells no stalled forks were observed at terE [15], it is tempting to speculate that terE might also be a pseudo-ter site, with other currently unknown functional elements in the terE area driving the high similarity. This would leave the innermost ter sites A–D as the active replication fork trap, in line with the measured fork blocking activities [15].
In Shigellae, the replication fork trap appears to be somewhat more variable than in E. coli (Figure 6 and Figure 7). However, Shigella strains do not form a discrete group within E. coli, but have arisen multiple independent times [27,28], which will contribute to the variability observed. Nevertheless, the inner termination area still shows a great similarity in all the genomes we analysed (c.f. Figure 2 and Figure 6).
It was shown before that any gross asymmetry in replichore lengths in tus+ cells render the strain dependent on the RecA recombinase for viability [39], in line with results from ectopically inserted ter sites [18]. Such gross asymmetry also induced segregation defects [39]. These results suggest that a fork trap system might be involved in preventing the formation of major asymmetries in the length of the two replichores [39]. However, we also reported recently that when we engineered strains in which the native ter/Tus blocks got significantly in the way of DNA synthesis, the resulting strains were very quickly outgrown by cells carrying suppressor mutations, some of which showed gross chromosomal rearrangements (GCRs) that flipped all ter sites from restrictive to permissive orientations [3,38]. This demonstrates that if fork traps get significantly in the way of DNA synthesis, cells can lose these very quickly. In addition, our analysis shows that the innermost ter sites B–E were consistently outside of open reading frames (Table S4). If there was little or no selection pressure to keep these ter sites, a higher variability of all ter sites between the strains of the various phylogroups might be expected, precisely as observed for the secondary ter site terY (Figure 5), especially as the termination area in general and ter sites in particular are a recombination hotspot [65]. Some of the strains analysed show some gross chromosomal rearrangements in the termination area and elsewhere (SMS-3-5, IAI39; Figure S2), but these rearrangements only change the relative position of ter sites, while the fork trap itself was left intact (Figure S2).
Given that the fork trap is present in all strains investigated, are there additional clues that might clarify its function? In E. coli, a significant reported phenotype was in the context of R1 plasmid replication. For R1 replication, two forks are established, but one is arrested almost immediately and almost the entire plasmid is replicated unidirectionally by a single fork until it gets arrested as well at a single ter/Tus complex close to the plasmid origin [66]. Inactivation of this ter/Tus complex resulted in the accumulation of a variety of aberrant branched structures, including rolling circle replication intermediates and plasmid multimers [67]. A similar generation of complex structures was reported in vitro for a plasmid substrate, where functional ter/Tus complexes efficiently prevented over-replication and the formation of complex intermediates [68], a result recently confirmed in ‘replication chain reaction’ experiments [69]. Importantly, Krabbe and co-workers were able to show that generation of these intermediates interfered significantly with successful plasmid segregation [67]. Thus, the absence of a functional ter/Tus system triggers segregation defects and plasmid loss, which will impose a strong selection pressure.
Notably, Galli et al. found that the tus gene in the Pseudoalteromonadacae is systematically associated with the secondary chromosome, which is of plasmid origin. On this chromosome, the tus gene is always located next to the origin of replication [24]. The fact that in E. coli terB is located within the promoter region of tus [25] makes it tempting to speculate that the same is true for the Pseudoalteromonadacae, and the GC skew for the secondary chromosome in Pseudoalteromonas haloplanktis fits a unidirectional replication mode [70,71], suggesting that the mode of replication is similar to R1. If so, then the fork trap systems in R1 and the Pseudoalteromonadacae will be preventing the formation of aberrant termination intermediates that interfere with successful segregation.
The need for preventing the formation of fork fusion intermediates might have been the advantage when the fork trap system migrated into the E. coli chromosome. The absence of Tus results in mild over-replication of the chromosome [23,33] (Figure S1). This over-replication can be significantly exacerbated by additional mutations in PolI, RecG or 3′ exonucleases [23,33,34,35,36,37], suggesting that these enzymes are processing complex branched intermediates that form as a result of fork fusion events. In their absence, the intermediates persist for longer than normal, as suggested for R1 replication [3,5,23,34]. This hypothesis is supported by the observation that over-replication in cells lacking either RecG or 3′-exonucleases is significantly reduced following linearisation of the chromosome in the termination area, which prevents replication forks from fusing [5,23,72], and by the fact that over-replication can be induced in ectopic chromosomal locations in the absence of RecG if replication forks are forced to fuse here [37]. These observations are in line with the idea that intermediates formed as part of termination can trigger replication restart and lead to chromosomal over-replication. Importantly, this over-replication is normally contained within the termination area, where it can be rapidly processed, thereby leading to successful and accurate termination [34,72,73]. One important role of the fork trap, therefore, might be to prevent over-replication from duplicating extensive areas of the chromosome. This would involve forks that are not initiated at the origin, but are coming from other areas of the chromosome. Indeed, this hypothesis might also contribute to the explanation for our observation that the essential genes for RNA metabolism (Figure S4) are excluded from the termination area. If nucleolytic processing is taking place in this area on a regular basis to remove over-replication intermediates, the presence of essential genes would be expected to be quite dangerous. Any processing error that threatens the integrity of such a gene would have lethal consequences. Obviously, other effects, such as gene dosage, might also contribute and have been discussed [74].
Our findings in Shigellae might add another facet to the debate. We observed a correlation between a shift in the location of the chromosome dimer resolution site dif and a corresponding change in the precise location of the innermost termination area (Figure 6 and Figure 7). In order to successfully resolve chromosomal dimers in E. coli, the two dif have to be brought into close proximity, which then allows resolution by the site-specific recombinase XerCD (Figure 9A) [48]. This resolution process will work best if exactly two copies of dif are present, as otherwise there might be a chance of the wrong dif copies being used for resolution or, in case of an over-replicated termination area, a link between the chromosomes might remain (Figure 9B). Indeed, in Vibrio cholerae, the two existing dif sequences, while similar, show five different base pairs [48], which will prevent recombination between the two chromosomes. The availability of dif for dimer resolution also needs to be restricted. If two copies of dif were available before chromosome duplication is completed, unwanted resolution events might happen in the absence of a dimer. While computational analysis shows that dif and the natural fork termination point are not the same [61], the dif site is located in the termination area of the chromosome in the majority of bacterial chromosomes analysed [61]. In fact, in all genomes analysed in this study, dif was located inside the innermost ter sites, while the theoretical mid-point where forks would fuse if they moved at the same speed was far more variable (Figure 2, Figure 6, Figure 7, Figure 8 and Figure S2). Indeed, when we artificially moved dif outside of the termination area beyond terB, we found a significant elongation of the doubling time (Table S5). Thus, it appears that the arrangement of having the dif site located within the innermost ter sites ensures that two dif sites only become available for dimer resolution when the duplication process is essentially complete. These dif sites will only remain in close proximity for any length of time if chromosomes are dimerised. If chromosomes are successfully separated, segregation will move them apart. However, if chromosome over-replication in the termination area generates additional copies of dif, this will be problematic for chromosome dimer resolution unless the over-replication is contained and quickly processed (Figure 9).
The data available show that the purpose of the architecture of the replication fork trap in E. coli is unlikely to be the coordination of fork fusions. Instead, it is far more likely that one main function of the replication fork trap is to contain intermediates that can be formed as part of the final stages of DNA replication. Thus, it will prevent a fork coming from oriC from migrating out of the termination area, but it will also prevent progress of forks initiated elsewhere, including synthesis within the fork trap area as part of termination. The rapid processing of such intermediates will prevent a delay in full genome replication, but the removal of over-replicated sections will also allow control of the copy number of dif, ultimately leading to successful completion of DNA synthesis and chromosome segregation. Maintaining replichore directionality to avoid replication–transcription conflicts will indeed be a welcome side effect, but it is unlikely that it is the main driver for maintaining a fork trap area, especially as there is little indication that forks moving beyond the fork trap boundaries encounter major difficulties [20,38].
In addition, it was also proposed that ter/Tus complexes are involved in the coordination of chromosome segregation and cell division [24]. The protein MatP is specific for binding to the chromosomal Ter domain [8]. MatP not only connects the chromosome and the divisome, but also inhibits MukBEF activity, which contributes to forming an individual functional chromosomal domain [75]. A fork trap system will help to ensure that upon completion of DNA replication, the chromosomal Ter domain is positioned at mid-cell, as suggested [24]. Thus, it appears that the replication fork trap area might offer multiple interconnected benefits that contribute towards successful chromosome segregation.

Supplementary Materials

The following are available online at https://www.mdpi.com/article/10.3390/ijms22157928/s1, Figure S1: Replication termination in E. coli cells in the presence and absence of a functional replication fork trap, Figure S2: Architecture of the replication fork trap in genomes from groups of E. coli genomes representing the phylogenetic groups A, B1, B2, D and E, Figure S3: Sequence comparison of all ter sites across all phylogenetic groups from all E. coli genomes analysed, with the MG1655 sequences as reference, Figure S4: Location and distribution of genes and genetic markers involved in termination of DNA replication as well as translation, Figure S5: Location and relative order of aminoacyl tRNA synthetase genes within the chromosomes of the E. coli phylogroups A (MG1655), B1 (APEC078), B2 (S88), D (UMN026) and E (TW14359), Figure S6: Sequence comparison of all ter sites, including 25 bp upstream as well as downstream, across all phylogenetic groups from all E. coli genomes analysed, with the MG1655 sequences as reference, Figure S7: Sequence comparison of all ter sites across all serotypes from all Shigella genomes analysed, Table S1: Escherichia coli K12 strains, Table S2: List of all E. coli genomes used in this study, including NCBI nucleotide database access links, Table S3: List of all Shigella, Salmonella and Klebsiella genomes used in this study, including NCBI nucleotide database access links, Table S4: Location of the 10 major ter sites in relation to predicted open reading frames within the 5 main E. coli phylogenetic groups, Figure S5: Doubling times of E. coli strains with the chromosome dimer resolution site dif in its native or an ectopic location.

Author Contributions

Conceptualization, C.J.R.; methodology, D.J.G., K.H.J. and C.J.R.; software, D.J.G.; validation, M.H. and C.J.R.; formal analysis, C.J.R.; investigation, D.J.G. and K.H.J.; resources, M.H. and C.J.R.; data curation, C.J.R.; writing—original draft preparation, C.J.R.; writing—review and editing, D.J.G., K.H.J., M.H. and C.J.R.; visualization, D.J.G., K.H.J. and C.J.R.; supervision, M.H. and C.J.R.; project administration, C.J.R.; funding acquisition, M.H. and C.J.R. All authors have read and agreed to the published version of the manuscript.

Funding

The work was supported by Research Grant BB/N014995/1 from the Biotechnology and Biological Sciences Research Council to MH and CJR.

Institutional Review Board Statement

Not applicable.

Informed Consent Statement

Not applicable.

Data Availability Statement

The genome data presented in this study are openly available in the NCBI nucleotide database. All relevant accession numbers are provided in Supplementary Tables S2 and S3. All scripts used in this study and described in Material & Methods can be accessed via Github (see Section 2.8). All other data are contained within this article and its Supplementary Material.

Acknowledgments

The authors would like to thank Juachi Dimude for providing the ectopic dif strain, Ronan McCarthy and Ashley Houlden for critical reading of the manuscript, and five anonymous referees for their helpful and constructive comments.

Conflicts of Interest

The authors declare no conflict of interest.

References

  1. Mott, M.L.; Berger, J.M. DNA Replication Initiation: Mechanisms and Regulation in Bacteria. Nat. Rev. Microbiol. 2007, 5, 343–354. [Google Scholar] [CrossRef]
  2. Chodavarapu, S.; Kaguni, J.M. Replication Initiation in Bacteria. Enzymes 2016, 39, 1–30. [Google Scholar] [CrossRef] [Green Version]
  3. Syeda, A.H.; Dimude, J.U.; Skovgaard, O.; Rudolph, C.J. Too Much of a Good Thing: How Ectopic DNA Replication Affects Bacterial Replication Dynamics. Front. Microbiol. 2020, 11, 534. [Google Scholar] [CrossRef]
  4. Blattner, F.R.; Plunkett, G.; Bloch, C.A.; Perna, N.T.; Burland, V.; Riley, M.; Collado-Vides, J.; Glasner, J.D.; Rode, C.K.; Mayhew, G.F.; et al. The Complete Genome Sequence of Escherichia coli K-12. Science 1997, 277, 1453–1462. [Google Scholar] [CrossRef] [Green Version]
  5. Dimude, J.U.; Midgley-Smith, S.L.; Stein, M.; Rudolph, C.J. Replication Termination: Containing Fork Fusion-Mediated Pathologies in Escherichia coli. Genes 2016, 7, 40. [Google Scholar] [CrossRef] [Green Version]
  6. Liu, X.; Wang, X.; Reyes-Lamothe, R.; Sherratt, D. Replication-Directed Sister Chromosome Alignment in Escherichia coli. Mol. Microbiol. 2010, 75, 1090–1097. [Google Scholar] [CrossRef] [PubMed] [Green Version]
  7. Duigou, S.; Boccard, F. Long Range Chromosome Organization in Escherichia coli: The Position of the Replication Origin Defines the Non-Structured Regions and the Right and Left Macrodomains. PLoS Genet. 2017, 13, e1006758. [Google Scholar] [CrossRef] [PubMed] [Green Version]
  8. Verma, S.C.; Qian, Z.; Adhya, S.L. Architecture of the Escherichia coli Nucleoid. PLoS Genet. 2019, 15, e1008456. [Google Scholar] [CrossRef] [Green Version]
  9. Mercier, R.; Petit, M.-A.; Schbath, S.; Robin, S.; El Karoui, M.; Boccard, F.; Espéli, O. The MatP/MatS Site-Specific System Organizes the Terminus Region of the E. coli Chromosome into a Macrodomain. Cell 2008, 135, 475–485. [Google Scholar] [CrossRef] [PubMed] [Green Version]
  10. den Blaauwen, T. Prokaryotic Cell Division: Flexible and Diverse. Curr. Opin. Microbiol. 2013, 16, 738–744. [Google Scholar] [CrossRef] [PubMed]
  11. Barre, F.-X. FtsK and SpoIIIE: The Tale of the Conserved Tails. Mol. Microbiol. 2007, 66, 1051–1055. [Google Scholar] [CrossRef]
  12. Sherratt, D.J.; Arciszewska, L.K.; Crozat, E.; Graham, J.E.; Grainge, I. The Escherichia coli DNA Translocase FtsK. Biochem. Soc. Trans. 2010, 38, 395–398. [Google Scholar] [CrossRef]
  13. Bigot, S.; Saleh, O.A.; Lesterlin, C.; Pages, C.; El Karoui, M.; Dennis, C.; Grigoriev, M.; Allemand, J.-F.; Barre, F.-X.; Cornet, F. KOPS: DNA Motifs That Control, E. coli Chromosome Segregation by Orienting the FtsK Translocase. EMBO J. 2005, 24, 3770–3780. [Google Scholar] [CrossRef] [Green Version]
  14. Levy, O.; Ptacin, J.L.; Pease, P.J.; Gore, J.; Eisen, M.B.; Bustamante, C.; Cozzarelli, N.R. Identification of Oligonucleotide Sequences That Direct the Movement of the Escherichia coli FtsK Translocase. Proc. Natl. Acad. Sci. USA 2005, 102, 17618–17623. [Google Scholar] [CrossRef] [Green Version]
  15. Duggin, I.G.; Bell, S.D. Termination Structures in the Escherichia coli Chromosome Replication Fork Trap. J. Mol. Biol. 2009, 387, 532–539. [Google Scholar] [CrossRef]
  16. Neylon, C.; Kralicek, A.V.; Hill, T.M.; Dixon, N.E. Replication Termination in Escherichia coli: Structure and Antihelicase Activity of the Tus-Ter Complex. Microbiol. Mol. Biol. Rev. MMBR 2005, 69, 501–526. [Google Scholar] [CrossRef] [PubMed] [Green Version]
  17. Duggin, I.G.; Wake, R.G.; Bell, S.D.; Hill, T.M. The Replication Fork Trap and Termination of Chromosome Replication. Mol. Microbiol. 2008, 70, 1323–1333. [Google Scholar] [CrossRef]
  18. Bidnenko, V.; Ehrlich, S.D.; Michel, B. Replication Fork Collapse at Replication Terminator Sequences. EMBO J. 2002, 21, 3898–3907. [Google Scholar] [CrossRef] [PubMed] [Green Version]
  19. Moolman, M.C.; Tiruvadi Krishnan, S.; Kerssemakers, J.W.J.; de Leeuw, R.; Lorent, V.; Sherratt, D.J.; Dekker, N.H. The Progression of Replication Forks at Natural Replication Barriers in Live Bacteria. Nucleic Acids Res. 2016. [Google Scholar] [CrossRef] [PubMed] [Green Version]
  20. Ivanova, D.; Taylor, T.; Smith, S.L.; Dimude, J.U.; Upton, A.L.; Mehrjouy, M.M.; Skovgaard, O.; Sherratt, D.J.; Retkute, R.; Rudolph, C.J. Shaping the Landscape of the Escherichia coli Chromosome: Replication-Transcription Encounters in Cells with an Ectopic Replication Origin. Nucleic Acids Res. 2015, 43, 7865–7877. [Google Scholar] [CrossRef] [PubMed] [Green Version]
  21. Labib, K.; Hodgson, B. Replication Fork Barriers: Pausing for a Break or Stalling for Time? EMBO Rep. 2007, 8, 346–353. [Google Scholar] [CrossRef] [Green Version]
  22. Bouché, J.P.; Gélugne, J.P.; Louarn, J.; Louarn, J.M.; Kaiser, K. Relationships between the Physical and Genetic Maps of a 470 × 10(3) Base-Pair Region around the Terminus of Escherichia coli K12 DNA Replication. J. Mol. Biol. 1982, 154, 21–32. [Google Scholar] [CrossRef]
  23. Rudolph, C.J.; Upton, A.L.; Stockum, A.; Nieduszynski, C.A.; Lloyd, R.G. Avoiding Chromosome Pathology When Replication Forks Collide. Nature 2013, 500, 608–611. [Google Scholar] [CrossRef] [Green Version]
  24. Galli, E.; Ferat, J.-L.; Desfontaines, J.-M.; Val, M.-E.; Skovgaard, O.; Barre, F.-X.; Possoz, C. Replication Termination without a Replication Fork Trap. Sci. Rep. 2019, 9, 8315. [Google Scholar] [CrossRef] [PubMed] [Green Version]
  25. Roecklein, B.; Pelletier, A.; Kuempel, P. The tus Gene of Escherichia coli: Autoregulation, Analysis of Flanking Sequences and Identification of a Complementary System in Salmonella Typhimurium. Res. Microbiol. 1991, 142, 169–175. [Google Scholar] [CrossRef]
  26. Hill, T.M. Arrest of Bacterial DNA Replication. Annu. Rev. Microbiol. 1992, 46, 603–633. [Google Scholar] [CrossRef] [PubMed]
  27. Pupo, G.M.; Lan, R.; Reeves, P.R. Multiple Independent Origins of Shigella Clones of Escherichia coli and Convergent Evolution of Many of Their Characteristics. Proc. Natl. Acad. Sci. USA 2000, 97, 10567–10572. [Google Scholar] [CrossRef] [Green Version]
  28. Sahl, J.W.; Morris, C.R.; Emberger, J.; Fraser, C.M.; Ochieng, J.B.; Juma, J.; Fields, B.; Breiman, R.F.; Gilmour, M.; Nataro, J.P.; et al. Defining the Phylogenomics of Shigella Species: A Pathway to Diagnostics. J. Clin. Microbiol. 2015, 53, 951–960. [Google Scholar] [CrossRef] [Green Version]
  29. Thomason, L.C.; Costantino, N.; Court, D.L. E. coli Genome Manipulation by P1 Transduction. Curr. Protoc. Mol. Biol. 2007. [Google Scholar] [CrossRef]
  30. Datsenko, K.A.; Wanner, B.L. One-Step Inactivation of Chromosomal Genes in Escherichia coli K-12 Using PCR Products. Proc. Natl. Acad. Sci. USA 2000, 97, 6640–6645. [Google Scholar] [CrossRef] [Green Version]
  31. Luria, S.E.; Burrous, J.W. Hybridization between Escherichia coli and Shigella. J. Bacteriol. 1957, 74, 461–476. [Google Scholar] [CrossRef] [Green Version]
  32. Delcher, A.L.; Bratke, K.A.; Powers, E.C.; Salzberg, S.L. Identifying Bacterial Genes and Endosymbiont DNA with Glimmer. Bioinforma. Oxf. Engl. 2007, 23, 673–679. [Google Scholar] [CrossRef] [PubMed]
  33. Markovitz, A. A New in Vivo Termination Function for DNA Polymerase I of Escherichia coli K12. Mol. Microbiol. 2005, 55, 1867–1882. [Google Scholar] [CrossRef] [PubMed]
  34. Rudolph, C.J.; Upton, A.L.; Lloyd, R.G. Replication Fork Collisions Cause Pathological Chromosomal Amplification in Cells Lacking RecG DNA Translocase. Mol. Microbiol. 2009, 74, 940–955. [Google Scholar] [CrossRef] [Green Version]
  35. Wendel, B.M.; Courcelle, C.T.; Courcelle, J. Completion of DNA Replication in Escherichia coli. Proc. Natl. Acad. Sci. USA 2014, 111, 16454–16459. [Google Scholar] [CrossRef] [Green Version]
  36. Dimude, J.U.; Stockum, A.; Midgley-Smith, S.L.; Upton, A.L.; Foster, H.A.; Khan, A.; Saunders, N.J.; Retkute, R.; Rudolph, C.J. The Consequences of Replicating in the Wrong Orientation: Bacterial Chromosome Duplication without an Active Replication Origin. mBio 2015, 6. [Google Scholar] [CrossRef] [Green Version]
  37. Midgley-Smith, S.L.; Dimude, J.U.; Taylor, T.; Forrester, N.M.; Upton, A.L.; Lloyd, R.G.; Rudolph, C.J. Chromosomal Over-Replication in Escherichia coli recG Cells Is Triggered by Replication Fork Fusion and Amplified If Replichore Symmetry Is Disturbed. Nucleic Acids Res. 2018, 46, 7701–7715. [Google Scholar] [CrossRef] [Green Version]
  38. Dimude, J.U.; Stein, M.; Andrzejewska, E.E.; Khalifa, M.S.; Gajdosova, A.; Retkute, R.; Skovgaard, O.; Rudolph, C.J. Origins Left, Right, and Centre: Increasing the Number of Initiation Sites in the Escherichia coli Chromosome. Genes 2018, 9, 376. [Google Scholar] [CrossRef] [Green Version]
  39. Esnault, E.; Valens, M.; Espéli, O.; Boccard, F. Chromosome Structuring Limits Genome Plasticity in Escherichia coli. PLoS Genet. 2007, 3, e226. [Google Scholar] [CrossRef] [PubMed]
  40. De Castro Stoppe, N.; Silva, J.S.; Carlos, C.; Sato, M.I.Z.; Saraiva, A.M.; Ottoboni, L.M.M.; Torres, T.T. Worldwide Phylogenetic Group Patterns of Escherichia coli from Commensal Human and Wastewater Treatment Plant Isolates. Front. Microbiol. 2017, 8. [Google Scholar] [CrossRef] [Green Version]
  41. Rasko, D.A.; Rosovitz, M.J.; Myers, G.S.A.; Mongodin, E.F.; Fricke, W.F.; Gajer, P.; Crabtree, J.; Sebaihia, M.; Thomson, N.R.; Chaudhuri, R.; et al. The Pangenome Structure of Escherichia coli: Comparative Genomic Analysis of E. coli Commensal and Pathogenic Isolates. J. Bacteriol. 2008, 190, 6881–6893. [Google Scholar] [CrossRef] [Green Version]
  42. Abram, K.; Udaondo, Z.; Bleker, C.; Wanchai, V.; Wassenaar, T.M.; Robeson, M.S.; Ussery, D.W. Mash-Based Analyses of Escherichia coli Genomes Reveal 14 Distinct Phylogroups. Commun. Biol. 2021, 4, 117. [Google Scholar] [CrossRef]
  43. Herzer, P.J.; Inouye, S.; Inouye, M.; Whittam, T.S. Phylogenetic Distribution of Branched RNA-Linked Multicopy Single-Stranded DNA among Natural Isolates of Escherichia coli. J. Bacteriol. 1990, 172, 6175–6181. [Google Scholar] [CrossRef] [Green Version]
  44. Clermont, O.; Bonacorsi, S.; Bingen, E. Rapid and Simple Determination of the Escherichia coli Phylogenetic Group. Appl. Environ. Microbiol. 2000, 66, 4555–4558. [Google Scholar] [CrossRef] [Green Version]
  45. Picard, B.; Garcia, J.S.; Gouriou, S.; Duriez, P.; Brahimi, N.; Bingen, E.; Elion, J.; Denamur, E. The Link between Phylogeny and Virulence in Escherichia coli Extraintestinal Infection. Infect. Immun. 1999, 67, 546–553. [Google Scholar] [CrossRef] [PubMed] [Green Version]
  46. Sims, G.E.; Kim, S.-H. Whole-Genome Phylogeny of Escherichia coli/Shigella Group by Feature Frequency Profiles (FFPs). Proc. Natl. Acad. Sci. USA 2011, 108, 8329–8334. [Google Scholar] [CrossRef] [PubMed] [Green Version]
  47. Breier, A.M.; Weier, H.-U.G.; Cozzarelli, N.R. Independence of Replisomes in Escherichia coli Chromosomal Replication. Proc. Natl. Acad. Sci. USA 2005, 102, 3942–3947. [Google Scholar] [CrossRef] [Green Version]
  48. Castillo, F.; Benmohamed, A.; Szatmari, G. Xer Site Specific Recombination: Double and Single Recombinase Systems. Front. Microbiol. 2017, 8, 453. [Google Scholar] [CrossRef] [PubMed] [Green Version]
  49. Kamada, K.; Horiuchi, T.; Ohsumi, K.; Shimamoto, N.; Morikawa, K. Structure of a Replication-Terminator Protein Complexed with DNA. Nature 1996, 383, 598–603. [Google Scholar] [CrossRef]
  50. Coskun-Ari, F.F.; Hill, T.M. Sequence-Specific Interactions in the Tus-Ter Complex and the Effect of Base Pair Substitutions on Arrest of DNA Replication in Escherichia coli. J. Biol. Chem. 1997, 272, 26448–26456. [Google Scholar] [CrossRef] [PubMed] [Green Version]
  51. Touchon, M.; Hoede, C.; Tenaillon, O.; Barbe, V.; Baeriswyl, S.; Bidet, P.; Bingen, E.; Bonacorsi, S.; Bouchier, C.; Bouvet, O.; et al. Organised Genome Dynamics in the Escherichia coli Species Results in Highly Diverse Adaptive Paths. PLOS Genet. 2009, 5, e1000344. [Google Scholar] [CrossRef] [Green Version]
  52. Leimbach, A.; Poehlein, A.; Vollmers, J.; Görlich, D.; Daniel, R.; Dobrindt, U. No Evidence for a Bovine Mastitis Escherichia coli Pathotype. BMC Genom. 2017, 18, 359. [Google Scholar] [CrossRef]
  53. Mulcair, M.D.; Schaeffer, P.M.; Oakley, A.J.; Cross, H.F.; Neylon, C.; Hill, T.M.; Dixon, N.E. A Molecular Mousetrap Determines Polarity of Termination of DNA Replication in E. coli. Cell 2006, 125, 1309–1319. [Google Scholar] [CrossRef] [PubMed]
  54. Robert, X.; Gouet, P. Deciphering Key Features in Protein Structures with the New ENDscript Server. Nucleic Acids Res. 2014, 42, W320–W324. [Google Scholar] [CrossRef] [Green Version]
  55. Ramisetty, B.C.M.; Sudhakari, P.A. Bacterial ‘Grounded’ Prophages: Hotspots for Genetic Renovation and Innovation. Front. Genet. 2019, 10. [Google Scholar] [CrossRef] [Green Version]
  56. Casjens, S. Prophages and Bacterial Genomics: What Have We Learned so Far? Mol. Microbiol. 2003, 49, 277–300. [Google Scholar] [CrossRef] [PubMed]
  57. Lawrence, J.G.; Hendrix, R.W.; Casjens, S. Where Are the Pseudogenes in Bacterial Genomes? Trends Microbiol. 2001, 9, 535–540. [Google Scholar] [CrossRef]
  58. Niyogi, S.K. Shigellosis. J. Microbiol. Seoul Korea 2005, 43, 133–143. [Google Scholar]
  59. Ochman, H.; Whittam, T.S.; Caugant, D.A.; Selander, R.K. Enzyme Polymorphism and Genetic Population Structure in Escherichia coli and Shigella. J. Gen. Microbiol. 1983, 129, 2715–2726. [Google Scholar] [CrossRef] [Green Version]
  60. Hendrickson, H.; Lawrence, J.G. Mutational Bias Suggests That Replication Termination Occurs near the dif Site, Not at Ter Sites. Mol. Microbiol. 2007, 64, 42–56. [Google Scholar] [CrossRef]
  61. Kono, N.; Arakawa, K.; Tomita, M. Comprehensive Prediction of Chromosome Dimer Resolution Sites in Bacterial Genomes. BMC Genom. 2011, 12, 19. [Google Scholar] [CrossRef] [Green Version]
  62. Kono, N.; Arakawa, K.; Tomita, M. Validation of Bacterial Replication Termination Models Using Simulation of Genomic Mutations. PLoS ONE 2012, 7, e34526. [Google Scholar] [CrossRef] [PubMed] [Green Version]
  63. Henderson, T.A.; Nilles, A.F.; Valjavec-Gratian, M.; Hill, T.M. Site-Directed Mutagenesis and Phylogenetic Comparisons of the Escherichia coli Tus Protein: DNA-Protein Interactions Alone Can Not Account for Tus Activity. Mol. Genet. Genomics MGG 2001, 265, 941–953. [Google Scholar] [CrossRef] [PubMed]
  64. Brewer, B.J. When Polymerases Collide: Replication and the Transcriptional Organization of the E. coli Chromosome. Cell 1988, 53, 679–686. [Google Scholar] [CrossRef]
  65. Horiuchi, T.; Fujimura, Y.; Nishitani, H.; Kobayashi, T.; Hidaka, M. The DNA Replication Fork Blocked at the Ter Site May Be an Entrance for the RecBCD Enzyme into Duplex DNA. J. Bacteriol. 1994, 176, 4656–4663. [Google Scholar] [CrossRef] [Green Version]
  66. Nordström, K. Plasmid R1--Replication and Its Control. Plasmid 2006, 55, 1–26. [Google Scholar] [CrossRef]
  67. Krabbe, M.; Zabielski, J.; Bernander, R.; Nordström, K. Inactivation of the Replication-Termination System Affects the Replication Mode and Causes Unstable Maintenance of Plasmid R1. Mol. Microbiol. 1997, 24, 723–735. [Google Scholar] [CrossRef]
  68. Hiasa, H.; Marians, K.J. Tus Prevents Overreplication of oriC Plasmid DNA. J. Biol. Chem. 1994, 269, 26959–26968. [Google Scholar] [CrossRef]
  69. Hasebe, T.; Narita, K.; Hidaka, S.; Su’etsugu, M. Efficient Arrangement of the Replication Fork Trap for In Vitro Propagation of Monomeric Circular DNA in the Chromosome-Replication Cycle Reaction. Life Basel Switz. 2018, 8, 43. [Google Scholar] [CrossRef] [Green Version]
  70. Médigue, C.; Krin, E.; Pascal, G.; Barbe, V.; Bernsel, A.; Bertin, P.N.; Cheung, F.; Cruveiller, S.; D’Amico, S.; Duilio, A.; et al. Coping with Cold: The Genome of the Versatile Marine Antarctica Bacterium Pseudoalteromonas haloplanktis TAC125. Genome Res. 2005, 15, 1325–1335. [Google Scholar] [CrossRef] [PubMed] [Green Version]
  71. Xie, B.-B.; Rong, J.-C.; Tang, B.-L.; Wang, S.; Liu, G.; Qin, Q.-L.; Zhang, X.-Y.; Zhang, W.; She, Q.; Chen, Y.; et al. Evolutionary Trajectory of the Replication Mode of Bacterial Replicons. mBio 2021, 12. [Google Scholar] [CrossRef]
  72. Midgley-Smith, S.L.; Dimude, J.U.; Rudolph, C.J. A Role for 3’ Exonucleases at the Final Stages of Chromosome Duplication in Escherichia coli. Nucleic Acids Res. 2018, 47, 1847–1860. [Google Scholar] [CrossRef] [PubMed]
  73. Rudolph, C.J.; Upton, A.L.; Briggs, G.S.; Lloyd, R.G. Is RecG a General Guardian of the Bacterial Genome? DNA Repair 2010, 9, 210–223. [Google Scholar] [CrossRef] [PubMed]
  74. Jin, D.J.; Cagliero, C.; Zhou, Y.N. Growth Rate Regulation in Escherichia coli. FEMS Microbiol. Rev. 2012, 36, 269–287. [Google Scholar] [CrossRef] [PubMed] [Green Version]
  75. Lioy, V.S.; Cournac, A.; Marbouty, M.; Duigou, S.; Mozziconacci, J.; Espéli, O.; Boccard, F.; Koszul, R. Multiscale Structuring of the E. coli Chromosome by Nucleoid-Associated and Condensin Proteins. Cell 2018, 172, 771–783.e18. [Google Scholar] [CrossRef] [PubMed]
Figure 1. Chromosome structure and replication dynamics in Escherichia coli. (A) Schematic representation of the circular E. coli chromosome. Two replication forks are assembled at the origin (oriC) and move in opposite directions along the DNA (grey arrows) until they eventually approach one other and fuse within the terminus region diametrically opposite to oriC. A replication fork trap is formed in the terminus region via primary terminator sequences (terA–J). These are arranged as two opposed groups, with the red terminators oriented to block movement of the clockwise replication fork and the blue terminators oriented to block the anticlockwise fork. The total spanned fork trap area covered by ter sites, as well as the innermost termination area, are highlighted by green lines, with the fraction of the total genome size given in %. Secondary ter sites in the left-hand replichore with very low fork blocking activity [15] are shown in grey. Locations for oriC and the dif chromosome dimer resolution site are marked. The location of rrn operons, which are highly transcribed particularly under fast growth conditions, are shown by green arrows, with the arrow pointing in the direction of active transcription. Chromosomal macrodomains Ori, NS-R, NS-L, Right, Left and Ter are shown as described [7] and domain boundaries given in Mbp. (B) Crystal structure of the ter/Tus complex of E. coli indicating the blocking and permissive ends of the complex (left), and in the ‘locked’ conformation with DNA unwound at the blocking end and the C6 base of ter DNA bound to its specific binding pocket in Tus (right), which contributes significantly to the fork arrest activity of the complex.
Ijms 22 07928 g001
Figure 2. Architecture of the replication fork trap in genomes from the five E. coli genomes representing the phylogroups A, B1, B2, D and E. (A) Absolute positions of all primary ter sites in five E. coli genomes representing the phylogroups A, B1, B2, D and E. All ter sites are identified by triangles. The chromosome dimer resolution site dif is indicated by a tick mark. Orientation of the ter sites is indicated by triangle orientation. Forks meeting the tip of the triangle first will be blocked. If single nucleotide changes occur in comparison to the MG1655 reference genome, the number of changes is shown in superscript. The strand location of dif is indicated by the direction of the marker. The marker pointing downwards indicates that the dif sequence as defined in [48] is on the (−)-strand. (B) Comparative analysis of the relative positions of ter sites within the chromosomal context in five E. coli genomes representing the phylogroups A, B1, B2, D and E. To compensate for the different genome sizes the theoretical midpoint of each genome was calculated and used as basis for the analysis. The distance of all ter sites, as well as the chromosome dimer resolution site dif, were calculated as percent of the replichore (so oriC would be 100%). This gives an indication of how much the relative position of these elements varies between the genomes. Phylogroups are indicated in brackets after the strain name.
Ijms 22 07928 g002
Figure 3. Sequence comparison of all ter sites from the 5 phylogroups in comparison to the MG1655 sequences. The ter consensus sequence derived from MG1655 is shown at the top. The phylogroups shown are A (MG1655), B1 (APEC078), B2 (S88), D (UMN026) and E (TW14359). Base pairs 1–5, 7 and 19–23 show a high degree of variability and are shaded in a lighter grey. The highly conserved core (6, 8–18) is highlighted by a darker grey. Mismatches unlikely to interfere significantly with binding have a white background shading. Mismatches within the core conserved sequence that are likely to interfere with binding are highlighted in red. Relative nucleotide frequencies are shown above as scaled letters.
Ijms 22 07928 g003
Figure 4. Interactions between Tus protein and ter sequences. (A) terA sequence in which interactions of Tus protein with the DNA backbone or individual bases is highlighted, as previously described [49]. Backbone contacts are shown in light blue above the terA sequence, where bases in direct contact with Tus are highlighted in red. (B) Sequence alignment of E. coli Tus proteins from the 5 phylogenetic groups. Identical residues are shaded grey, whereas any individual changes are highlighted in green. Those residues that interact with the DNA backbone of the terA sequence are highlighted by a blue block, while residues that make sequence-specific contacts with the terA DNA are highlighted with a red block, as described in [49]. Secondary structure information provided above is based on analysis using the ENDscript 2 server [54].
Ijms 22 07928 g004
Figure 5. Distribution and sequence comparison of the secondary ter sites K, L, Y and Z in E. coli. (A) Location and distribution of the secondary ter sites K, L, Y and Z in phylogroups A, B1, B2, D and E. Genomes from the same phylogroups are clustered, with the group indicated on the right-hand side, and for groups A, B1, B2 and D, labels are only shown at the top. For phylogroup D, labels are shown for each genome because of the higher variability. Primary ter sites F, G and J are shown for orientation purposes (compare with Figure 1A). All primary ter sites are identified by triangles. Because some of the secondary ter sites are very close to each other, secondary ter sites are shown by a red tick mark. If the tick mark is below the genome line forks approaching from the left will encounter ter/Tus complexes in the permissive orientation. If the tick mark is above the genome line, then forks approaching from the left will encounter ter/Tus complexes in the restrictive orientation. (B) Sequence comparison of all terY sites from all strains across all 5 phylogroups in comparison to the sequence found MG1655 sequences. The ter consensus sequence derived from MG1655 is shown at the top. In MG1655, 5 base pairs of terY differ to the ter consensus sequence, 2 of which are situated in the inner core sequence, which explains the low fork block activity observed [15]. These positions are highlighted in red for MG1655. All mismatches to the terY sequence in MG1655 occurring in the other genomes analysed are shown by a white background shading. Relative nucleotide frequencies are shown above as scaled letters. The relevant phylogroups are again indicated on the right-hand side.
Ijms 22 07928 g005
Figure 6. Architecture of the replication fork trap in genomes from four Shigella genomes representing the serotypes S1, S2, S4 and S5 (serotypes indicated in brackets behind the strain name). All ter sites identified, as well as the dif site, are indicated by markers. The orientation of the ter sites are indicated by the direction of the triangle (forks encountering the tip of the triangle would get blocked). The orientation of the dif chromosome dimer resolution site is indicated by the marker pointing upwards (indicating the (+)-strand) or downwards (indicating the (−)-strand). If nucleotide changes occur in comparison to the MG1655 reference genome, the number of changes is shown in superscript. ter sites with changes are key residues are shown in red.
Ijms 22 07928 g006
Figure 7. Details of the architecture of the inner replication fork trap in genomes from five Shigella flexneri (serotype S5) and four Shigella boydii (serotype S1) genomes. The inner ter sites A, B, C and D are identified, as well as the chromosome dimer resolution site dif. The orientation of the ter sites are indicated by the direction of the triangle (forks encountering the tip of the triangle would get blocked). The orientation of the dif chromosome dimer resolution site is indicated by the marker pointing upwards (indicating the (+)-strand) or downwards (indicating the (−)-strand). The terD sites highlighted in red indicate a change in the G6 residue, which will make the ability of this ter site to block a progressing replication fork much less efficient (see Figure S7). As the main focus of the comparison are the relative positions of terA, terC, terB and dif, we have not indicated the number of nucleotide changes in this figure.
Ijms 22 07928 g007
Figure 8. The replication fork trap in Salmonella and Klebsiella genomes. (A) Architecture of the replication fork trap in two Salmonella enterica genomes, as well as Klebsiella variicola and K. pneumoniae. The organisation of the E. coli ter sites is shown at the top as reference. All ter sites identified, as well as the chromosome dimer resolution site dif, are indicated by markers. The orientation of the ter sites are indicated by the direction of the triangle (forks encountering the tip of the triangle would get blocked). All ter sites identified were numbered, as the relationship to the ter sites in E. coli is not clear. (B) Sequence comparison of all ter sites from the two Salmonella enterica, the Klebsiella variicola and the K. pneumoniae genomes. The ter consensus sequence derived from MG1655 is shown at the top for reference purposes. All base pairs that are identical are shown by a grey background.
Ijms 22 07928 g008
Figure 9. Dimer resolution of circular chromosomes. (A) Circular E. coli chromosome that is in the process of being replicated. Only the innermost ter sites A, B, C and D are shown. The general orientation of the KOPS sequences that allow directional travel of the FtsK protein are shown by grey arrows with the label ‘KOPS’. An odd number of recombination events can result in the formation of chromosomal dimers. If a chromosomal dimer is formed, the XerCD site-specific recombinase allows for a recombination event between the two dif sites, which results in the resolution of the chromosomal dimer. (B) If the termination area, including dif, is over-replicated in one of the two chromosomes, a recombination event between two of the dif sites will not result in full resolution of the chromosomal dimers. See main text for details.
Ijms 22 07928 g009
Table 1. Doubling times of various E. coli strains in the presence and absence of Tus.
Strain BackgroundDoubling Time (min)SDReference
MG165519.1 a±1.3This study
∆tus19.6 a±1.2This study
oriC+ oriZ+20.6±1.3[20]
oriC+ oriZ+ ∆tus21.5±0.7[20]
oriC+ oriX+22.3±1.2[38]
oriC+ oriX+ ∆tus23.1±0.7[38]
a—Doubling times are an average from seven independent experiments.
Table 2. Genome parameters of the different E. coli phylogroups.
BackgroundPhylogroupGenome Size (Mbp)Inner Termination Area (kb)% of Total Genome Size
MG1655A4.6412675.76
APEC078B14.7982435.05
S88B25.0321903.77
UMN026D5.2022254.32
TW14359E5.5282384.31
Publisher’s Note: MDPI stays neutral with regard to jurisdictional claims in published maps and institutional affiliations.

