
Exciton Origin of Color-Tuning in Ca2+-Binding Photosynthetic Bacteria

 , ,
, ,
Abstract
1. Introduction
2. Results and Discussion
3. Materials and Methods
Author Contributions
Funding
Institutional Review Board Statement
Informed Consent Statement
Data Availability Statement
Conflicts of Interest
References
- Blankenship, R.E. Molecular Mechanisms of Photosynthesis; Blackwell Science: Oxford, UK, 2002. [Google Scholar]
- Reimers, J.R.; Biczysko, M.; Bruce, D.; Coker, D.F.; Frankcombe, T.J.; Hashimoto, H.; Hauer, J.; Jankowiak, R.; Kramer, T.; Linnanto, J.; et al. Challenges facing an understanding of the nature of low-energy excited states in photosynthesis. Biochim. Biophys. Acta (BBA) Bioenerg. 2016, 1857, 1627–1640. [Google Scholar] [CrossRef] [PubMed]
- Hunter, C.N.; Daldal, F.; Thurnauer, M.C.; Beatty, J.T. The Purple Phototrophic Bacteria; Springer: Dordrecht, The Netherlands, 2008; Volume 28. [Google Scholar]
- Permentier, H.P.; Neerken, S.; Overmann, J.; Amesz, J. A bacteriochlorophyll a antenna complex from purple bacteria absorbing at 963 nm. Biochemistry 2001, 40, 5573–5578. [Google Scholar] [CrossRef] [PubMed]
- Fathir, I.; Ashikaga, M.; Tanaka, K.; Katano, T.; Nirasawa, T.; Kobayashi, M.; Wang, Z.-Y.; Nozawa, T. Biochemical and spectral characterization of the core light harvesting complex 1 (LH1) from the thermophilic purple sulfur bacterium Chromatium tepidum. Photosynth. Res. 1998, 58, 193–202. [Google Scholar] [CrossRef]
- Imanishi, M.; Takenouchi, M.; Takaichi, S.; Nakagawa, S.; Saga, Y.; Takenaka, S.; Madigan, M.T.; Overmann, J.; Wang-Otomo, Z.-Y.; Kimura, Y. A dual role for Ca2+ in expanding the spectral diversity and stability of light-harvesting 1 reaction center photocomplexes of purple phototrophic bacteria. Biochemistry 2019, 58, 2844–2852. [Google Scholar] [CrossRef]
- Ma, F.; Yu, L.-J.; Wang-Otomo, Z.-Y.; van Grondelle, R. The origin of the unusual Qy red shift in LH1–RC complexes from purple bacteria Thermochromatium tepidum as revealed by Stark absorption spectroscopy. Biochim. Biophys. Acta (BBA) Bioenerg. 2015, 1847, 1479–1486. [Google Scholar] [CrossRef][Green Version]
- Kimura, Y.; Hirano, Y.; Yu, L.-J.; Suzuki, H.; Kobayashi, M.; Wang, Z.-Y. Calcium ions are involved in the unusual red shift of the light-harvesting 1 Qy transition of the core complex in thermophilic purple sulfur bacterium Thermochromatium tepidum. J. Biol. Chem. 2008, 283, 13867–13873. [Google Scholar] [CrossRef] [PubMed]
- Lee, M.K.; Coker, D.F. Modeling electronic-nuclear interactions for excitation energy transfer processes in light-harvesting complexes. J. Phys. Chem. Lett. 2016, 7, 3171–3178. [Google Scholar] [CrossRef]
- Yu, L.-J.; Kawakami, T.; Kimura, Y.; Wang-Otomo, Z.-Y. Structural basis for the unusual Qy red-shift and enhanced thermostability of the LH1 complex from Thermochromatium tepidum. Biochemistry 2016, 55, 6495–6504. [Google Scholar] [CrossRef]
- Yu, L.-J.; Suga, M.; Wang-Otomo, Z.-Y.; Shen, J.-R. Structure of photosynthetic LH1–RC supercomplex at 1.9 å resolution. Nature 2018, 556, 209–213. [Google Scholar] [CrossRef] [PubMed]
- Tani, K.; Kanno, R.; Makino, Y.; Hall, M.; Takenouchi, M.; Imanishi, M.; Yu, L.-J.; Overmann, J.; Madigan, M.T.; Kimura, Y.; et al. Cryo-EM structure of a Ca2+-bound photosynthetic LH1-RC complex containing multiple αβ-polypeptides. Nat. Commun. 2020, 11, 4955. [Google Scholar] [CrossRef]
- Timpmann, K.; Trinkunas, G.; Olsen, J.D.; Hunter, C.N.; Freiberg, A. Bandwidth of excitons in LH2 bacterial antenna chromoproteins. Chem. Phys. Lett. 2004, 398, 384–388. [Google Scholar] [CrossRef]
- Timpmann, K.; Trinkunas, G.; Qian, P.; Hunter, C.N.; Freiberg, A. Excitons in core LH1 antenna complexes of photosynthetic bacteria: Evidence for strong resonant coupling and off-diagonal disorder. Chem. Phys. Lett. 2005, 414, 359–363. [Google Scholar] [CrossRef]
- Trinkunas, G.; Freiberg, A. A disordered polaron model for polarized fluorescence excitation spectra of LH1 and LH2 bacteriochlorophyll antenna aggregates. J. Lumin. 2006, 119–120, 105–110. [Google Scholar] [CrossRef]
- Kozlov, M.I.; Poddubnyy, V.V.; Glebov, I.O. Calculation of the excited states properties of LH1 complex of Thermochromatium tepidum. J. Comput. Chem. 2018, 39, 1599–1606. [Google Scholar] [CrossRef] [PubMed]
- Polyakov, I.V.; Khrenova, M.G.; Moskovsky, A.A.; Shabanov, B.M.; Nemukhin, A.V. Towards first-principles calculation of electronic excitations in the ring of the protein-bound bacteriochlorophylls. Chem. Phys. 2018, 505, 34–39. [Google Scholar] [CrossRef]
- Hayes, J.M.; Gillie, J.K.; Tang, D.; Small, G.J. Theory for spectral hole burning of the primary electron donor state of photosynthetic reaction centers. Biochim. Biophys. Acta 1988, 932, 287–305. [Google Scholar] [CrossRef]
- Pajusalu, M.; Rätsep, M.; Trinkunas, G.; Freiberg, A. Davydov splitting of excitons in cyclic bacteriochlorophyll a nanoaggregates of bacterial light-harvesting complexes between 4.5 and 263 K. ChemPhysChem 2011, 12, 634–644. [Google Scholar] [CrossRef]
- Freiberg, A.; Pajusalu, M.; Rätsep, M. Excitons in intact cells of photosynthetic bacteria. J. Phys. Chem. B 2013, 117, 11007–11014. [Google Scholar] [CrossRef]
- Freiberg, A.; Chenchiliyan, M.; Rätsep, M.; Timpmann, K. Spectral and kinetic effects accompanying the assembly of core complexes of Rhodobacter sphaeroides. Biochim. Biophys. Acta (BBA) Bioenerg. 2016, 1857, 1727–1733. [Google Scholar] [CrossRef]
- Rätsep, M.; Freiberg, A. Resonant emission from the B870 exciton state and electron-phonon coupling in the LH2 antenna chromoprotein. Chem. Phys. Lett. 2003, 377, 371–376. [Google Scholar] [CrossRef]
- Rätsep, M.; Pajusalu, M.; Linnanto, J.M.; Freiberg, A. Subtle spectral effects accompanying the assembly of bacteriochlorophylls into cyclic light harvesting complexes revealed by high-resolution fluorescence spectroscopy. J. Chem. Phys. 2014, 141, 155102. [Google Scholar] [CrossRef]
- Reppert, M. Delocalization effects in chlorophyll fluorescence: Nonperturbative line shape analysis of a vibronically coupled dimer. J. Phys. Chem. B 2020, 124, 10024–10033. [Google Scholar] [CrossRef] [PubMed]
- Timpmann, K.; Katiliene, Z.; Woodbury, N.W.; Freiberg, A. Exciton self-trapping in one-dimensional photosynthetic antennas. J. Phys. Chem. B 2001, 105, 12223–12225. [Google Scholar] [CrossRef]
- Rätsep, M.; Timpmann, K.; Kawakami, T.; Wang-Otomo, Z.-Y.; Freiberg, A. Spectrally selective spectroscopy of native Ca-containing and Ba-substituted LH1-RC core complexes from Thermochromatium tepidum. J. Phys. Chem. B 2017, 121, 10318–10326. [Google Scholar] [CrossRef] [PubMed]
- Kangur, L.; Rätsep, M.; Timpmann, K.; Wang-Otomo, Z.-Y.; Freiberg, A. The two light-harvesting membrane chromoproteins of Thermochromatium tepidum expose distinct robustness against temperature and pressure. Biochim. Biophys. Acta (BBA) Bioenerg. 2020, 1861, 148205. [Google Scholar] [CrossRef] [PubMed]
- Suzuki, H.; Hirano, Y.; Kimura, Y.; Takaichi, S.; Kobayashi, M.; Miki, K.; Wang, Z.-Y. Purification, characterization and crystallization of the core complex from thermophilic purple sulfur bacterium Thermochromatium tepidum. Biochim. Biophys. Acta (BBA) Bioenerg. 2007, 1767, 1057–1063. [Google Scholar] [CrossRef]


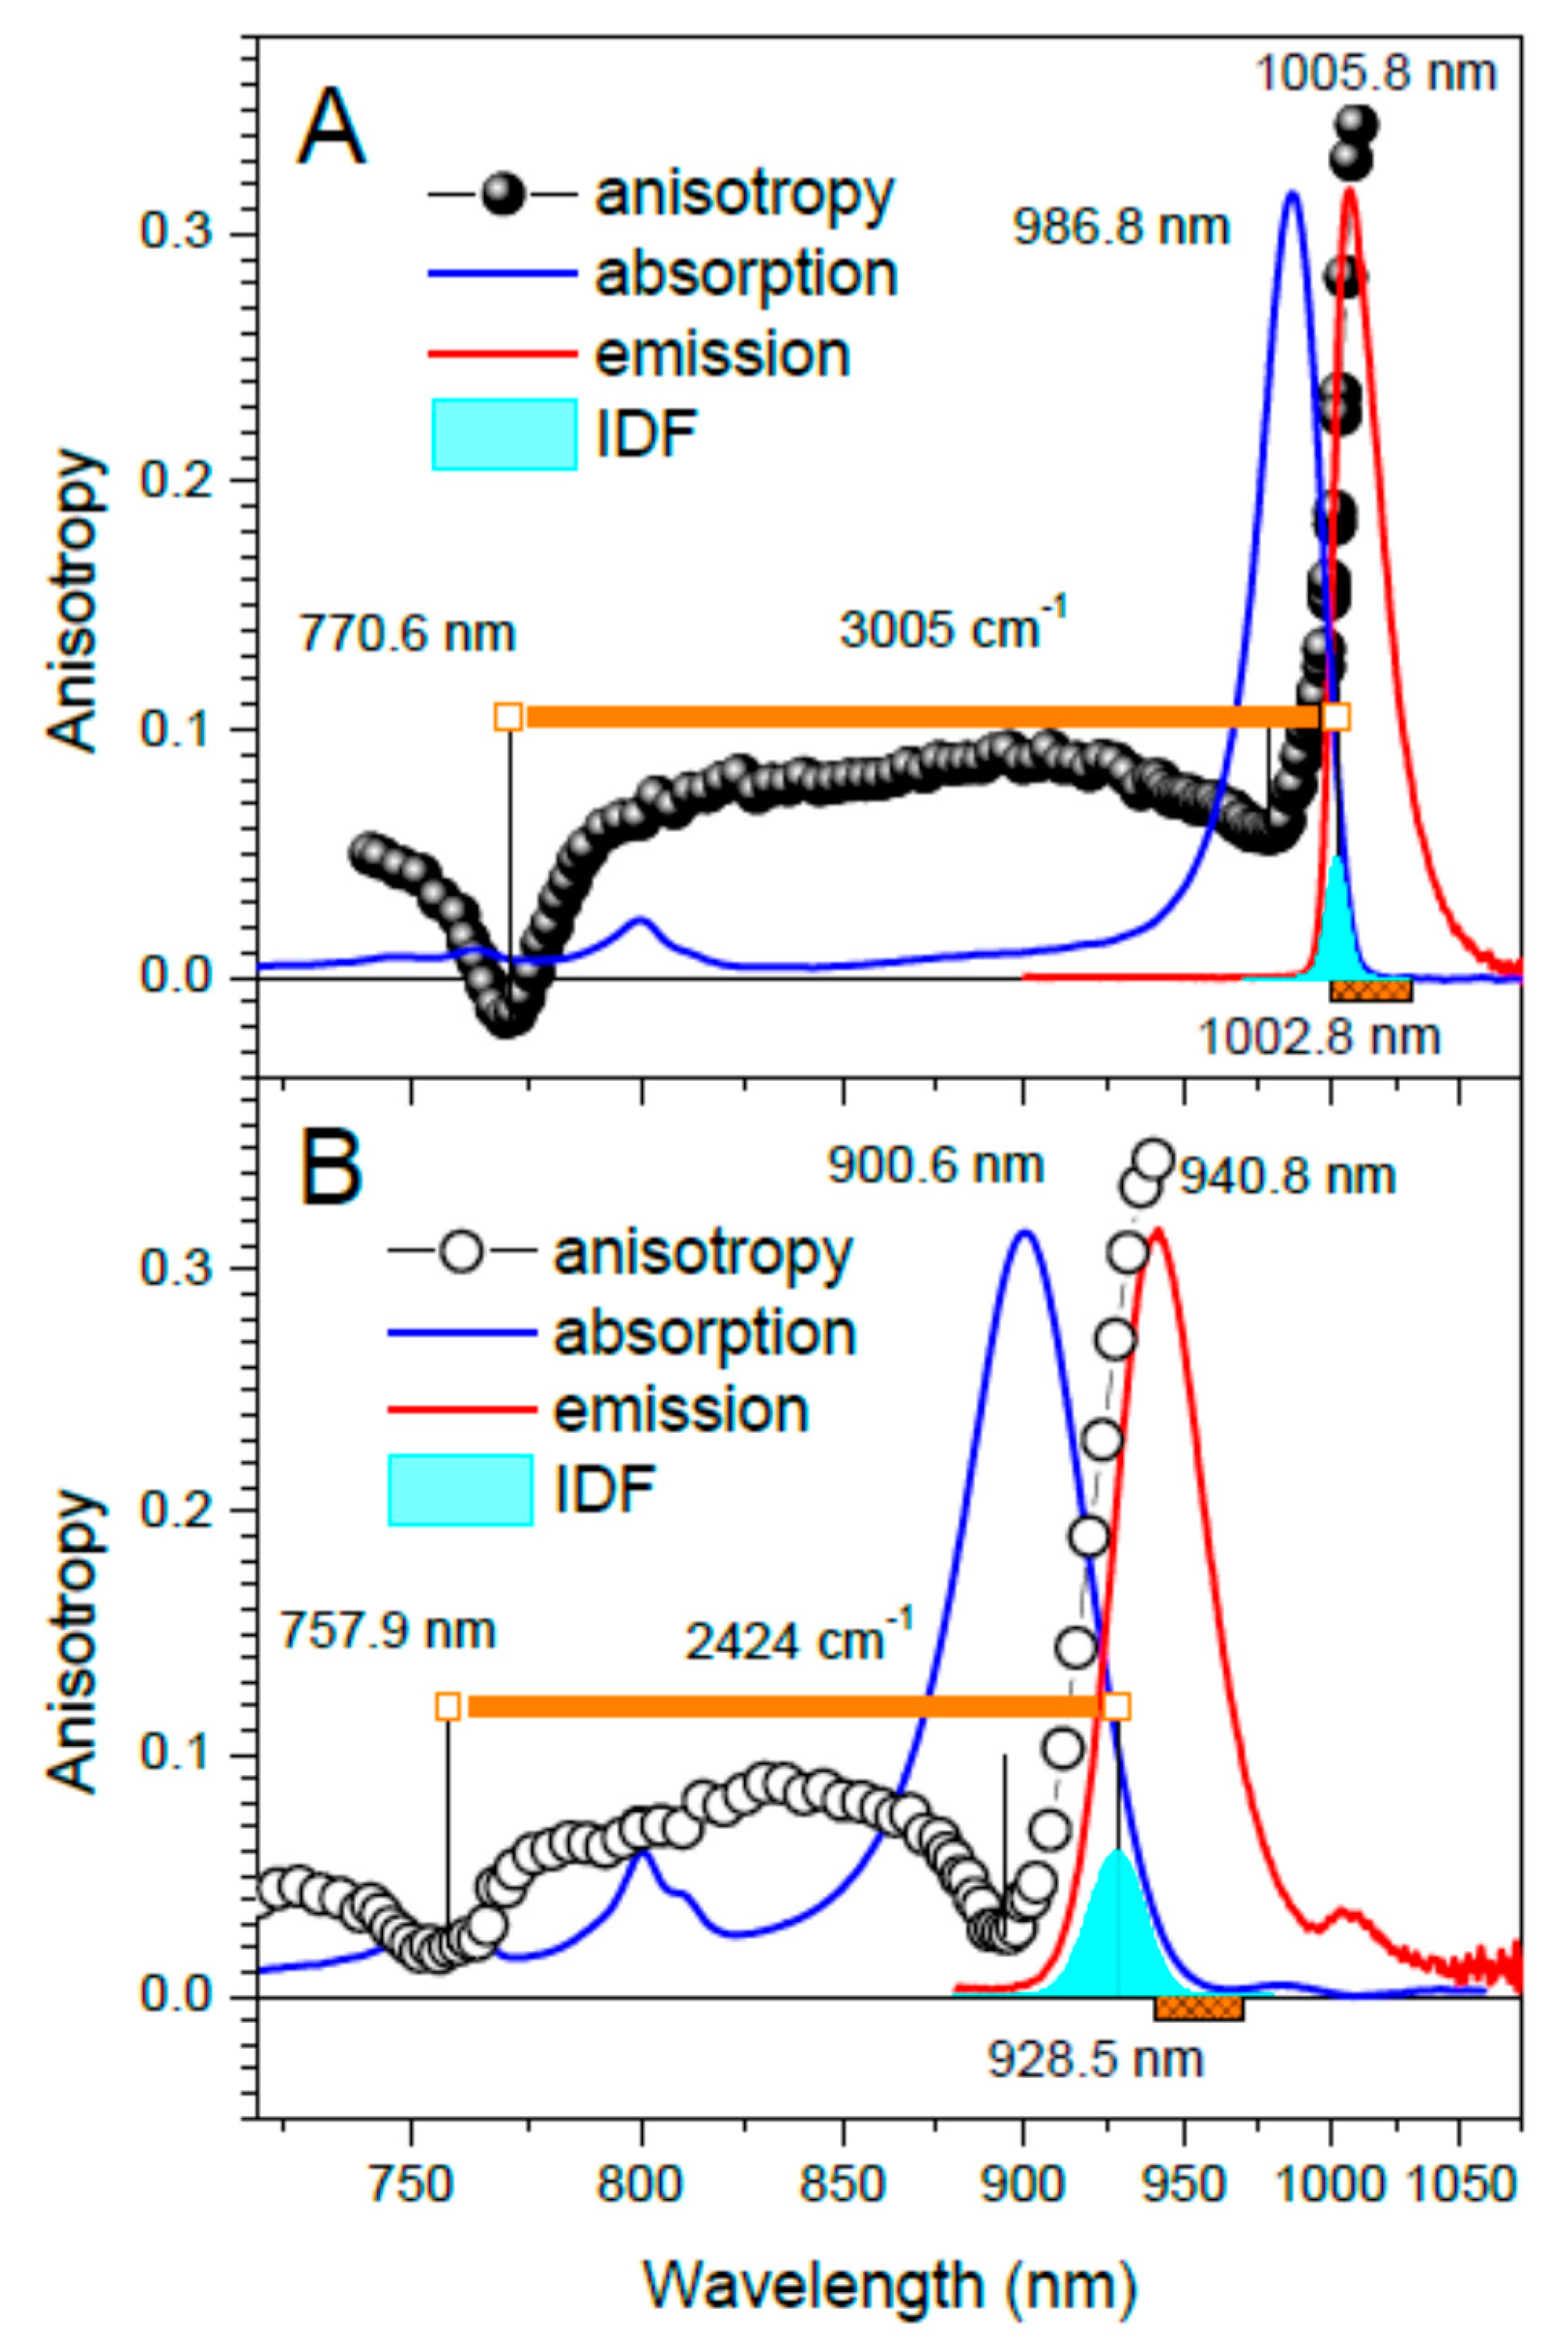
| Strain | Sample | Absorption Maximum 2 (nm) | Exciton Band Limits (nm) | ∆E (cm−1) | |
|---|---|---|---|---|---|
| Top | Bottom (IDF) | ||||
| Trv. 970 | Ca-LH1-RC | 986.8 (961.0) | 770.6 | 1002.8 | 3005 |
| LH1-RC | 900.6 (882.5) | 757.9 | 928.5 | 2434 | |
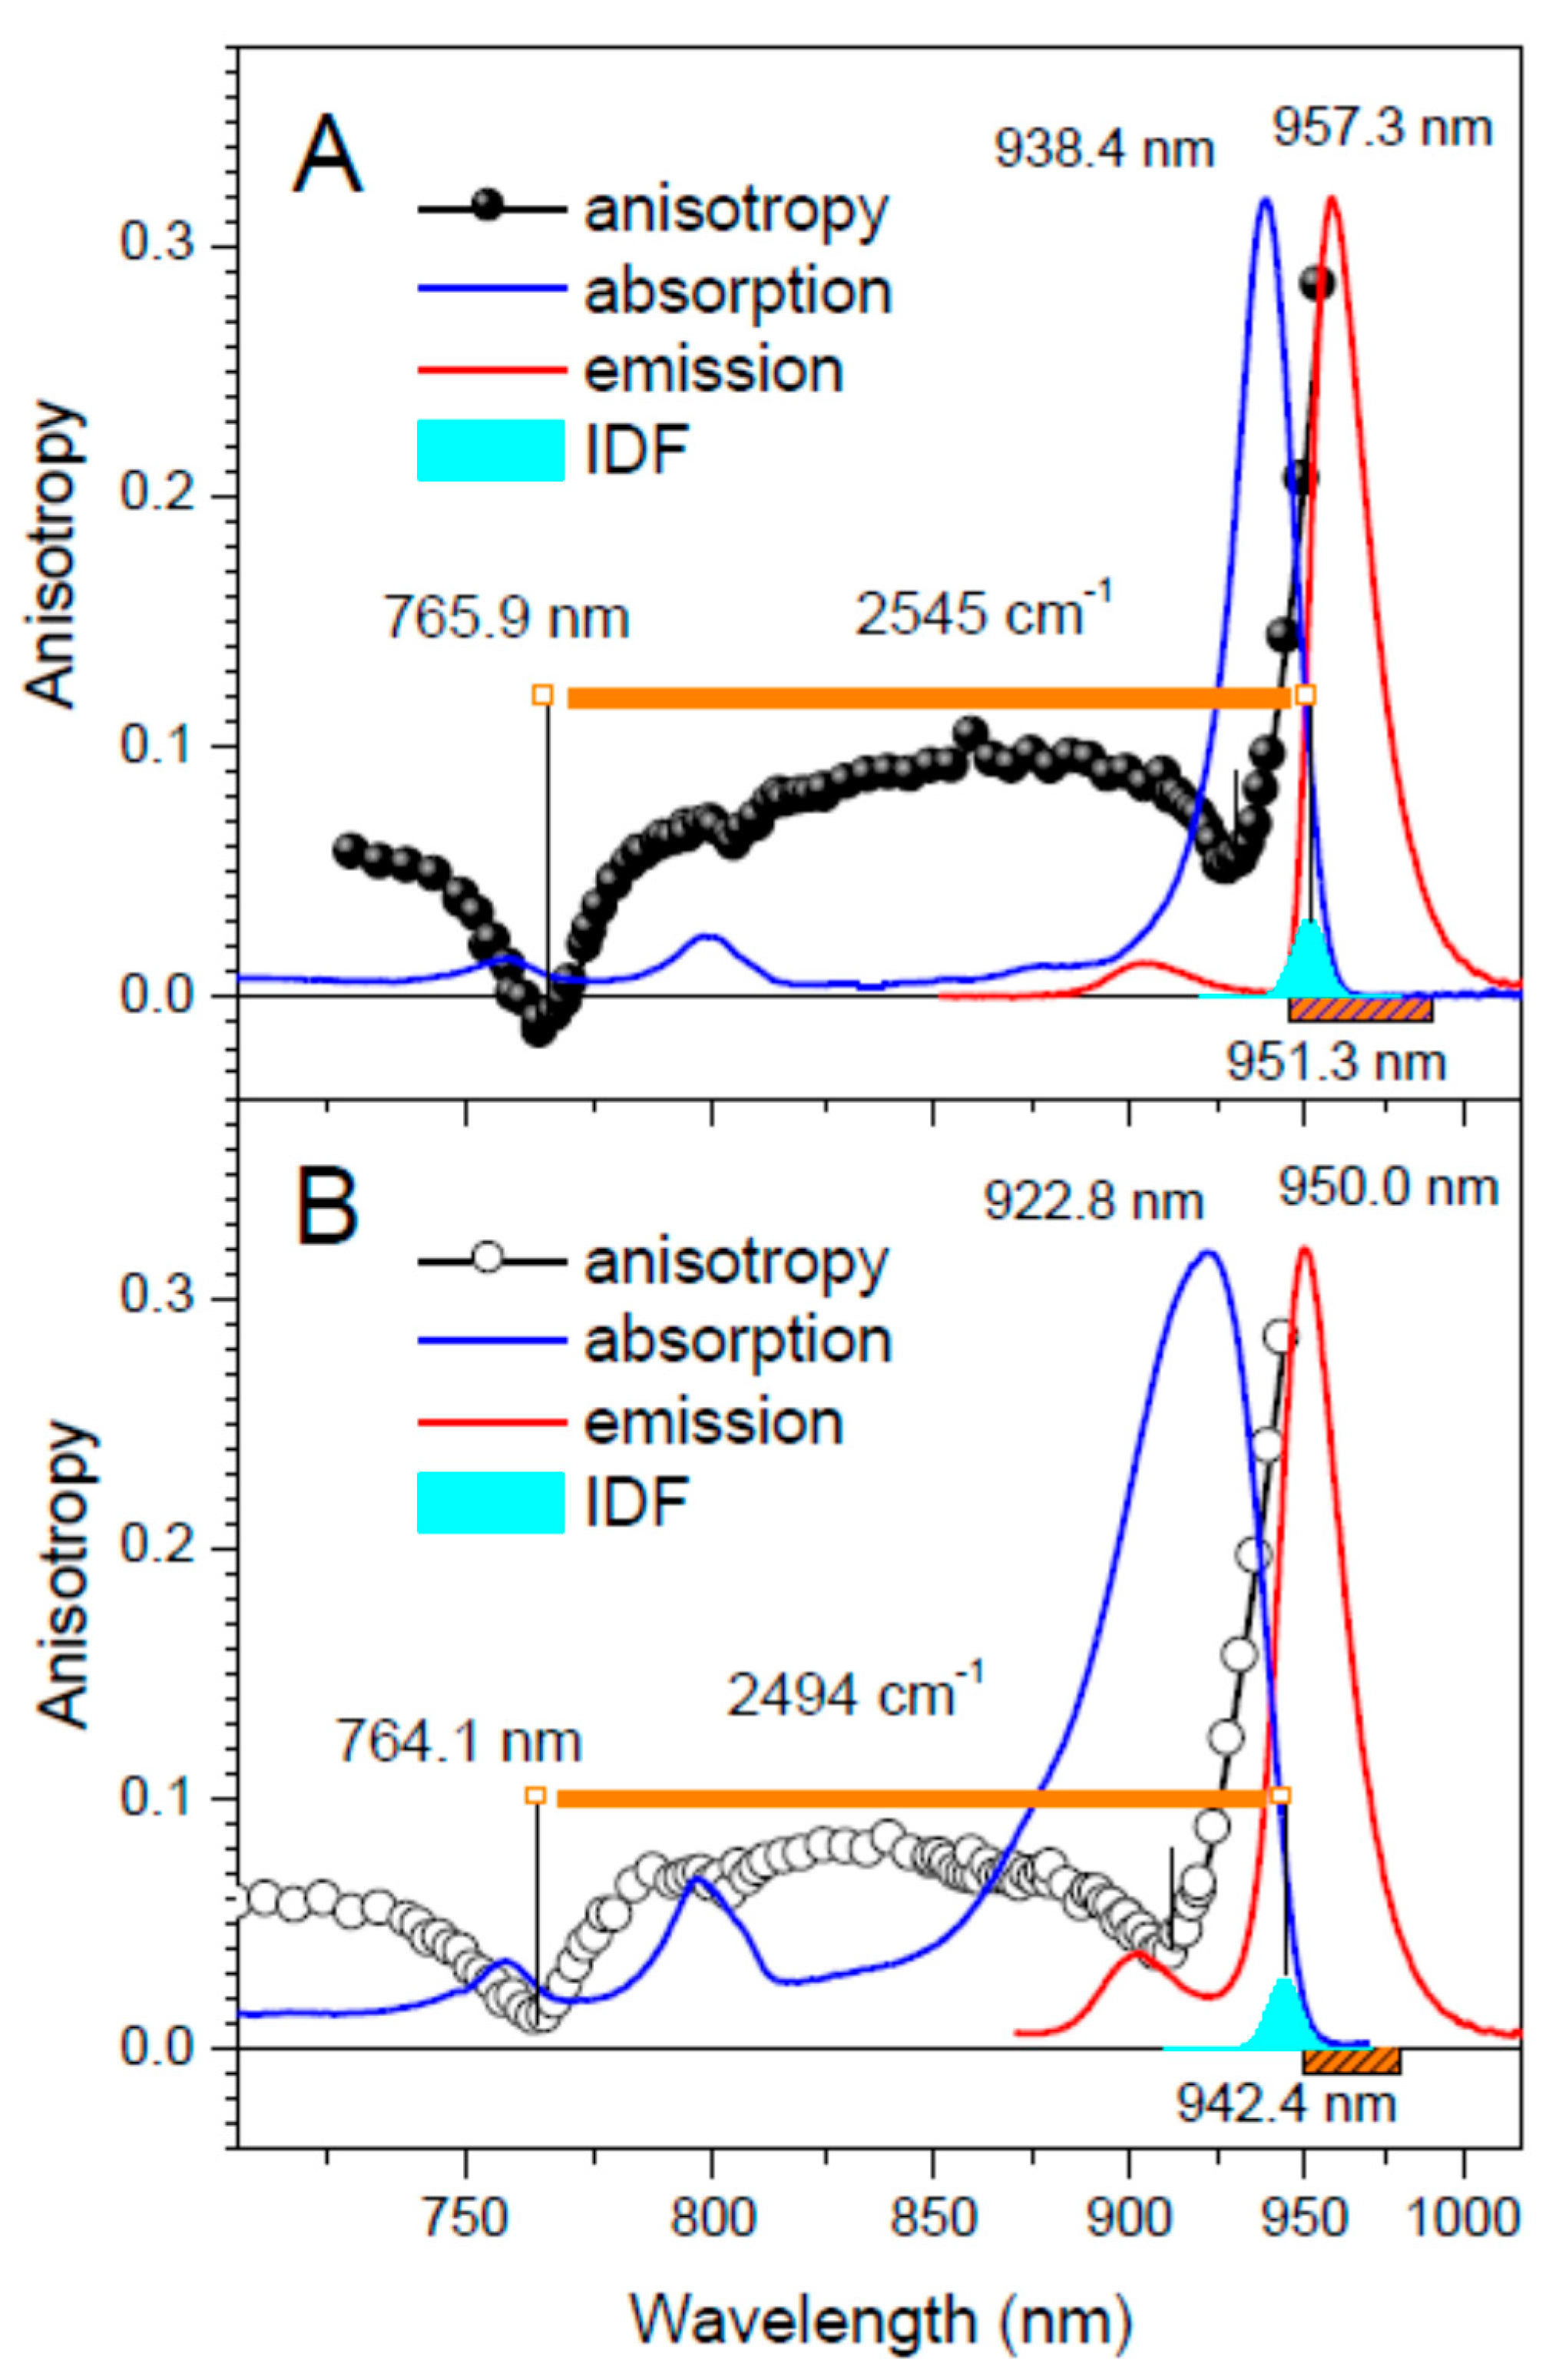
| Tch. tepidum | Ca-LH1-RC | 938.4 (916.7) | 765.9 | 951.3 | 2545 |
| LH1-RC | 922.8 (898.5) | 764.1 | 942.4 | 2472 | |
| Rba. sphaeroides 3 | LH1 | 886.1 (876.7) | 755.7 | 896.0 | 2070 |
| Strain | Sample | IDF | Fluorescence Maximum (nm) | Stokes Shift (cm−1) | Huang–Rhys Factor 3 | |
|---|---|---|---|---|---|---|
| Position (nm) | Width (cm−1) 2 | |||||
| Trv. 970 | Ca-LH1-RC | 1002.8 | 88 ± 12 | 1005.8 | 30 ± 14 | 1.9 |
| LH1-RC | 928.5 | 218 ± 20 | 940.8 | N/A 4 | 2.2 | |
| Tch. tepidum | Ca-LH1-RC | 951.3 | 117 ± 12 | 957.3 | 66 ± 16 | 2.1 |
| LH1-RC | 942.4 | 121 ± 12 | 950.0 | N/A 4 | 2.3 | |
| Rba. sphaeroides 5 | LH1 | 896.0 | 118 ± 10 | 901.5 | 68 ± 16 | 1.8 |
Publisher’s Note: MDPI stays neutral with regard to jurisdictional claims in published maps and institutional affiliations. |
© 2021 by the authors. Licensee MDPI, Basel, Switzerland. This article is an open access article distributed under the terms and conditions of the Creative Commons Attribution (CC BY) license (https://creativecommons.org/licenses/by/4.0/).
Share and Cite
Timpmann, K.; Rätsep, M.; Kangur, L.; Lehtmets, A.; Wang-Otomo, Z.-Y.; Freiberg, A. Exciton Origin of Color-Tuning in Ca2+-Binding Photosynthetic Bacteria. Int. J. Mol. Sci. 2021, 22, 7338. https://doi.org/10.3390/ijms22147338
Timpmann K, Rätsep M, Kangur L, Lehtmets A, Wang-Otomo Z-Y, Freiberg A. Exciton Origin of Color-Tuning in Ca2+-Binding Photosynthetic Bacteria. International Journal of Molecular Sciences. 2021; 22(14):7338. https://doi.org/10.3390/ijms22147338
Chicago/Turabian StyleTimpmann, Kõu, Margus Rätsep, Liina Kangur, Alexandra Lehtmets, Zheng-Yu Wang-Otomo, and Arvi Freiberg. 2021. "Exciton Origin of Color-Tuning in Ca2+-Binding Photosynthetic Bacteria" International Journal of Molecular Sciences 22, no. 14: 7338. https://doi.org/10.3390/ijms22147338
APA StyleTimpmann, K., Rätsep, M., Kangur, L., Lehtmets, A., Wang-Otomo, Z.-Y., & Freiberg, A. (2021). Exciton Origin of Color-Tuning in Ca2+-Binding Photosynthetic Bacteria. International Journal of Molecular Sciences, 22(14), 7338. https://doi.org/10.3390/ijms22147338