Article

Upregulation of Anti-Oxidative Stress Response Improves Metabolic Changes in L-Selectin-Deficient Mice but Does Not Prevent NAFLD Progression or Fecal Microbiota Shifts

1
Department of Pediatrics, Faculty of Medicine, RWTH Aachen University, D-52074 Aachen, Germany
2
Production Animal Health, Faculty of Veterinary Medicine, University of Calgary, Calgary, AB T2N 1N4, Canada
3
Division of Gastroenterology, Massachusetts General Hospital and Harvard Medical School, Boston, MA 02114, USA
4
Functional Microbiome Research Group, Faculty of Medicine, RWTH Aachen University, D-52074 Aachen, Germany
5
Institute of Pathology, Ruprecht-Karls-University Heidelberg, D-69117 Heidelberg, Germany
6
Department of Internal Medicine III, University Hospital, RWTH Aachen, D-52074 Aachen, Germany
*
Authors to whom correspondence should be addressed.
Int. J. Mol. Sci. 2021, 22(14), 7314; https://doi.org/10.3390/ijms22147314
Submission received: 6 May 2021 / Revised: 29 June 2021 / Accepted: 4 July 2021 / Published: 7 July 2021
(This article belongs to the Section Molecular Endocrinology and Metabolism)

Abstract

:
(1) Background: Non-alcoholic fatty liver disease (NAFLD) is a growing global health problem. NAFLD progression involves a complex interplay of imbalanced inflammatory cell populations and inflammatory signals such as reactive oxygen species and cytokines. These signals can derive from the liver itself but also from adipose tissue or be mediated via changes in the gut microbiome. We analyzed the effects of a simultaneous migration blockade caused by L-selectin-deficiency and an enhancement of the anti-oxidative stress response triggered by hepatocytic Kelch-like ECH-associated protein 1 (Keap1) deletion on NAFLD progression. (2) Methods: L-selectin-deficient mice (Lsel−/−Keap1flx/flx) and littermates with selective hepatic Keap1 deletion (Lsel−/−Keap1Δhepa) were compared in a 24-week Western-style diet (WD) model. (3) Results: Lsel−/−Keap1Δhepa mice exhibited increased expression of erythroid 2-related factor 2 (Nrf2) target genes in the liver, decreased body weight, reduced epidydimal white adipose tissue with decreased immune cell frequencies, and improved glucose response when compared to their Lsel−/−Keap1flx/flx littermates. Although WD feeding caused drastic changes in fecal microbiota profiles with decreased microbial diversity, no genotype-dependent shifts were observed. (4) Conclusions: Upregulation of the anti-oxidative stress response improves metabolic changes in L-selectin-deficient mice but does not prevent NAFLD progression and shifts in the gut microbiota.

1. Introduction

Non-alcoholic fatty liver disease (NAFLD) is one of the most prevalent of the chronic and progressive liver diseases, making it the third most common reason for liver transplantations in Western countries [1]. Starting with non-alcoholic fatty liver (NAFL), which is characterized by fat accumulation in the liver (steatosis), it can progress to more severe disease stages such as non-alcoholic steatohepatitis (NASH) with hepatocyte ballooning, inflammation, and/or fibrosis. Finally, it can develop into end-stage disease including liver cirrhosis or hepatocellular carcinoma [2]. The first process in NAFLD development is the accumulation of liver fat, which is considered as an important part of the hepatic component of the metabolic syndrome and associated with insulin resistance [3]. Obesity, mainly caused by the consumption of a Western diet (WD) containing an excess of saturated fats, refined carbohydrates, and fructose-rich beverages, is a key risk factor for the onset of NAFLD [4]. The mechanisms driving progression from simple steatosis to NASH seem to require additional challenges e.g., increased oxidative stress, mitochondrial dysfunction, or aberrant inflammatory immune cell infiltration, which have been implicated as “multiple hits” contributing to liver disease [5]. In addition, liver crosstalk with other organs such as inflamed adipose tissue and the gut can modify immune responses and contributes to progressive pathogenesis. NASH is accompanied by qualitative and quantitative changes in the enteric microbiota and the intestinal barrier that may facilitate the translocation of bacteria/bacterial products into portal circulation, thereby promoting liver inflammation and fibrogenesis [6,7,8]. A detailed description of these mechanistic links, which is a prerequisite for the development of therapies against NAFLD progression, is still lacking.
NAFLD is accompanied by the recruitment of activated inflammatory leukocytes into the liver [9,10]. Immune cell recirculation is a highly regulated and rigorously controlled, multistep process involving different chemokines and cell adhesion molecules [11]. L-selectin (CD62L) is a cell adhesion molecule expressed by many leukocytes, including neutrophils, monocytes, and most types of lymphocytes [12,13]. It mediates the initial attachment and subsequent rolling of leukocytes on activated endothelium, contributing to the pathogenesis of several diseases, including aggravation of inflammation in a liver ischemia reperfusion model [14,15,16,17,18]. Most recently, we have shown that increased L-selectin expression in patients correlates with the progression of NAFLD [19]. Furthermore, the therapeutic blockade or deletion of L-selectin in mice partially protects them from the progression of WD-induced steatohepatitis. WD-treated L-selectin-deficient mice exhibited less fat accumulation and steatosis and fewer metabolic changes with improved glucose tolerance and decreased cholesterol and triglyceride levels when compared to equally treated wild-type (WT) mice. Ameliorated disease was accompanied by increased intrahepatic numbers of anti-inflammatory regulatory T cells (Treg cells), decreased numbers of neutrophils, and activation of the anti-oxidative stress response [19].
Disturbance of the balance between cellular production of reactive oxygen species (ROS) and the capacity to detoxify reactive intermediates is considered a key contributor to NASH progression [20,21]. Elevated ROS concentrations can induce hepatocyte death and lipid peroxidation, which further amplifies liver damage and contributes to hepatic stellate cell activation with subsequent deposition of extracellular matrix [22,23]. Therefore, the expression of antioxidant proteins and detoxifying enzymes is crucial for defense against oxidative stress. Expression of the respective cytoprotective genes is controlled by the promotor regions of antioxidant responsive elements (AREs). These are mainly regulated by the transcription factor erythroid 2-related factor 2 (Nrf2) [24,25,26]. The Nrf2/ARE pathway is modulated by the actin-anchored Kelch-like ECH associated protein 1 (Keap1), which acts as an Nrf2 repressor. In homeostasis, Nrf2 is associated with Keap1 and localized in the cytoplasm. Upon activation by ROS, Keap1 dissociates from Nrf2, which translocates into the nucleus. There, it binds, along with other nuclear proteins, to ARE sequences, triggering the expression of cytoprotective target genes [25]. Nrf2 affects the expression of nearly 500 genes coding for proteins involved in phase II metabolic processes such as NAD(P)H:quinione oxidoreductase 1 (NQO1), glutathion S-transferase (GST), glutathione peroxidase (GSH-Px), ferritin, and heme oxygenase-1 (HO-1). It promotes NADPH production and also induces further antioxidant genes, preventing liver injury. Phase II enzymes detoxify the intermediate metabolites generated by phase I reactions, resulting in a rapid excretion of toxic xenobiotics. In addition, Nrf2 plays an important role in modulating anti-inflammatory responses, autophagy, and proteasome activity [27,28]. Either by deleting Nrf2 or activating Nrf2, e.g., via Keap1 deletion, a number of in vivo mouse studies have addressed the role of Nrf2 in diet-induced obesity. Although some findings are controversial, overall, data from Nrf2 activation show beneficial results [29,30].
Previously, it was shown that hepatocyte-specific deletion of Keap1 in mice reduces acetaminophen toxicity and methionine- and choline-deficient (MCD)- or WD-induced steatohepatitis [31,32,33]. Here, we have studied the effects of simultaneously blocking two NAFLD promoting challenges, namely increased immune cell infiltration and oxidative stress, by analyzing the development of WD-induced NAFLD and fecal microbiota changes in L-selectin-deficient mice with enhanced hepatocytic Nrf2 activation. In terms of body weight, glucose tolerance, and epididymal fat deposition, the enhanced activation of Nrf2 further improved the beneficial outcome of WD-induced NAFLD in L-selectin-deficient mice. Although WD feeding per se induced a significant shift in the fecal microbiota structure, hepatocytic Nrf2 activation appeared to have no major influence in that respect.

2. Results

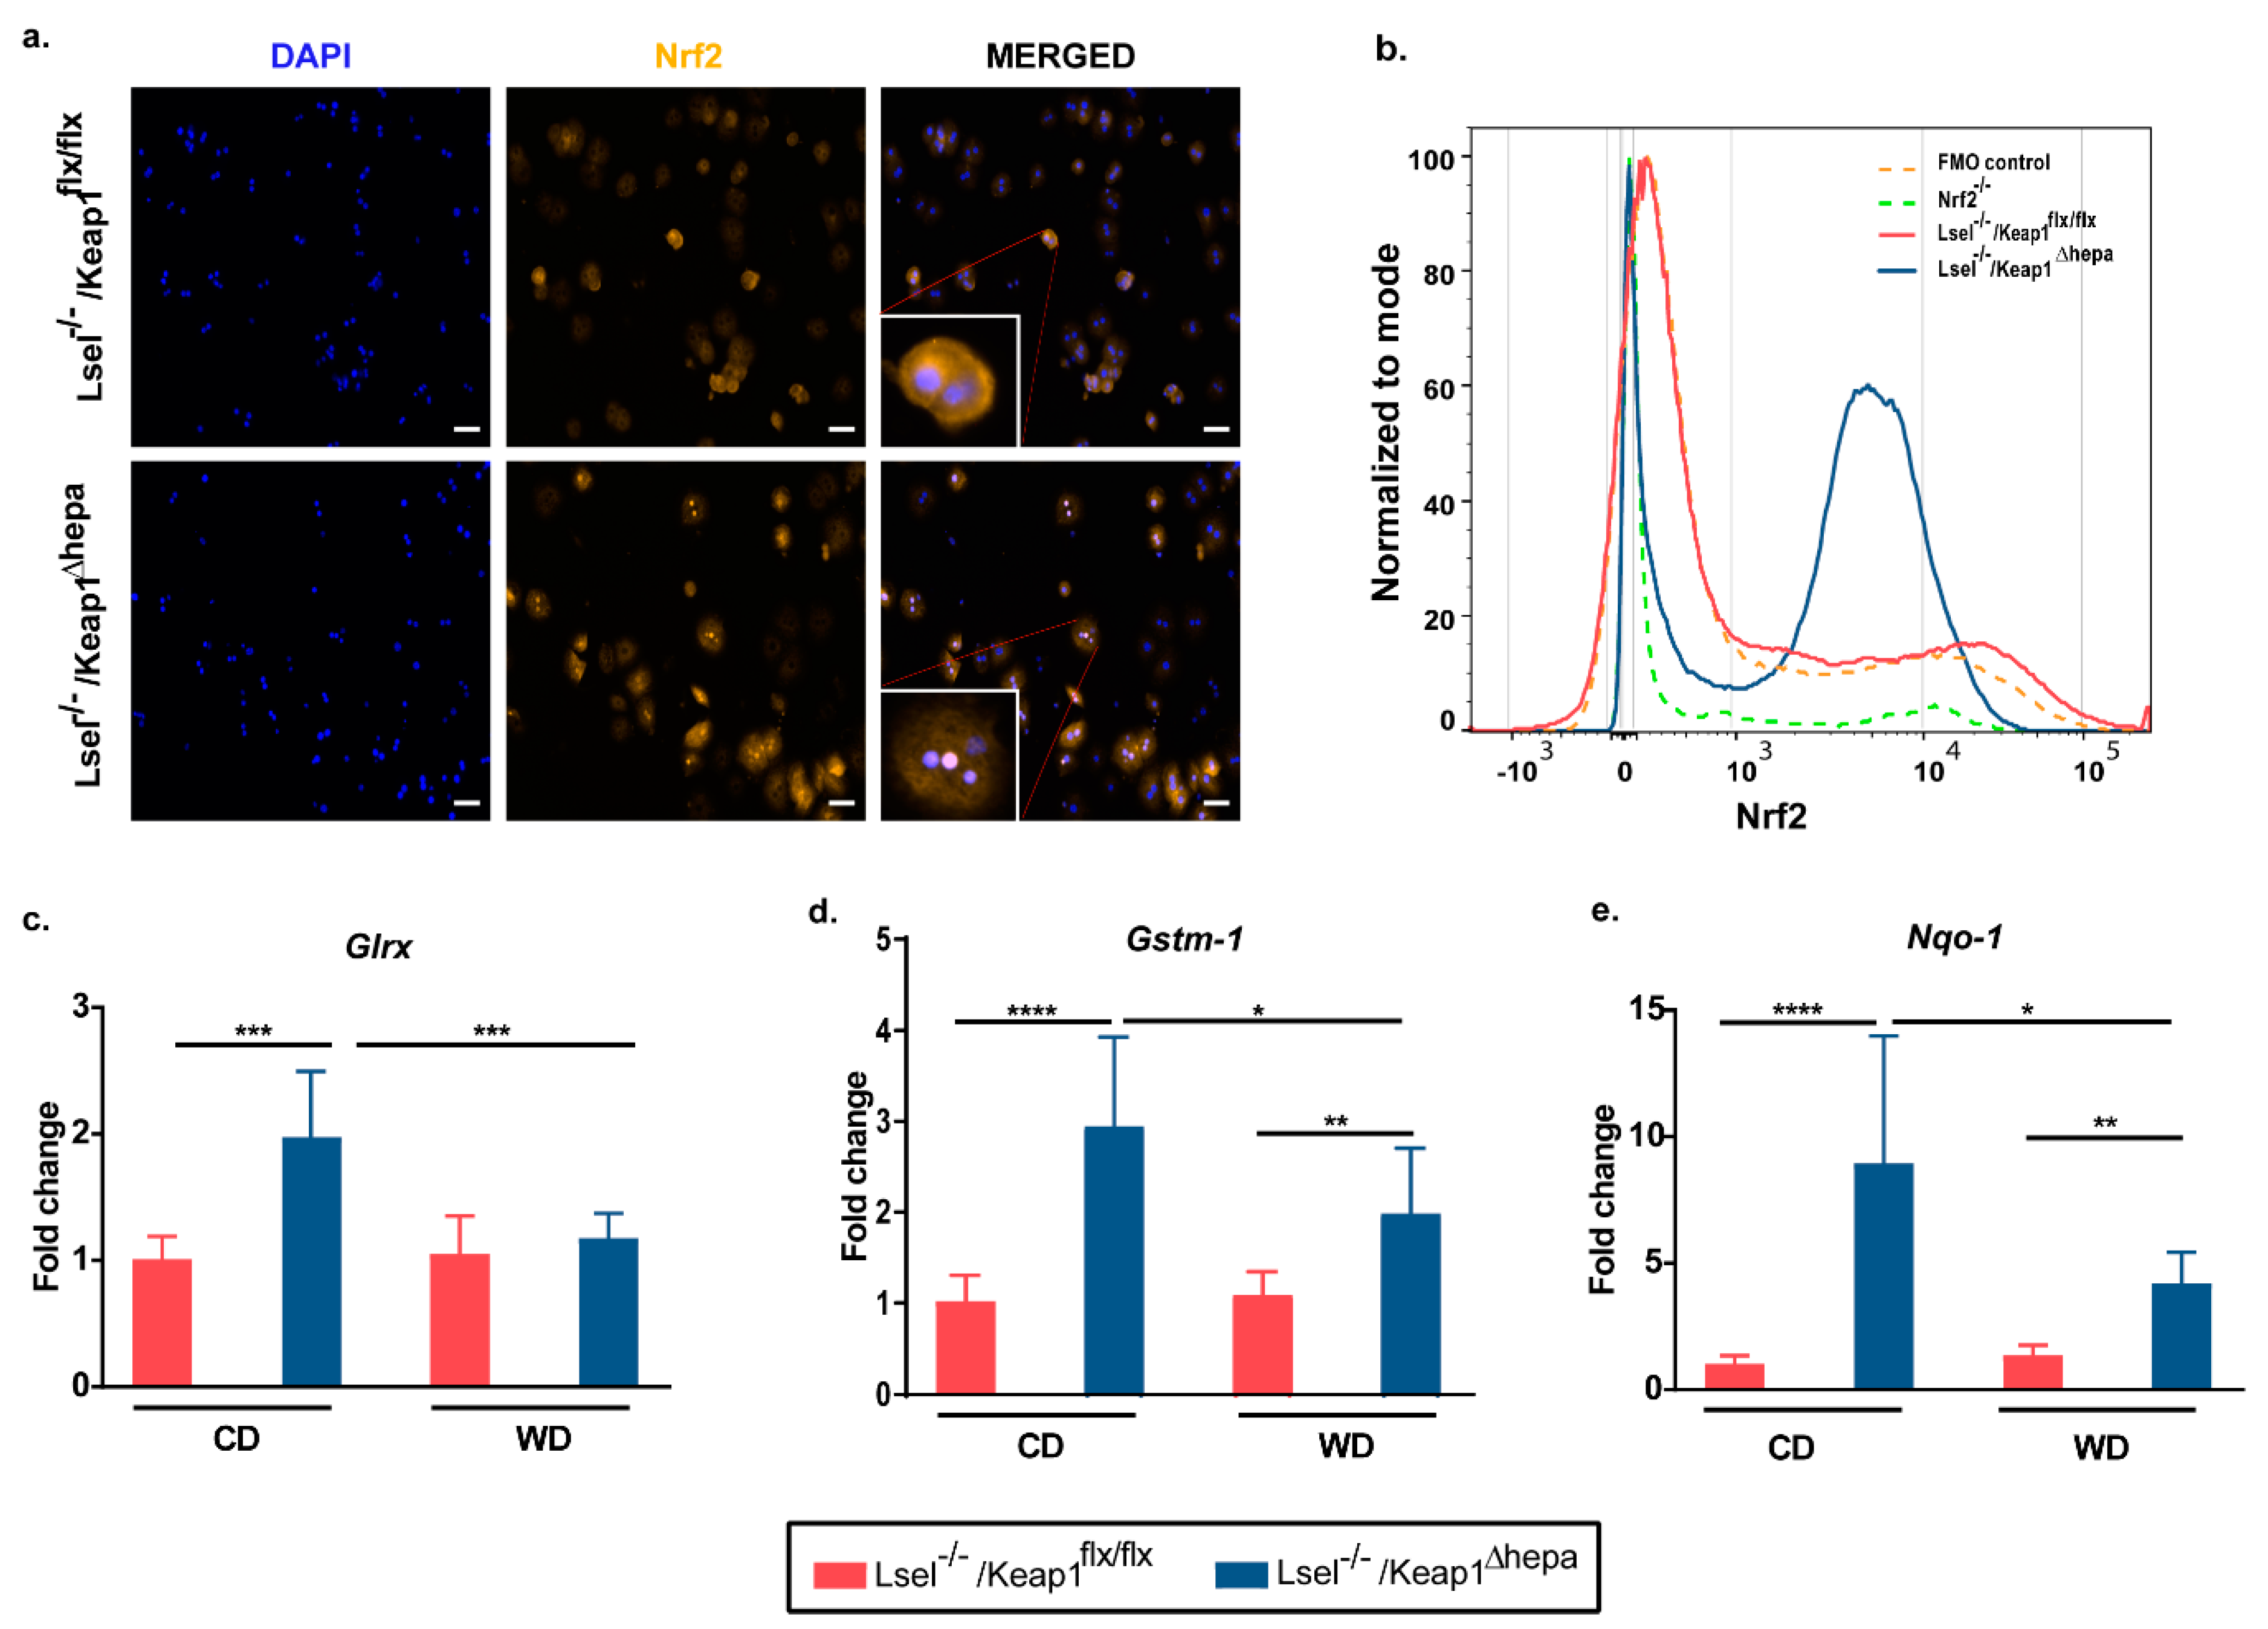
2.1. Nrf2 Activation in Hepatocytes of L-Selectin-Deficient Mice Results in Increased Expression of Nrf2 Target Genes

Recently, we have shown that L-selectin-deficient mice are partially protected from a progression of WD-induced NAFLD [19]. To find out whether an enhanced hepatocytic expression of cytoprotective genes in this system provides an additional benefit in decelerating disease progression, we generated L-selectin-deficient mice with selective hepatic deletion of Keap1 (Lsel−/−Keap1Δhepa) by crossbreeding L-selectin-deficient mice with Keap1Δhepa mice. This particular Keap1Δhepa mouse strain was reported previously to show a constitutive increase of Nrf2 protein expression in the liver [33,34]), which we verified for the Lsel−/−KeapΔhepa mice by flow cytometry and immunofluorescence (Figure 1b). In addition, we observed a trend toward decreased ROS production in hepatocytes of Lsel−/−Keap1Δhepa mice when compared to Lsel−/−Keap1flx/flx mice. However, this was not significant due to the high variability between the different hepatocyte preparations (Supplementary Figure S1), which was most probably caused by the harsh enzymatic preparation procedure.
Then, we compared the disease outcome in Lsel−/−Keap1Δhepa mice and L-selectin-deficient littermates (Lsel−/−Keap1flx/flx) after 24 weeks of WD treatment. First, we investigated whether the selective hepatic deletion of Keap1 is reflected by changes in the expression levels of prototypical Nrf2 target genes in liver tissue homogenates. As expected, Nrf2 activation in Lsel−/−Keap1Δhepa mice caused a significant increase in the hepatic mRNA expression of the Nrf2 targets glutaredoxin (GLRX), glutathion S-transferase-1 (GSTM-1), and NAD(P)H:quinione oxidoreductase 1 (Nqo1) when compared to Lsel−/−Keap1flx/flx mice (Figure 1c–e). Interestingly, WD treatment caused a decrease in the expression of the respective genes in the liver of Lsel−/−Keap1Δhepa genes, but in comparison to similarly treated Lsel−/−Keap1flx/flx mice, the expression was still significantly elevated. A downregulation of Nrf2 target genes through diet-induced obesity has already been observed in several studies and may be caused by post-translational Nrf2 regulation [35,36,37].

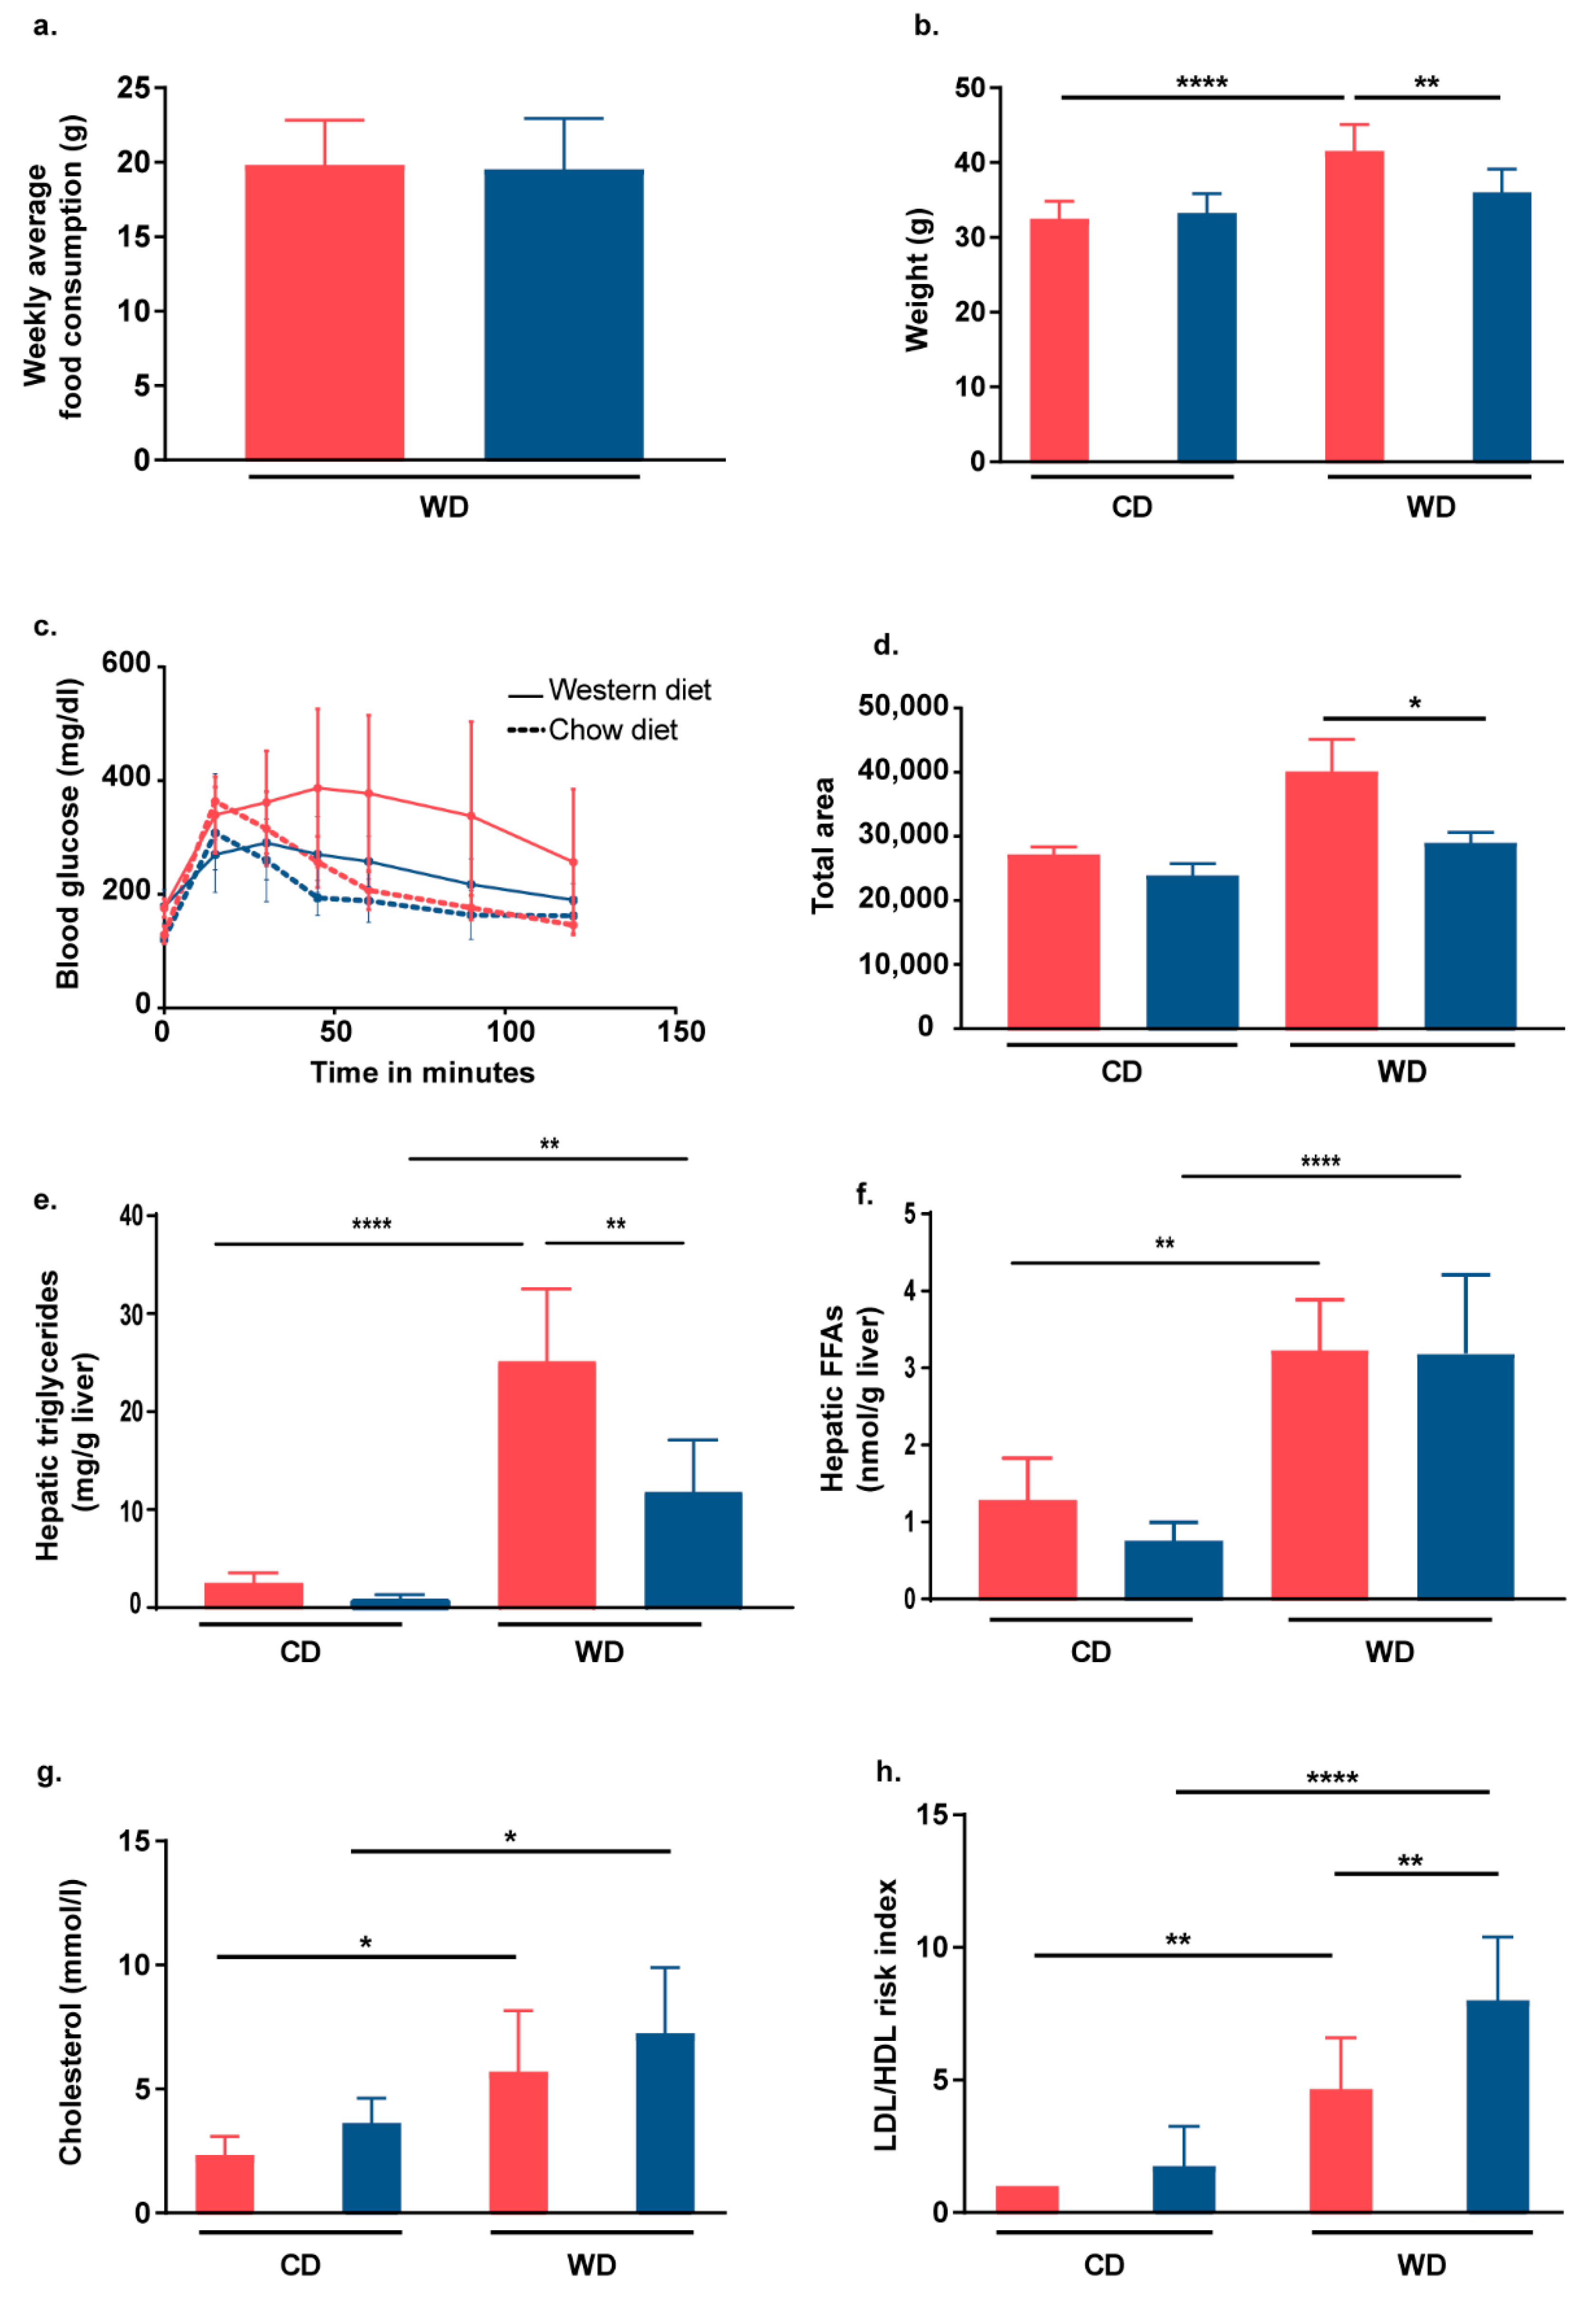
2.2. Nrf2 Activation in Hepatocytes of L-Selectin-Deficient Mice Partially Protects Mice from WD-Induced Metabolic Dysfunction

To study the effect of additional Nrf2 activation on obesity, we measured the endpoint body weight of mice that had received either WD for 24 weeks or a normal chow diet. Although the two mouse strains showed the same weekly average food consumption of ≈20 g (Figure 2a), only Lsel−/−Keap1flx/flx mice displayed a significant increase in body weight after WD feeding (Figure 2b). This phenotype was also observed in the Keap1Δhepa mouse strain and ascribed to a shift in hepatic metabolism toward increased lipid catabolism and reduced liponeogenesis [33]. Moreover, after 24 weeks of WD feeding, Lsel−/−Keap1Δhepa mice exhibited less pronounced features of the metabolic syndrome when compared to similarly treated Lsel−/−Keap1flx/flx mice, as demonstrated by faster falls in glucose levels after glucose injection (Figure 2c,d). While serum triglyceride levels were unaffected by either diet or genotype (data not shown), WD treatment caused significantly increased levels of liver triglycerides in both strains, but these levels were significantly reduced in Lsel−/−KeapΔhepa mice in comparison to WD-treated Lsel−/−Keapfl/fl mice (Figure 2e). With respect to chow-fed controls, non-esterified free fatty free acid levels were significantly elevated in the livers of the treated mice, but did not vary between the different genotypes (Figure 2f).
In addition, serum cholesterol increased in both strains when fed a WD (Figure 2g). When investigated further, the LDL/HDL ratio was found to be significantly increased by WD, with the highest ratio occurring in Lsel−/−Keap1Δhepa mice fed WD (Figure 2h). Of note, a mild hypercholesterolemia has already been observed due to Keap1 deletion in WT mice and was attributed to a reduced expression of the Cyp7a1 (cytochrome P450 family 7 subfamily A member 1) gene, which encodes for an enzyme involved in the biotransformation of cholesterol into bile acids [33].

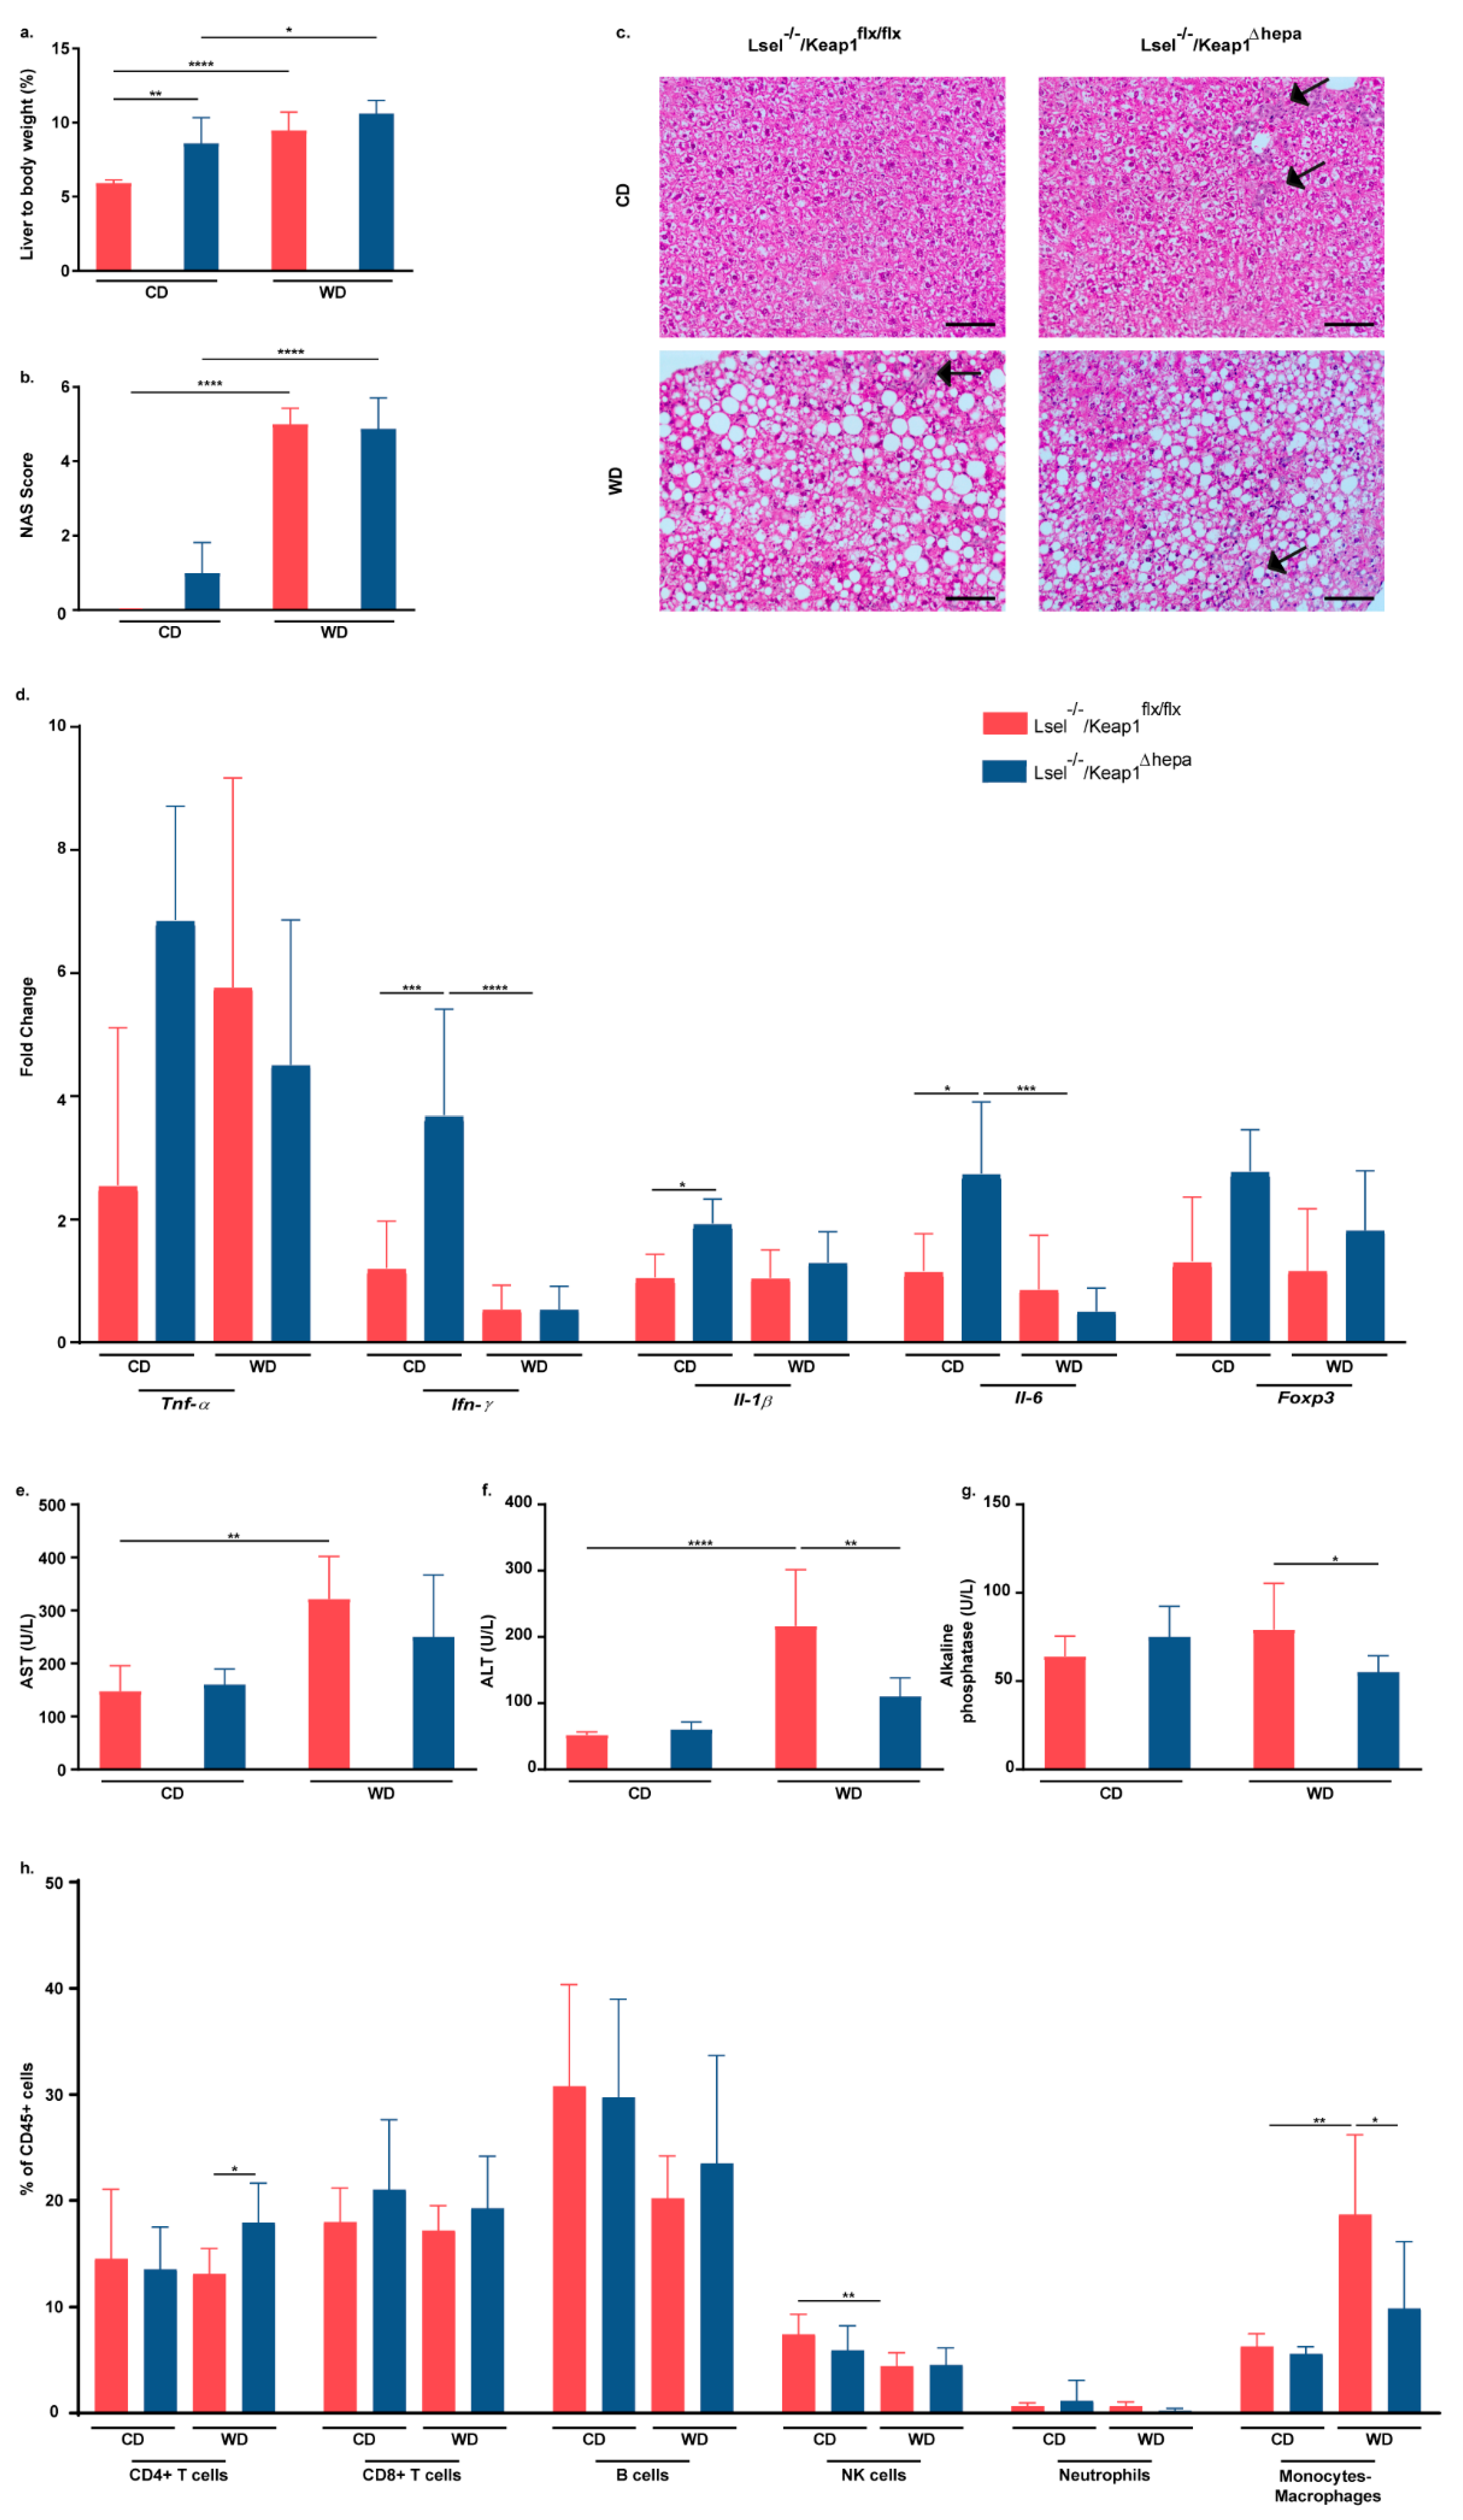
2.3. Nrf2 Activation in Hepatocytes of L-Selectin-Deficient Mice Has No Major Influence on WD-Induced NASH Progression

Under conditions of chow feeding, Lsel−/−Keap1Δhepa mice displayed an increased liver/body weight ratio when compared to Lsel−/−Keap1flx/flx mice. This was not unexpected, because an increased liver/body weight ratio has already been described in mice with hepatocytic Keap1 deletion [33]. After 24 weeks of WD feeding, liver/body weight ratios in both mouse strains were significantly elevated with respect to their chow-fed controls, but they did not differ significantly between Lsel−/−Keap1flx/flx and Lsel−/−Keap1Δhepa mice (Figure 3a). Histological analysis of the liver using H&E staining revealed a significant increase in hepatocyte ballooning with micro- and macrosteatosis in both mouse strains after 24 weeks of WD but no difference between Lsel−/−Keap1flx/flx and Lsel−/−Keap1Δhepa mice (Figure 3b,c). Lsel−/−Keap1Δhepa mice had a slightly increased NAFLD activity score (NAS) under conditions of chow diet, which was not significant when compared to similarly fed Lsel−/−Keap1flx/flx mice. We also analyzed the expression levels of genes that are known to change during NAFLD progression via RT-PCR from liver tissue homogenates. In addition to a small decrease in interleukin-6 (IL-6) mRNA and a trend toward increased Forkhead box P3 (FoxP3) levels in Lsel−/−Keap1Δhepa mice, which was not significant, WD feeding did not cause a change in inflammatory gene expression in the livers of either mouse strain. However, under basal conditions of chow feeding, Lsel−/−Keap1Δhepa mice did show an increase in gene expression in the pro-inflammatory mediators interferon-γ (Ifn-γ), Il-1β, and Il-6 (Figure 3d). Although we did not observe any difference in NAS scores between WD-treated Lsel−/−Keap1flx/flx and Lsel−/−Keap1Δhepa mice, the plasma levels of both alanine aminotransferase (ALT) and aspartate aminotransferase (AST) were found to be significantly increased only in Lsel−/−Keap1flx/flx mice. This may suggest that Nrf2 activation protects Lsel−/−Keap1Δhepa mice to some extent from liver damage (Figure 3e,f). In line with these results, after 24 weeks of WD treatment, Lsel−/−Keap1Δhepa mice exhibited significantly decreased levels of alkaline phosphatase (ALP) when compared to their similarly treated Lsel−/−Keap1flx/flx littermates (Figure 3g). Increased intrahepatic inflammatory immune cell immigration is a characteristic feature of progressing NAFLD. Therefore, we performed flow cytometric analysis of different liver immune cell populations. Detailed analysis of major leukocyte groups included CD4+ T cells, CD8+ T cells, B cells, NK cells, neutrophils, and monocytes/macrophages. Under chow diet conditions, we could not find any striking alterations in the frequencies of these cell populations caused by the Nrf2 activation. As expected, we observed only very low frequencies of neutrophils, which can be attributed to the L-selectin-deficiency, in both mouse strains [19]. WD feeding resulted in increased CD4+ T cell frequencies in the livers of Lsel−/−Keap1Δhepa mice and decreased CD11b+F4/80+ monocyte/macrophage frequencies when compared to Lsel−/−Keap1flx/flx littermates (Figure 3h). Whereas CD4+ T cells are mainly thought to provide protection from WD-induced pathologies [38], monocytes/macrophages seem to be central players in the progression of NAFLD [39].

2.4. Nrf2 Activation in Hepatocytes of L-Selectin-Deficient Mice Results in a Decreased Epidydimal White Adipose Tissue/Body Weight Ratio

NAFLD is strongly associated with obesity, and inflamed adipose tissue seems to promote the progression to NASH [40].Hepatocytes comprise up to 80% of the total liver cell population and fulfill key functions. In addition to filtering of blood, nutrient uptake, and detoxification of substances such as alcohol, their functions include the secretion of proteins and lipids and the formation of bile [41]. Therefore, the disturbance of hepatocyte functions, e.g., by increased oxidative stress, could potentially affect all of these processes and have an influence on adipose tissue inflammation, which is accompanied by increased immune cell infiltration, and gut microbiota. Thus, we next analyzed the epidydimal white adipose tissue (eWAT), which is one of the main fat deposits of the body. In both mouse strains, WD feeding caused an increased eWAT/body weight ratio when compared to the respective chow fed controls. However, this increase was significantly lower in the Lsel−/−Keap1Δhepa mice (Figure 4a). Obesity is typically characterized by an increase in size and number of adipocytes [42]. The adipocytes in the two WD-fed mice strains were enlarged to a similar degree in comparison to their chow-fed controls. However, in Lsel−/−Keap1flx/flx mice, a stronger infiltration of immune cells was visible (Figure 4b). This was supported by flow cytometric analysis. Whilst there was no striking difference in the numbers of CD45+ cells/g of adipose tissue between the chow-fed mice strains, the number of these cells was higher in WD-fed Lsel−/−Keap1flx/flx mice than in their Lsel−/−Keap1Δhepa counterparts (1.7 × 10⁶ ± 1.6 × 10⁶ cells/g fat of Lsel−/−Keap1flx/flx mice versus 1.14 × 10⁶ ± 5.94 × 10⁵ cells/g fat of Lsel−/−Keap1Δhepa mice). In Lsel−/−Keap1flx/flx mice, WD treatment resulted in a significantly increased frequency of CD4+ and CD8+ T cells, which was not seen in the Lsel−/−Keap1Δhepa mice, while there were no significant differences in the frequencies of B cells or any other of the innate immune cells analyzed. (Figure 4c,d).

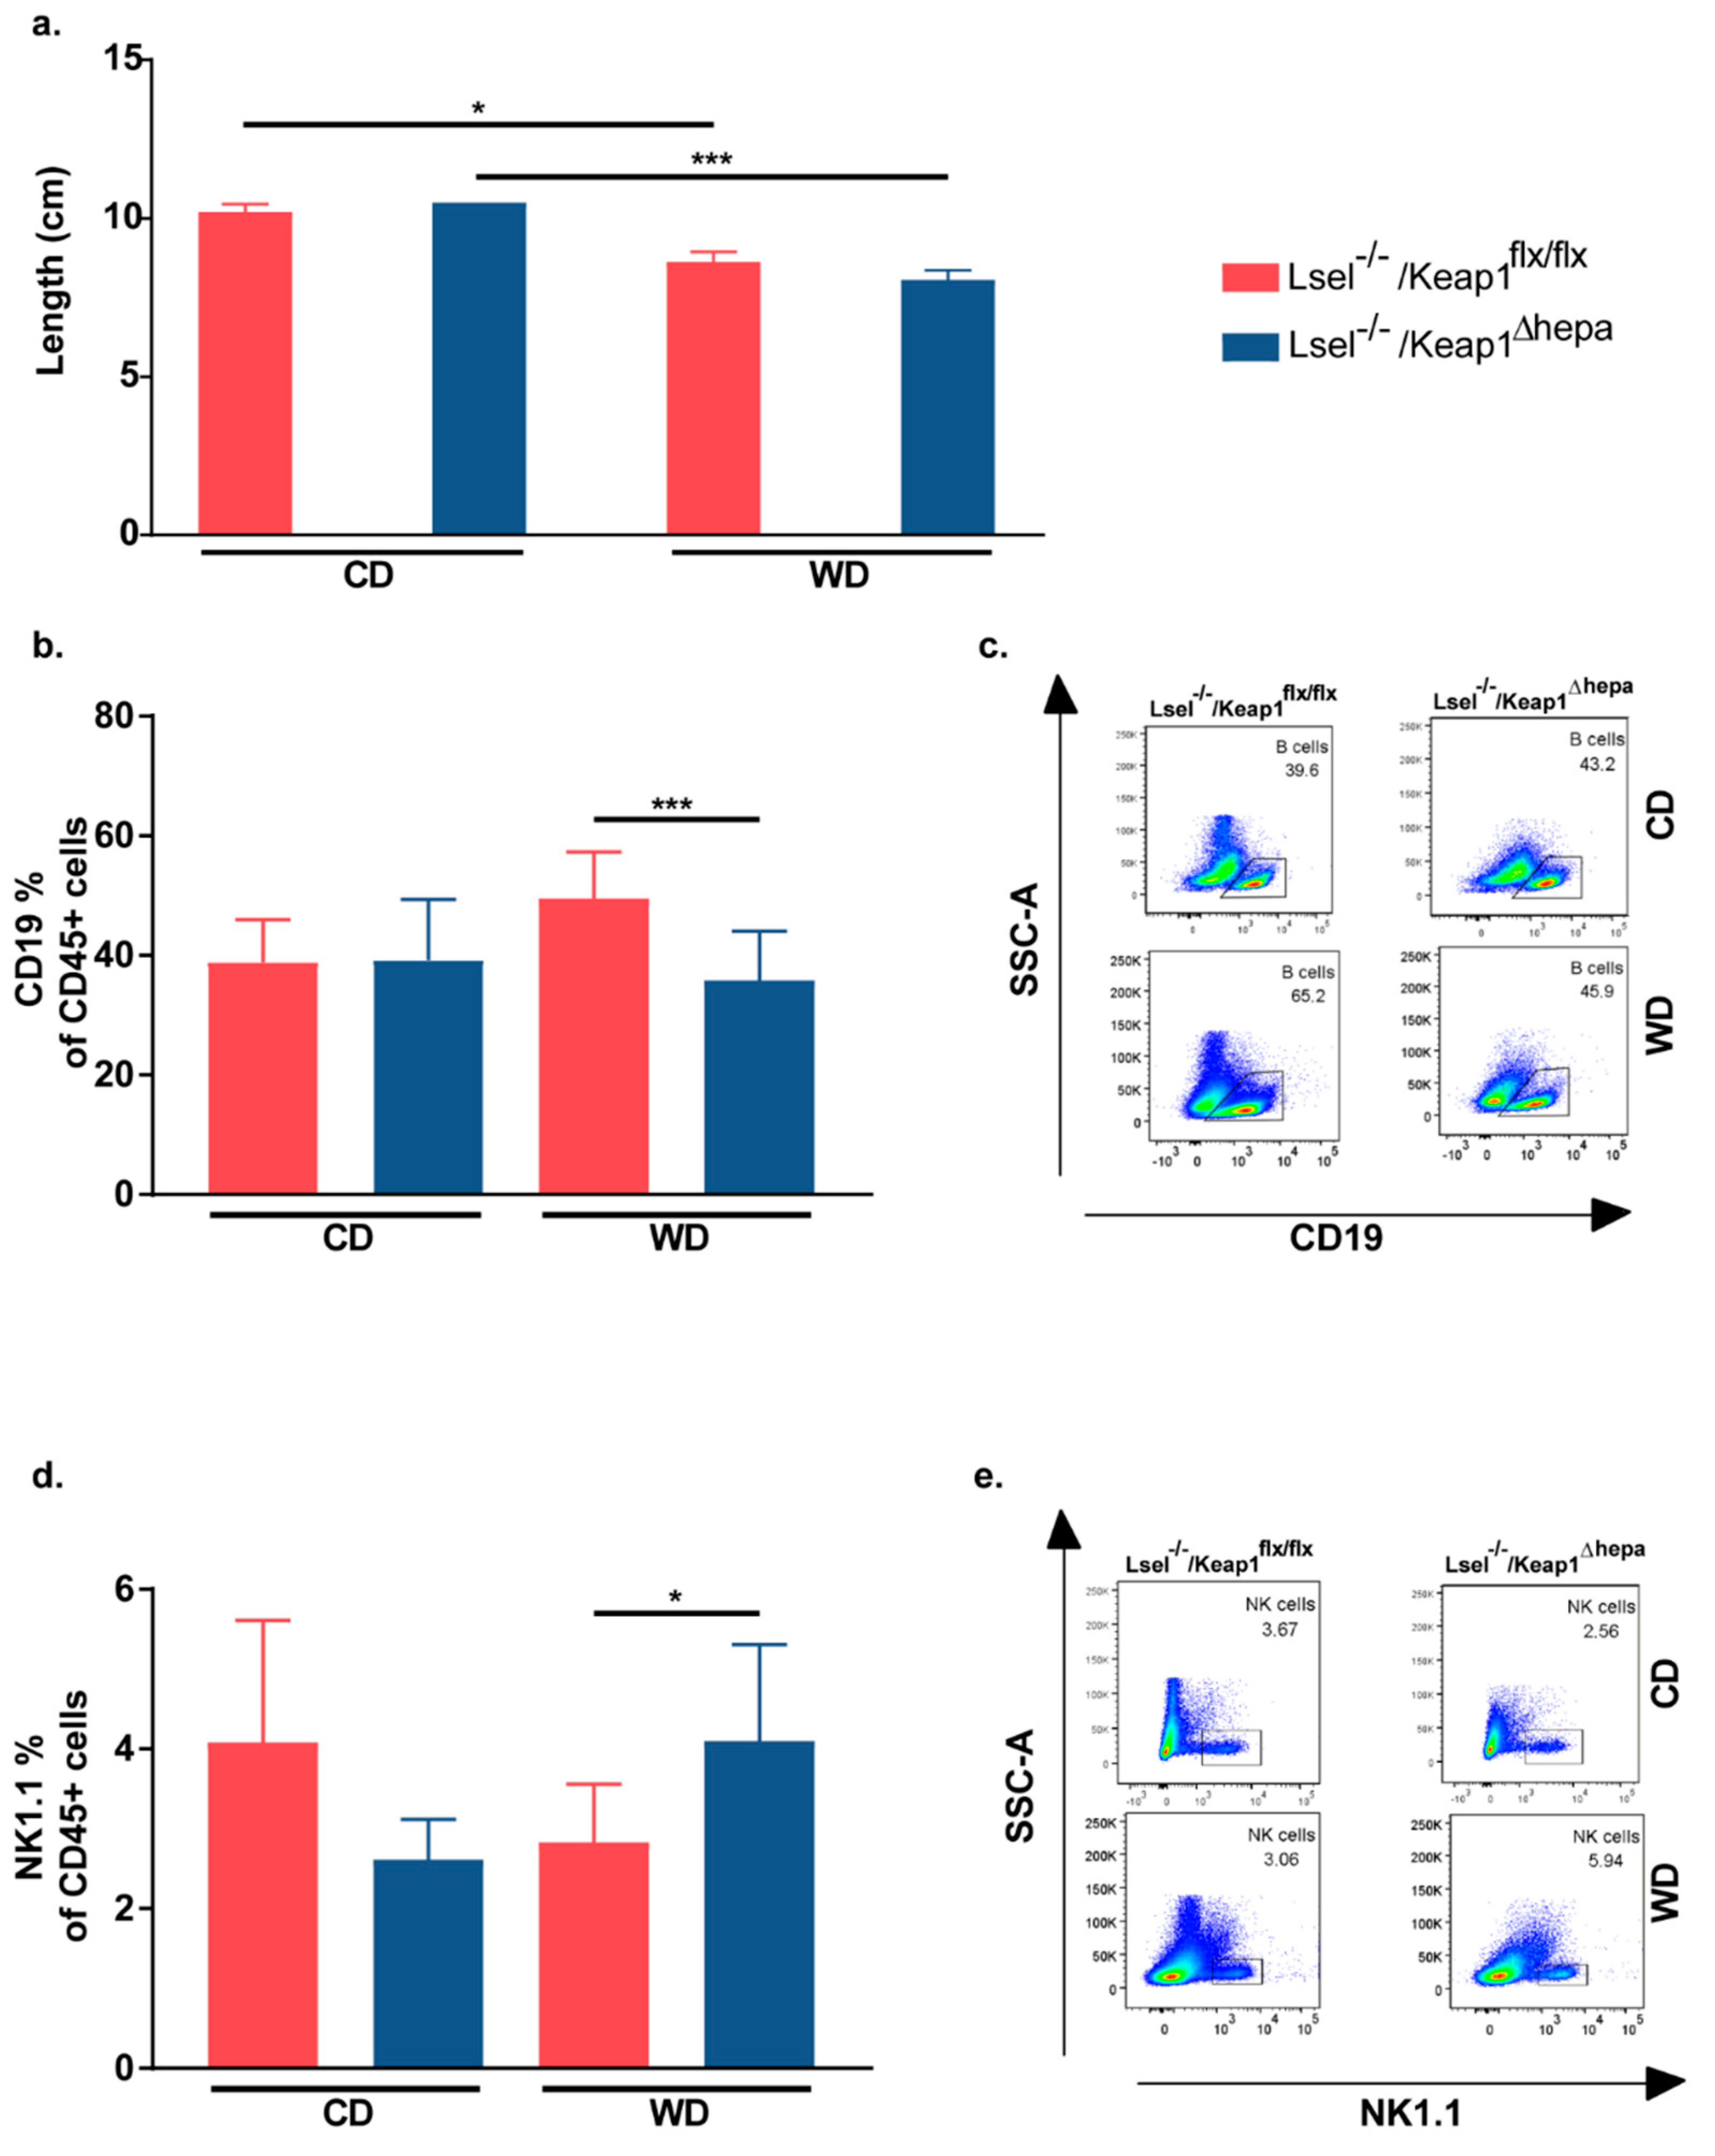
2.5. Nrf2 Activation in Hepatocytes of L-Selectin-Deficient Mice Has Only Minor Effects on WD-Induced Gut Inflammation

WD-induced gut changes are thought to promote low-grade inflammation and metabolic syndrome. Thus, we next performed gut analysis of Lsel−/−Keap1Δhepa and Lsel−/−Keap1flx/flx mice. Colon length is known to be negatively associated with inflammation [43]. Indeed, the consequence of feeding both mouse strains with WD was a significant shortening of the colon in comparison to the respective chow-fed controls. At the same time, there was no difference between different mouse strains fed the same diet (Figure 5a). WD-induced low grade inflammation is usually more subtle and does not involve the large inflammatory immune cell infiltrates typically seen in acute infection or inflammatory bowel disease [44]. Accordingly, we did not detect significant WD-induced inflammatory infiltrates and epithelial damage upon histological scoring of the colon and the large intestine in either mouse strain (Supplementary Figure S3). Next, we used flow cytometry to analyze the impact of WD on the adaptive immune cell populations of the gut in more detail. We observed significantly higher frequencies of CD19+ B cells in the colonic lamina propria of WD-treated Lsel−/−Keap1flx/flx mice compared to similarly treated Lsel−/−Keap1Δhepa littermates. In contrast, NK1+ NK cells were significantly increased in WD-fed Lsel−/−Keap1Δhepa mice (Figure 5b–e). Apart from that, there were no major diet or genotype-induced changes in frequencies of CD4+ T cells, CD8+ T cells, CD19+ B cells, and NK1+ NK cells in the lamina propria and the intestinal epithelial fractions of the small and large intestine (data not shown).

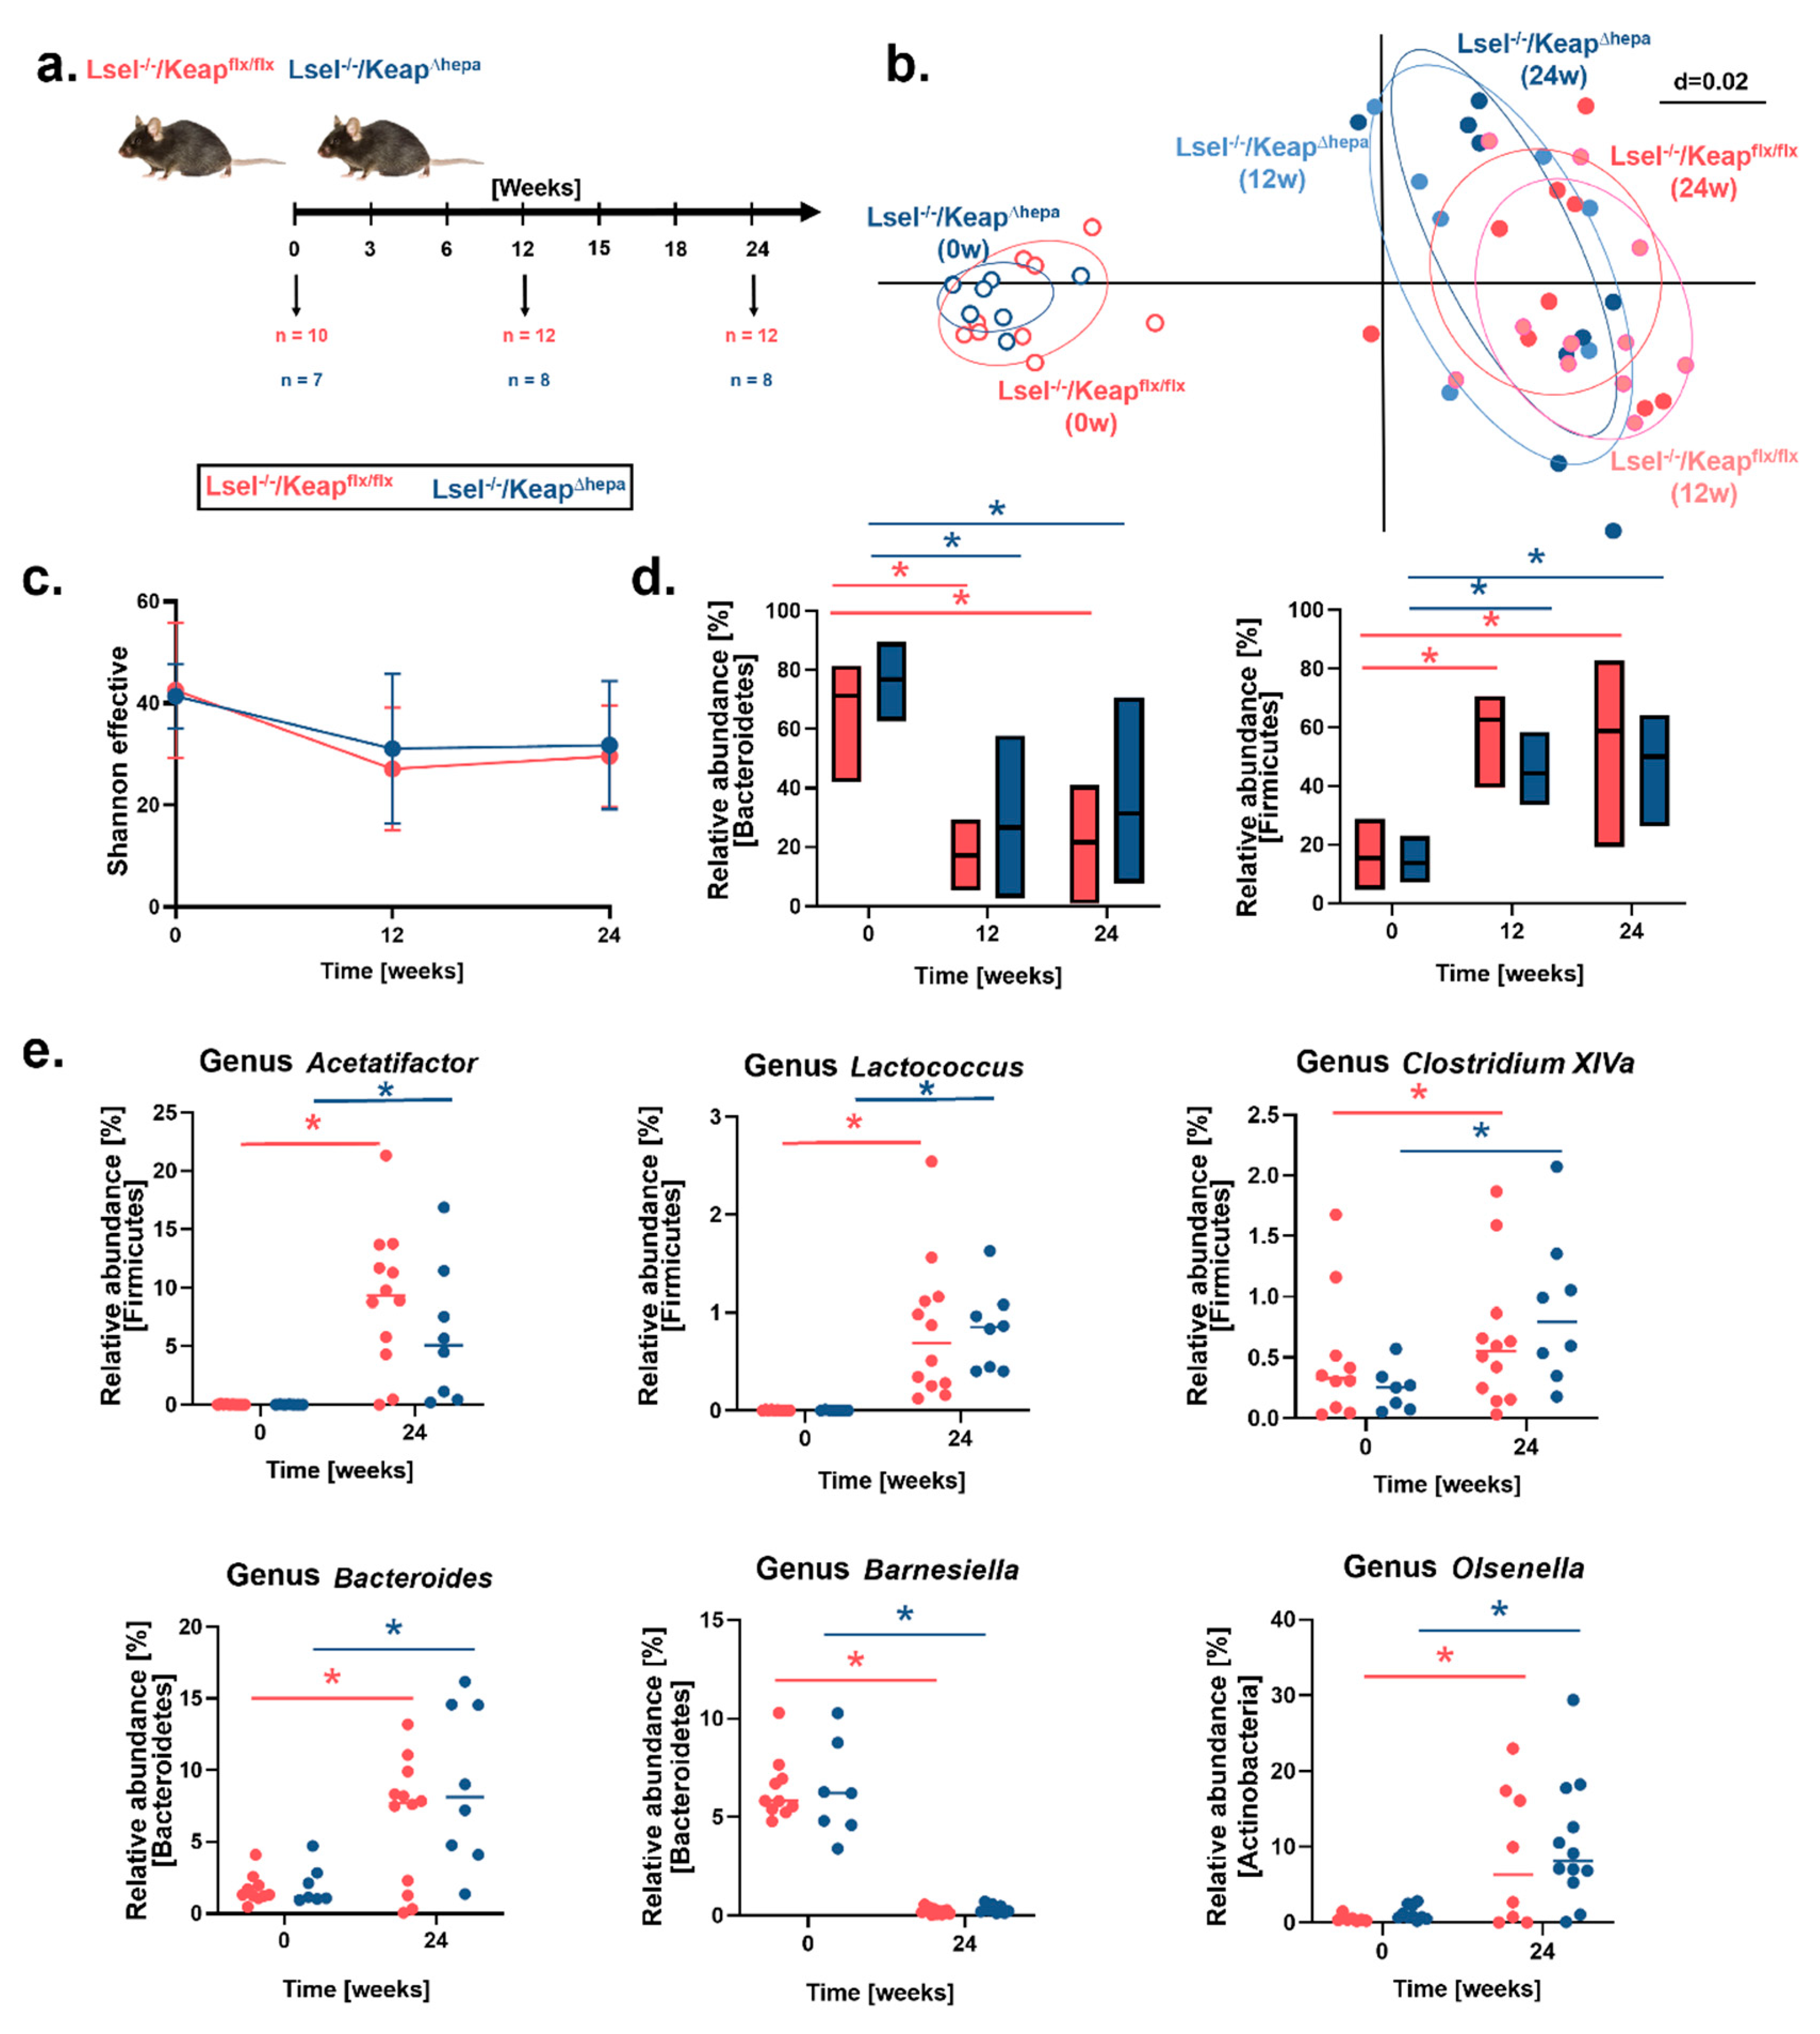
2.6. Fecal Microbiota Profiles Are Altered by WD-Feeding but Not by Hepatic Nrf2 Activation

Obesity and the metabolic syndrome are associated with an altered gut microbiota with decreased bacterial richness. One reason for this could be a reduced bile flow, which is caused by disturbed hepatocyte functions. Bile salts and other products of hepatocytes regulate nutrient uptake, metabolism, microbiota composition, and barrier function in the gut [45]. Amplicon sequencing (16S rRNA gene) was used to investigate whether WD altered the gut microbiota in L-selectin-deficient mice and what influence hepatocytic Nrf2 activation might have. Fecal samples were collected from co-housed WD-fed Lsel−/−Keap1Δhepa and Keap1flx/flx littermates at the start (0 weeks, 17 samples), mid (12 weeks, 20 samples), and end (24 weeks, 20 samples) point of feeding (Figure 6a). Across the 57 samples studied, 736,474 high-quality and chimera-checked sequences (12,921 ± 3331 per sample) were analyzed, representing 190 operational taxonomic units (OTUs) (122 ± 17 OTUs per sample). Sequencing depth was evaluated by means of rarefaction curves and, as apparent from the observed plateau in these curves, all samples passed the quality check and were analyzed further (Supplementary Figure S4). Differences in microbiota profiles between the genotypes at the different time points were assessed by non-metric multidimensional scaling (NMDS) visualization of generalized UniFrac distances (Figure 6b). In comparison to the drastic shift in microbiota profiles due to WD feeding, Lsel−/−Keap1Δhepa and Keap1flx/flx littermates displayed similar profiles at each time point. Next, alpha-diversity was explored via calculation of the Shannon effective, which revealed no significant difference between the mouse strains (Figure 6c). In addition, the relative abundance of major bacterial phyla (Bacteroidetes, Firmicutes, Actinobacteria, Proteobacteria, Tenericutes, Verrumicrobia) was calculated (Figure 6d and Supplementary Figure S5a). Here again, we detected no differences between Lsel−/−Keap1Δhepa and Keap1flx/flx littermates at any time point, but overall, the relative abundance of Bacteroidetes was significantly higher at the starting point, whereas the proportions of Firmicutes were significantly raised after WD feeding. WD feeding increased the ratio of Firmicutes to Bacteriodetes (F/B) in both mouse strains from 0.22 (week 0) to 3.64 (week 12), decreasing to 2.70 (week 24) in Lsel−/− Keap1flx/flx mice, whereas in Lsel−/−Keap1Δhepa littermates, the F/B ratio increased from 0.18 (week 0) to 1.66 (week 12) and decreased to 1.59 (week 24) (Supplementary Figure S5b). Although not significant, Actinobacteria and Proteobacteria tended to be more abundant in the WD-fed mice irrespective of the genotype, whereas the relative abundance of Tenericutes decreased upon WD feeding and Verrumicrobia seemed not to be affected (Supplementary Figure S5a). The WD-induced increase in the relative abundance of Firmicutes, which was unaffected by the mouse genotype, was mainly accounted for by an increase in Clostridiales (from 6 to 35% rel. abund.), Lachnospirales (from 4 to 20% rel. abund.), and Erysipelotrichiales (from 4 to 15% rel. abund.). At the genus level, these changes were characterized by increased Acetatifactor, Lactococcus, and Clostridium XIVa, as well as increased unknown members of Lachnospiraceae, Ruminococcaceae, and Erysipelotrichiaceae (Figure 6e and Supplementary Figure S5c). The WD-induced decrease in the relative abundance of Bacteriodetes was mostly accounted for by an unknown genus belonging to Porphyromonadaceae and members of Barnesiella. Interestingly, the relative abundance of Bacteroides increased with WD (Figure 6e and Supplementary Figure S5c). Within the Actinobacteria, an increase in the relative abundance of Olsenella was noticed upon WD feeding (Figure 6e) and within the Proteobacteria, the relative abundance of an unknown genus of the Desulfovibrioaceae was increased (Supplementary Figure S5c).

3. Discussion

NAFLD and its subsequent complications are growing global health problems. The disease progression of NAFLD, eventually leading to liver damage, is far from fully characterized. It involves a complex interplay of imbalanced inflammatory cell populations and inflammatory signals derived from liver, adipose tissue, and gut [5]. L-selectin-deficient mice are known to be partially protected from WD-induced NAFLD. By comparing these mice with littermates with an additional hepatic Nrf2 activation in the WD-induced obesity model, we wanted to analyze the effects of simultaneously blocking immune cell infiltration and oxidative stress on NAFLD. We found that in terms of metabolic parameters, additional upregulation of the anti-oxidative stress response further improved NAFLD outcome in terms of metabolic changes in L-selectin-deficient mice. Unexpectedly, it had no additional effects on NAFLD progression and microbiota changes.
We have recently shown that in comparison to wild-type mice, L-selectin-deficient mice exhibited reduced fat accumulation and improved glucose tolerance after WD feeding, compared to wild-type controls [19]. In this study, we identified that this phenotype was further improved by the additional activation of Nrf2 in hepatocytes of Lsel−/−Keap1Δhepa mice who display a significant decrease in body weight, eWAT/body weight, and glucose response compared to Keap1flx/flx mice.
In addition to Nrf2 activation of cytoprotective/antioxidant pathways, there is also evidence that Nrf2 can crosstalk with metabolic pathways. Similar to Lsel−/−Keap1Δhepa mice, mice with only hepatocyte-specific Keap1 deletion have been shown to exhibit reduced body weight and peripheral abdominal fat deposition upon WD feeding when compared with similarly treated wild-type mice. This phenotype was accompanied by a comparatively inhibited expression of lipogenic genes [33]. Moreover, mice with hypomorphic Keap1 alleles and resulting Nrf2 activation were partially protected from obesity and more glucose tolerant, which was attributed to a lower expression of gluconeogenic and lipogenic genes mediated by Nrf2-activated adenosine monophosphate (AMP)-activated protein kinase (Ampk) signaling [46].
Nrf2 activation in Lsel−/−Keap1Δhepa mice resulted in increased hepatic expression of Nrf2 target genes, in particular of GSTM-1 and NQO-1. The antioxidant flavoprotein NQO1 uses (nicotinamide adenine dinucleotide) NADH as electron donor to catalyze the reduction of quinone metabolites, thereby generating increased intracellular levels of NAD+. NAD+ is a central regulator in cellular energy metabolism. Increased NAD+ levels initiate a series of events leading to calorie restriction and elevated mitochondrial respiration. [47,48]. Most interestingly, pharmacological stimulation of NQO1 in mice has been shown to reduce body weight, adipose tissue, related serum parameters, and liver steatosis [49]. Therefore, increased NQO1 levels in Lsel−/−Keap1Δhepa mice may be responsible for the observed improvement in metabolic dysfunction. In addition, it has also been shown that GLRX deficiency promotes steatosis and hepatic lipogenesis under certain diets, so that the activation of this gene could also have contributed to the observed beneficial effects [50].
L-selectin-deficient mice exhibited less steatosis and steatohepatitis upon WD feeding [19]. Addition of the hepatocytic Keap1 deletion failed to confer any additional benefits, suggesting the benefits of these two mutations are not cumulative. This was unexpected, as mice with Nrf2 activation have been shown to develop less liver steatosis when compared to wild types [33,46]. In addition, Lsel−/−Keap1Δhepa mice exhibited no major alteration in inflammatory gene expression and it was only liver damage, as detected by transaminases and ALP levels, that was slightly improved. This result is in line with our expectations, as the Keap1 deletion alone has not been shown to reduce liver inflammation [33]. Interestingly, in homeostasis, Lsel−/−Keap1Δhepa mice exhibited slightly elevated levels of some inflammatory mediators and, although not significant, a trend toward an increased NAS score when compared to their Keap1flx/flx littermates. This result indicates that hepatocyte-specific Keap1 deletion per se is not beneficial under conditions of homeostasis. Nrf2 deletion or suppression was found to be detrimental for liver regeneration [51], increased WAT inflammation [52], and accelerated NASH [53], whereas Nrf2 activation in disease models prevented metabolic dysregulation and decelerated NASH [36,54]. However, Nrf2 activation in leptin-deficient mice elicited conflicting results by worsening steatosis and glucose tolerance [55]. Furthermore, Nrf2 deficiency protected from fibrosis and tumorigenesis in mice with defective hepatic autophagy [56]. A more directed approach would be the specific activation of only one or two Nrf2 target genes such as NQO1, thereby reducing the number of unwanted side effects.
Excess adipose tissue increases the secretion of a range of factors such as adipokines, cytokines, and fatty acids, predisposing individuals to the development of NAFLD. Additional hepatic Nrf2 activation improved the metabolic phenotype of WD-fed L-selectin-deficient mice, as exhibited by reduced visceral body fat with fewer immune cell infiltrations. Concerning the gut, both mouse mutants displayed a significant shortening of the colon upon WD feeding. This could indicate WD-induced low-grade inflammation, although the frequencies of CD19+ B cells in the lamina propria of Lsel−/−Keap1Δhepa were significantly reduced, and we did not observe any noticeable histological changes.
Previous research has shown that transferring the microbiota from obese to germ-free mice led to increased weight and fat gain, highlighting the impact of the gut microbiota [57,58]. This effect is further influenced by diet, which impacts both the host and the microbiota [59]. Due to this, the WD has become a standard model for reproducibly altering the gut microbiota, which in turn influences the host. In fecal samples of Lsel−/−Keap1Δhepa mice and Keap1flx/flx littermates fed a WD, two distinct microbial community clusters were identified, corresponding to the two dietary conditions. WD feeding dramatically altered microbiota profiles after 12 weeks with no further alterations at 24 weeks. However, no genotype-dependent clustering was observed. The WD diet significantly altered the taxonomic profile at both phyla and genus level, with reduced bacterial richness and an increased Firmicutes/Bacteroidetes ratio. According to Xiao et al., Clostridia are enriched upon WD feeding, thereby accelerating bile acid 7-alpha dehydroxylation [60]. Consistent with that report, our study also shows a WD-induced relative increase in Clostridiales and Lachnospirales with increased relative abundance of Clostridium XIVa and Acetatifactor, respectively. This also corresponds to reports of increased abundance of Clostridium in obese mice and in a Westernized humanized mouse model [61] and higher abundance of Acetatifactor upon high-fat diet feeding [62]. In addition, Erysipelotrichiaceae, also members of the Firmicutes, were found to be strongly increased. Turnbaugh et al. [61] and Fleissner et al. [63] previously reported increased representation of Erysipelotrichiaceae in WD-associated humanized mouse microbiota and WD-fed conventional mice, respectively. Another genus belonging to Firmicutes that is associated with diet-induced obesity, in mice, is Lactococcus [64]. Our observation of a relative increase in Lactococcus after WD feeding supports this. Within the Bacteroidetes phylum, WD caused a drastic decrease in the Porphyromonadaceae, which represented the most abundant family detected. This corroborates former studies [62]. In particular, the abundance of Barnesiella, a bacterium associated with ‘lean microbiota’ and negatively associated with metabolic syndrome phenotype [62,65,66], was strongly reduced. In contrast, the relative abundance of Bacteroides was increased by WD feeding. Bacteroides were shown to be enriched in Type 2 diabetes in humans consuming a high-fat diet, and they are associated with long-term consumption of a fat-enriched diet [67,68,69]. They might indicate potential inflammation, as members of this genus have previously been associated with colitis [70]. With regard to Proteobacteria, WD caused a significant increase in an unknown genus of Desulfovibrionaceae. This result is in line with studies showing a positive correlation between fat intake and Proteobacteria [71,72]. According to Shin et al., abnormal growth of Proteobacteria may reflect an imbalance in the gut microbial population and be a potential marker of disease risk [73]. The phylum Actinobacteria was dominated by the genus Olsenella, which was often strongly increased in WD-treated mice. This was unexpected, as Olsenella is more abundant in lean people compared to obese people and was reported to decrease in mice subjected to high-fat feeding [65,74,75,76]. In addition, the relative abundance of Ruminococcaceae (phylum Firmicutes) was found to be increased by WD. These bacteria, such as Olsenella, can produce short chain fatty acids, and they are thought to protect the gut barrier and provide energy for intestinal cells. Overall, even though WD-induced changes in the fecal microbiota were observed in our study, the lack of difference between the two mouse strains (Lsel−/−Keap1flx/flx vs. Lsel−/−Keap∆hepa) suggests that Nrf2 activation in hepatocytes has no relevance for the composition and constitution of the gut microbiota under these conditions.
In conclusion, we have demonstrated that an upregulation of the anti-oxidative stress response in hepatocytes improves the metabolism of L-selectin-deficient mice under conditions of WD feeding, but it confers no benefit in relation to homeostasis. Furthermore, it does not prevent NAFLD progression and associated changes in the microbiome. These findings extend our understanding of the processes underlying NAFLD development, which will be important for the development of new therapies.

4. Materials and Methods

4.1. Housing, Generation of Mice, and Dietary Treatments

Animals were housed in the animal facility of the University Hospital RWTH Aachen with 12 h light/dark cycles and water and food available ad libitum.
Hepatocyte-specific Keap1 deletion in L-selectin-deficient mice was achieved by crossing floxed-Keap1 mice, expressing Cre recombinase heterozygote under the regulation of the Albumin gene (Alb-Cre mice) [31,33], with L-selectin-deficient mice [77], all on a C57BL76J background. The resulting L-selectin-deficient Alb-cre negative Keap1fl/fl mice (Lsel−/−Keap1flx/flx) and Alb-cre positive littermates with hepatocyte-specific conditional Keap1 deletion (Lsel−/−Keap1Δhepa) were used as experimental animals.
Western diet (WD) treatments were performed with 9–15-week-old male mice weighing at least 25 g. Mice were fed first chow (9 kcal % fat, 24 kcal % protein, 67 kcal % carbohydrates) (ssniff, Soest, Germany, rat/mouse–maintenance) or WD (40 kcal % fat (vegetable fats, 20 kcal % fructose, 2% cholesterol) (Brogaarden, Lynge, Denmark; cat. no. D09100301) for 24 weeks. Food intake and body weights were measured weekly. All experiments were repeated in two independent experimental setups.

4.2. Glucose Tolerance Test (GTT)

Mice were fasted for 6 h and blood glucose was measured using an Accu-Check® Aviva meter (Roche, Basel, Switzerland), via one drop of blood taken from the animal’s tail, every 15 min for 2 h following intraperitoneal administration of 2 g/kg glucose.

4.3. Serum and Liver Biochemical Measurements

Serum aspartate aminotransferase (AST), serum alanine aminotransferase (ALT), alkaline phosphatase (ALP), glucose, triglyceride, and cholesterol levels in serum were measured by the Central Laboratory Facility of the University Hospital, RWTH Aachen. For the determination of the intrahepatic triglyceride (TG) concentration, 20 mg liver was homogenized in 1 mL of a homogenization buffer (10 mM Tris, 2 mM EDTA, 0.25 M sucrose, pH 7.5), and the assay was performed in accordance with the manufacturer’s instructions of the Instruchemie LiquiColor mono Kit (Instruchemie, Delfzijl, the Netherlands). For intrahepatic free fatty acid (FFA) quantification, the total amount of lipids within 20 mg snap-frozen liver tissue were extracted with chloroform-Triton X-100. The concentration of FFA was measured with the FFA quantification kit (Abcam, Cambridge, UK; cat. no ab65345) in accordance with the manufacturer’s instructions.

4.4. Histological Stainings

Following fixation with 4% formalin/PBS, livers, intestines, and adipose tissue were embedded in paraffin. Then, 3 μm paraffin sections were serially cut, mounted onto glass slides, deparaffinized, and stained with H&E. Histopathological scoring of sections from liver, colon, and small intestine and their validation was performed blinded via an NAFLD activity score (NAS), a colon score, and a score for the small intestine, as described previously [78,79,80].
For immunofluorescence staining of hepatocytes, hepatocytes were allowed to attach to collagen-coated cover slips and were then fixed in 4% paraformaldehyde, permeabilized in 0.2% Triton X-100, blocked with 2% goat serum, and incubated with a rabbit-anti-Nrf2 antibody for 1 h at room temperature. Then, they were treated with a secondary Cy3 labeled goat-anti-rabbit IgG for 1 h in the dark at room temperature (the antibodies utilized are listed in Table 1 below). Nuclei were stained for 2 min with DAPI. Images were acquired using an Axioplan2 fluorescence microscope (Carl Zeiss Microscopy, Oberkochen, Germany) and Zen lite software (Carl Zeiss Microscopy, Oberkochen, Germany).

4.5. Isolation of Cells and Flow Cytometry

For flow cytometric analysis of intraheptatic leukocytes, livers were perfused with phosphate-buffered saline (PBS), minced with scissors, and digested for 45 min in RPMI medium containing 10% fetal calf serum (FCS), 1% penicillin/streptomycin, 1.25 mg/mL collagenase D, and 3 µL/mL (stock: 10 mg/mL) DNAse 1. After stopping the enzyme activity with 2 mM EDTA, the digestion mixture was passed through 40 µm cell strainers. After centrifugation for 10 min at 400× g, the suspension was subjected to gradient centrifugation using 35% percoll at 750× g for 20 min to remove debris. The cell sediment was subjected to red cell lysis using Pharmlyse (BD) and after washing was ready for staining. Hepatocytes, adipose tissue, gut IELs, and LPLs were prepared as described previously [81,82,83,84]. Single cell suspensions were stained directly using combinations of the monoclonal antibodies listed in Table 1.
Intracellular Nrf2 staining was performed with an intracellular Foxp3 staining buffer set (eBioscience, Frankfurt, Germany). Hepatocytes from Nrf2−/− mice [85] were used as negative control in addition to a florescence minus one (FMO) control.
To analyze the net intracellular generation of ROS, the cellular fluorescence intensity was measured after 60 min incubation of hepatocyte suspensions with ROS Assay Stain in accordance with the manufacturer’s instructions of the Total Reactive Oxygen Species (ROS) Assay Kit (Invitrogen, Waltham, MA, USA). Anti-CD45 and anti-CD146 antibodies were added for the last 15 min of the incubation. Cells that were negative for CD146 and CD45 were analyzed for Nrf2 expression. Similarly treated cells incubated at 4 °C served as negative control.
All flow cytometric measurements were performed on a Canto-II cytometer (BD Biosciences). Data were analyzed by FlowJo 8.7.2 and 10.2 software (Tree Star, Ashland, OR, USA).

4.6. Gene Expression Analysis by Real-Time PCR

Total RNA isolations from the liver and complementary DNA (cDNA) synthesis were performed as described previously [79]. Real-time polymerase chain reactions (RT-PCR) were performed in duplicate in a total volume of 20 µL, on a 7300 RT-PCR system with 7000 System SDS Software Version 1.2.3 (Applied Bioscience, Darmstadt, Germany) using the quantitative (q)PCR Master Mix for SYBR Green I (Eurogentec, Cologne, Germany). Primer sequences are listed in Table 2. Glyceraldehyde 3-phosphate dehydrogenase (GAPDH was used as endogenous control for normalization).

4.7. DNA Isolation from Feces, 16S rRNA Gene Amplicon Sequencing, and Data Analysis

Metagenomic DNA was extracted from frozen fecal pellets by bacterial disruption using zirconia beads (Biospec) and a FastPrep 24 device (MP Biomedical, USA) at 6 m/s for 20 s. Homogenates were incubated at 80 °C for 10 min, centrifuged at 17000×g for 1 min, and supernatant was used for DNA isolation using the QIAamp fast DNA stool kit (Qiagen, Cat. No. 51604) according to the supplier’s instruction. The V3/V4 region of 16S rRNA genes was amplified (25 cycles) from 24 ng of metagenomic DNA using primer 341F and 785R in a two-step procedure to limit amplification bias [86,87]. Libraries were double-barcoded (8-nt index on each of the forward and reverse 2nd-step primer) [88,89]. Amplicons were purified using the AMPure XP system (Beckmann Coulter Biomedical GmbH), pooled in an equimolar amount with addition of 25% (v/v) PhiX library, and sequenced in paired-end modus (PE275) using a MiSeq system (Illumina).
Then, 16s rRNA amplicon sequencing was done at the Core Facility Microbiome/NGS at the Technical University of Munich. Data processing was done using the IMNGS platform [90], applying the UPARSE analysis pipeline [91] with the following settings: Number of allowed mismatches in the barcode: 1; Minimal fastq quality score for trimming of unpaired reads: 20; Maximal rate of expected errors in paired sequences: 2; Min relative abundance of operational taxonomic units (OTUs) cutoff (0–1): 0.25%. The data were submitted to the Sequence Read Archive and are available under the accession number PRJNA714661.

4.8. Statistical Analysis of Microbiota Sequencing

Statistical analysis of data from mouse experiments was performed with GraphPad Prism software (version 7; GraphPad, La Jolla, CA, USA). Data are presented as mean ± Standard Deviation (SD). Significance values were calculated using the Student’s t-test when comparing two groups or one-way analysis of variance (ANOVA) and Sidak or Tukey post-test. Values of p < 0.05 were considered significant (* p < 0.05, ** p < 0.01, *** p < 0.001, and **** p 0.0001).
Statistical analysis of data from microbiota sequencing were performed using Rhea in the R programming environment [92]. Alpha- and beta-diversity were calculated from normalized data using generalized UniFrac distances in the latter case. Visualization of the multidimensional distance matrix was achieved through either Multi-Dimensional Scaling (MDS) or its non-metric counterpart (NMDS).

Supplementary Materials

Supplementary materials can be found at https://www.mdpi.com/article/10.3390/ijms22147314/s1. Figure S1: Flow cytometric analysis of intracellular ROS in hepatocytes. Figure S2: Immune cell subset gating by multiparameter flow cytometry. Figure S3: WD-feeding does not cause significant histological gut changes. Figure S4: Rarefaction curves depicting sequencing depth. Figure S5: WD-feeding causes robust shifts in gut microbiota composition.

Author Contributions

Conceptualization, A.S., H.K.D. and D.C.K.; methodology, S.E., T.C.A.H., T.R., A.B. and M.M.; software, S.E., A.B. and T.C.A.H.; investigation, S.E., A.B., H.K.D. and M.M.; resources, C.T. and D.C.K.; writing—original draft preparation, A.S., S.E. and T.C.; supervision, A.S. and N.W.; funding acquisition, A.S., N.W., C.T. and T.C. All authors have read and agreed to the published version of the manuscript.

Funding

Please add: This research was funded by the DFG (German Research Foundation)–Project-ID 403224013–SFB 1382 to T.C.A.H., T.C., C.T., N.W. and A.S.

Institutional Review Board Statement

The study was carried out in accordance with ARRIVE guidelines and the regulations laid down by the regional authorities for nature, environmental, and consumer protection of North Rhine-Westphalia (LANUV, Recklinghausen, Germany) and approved by the respective Committee (Permit Number: 84-02.04.2014.A010). All experiments were performed in accordance with the German guidelines for animal housing and husbandry. Treatments fulfilled the criteria of the German administrative panel on laboratory animal care.

Informed Consent Statement

Not applicable.

Data Availability Statement

The microbiota sequencing data presented in this study are openly available under the accession number PRJNA714661.

Acknowledgments

The authors thank Kerstin Esser for technical assistance.

Conflicts of Interest

The authors declare no conflict of interest. The funders had no role in the design of the study; in the collection, analyses, or interpretation of data; in the writing of the manuscript, or in the decision to publish the results.

Abbreviations

AF488Alexa Fluor 488
APC-Cy7Allophycocyanin-cyanine 7
CDChow diet
GAPDHGlyceraldehyde 3-phosphate dehydrogenase
GCLMGlutamate-cysteine ligase modifier
GLRXGlutaredoxin
GSTM1Glutathion S-transferase1
HO-1Heme oxygenase-1
IFN-γInterferon γ
IL-6Interleukin-6
NAFLDNon-alcoholic fatty liver disease
NASHNon-alcoholic steatohepatitis
NKNatural killer
NQO-1NAD(P)H quinone dehydrogenase 1
PEPhycoerythrin
PerCP-Cy5.5Peridinin chlorophyll protein-cyanine5.5
ROSReactive oxygen species
TNF-αTumor necrosis factor- α
TRXThioredoixin
WDWestern diet

References

  1. Younossi, Z.; Tacke, F.; Arrese, M.; Chander Sharma, B.; Mostafa, I.; Bugianesi, E.; Wai-Sun Wong, V.; Yilmaz, Y.; George, J.; Fan, J.; et al. Global Perspectives on Nonalcoholic Fatty Liver Disease and Nonalcoholic Steatohepatitis. Hepatology 2019, 69, 2672–2682. [Google Scholar] [CrossRef] [PubMed] [Green Version]
  2. Dulai, P.S.; Singh, S.; Patel, J.; Soni, M.; Prokop, L.J.; Younossi, Z.; Sebastiani, G.; Ekstedt, M.; Hagstrom, H.; Nasr, P.; et al. Increased risk of mortality by fibrosis stage in nonalcoholic fatty liver disease: Systematic review and meta-analysis. Hepatology 2017, 65, 1557–1565. [Google Scholar] [CrossRef] [PubMed]
  3. Marchesini, G.; Brizi, M.; Bianchi, G.; Tomassetti, S.; Bugianesi, E.; Lenzi, M.; McCullough, A.J.; Natale, S.; Forlani, G.; Melchionda, N. Nonalcoholic fatty liver disease: A feature of the metabolic syndrome. Diabetes 2001, 50, 1844–1850. [Google Scholar] [CrossRef] [PubMed] [Green Version]
  4. Barrera, F.; George, J. The role of diet and nutritional intervention for the management of patients with NAFLD. Clin. Liver Dis. 2014, 18, 91–112. [Google Scholar] [CrossRef] [PubMed]
  5. Pierantonelli, I.; Svegliati-Baroni, G. Nonalcoholic Fatty Liver Disease: Basic Pathogenetic Mechanisms in the Progression from NAFLD to NASH. Transplantation 2019, 103, e1–e13. [Google Scholar] [CrossRef] [PubMed]
  6. Dumas, M.E.; Barton, R.H.; Toye, A.; Cloarec, O.; Blancher, C.; Rothwell, A.; Fearnside, J.; Tatoud, R.; Blanc, V.; Lindon, J.C.; et al. Metabolic profiling reveals a contribution of gut microbiota to fatty liver phenotype in insulin-resistant mice. Proc. Natl. Acad. Sci. USA 2006, 103, 12511–12516. [Google Scholar] [CrossRef] [Green Version]
  7. Jiang, W.; Wu, N.; Wang, X.; Chi, Y.; Zhang, Y.; Qiu, X.; Hu, Y.; Li, J.; Liu, Y. Dysbiosis gut microbiota associated with inflammation and impaired mucosal immune function in intestine of humans with non-alcoholic fatty liver disease. Sci. Rep. 2015, 5, 8096. [Google Scholar] [CrossRef]
  8. Mouzaki, M.; Comelli, E.M.; Arendt, B.M.; Bonengel, J.; Fung, S.K.; Fischer, S.E.; McGilvray, I.D.; Allard, J.P. Intestinal microbiota in patients with nonalcoholic fatty liver disease. Hepatology 2013, 58, 120–127. [Google Scholar] [CrossRef] [Green Version]
  9. Gadd, V.L.; Skoien, R.; Powell, E.E.; Fagan, K.J.; Winterford, C.; Horsfall, L.; Irvine, K.; Clouston, A.D. The portal inflammatory infiltrate and ductular reaction in human nonalcoholic fatty liver disease. Hepatology 2014, 59, 1393–1405. [Google Scholar] [CrossRef]
  10. Wolf, M.J.; Adili, A.; Piotrowitz, K.; Abdullah, Z.; Boege, Y.; Stemmer, K.; Ringelhan, M.; Simonavicius, N.; Egger, M.; Wohlleber, D.; et al. Metabolic activation of intrahepatic CD8+ T cells and NKT cells causes nonalcoholic steatohepatitis and liver cancer via cross-talk with hepatocytes. Cancer Cell 2014, 26, 549–564. [Google Scholar] [CrossRef] [Green Version]
  11. Springer, T.A. Traffic signals for lymphocyte recirculation and leukocyte emigration: The multistep paradigm. Cell 1994, 76, 301–314. [Google Scholar] [CrossRef]
  12. Ivetic, A.; Hoskins Green, H.L.; Hart, S.J. L-selectin: A Major Regulator of Leukocyte Adhesion, Migration and Signaling. Front. Immunol. 2019, 10, 1068. [Google Scholar] [CrossRef] [Green Version]
  13. Gallatin, W.M.; Weissman, I.L.; Butcher, E.C. A cell-surface molecule involved in organ-specific homing of lymphocytes. Nature 1983, 304, 30–34. [Google Scholar] [CrossRef]
  14. Martinez-Mier, G.; Toledo-Pereyra, L.H.; McDuffie, E.; Warner, R.L.; Ward, P.A. L-Selectin and chemokine response after liver ischemia and reperfusion. J. Surg. Res. 2000, 93, 156–162. [Google Scholar] [CrossRef]
  15. Lawson, J.A.; Burns, A.R.; Farhood, A.; Lynn Bajt, M.; Collins, R.G.; Smith, C.W.; Jaeschke, H. Pathophysiologic importance of E- and L-selectin for neutrophil-induced liver injury during endotoxemia in mice. Hepatology 2000, 32, 990–998. [Google Scholar] [CrossRef]
  16. Mitsui, A.; Tada, Y.; Shibata, S.; Kamata, M.; Hau, C.; Asahina, A.; Sato, S. Deficiency of both L-selectin and ICAM-1 exacerbates imiquimod-induced psoriasis-like skin inflammation through increased infiltration of antigen presenting cells. Clin. Immunol. 2015, 157, 43–55. [Google Scholar] [CrossRef]
  17. Oishi, K.; Hamaguchi, Y.; Matsushita, T.; Hasegawa, M.; Okiyama, N.; Dernedde, J.; Weinhart, M.; Haag, R.; Tedder, T.F.; Takehara, K.; et al. A crucial role of L-selectin in C protein-induced experimental polymyositis in mice. Arthritis Rheumatol. 2014, 66, 1864–1871. [Google Scholar] [CrossRef] [Green Version]
  18. Kolachala, V.L.; Palle, S.; Shen, M.; Feng, A.; Shayakhmetov, D.; Gupta, N.A. Loss of L-selectin-guided CD8(+), but not CD4(+), cells protects against ischemia reperfusion injury in a steatotic liver. Hepatology 2017, 66, 1258–1274. [Google Scholar] [CrossRef] [Green Version]
  19. Drescher, H.K.; Schippers, A.; Rosenhain, S.; Gremse, F.; Bongiovanni, L.; Bruin, A.; Eswaran, S.; Gallage, S.U.; Pfister, D.; Szydlowska, M.; et al. L-Selectin/CD62L is a Key Driver of Non-Alcoholic Steatohepatitis in Mice and Men. Cells 2020, 9, 1106. [Google Scholar] [CrossRef]
  20. Yesilova, Z.; Yaman, H.; Oktenli, C.; Ozcan, A.; Uygun, A.; Cakir, E.; Sanisoglu, S.Y.; Erdil, A.; Ates, Y.; Aslan, M.; et al. Systemic markers of lipid peroxidation and antioxidants in patients with nonalcoholic Fatty liver disease. Am. J. Gastroenterol. 2005, 100, 850–855. [Google Scholar] [CrossRef]
  21. Da Costa, R.M.; Fais, R.S.; Dechandt, C.R.P.; Louzada-Junior, P.; Alberici, L.C.; Lobato, N.S.; Tostes, R.C. Increased mitochondrial ROS generation mediates the loss of the anti-contractile effects of perivascular adipose tissue in high-fat diet obese mice. Br. J. Pharmacol. 2017, 174, 3527–3541. [Google Scholar] [CrossRef] [PubMed] [Green Version]
  22. Galli, A.; Svegliati-Baroni, G.; Ceni, E.; Milani, S.; Ridolfi, F.; Salzano, R.; Tarocchi, M.; Grappone, C.; Pellegrini, G.; Benedetti, A.; et al. Oxidative stress stimulates proliferation and invasiveness of hepatic stellate cells via a MMP2-mediated mechanism. Hepatology 2005, 41, 1074–1084. [Google Scholar] [CrossRef] [PubMed]
  23. Svegliati-Baroni, G.; Saccomanno, S.; Van Goor, H.; Jansen, P.; Benedetti, A.; Moshage, H. Involvement of reactive oxygen species and nitric oxide radicals in activation and proliferation of rat hepatic stellate cells. Liver 2001, 21, 1–12. [Google Scholar] [CrossRef] [PubMed] [Green Version]
  24. Nguyen, T.; Sherratt, P.J.; Pickett, C.B. Regulatory mechanisms controlling gene expression mediated by the antioxidant response element. Annu. Rev. Pharmacol. Toxicol. 2003, 43, 233–260. [Google Scholar] [CrossRef]
  25. Lee, J.M.; Li, J.; Johnson, D.A.; Stein, T.D.; Kraft, A.D.; Calkins, M.J.; Jakel, R.J.; Johnson, J.A. Nrf2, a multi-organ protector? FASEB J. 2005, 19, 1061–1066. [Google Scholar] [CrossRef] [Green Version]
  26. He, F.; Ru, X.; Wen, T. NRF2, a Transcription Factor for Stress Response and Beyond. Int. J. Mol. Sci. 2020, 21, 4777. [Google Scholar] [CrossRef]
  27. Wu, K.C.; Cui, J.Y.; Klaassen, C.D. Beneficial role of Nrf2 in regulating NADPH generation and consumption. Toxicol. Sci. 2011, 123, 590–600. [Google Scholar] [CrossRef] [Green Version]
  28. Bellezza, I.; Giambanco, I.; Minelli, A.; Donato, R. Nrf2-Keap1 signaling in oxidative and reductive stress. Biochim. Biophys. Acta 2018, 1865, 721–733. [Google Scholar] [CrossRef]
  29. Vasileva, L.V.; Savova, M.S.; Amirova, K.M.; Dinkova-Kostova, A.T.; Georgiev, M.I. Obesity and NRF2-mediated cytoprotection: Where is the missing link? Pharmacol. Res. 2020, 156, 104760. [Google Scholar] [CrossRef]
  30. Sharma, R.S.; Harrison, D.J.; Kisielewski, D.; Cassidy, D.M.; McNeilly, A.D.; Gallagher, J.R.; Walsh, S.V.; Honda, T.; McCrimmon, R.J.; Dinkova-Kostova, A.T.; et al. Experimental Nonalcoholic Steatohepatitis and Liver Fibrosis Are Ameliorated by Pharmacologic Activation of Nrf2 (NF-E2 p45-Related Factor 2). Cell. Mol. Gastroenterol. Hepatol. 2018, 5, 367–398. [Google Scholar] [CrossRef] [Green Version]
  31. Okawa, H.; Motohashi, H.; Kobayashi, A.; Aburatani, H.; Kensler, T.W.; Yamamoto, M. Hepatocyte-specific deletion of the keap1 gene activates Nrf2 and confers potent resistance against acute drug toxicity. Biochem. Biophys. Res. Commun. 2006, 339, 79–88. [Google Scholar] [CrossRef]
  32. Zhang, Y.K.; Yeager, R.L.; Tanaka, Y.; Klaassen, C.D. Enhanced expression of Nrf2 in mice attenuates the fatty liver produced by a methionine- and choline-deficient diet. Toxicol. Appl. Pharmacol. 2010, 245, 326–334. [Google Scholar] [CrossRef] [Green Version]
  33. Ramadori, P.; Drescher, H.; Erschfeld, S.; Schumacher, F.; Berger, C.; Fragoulis, A.; Schenkel, J.; Kensler, T.W.; Wruck, C.J.; Trautwein, C.; et al. Hepatocyte-specific Keap1 deletion reduces liver steatosis but not inflammation during non-alcoholic steatohepatitis development. Free Radic. Biol. Med. 2016, 91, 114–126. [Google Scholar] [CrossRef]
  34. Ramadori, P.; Drescher, H.; Erschfeld, S.; Fragoulis, A.; Kensler, T.W.; Wruck, C.J.; Cubero, F.J.; Trautwein, C.; Streetz, K.L.; Kroy, D.C. Genetic Nrf2 Overactivation Inhibits the Deleterious Effects Induced by Hepatocyte-Specific c-met Deletion during the Progression of NASH. Oxid. Med. Cell. Longev. 2017, 2017, 3420286. [Google Scholar] [CrossRef]
  35. Vasconcelos, A.R.; Dos Santos, N.B.; Scavone, C.; Munhoz, C.D. Nrf2/ARE Pathway Modulation by Dietary Energy Regulation in Neurological Disorders. Front. Pharmacol. 2019, 10, 33. [Google Scholar] [CrossRef] [Green Version]
  36. Shin, S.; Wakabayashi, J.; Yates, M.S.; Wakabayashi, N.; Dolan, P.M.; Aja, S.; Liby, K.T.; Sporn, M.B.; Yamamoto, M.; Kensler, T.W. Role of Nrf2 in prevention of high-fat diet-induced obesity by synthetic triterpenoid CDDO-imidazolide. Eur. J. Pharmacol. 2009, 620, 138–144. [Google Scholar] [CrossRef] [Green Version]
  37. Sah, S.K.; Lee, C.; Jang, J.H.; Park, G.H. Effect of high-fat diet on cognitive impairment in triple-transgenic mice model of Alzheimer’s disease. Biochem. Biophys. Res. Commun. 2017, 493, 731–736. [Google Scholar] [CrossRef]
  38. Winer, S.; Chan, Y.; Paltser, G.; Truong, D.; Tsui, H.; Bahrami, J.; Dorfman, R.; Wang, Y.; Zielenski, J.; Mastronardi, F.; et al. Normalization of obesity-associated insulin resistance through immunotherapy. Nat. Med. 2009, 15, 921–929. [Google Scholar] [CrossRef]
  39. Lefere, S.; Tacke, F. Macrophages in obesity and non-alcoholic fatty liver disease: Crosstalk with metabolism. JHEP Rep. 2019, 1, 30–43. [Google Scholar] [CrossRef] [Green Version]
  40. Mulder, P.; Morrison, M.C.; Wielinga, P.Y.; Van Duyvenvoorde, W.; Kooistra, T.; Kleemann, R. Surgical removal of inflamed epididymal white adipose tissue attenuates the development of non-alcoholic steatohepatitis in obesity. Int. J. Obes. 2016, 40, 675–684. [Google Scholar] [CrossRef] [Green Version]
  41. Schulze, R.J.; Schott, M.B.; Casey, C.A.; Tuma, P.L.; McNiven, M.A. The cell biology of the hepatocyte: A membrane trafficking machine. J. Cell Biol. 2019, 218, 2096–2112. [Google Scholar] [CrossRef] [PubMed]
  42. Fuster, J.J.; Ouchi, N.; Gokce, N.; Walsh, K. Obesity-Induced Changes in Adipose Tissue Microenvironment and Their Impact on Cardiovascular Disease. Circ. Res. 2016, 118, 1786–1807. [Google Scholar] [CrossRef] [PubMed] [Green Version]
  43. Mayangsari, Y.; Suzuki, T. Resveratrol Ameliorates Intestinal Barrier Defects and Inflammation in Colitic Mice and Intestinal Cells. J. Agric. Food Chem. 2018, 66, 12666–12674. [Google Scholar] [CrossRef] [PubMed]
  44. Winer, D.A.; Luck, H.; Tsai, S.; Winer, S. The Intestinal Immune System in Obesity and Insulin Resistance. Cell Metab. 2016, 23, 413–426. [Google Scholar] [CrossRef] [PubMed] [Green Version]
  45. Dawson, P.A. Hepatic bile acid uptake in humans and mice: Multiple pathways and expanding potential role for gut-liver signaling. Hepatology 2017, 66, 1384–1386. [Google Scholar] [CrossRef]
  46. Slocum, S.L.; Skoko, J.J.; Wakabayashi, N.; Aja, S.; Yamamoto, M.; Kensler, T.W.; Chartoumpekis, D.V. Keap1/Nrf2 pathway activation leads to a repressed hepatic gluconeogenic and lipogenic program in mice on a high-fat diet. Arch. Biochem. Biophys. 2016, 591, 57–65. [Google Scholar] [CrossRef] [Green Version]
  47. Berger, F.; Ramirez-Hernandez, M.H.; Ziegler, M. The new life of a centenarian: Signalling functions of NAD(P). Trends Biochem. Sci. 2004, 29, 111–118. [Google Scholar] [CrossRef]
  48. Jaiswal, A.K. Regulation of genes encoding NAD(P)H:quinone oxidoreductases. Free Radic. Biol. Med. 2000, 29, 254–262. [Google Scholar] [CrossRef]
  49. Hwang, J.H.; Kim, D.W.; Jo, E.J.; Kim, Y.K.; Jo, Y.S.; Park, J.H.; Yoo, S.K.; Park, M.K.; Kwak, T.H.; Kho, Y.L.; et al. Pharmacological stimulation of NADH oxidation ameliorates obesity and related phenotypes in mice. Diabetes 2009, 58, 965–974. [Google Scholar] [CrossRef] [Green Version]
  50. Ahmad, M.I.; Zou, X.; Ijaz, M.U.; Hussain, M.; Liu, C.; Xu, X.; Zhou, G.; Li, C. Processed Meat Protein Promoted Inflammation and Hepatic Lipogenesis by Upregulating Nrf2/Keap1 Signaling Pathway in Glrx-Deficient Mice. J. Agric. Food Chem. 2019, 67, 8794–8809. [Google Scholar] [CrossRef]
  51. Beyer, T.A.; Xu, W.; Teupser, D.; Auf dem Keller, U.; Bugnon, P.; Hildt, E.; Thiery, J.; Kan, Y.W.; Werner, S. Impaired liver regeneration in Nrf2 knockout mice: Role of ROS-mediated insulin/IGF-1 resistance. EMBO J. 2008, 27, 212–223. [Google Scholar] [CrossRef]
  52. Barroso, E.; Rodriguez-Rodriguez, R.; Chacon, M.R.; Maymo-Masip, E.; Ferrer, L.; Salvado, L.; Salmeron, E.; Wabistch, M.; Palomer, X.; Vendrell, J.; et al. PPARbeta/delta ameliorates fructose-induced insulin resistance in adipocytes by preventing Nrf2 activation. Biochim. Biophys. Acta 2015, 1852, 1049–1058. [Google Scholar] [CrossRef] [Green Version]
  53. Meakin, P.J.; Chowdhry, S.; Sharma, R.S.; Ashford, F.B.; Walsh, S.V.; McCrimmon, R.J.; Dinkova-Kostova, A.T.; Dillon, J.F.; Hayes, J.D.; Ashford, M.L. Susceptibility of Nrf2-null mice to steatohepatitis and cirrhosis upon consumption of a high-fat diet is associated with oxidative stress, perturbation of the unfolded protein response, and disturbance in the expression of metabolic enzymes but not with insulin resistance. Mol. Cell. Biol. 2014, 34, 3305–3320. [Google Scholar]
  54. Chartoumpekis, D.V.; Yagishita, Y.; Fazzari, M.; Palliyaguru, D.L.; Rao, U.N.; Zaravinos, A.; Khoo, N.K.; Schopfer, F.J.; Weiss, K.R.; Michalopoulos, G.K.; et al. Nrf2 prevents Notch-induced insulin resistance and tumorigenesis in mice. JCI Insight 2018, 3, e97735. [Google Scholar] [CrossRef]
  55. Xu, J.; Kulkarni, S.R.; Donepudi, A.C.; More, V.R.; Slitt, A.L. Enhanced Nrf2 activity worsens insulin resistance, impairs lipid accumulation in adipose tissue, and increases hepatic steatosis in leptin-deficient mice. Diabetes 2012, 61, 3208–3218. [Google Scholar] [CrossRef] [Green Version]
  56. Ni, H.M.; Woolbright, B.L.; Williams, J.; Copple, B.; Cui, W.; Luyendyk, J.P.; Jaeschke, H.; Ding, W.X. Nrf2 promotes the development of fibrosis and tumorigenesis in mice with defective hepatic autophagy. J. Hepatol. 2014, 61, 617–625. [Google Scholar] [CrossRef] [Green Version]
  57. Turnbaugh, P.J.; Ley, R.E.; Mahowald, M.A.; Magrini, V.; Mardis, E.R.; Gordon, J.I. An obesity-associated gut microbiome with increased capacity for energy harvest. Nature 2006, 444, 1027–1031. [Google Scholar] [CrossRef]
  58. Backhed, F.; Ding, H.; Wang, T.; Hooper, L.V.; Koh, G.Y.; Nagy, A.; Semenkovich, C.F.; Gordon, J.I. The gut microbiota as an environmental factor that regulates fat storage. Proc. Natl. Acad. Sci. USA 2004, 101, 15718–15723. [Google Scholar] [CrossRef] [Green Version]
  59. Kubeck, R.; Bonet-Ripoll, C.; Hoffmann, C.; Walker, A.; Muller, V.M.; Schuppel, V.L.; Lagkouvardos, I.; Scholz, B.; Engel, K.H.; Daniel, H.; et al. Dietary fat and gut microbiota interactions determine diet-induced obesity in mice. Mol. Metab. 2016, 5, 1162–1174. [Google Scholar] [CrossRef]
  60. Xiao, L.; Sonne, S.B.; Feng, Q.; Chen, N.; Xia, Z.; Li, X.; Fang, Z.; Zhang, D.; Fjaere, E.; Midtbo, L.K.; et al. High-fat feeding rather than obesity drives taxonomical and functional changes in the gut microbiota in mice. Microbiome 2017, 5, 43. [Google Scholar] [CrossRef]
  61. Turnbaugh, P.J.; Ridaura, V.K.; Faith, J.J.; Rey, F.E.; Knight, R.; Gordon, J.I. The effect of diet on the human gut microbiome: A metagenomic analysis in humanized gnotobiotic mice. Sci. Transl. Med. 2009, 1, 6ra14. [Google Scholar] [CrossRef] [PubMed] [Green Version]
  62. Arias, L.; Goig, G.A.; Cardona, P.; Torres-Puente, M.; Diaz, J.; Rosales, Y.; Garcia, E.; Tapia, G.; Comas, I.; Vilaplana, C.; et al. Influence of Gut Microbiota on Progression to Tuberculosis Generated by High Fat Diet-Induced Obesity in C3HeB/FeJ Mice. Front. Immunol. 2019, 10, 2464. [Google Scholar] [CrossRef] [PubMed]
  63. Fleissner, C.K.; Huebel, N.; Abd El-Bary, M.M.; Loh, G.; Klaus, S.; Blaut, M. Absence of intestinal microbiota does not protect mice from diet-induced obesity. Br. J. Nutr. 2010, 104, 919–929. [Google Scholar] [CrossRef] [PubMed] [Green Version]
  64. Parks, B.W.; Nam, E.; Org, E.; Kostem, E.; Norheim, F.; Hui, S.T.; Pan, C.; Civelek, M.; Rau, C.D.; Bennett, B.J.; et al. Genetic control of obesity and gut microbiota composition in response to high-fat, high-sucrose diet in mice. Cell Metab. 2013, 17, 141–152. [Google Scholar] [CrossRef] [Green Version]
  65. Zhong, H.; Abdullah, Z.; Deng, L.; Zhao, M.; Tang, J.; Liu, T.; Zhang, H.; Feng, F. Probiotic-fermented blueberry juice prevents obesity and hyperglycemia in high fat diet-fed mice in association with modulating the gut microbiota. Food Funct. 2020, 11, 9192–9207. [Google Scholar] [CrossRef]
  66. Anhe, F.F.; Nachbar, R.T.; Varin, T.V.; Trottier, J.; Dudonne, S.; Le Barz, M.; Feutry, P.; Pilon, G.; Barbier, O.; Desjardins, Y.; et al. Treatment with camu camu (Myrciaria dubia) prevents obesity by altering the gut microbiota and increasing energy expenditure in diet-induced obese mice. Gut 2019, 68, 453–464. [Google Scholar] [CrossRef] [Green Version]
  67. Qin, J.; Li, Y.; Cai, Z.; Li, S.; Zhu, J.; Zhang, F.; Liang, S.; Zhang, W.; Guan, Y.; Shen, D.; et al. A metagenome-wide association study of gut microbiota in type 2 diabetes. Nature 2012, 490, 55–60. [Google Scholar] [CrossRef]
  68. Wan, Y.; Wang, F.; Yuan, J.; Li, J.; Jiang, D.; Zhang, J.; Li, H.; Wang, R.; Tang, J.; Huang, T.; et al. Effects of dietary fat on gut microbiota and faecal metabolites, and their relationship with cardiometabolic risk factors: A 6-month randomised controlled-feeding trial. Gut 2019, 68, 1417–1429. [Google Scholar] [CrossRef] [Green Version]
  69. Lim, M.Y.; Rho, M.; Song, Y.M.; Lee, K.; Sung, J.; Ko, G. Stability of gut enterotypes in Korean monozygotic twins and their association with biomarkers and diet. Sci. Rep. 2014, 4, 7348. [Google Scholar] [CrossRef] [Green Version]
  70. Bloom, S.M.; Bijanki, V.N.; Nava, G.M.; Sun, L.; Malvin, N.P.; Donermeyer, D.L.; Dunne, W.M., Jr.; Allen, P.M.; Stappenbeck, T.S. Commensal Bacteroides species induce colitis in host-genotype-specific fashion in a mouse model of inflammatory bowel disease. Cell Host Microbe 2011, 9, 390–403. [Google Scholar] [CrossRef] [Green Version]
  71. Hildebrandt, M.A.; Hoffmann, C.; Sherrill-Mix, S.A.; Keilbaugh, S.A.; Hamady, M.; Chen, Y.Y.; Knight, R.; Ahima, R.S.; Bushman, F.; Wu, G.D. High-fat diet determines the composition of the murine gut microbiome independently of obesity. Gastroenterology 2009, 137, 1716–1724. [Google Scholar] [CrossRef] [Green Version]
  72. Mendez-Salazar, E.O.; Ortiz-Lopez, M.G.; Granados-Silvestre, M.L.A.; Palacios-Gonzalez, B.; Menjivar, M. Altered Gut Microbiota and Compositional Changes in Firmicutes and Proteobacteria in Mexican Undernourished and Obese Children. Front. Microbiol. 2018, 9, 2494. [Google Scholar] [CrossRef] [Green Version]
  73. Shin, N.R.; Whon, T.W.; Bae, J.W. Proteobacteria: Microbial signature of dysbiosis in gut microbiota. Trends Biotechnol. 2015, 33, 496–503. [Google Scholar] [CrossRef]
  74. Andoh, A.; Nishida, A.; Takahashi, K.; Inatomi, O.; Imaeda, H.; Bamba, S.; Kito, K.; Sugimoto, M.; Kobayashi, T. Comparison of the gut microbial community between obese and lean peoples using 16S gene sequencing in a Japanese population. J Clin. Biochem. Nutr. 2016, 59, 65–70. [Google Scholar] [CrossRef] [Green Version]
  75. Kong, C.; Gao, R.; Yan, X.; Huang, L.; Qin, H. Probiotics improve gut microbiota dysbiosis in obese mice fed a high-fat or high-sucrose diet. Nutrition 2019, 60, 175–184. [Google Scholar] [CrossRef]
  76. Wang, J.; Tang, H.; Zhang, C.; Zhao, Y.; Derrien, M.; Rocher, E.; van-Hylckama Vlieg, J.E.; Strissel, K.; Zhao, L.; Obin, M.; et al. Modulation of gut microbiota during probiotic-mediated attenuation of metabolic syndrome in high fat diet-fed mice. ISME J. 2015, 9, 1–15. [Google Scholar] [CrossRef]
  77. Arbones, M.L.; Ord, D.C.; Ley, K.; Ratech, H.; Maynard-Curry, C.; Otten, G.; Capon, D.J.; Tedder, T.F. Lymphocyte homing and leukocyte rolling and migration are impaired in L-selectin-deficient mice. Immunity 1994, 1, 247–260. [Google Scholar] [CrossRef]
  78. Kleiner, D.E.; Brunt, E.M.; Van Natta, M.; Behling, C.; Contos, M.J.; Cummings, O.W.; Ferrell, L.D.; Liu, Y.C.; Torbenson, M.S.; Unalp-Arida, A.; et al. Design and validation of a histological scoring system for nonalcoholic fatty liver disease. Hepatology 2005, 41, 1313–1321. [Google Scholar] [CrossRef]
  79. Pils, M.C.; Bleich, A.; Prinz, I.; Fasnacht, N.; Bollati-Fogolin, M.; Schippers, A.; Rozell, B.; Muller, W. Commensal gut flora reduces susceptibility to experimentally induced colitis via T-cell-derived interleukin-10. Inflamm. Bowel Dis. 2011, 17, 2038–2046. [Google Scholar] [CrossRef]
  80. Erben, U.; Loddenkemper, C.; Doerfel, K.; Spieckermann, S.; Haller, D.; Heimesaat, M.M.; Zeitz, M.; Siegmund, B.; Kuhl, A.A. A guide to histomorphological evaluation of intestinal inflammation in mouse models. Int. J. Clin. Exp. Pathol. 2014, 7, 4557–4576. [Google Scholar]
  81. Tran, H.Q.; Bretin, A.; Adeshirlarijaney, A.; Yeoh, B.S.; Vijay-Kumar, M.; Zou, J.; Denning, T.L.; Chassaing, B.; Gewirtz, A.T. “Western Diet”-Induced Adipose Inflammation Requires a Complex Gut Microbiota. Cell. Mol. Gastroenterol. Hepatol. 2020, 9, 313–333. [Google Scholar] [CrossRef] [PubMed] [Green Version]
  82. Clahsen, T.; Pabst, O.; Tenbrock, K.; Schippers, A.; Wagner, N. Localization of dendritic cells in the gut epithelium requires MAdCAM-1. Clin. Immunol. 2015, 156, 74–84. [Google Scholar] [CrossRef] [PubMed]
  83. Hadis, U.; Wahl, B.; Schulz, O.; Hardtke-Wolenski, M.; Schippers, A.; Wagner, N.; Muller, W.; Sparwasser, T.; Forster, R.; Pabst, O. Intestinal tolerance requires gut homing and expansion of FoxP3+ regulatory T cells in the lamina propria. Immunity 2011, 34, 237–246. [Google Scholar] [CrossRef] [PubMed]
  84. Drescher, H.K.; Schippers, A.; Clahsen, T.; Sahin, H.; Noels, H.; Hornef, M.; Wagner, N.; Trautwein, C.; Streetz, K.L.; Kroy, D.C. β7-Integrin and MAdCAM-1 play opposing roles during the development of non-alcoholic steatohepatitis. J. Hepatol. 2017, 66, 1251–1264. [Google Scholar] [CrossRef] [PubMed]
  85. Chan, K.; Lu, R.; Chang, J.C.; Kan, Y.W. NRF2, a member of the NFE2 family of transcription factors, is not essential for murine erythropoiesis, growth, and development. Proc. Natl. Acad. Sci. USA 1996, 93, 13943–13948. [Google Scholar] [CrossRef] [Green Version]
  86. Berry, D.; Ben Mahfoudh, K.; Wagner, M.; Loy, A. Barcoded primers used in multiplex amplicon pyrosequencing bias amplification. Appl. Environ. Microbiol. 2011, 77, 7846–7849. [Google Scholar] [CrossRef] [Green Version]
  87. Klindworth, A.; Pruesse, E.; Schweer, T.; Peplies, J.; Quast, C.; Horn, M.; Glockner, F.O. Evaluation of general 16S ribosomal RNA gene PCR primers for classical and next-generation sequencing-based diversity studies. Nucleic Acids Res. 2013, 41, e1. [Google Scholar] [CrossRef]
  88. Bartram, J.; Mountjoy, E.; Brooks, T.; Hancock, J.; Williamson, H.; Wright, G.; Moppett, J.; Goulden, N.; Hubank, M. Accurate Sample Assignment in a Multiplexed, Ultrasensitive, High-Throughput Sequencing Assay for Minimal Residual Disease. J. Mol. Diagn. 2016, 18, 494–506. [Google Scholar] [CrossRef] [Green Version]
  89. Kozich, J.J.; Westcott, S.L.; Baxter, N.T.; Highlander, S.K.; Schloss, P.D. Development of a dual-index sequencing strategy and curation pipeline for analyzing amplicon sequence data on the MiSeq Illumina sequencing platform. Appl. Environ. Microbiol. 2013, 79, 5112–5120. [Google Scholar] [CrossRef] [Green Version]
  90. Lagkouvardos, I.; Pukall, R.; Abt, B.; Foesel, B.U.; Meier-Kolthoff, J.P.; Kumar, N.; Bresciani, A.; Martinez, I.; Just, S.; Ziegler, C.; et al. The Mouse Intestinal Bacterial Collection (miBC) provides host-specific insight into cultured diversity and functional potential of the gut microbiota. Nat. Microbiol. 2016, 1, 16131. [Google Scholar] [CrossRef] [Green Version]
  91. Edgar, R.C. UPARSE: Highly accurate OTU sequences from microbial amplicon reads. Nat. Methods 2013, 10, 996–998. [Google Scholar] [CrossRef]
  92. Lagkouvardos, I.; Fischer, S.; Kumar, N.; Clavel, T. Rhea: A transparent and modular R pipeline for microbial profiling based on 16S rRNA gene amplicons. PeerJ 2017, 5, e2836. [Google Scholar] [CrossRef] [Green Version]
Figure 1. Lsel−/−Keap1Δhepa mice exhibit increased Nrf2 expression and an upregulation of Nrf2 target genes in the liver. (a) Representative immunofluorescence staining images indicate nuclear translocation of Nrf2 in hepatocytes of Lsel−/−Keap1Δhepa mice. Hepatocytes of untreated mice were labeled with anti-Nrf2 (orange) and DAPI (blue). Scale bar: 50 µm. (b) Representative flow cytometric analysis indicates increased Nrf2 in hepatocytes of Lsel−/−Keap1Δhepa mice. (c-e) Levels of the mRNAs indicated were measured in liver tissue of Lsel−/−Keap1flx/flx mice (red bars) and Lsel−/−Keap1Δhepa mice (blue bars) after 24 weeks of feeding with chow diet (CD) or Western diet (WD). mRNA levels are expressed as fold increase over the mean value obtained for healthy control liver tissue from Lsel−/−Keap1flx/flx mice. (Lsel−/−Keap1flx/flx CD-fed (n = 6), Lsel−/−Keap1flx/flx WD-fed (n = 12), Lsel−/−Keap1Δ hepa CD-fed (n = 4), Lsel−/−Keap1Δhepa WD-fed (n = 8). (c) Glrx (glutaredoxin), (d) Gstm-1 (glutathion S-transferase1) (e) Nqo-1 (NAD(P)H quinone dehydrogenase 1) Statistical significance was calculated by the one-way ANOVA (analysis of variance). Values are represented as mean ± SD. * p 0.05, ** p 0.01, *** p 0.001, **** p 0.0001.
Ijms 22 07314 g001
Figure 2. Lsel−/−Keap1Δhepa mice exhibit partial protection from metabolic dysfunction. Lsel−/−Keap1flx/flx mice (shown in red) and Lsel−/−Keap1Δhepa mice (shown in blue) were fed for 24 weeks with chow diet (CD) or Western diet (WD). (a) Weekly average WD consumption of Lsel−/−Keap1flx/flx mice (n = 4) and Lsel−/−Keap1Δhepa mice (n = 4). (b) Endpoint body weight, (c) endpoint glucose tolerance test (GTT), and (d) corresponding quantification as area under curve of Lsel−/−Keap1flx/flx CD-fed (n = 6), Lsel−/−Keap1flx/flx WD-fed (n = 12), Lsel−/−Keap1Δhepa CD-fed (n = 4), and Lsel−/−Keap1Δhepa WD-fed mice (n = 8). (e) Liver triglycerides and (f) liver free fatty acids (FFA) of Lsel−/−Keap1flx/flx CD-fed (n = 5), Lsel−/−Keap1flx/flx WD-fed (n = 5), Lsel−/−Keap1Δhepa CD-fed (n = 4), and Lsel−/−Keap1Δhepa WD-fed mice (n = 5). (g) Serum cholesterol and (h) LDL/HDL risk of Lsel−/−Keap1flx/flx CD-fed (n = 6), Lsel−/−Keap1flx/flx WD-fed (n = 12), Lsel−/−Keap1Δhepa CD-fed (n = 4), and Lsel−/−Keap1Δhepa WD-fed mice (n = 8). Statistical significance was calculated either by the one-way ANOVA (a,b) or unpaired t-test (d). Values are represented either as mean ± SD (ac,eh) or mean ± SEM (d). * p 0.05, ** p 0.01, **** p 0.0001.
Ijms 22 07314 g002
Figure 3. Lsel−/−Keap1Δhepa mice are not additionally protected from WD-induced NASH progression. Lsel−/−Keap1flx/flx mice (shown in red) and Lsel−/−Keap1Δhepa mice (shown in blue) were fed for 24 weeks on chow diet (CD) or Western diet (WD). Shown are the endpoint values of Lsel−/−Keap1flx/flx CD-fed (n = 6), Lsel−/−Keap1flx/flx WD-fed (n = 12), Lsel−/−Keap1Δhepa CD-fed (n = 4), and Lsel−/−Keap1Δ hepa WD-fed mice (n = 8). (a) Liver/body weight ratio. (b) NAFLD activity score (NAS). (c) Representative images of H&E-stained liver sections of the indicated mice strains. Black arrows indicate the presence of inflammatory foci (original magnification X 20, scale bar = 100 µm). (d) mRNA levels of inflammatory mediators in whole liver tissue, expressed as fold increase over the mean value obtained for healthy control liver tissue from Lsel−/−Keap1flx/flx mice. (e) Quantification of serum aspartate aminotransferase (AST). (f) Quantification of serum alanine aminotransferase (ALT). (g) Quantification of alkaline phosphatase (ALP). (h) Comparative immune cell analysis of liver by flow cytometry. Representative FACS dot plots illustrating the gating strategy are shown in Supplementary Figure S1. Depicted are the percentages of CD45+ cells of CD4+ T cells (CD45+CD3+CD8-CD4+), CD8+ T cells (CD45+CD3+CD4-CD8+), B cells (CD45+CD3-CD19+), NK cells (CD45+NK1.1+), neutrophils (CD45+CD11b+Ly6G+), and monocytes/macrophages (CD45+Ly6G-CD11b+F4/80+). Statistical significance was calculated by the one-way ANOVA. Values are represented as either as mean ± SD (a,b,dh). * p 0.05, ** p 0.01, *** p 0.001, **** p 0.0001.
Ijms 22 07314 g003
Figure 4. Epidydimal white adipose tissue of WD-fed Lsel−/−Keap∆hepa mice exhibit decreased immune cell infiltration. Lsel−/−Keap1flx/flx mice (shown in red) and Lsel−/−Keap1Δhepa mice (shown in blue) were fed for 24 weeks on chow diet (CD) or Western diet (WD). Depicted are the endpoint values of Lsel−/−Keap1flx/flx CD-fed (n = 6), Lsel−/−Keap1flx/flx WD-fed (n = 12), Lsel−/−Keap1∆hepa CD-fed (n = 4), and Lsel−/−Keap1Δhepa WD-fed mice (n = 8). (a) Epidydimal white adipose tissue (eWAT)/body weight ratio. (b) Representative images of H&E stained eWAT sections of the indicated mice strains (original magnification X 20, scale bar = 100 µm. Areas with immune cell infiltration are labeled with black arrows. (c,d) Comparative immune cell analysis of eWAT by flow cytometry. Representative FACS dot plots illustrating the gating strategy are shown in Supplementary Figure S2. Depicted are the percentages of CD45+ cells of (c) CD4+ T cells (CD45+CD3+CD8-CD4+), CD8+ T cells (CD45+CD3+CD4-CD8+), B cells (CD45+CD3-CD19+), and (d) NK cells (CD45+NK1.1+), neutrophils (CD45+CD11b+Ly6G+), and monocytes/macrophages (CD45+Ly6G-CD11b+F4/80+). Statistical significance was calculated by the one-way ANOVA. Values are represented as either as mean ± SD (a,c,d). * p 0.05, *** p 0.001, **** p 0.0001.
Ijms 22 07314 g004
Figure 5. Keap1 inactivation in L-selectin-deficient mice has only minor effects on WD-induced gut changes. Lsel−/−Keap1flx/flx mice (shown in red) and Lsel−/−Keap1Δhepa mice (shown in blue) were fed for 24 weeks on chow diet (CD) or Western diet (WD). Depicted are the endpoint values of Lsel−/−Keap1flx/flx CD-fed (n = 6), Lsel−/−Keap1flx/flx WD-fed, n = 12; Lsel−/−Keap∆hepa CD-fed, n = 4, and Lsel−/−Keap∆hepa WD-fed mice n = 12 (a) Colon length. (b,d) Comparative immune cell analysis of colon lamina propria by flow cytometry and (c,e) corresponding representative FACS dot plots. Representative FACS dot plots illustrating the gating strategy are shown in Supplementary Figure S1. Depicted are the percentages of CD45+ cells of (b) B cells (CD45+CD3-CD19+) and (d) NK cells (CD45+NK1.1+). Statistical significance was calculated by the one-way ANOVA. Values are represented as either as mean ± SD (a,b,d). * p 0.05, *** p 0.001.
Ijms 22 07314 g005
Figure 6. WD feeding causes robust shifts in gut microbiota composition. Lsel−/−Keap1flx/flx mice (shown in red) and Lsel−/−Keap∆hepa mice (shown in blue) were fed for 24 weeks with Western diet (WD). (a) Schematic diagram of the sampling strategy. Fecal samples were collected of Lsel−/−Keap1flx/flx and Lsel−/−Keap∆hepa littermates at the indicated time points. The number of samples (n) has been demarcated under each point. (b) NMDS plot of microbiota profiles based on generalized UniFrac distances from Lsel−/−Keap1flx/flx and Lsel−/−Keap∆hepa mice at different time points. Individual time points that were considered for calculations have been marked within their respective circles. (c) Diversity and composition of the microbiota from different mouse groups. Shown is the Shannon effective count in samples based on time (treatment duration). The diversity of operational taxonomic units (OTUs) within a given sample (alpha-diversity) was calculated in Rhea. (d) Taxonomic binning of fecal microbiota of Lsel−/−Keapflx/flx and Lsel−/−Keap∆hepa mice at the phylum level. (e) Relative abundance of various genera in feces of Lsel−/−Keapflx/flx and Lsel−/−Keap∆hepa mice. In all graphs shown, significance was calculated by non-parametric ANOVA (Kruskal–Wallis Rank Sum Test), * p < 0.05.
Ijms 22 07314 g006
Table 1. Antibodies used in this study.
AntibodyChannelManufacturerCloneDilution
NK 1.1AF 488BiolegendPK1361:400
CD4PEBD biosciencesGK1.51:400
CD45APC-Cy7BD biosciences30-F111:400
CD19eFluor 450eBioscience1D31:200
CD8aAmcyanBiolegend53-6.71:400
CD3ePerCp-Cy5.5eBioscience145-2C111:100
F4/80eFluor 450SerotecCI:A3-11:200
CD11bAmcyanBD BiosciencesM1/701:400
Ly6GFITCBD Biosciences1A81:400
Calibrite counting beadsAPCBD Biosciences 1 million beads/mL PBS
CD146APCMiltenyiME-9F11:400
Nrf2 GeneTexN2C21:400
Goat anti-rabbit IgGCy3Invitrogen 1:500
Goat anti-rabbit IgGAF 633Invitrogen 1:500
Table 2. Primers used in this study.
PrimerForwardReverse
GAPDHACCTGCCAAGTATGATGACATCAGGTCCTCAGTGTAGCCCAAGAT
NQO-1AGAGAGTGCTCGTAGCAGGATCTACCCCCAGTGGTGATAGAAA
TNF-αCATCTTCTCAAAATTCGAGTGACAATGGGAGTAGACAAGGTACAACCC
IFN-γGAGGTCAACAACCCACAGGTCCGAATCAGCAGCGACTCCT
IL-6CTGGAGTCACAGAAGGAGTGGGGTTTGCCGAGTAGATCTCAA
IL-1βGATCCCAAGGCAATACCCAAAGGGGAACTCTGCAGACTCAA
Foxp3GGCAAATGGAGTCTGCAAGTGCAGGAGATGATCTGCTTGGCA
GLRXTTATAAAAGGGGTGGCAGGCAGGTTAAGCTTCTCGGCCCCAT
GSTM1CCTGGATGGAGAGACAGAGGGACCTTGTCCCCTGCAAA
GCLCGGCACAAGGACGTTCTCAAGTCAAAGGGTAGGATGGTTTGGG
Publisher’s Note: MDPI stays neutral with regard to jurisdictional claims in published maps and institutional affiliations.

