
Molecular and Functional Analysis of Sunitinib-Resistance Induction in Human Renal Cell Carcinoma Cells

 ,
,  ,
,  , , and
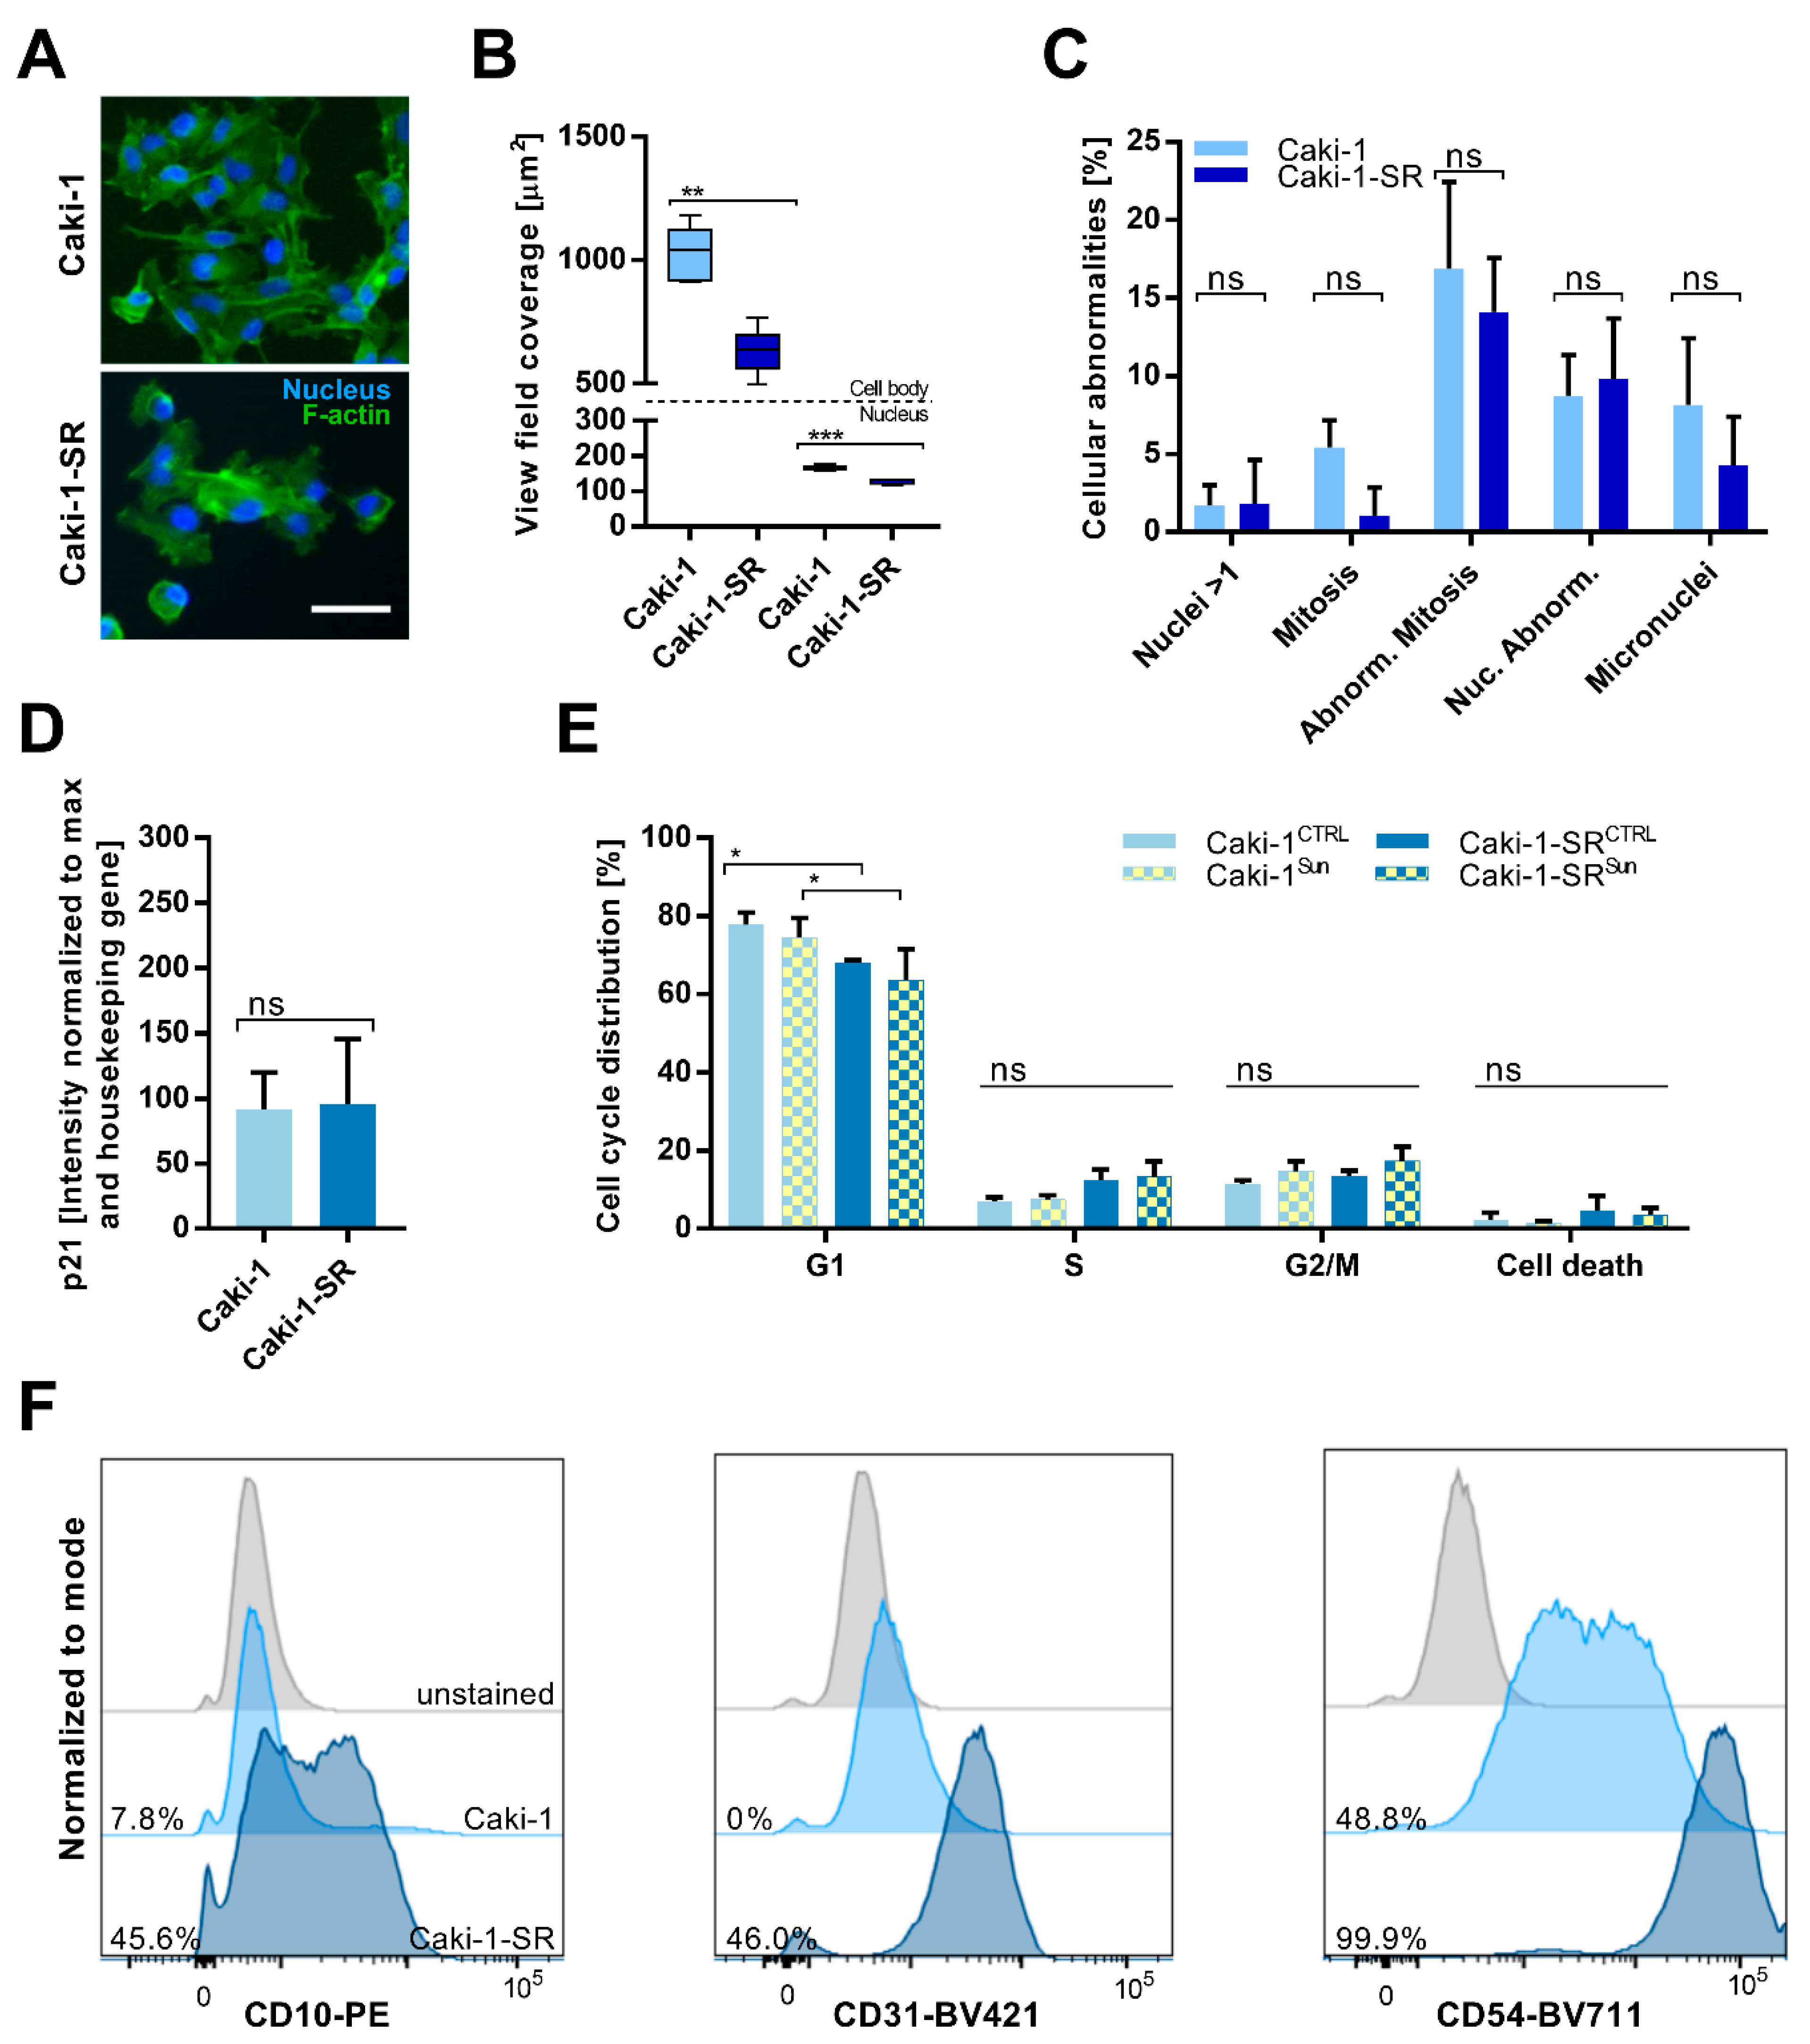
Abstract
1. Introduction
2. Results
2.1. Establishment and Characterization of Acquired Resistance to Sunitinib in ccRCC Cell Lines
2.2. Sunitinib-Resistance in Cell Cycle Analysis and Cell Surface Protein Expression
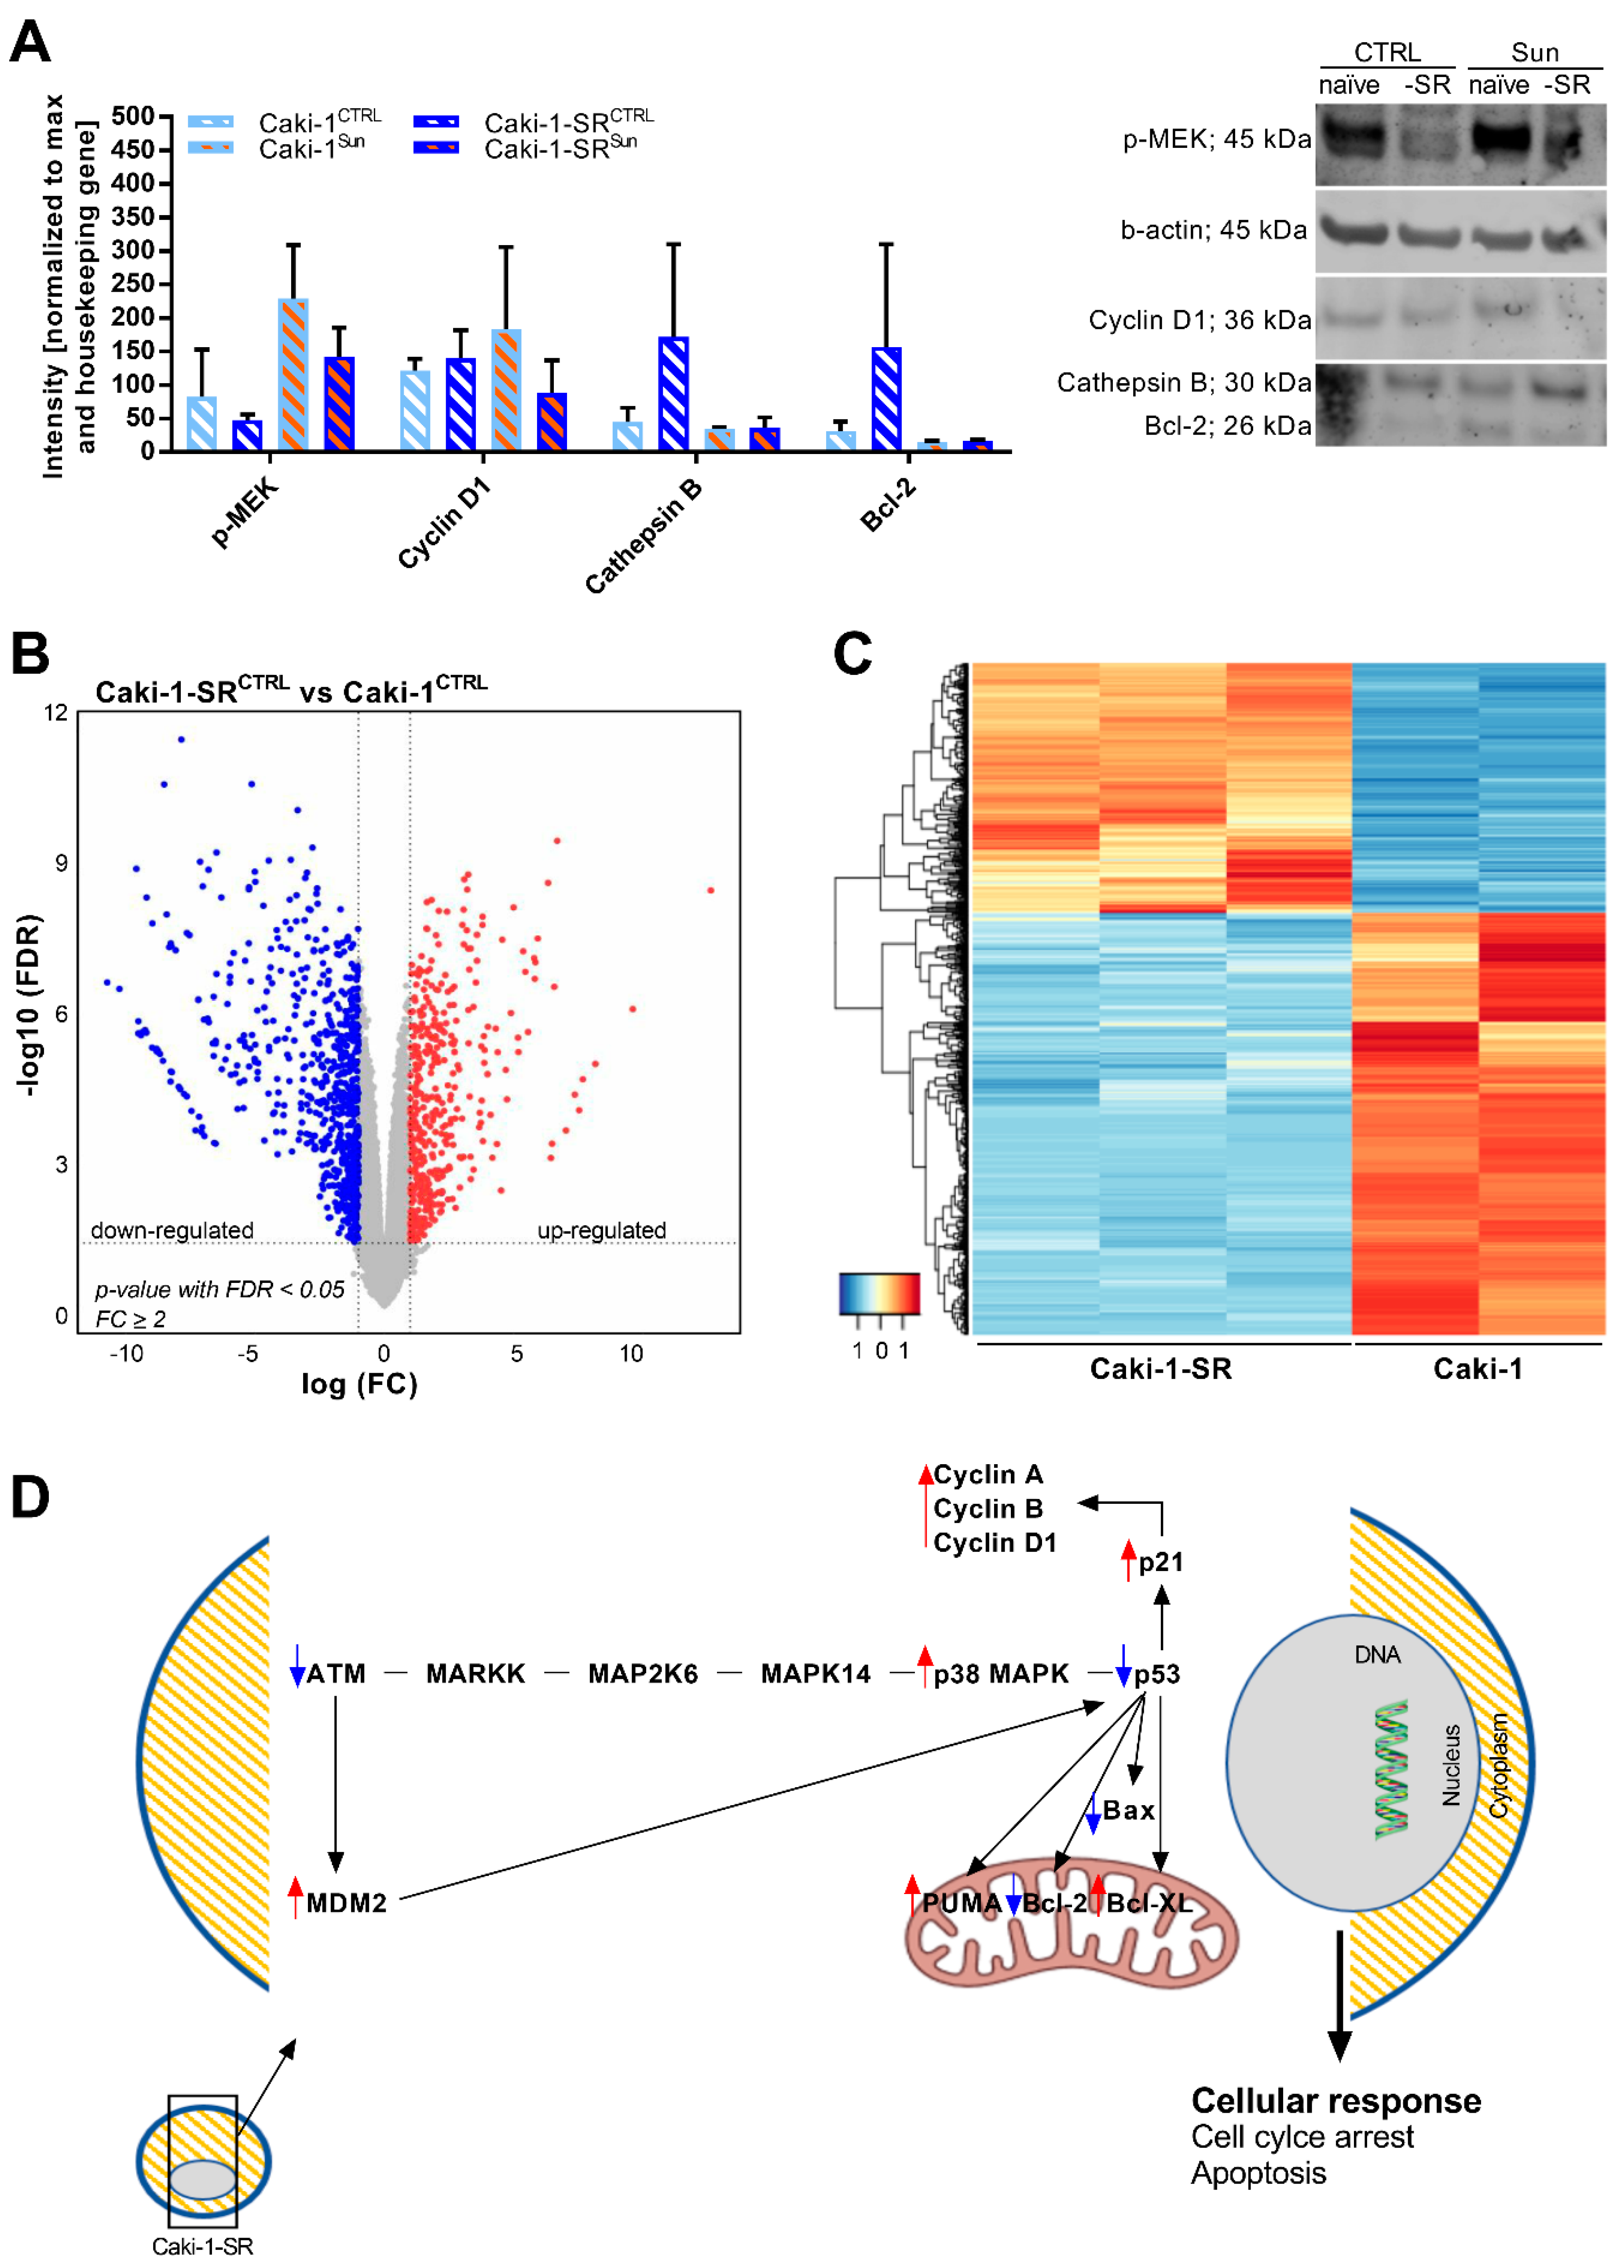
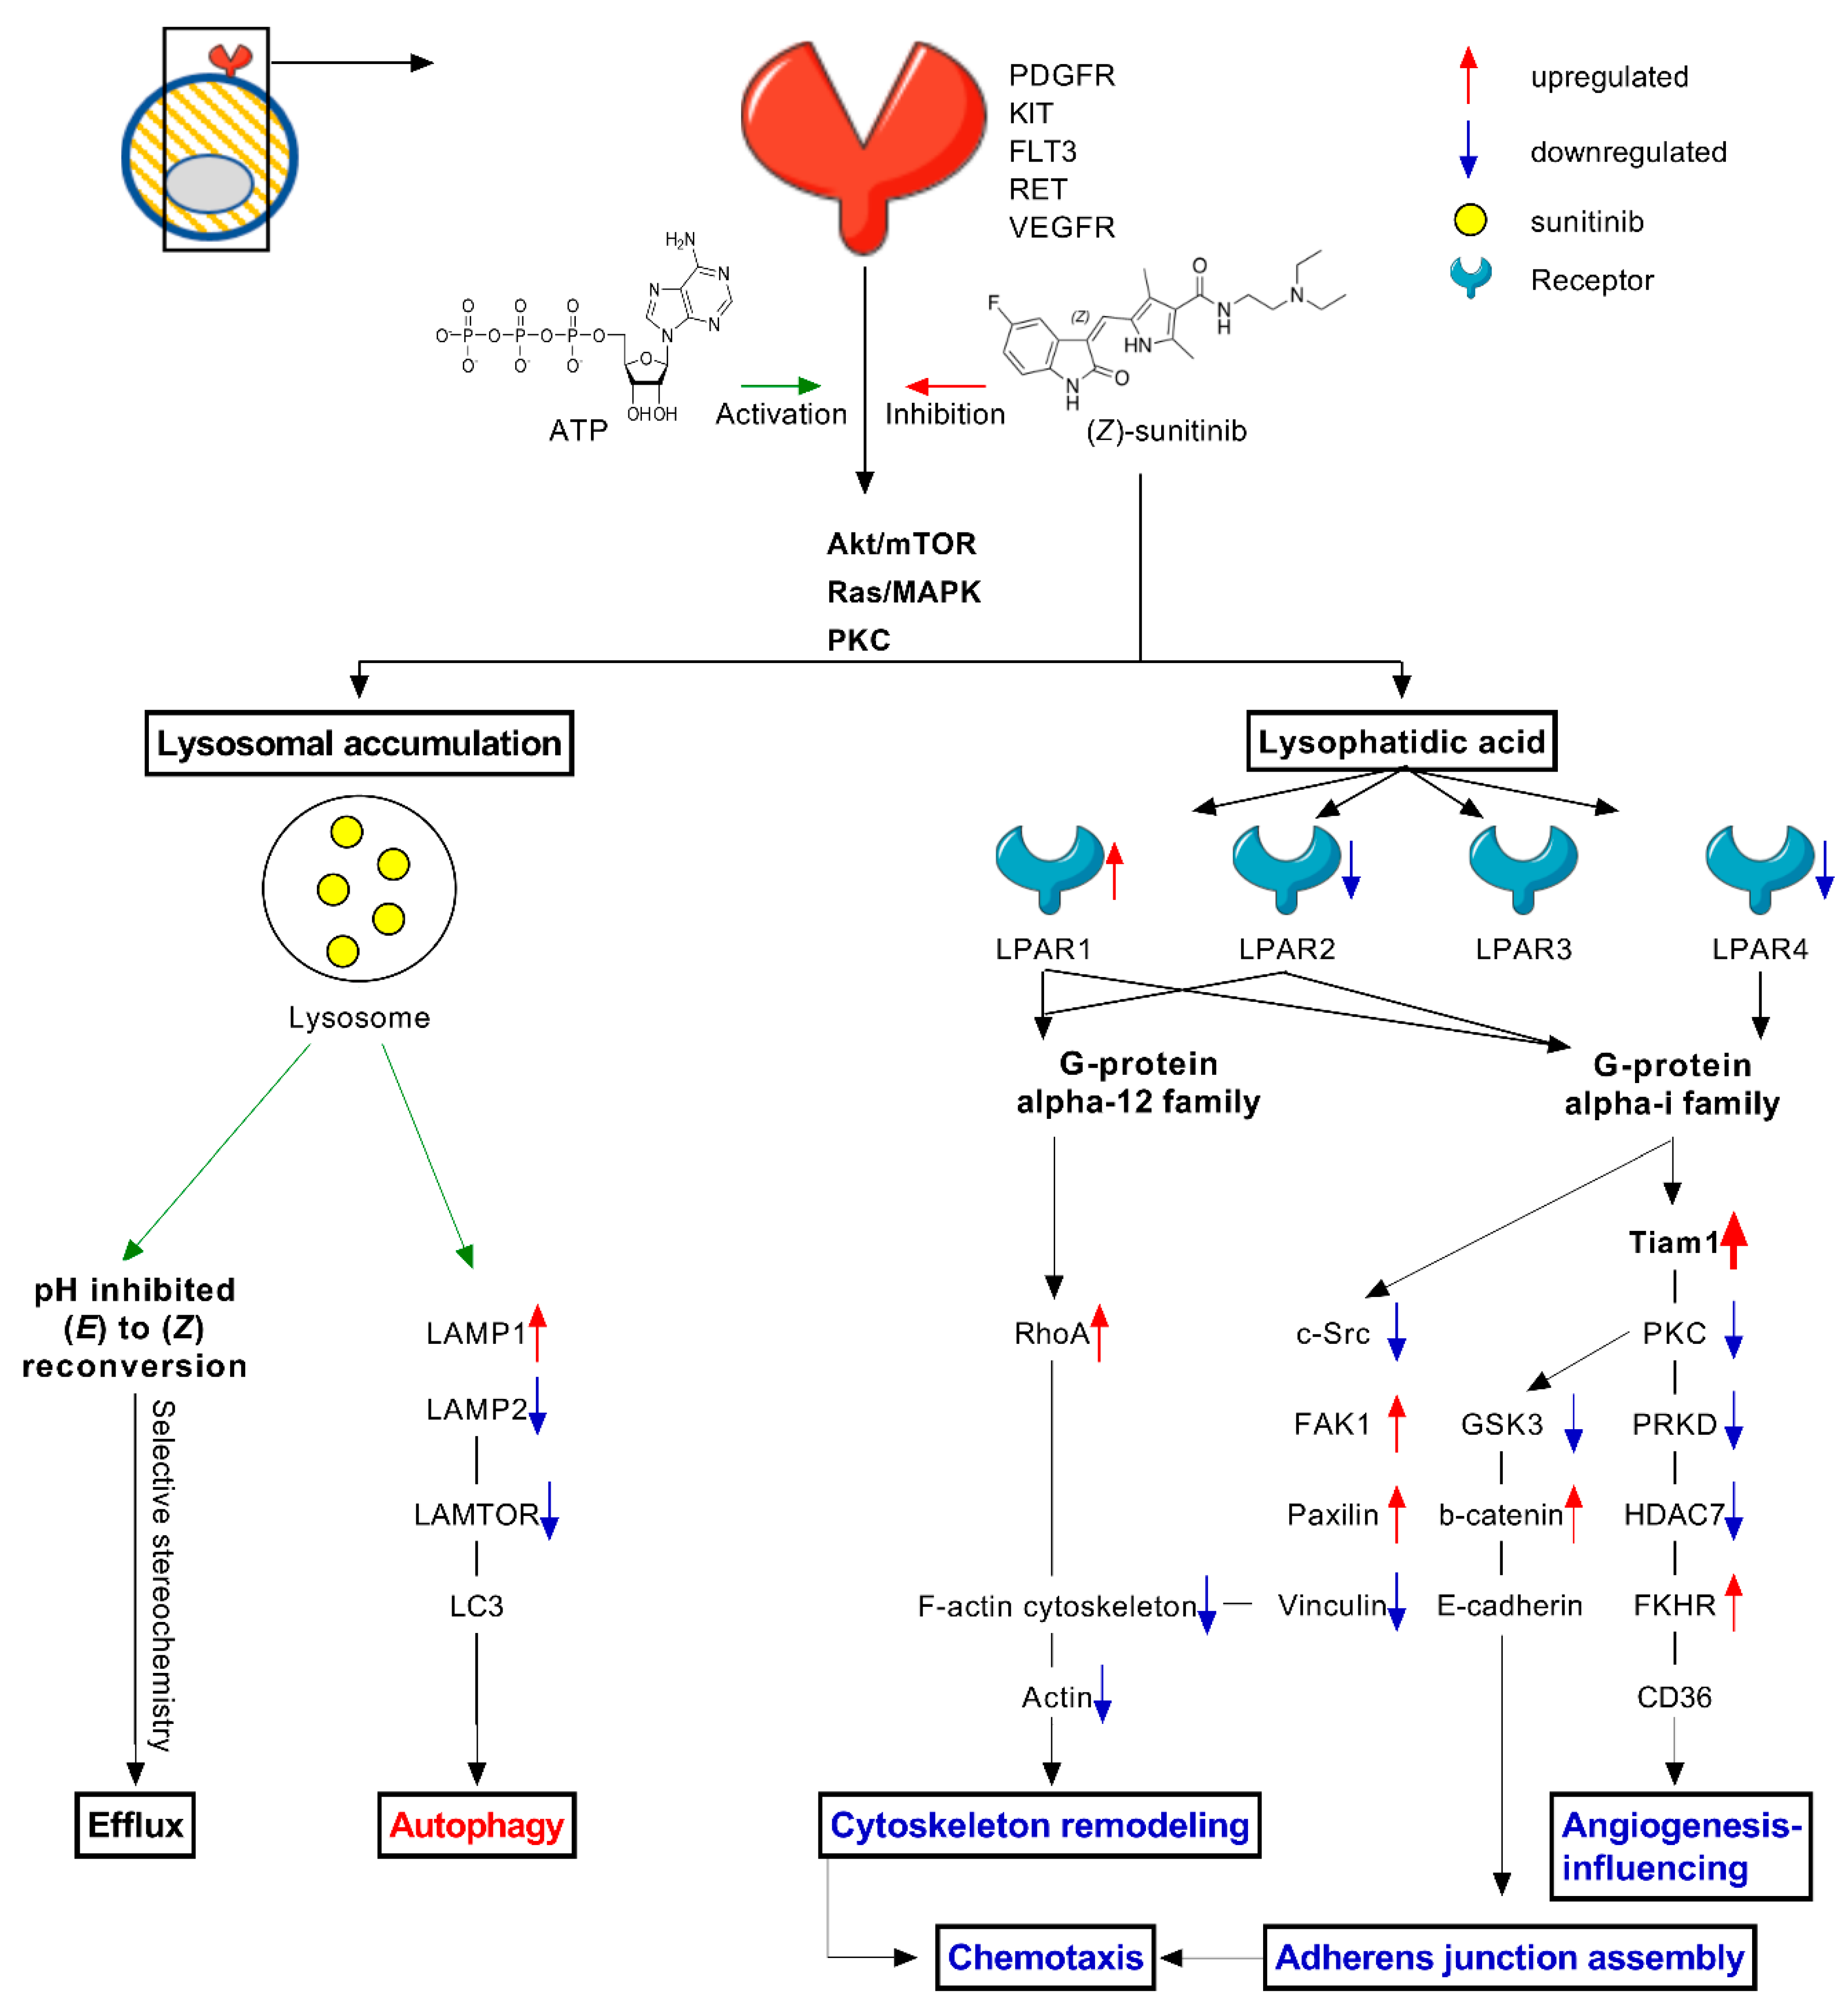
2.3. Modifications in Protein and Gene Expression upon Sunitinib Resistance Induction
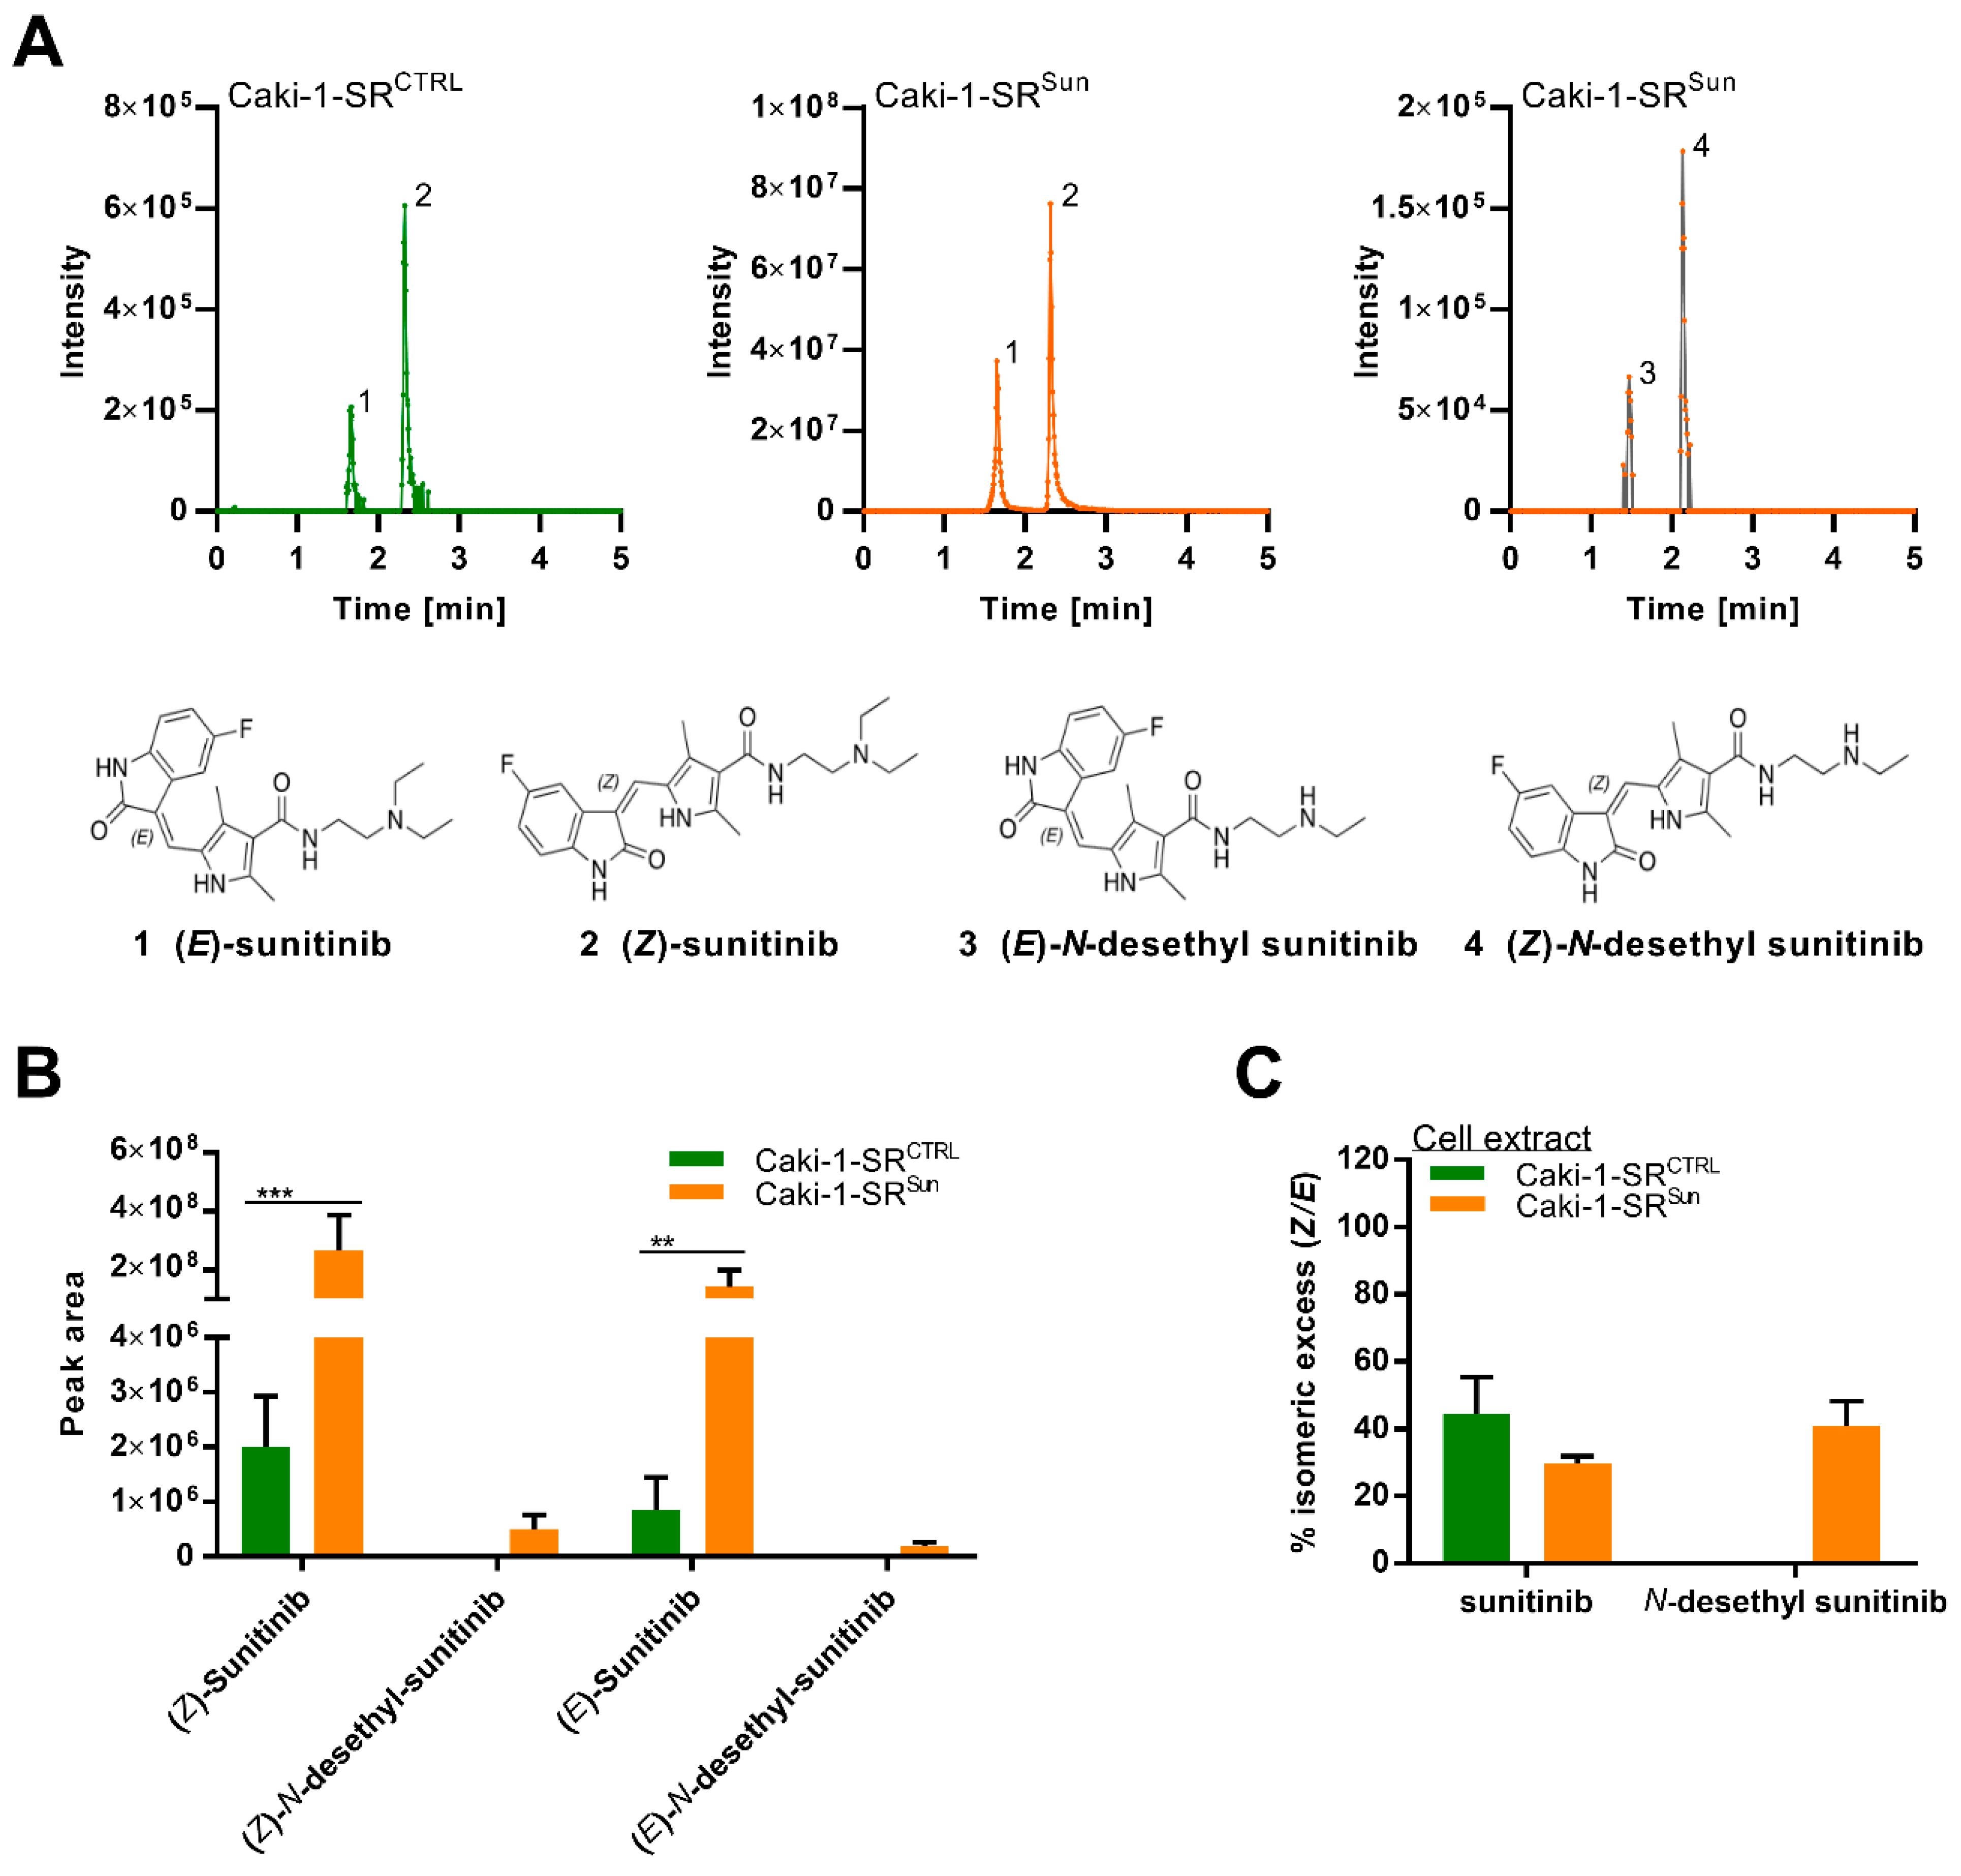
2.4. Stereoisomers of Sunitinib and Metabolites in Caki-1-SR Cells
2.5. Combination Treatment Overcomes Resistance in Different Sunitinib-Resistant Caki-1 Clones
2.6. Optimized Multidrug Combinations overcome Sunitinib Resistance in Ex Vivo Organoid-Like Cultures of Caki-1-SR Organoids
3. Discussion
4. Materials and Methods
4.1. Cells
4.2. Drugs
4.3. Fluorescence staining and cell cycle distribution
4.4. Fluorescence-Activated Cell Sorting
4.5. ATP Level Measurements
4.6. Three-Dimensional Heterotypic Spheroid Cultures from Cell Lines
4.7. Western Blot
4.8. RNA Sequencing
4.9. LC-HRMS/MS Analysis
4.10. In Vivo Model and 3D Heterotypic Spheroid Cultures from Murine Tumor Tissue
4.11. Statistical Analysis
5. Patents
Supplementary Materials
Author Contributions
Funding
Institutional Review Board Statement
Data Availability Statement
Acknowledgments
Conflicts of Interest
References
- Hanahan, D.; Weinberg, R.A. Hallmarks of cancer: The next generation. Cell 2011, 144, 646–674. [Google Scholar] [CrossRef] [PubMed]
- Makhov, P.; Joshi, S.; Ghatalia, P.; Kutikov, A.; Uzzo, R.G.; Kolenko, V.M. Resistance to Systemic Therapies in Clear Cell Renal Cell Carcinoma: Mechanisms and Management Strategies. Mol. Cancer Ther. 2018, 17, 1355–1364. [Google Scholar] [CrossRef]
- Bielecka, Z.F.; Czarnecka, A.M.; Solarek, W.; Kornakiewicz, A.; Szczylik, C. Mechanisms of Acquired Resistance to Tyrosine Kinase Inhibitors in Clear—Cell Renal Cell Carcinoma (ccRCC). Curr. Signal Transduct. Ther. 2014, 8, 218–228. [Google Scholar] [CrossRef]
- Duran, I.; Lambea, J.; Maroto, P.; González-Larriba, J.L.; Flores, L.; Granados-Principal, S.; Graupera, M.; Sáez, B.; Vivancos, A.; Casanovas, O. Resistance to Targeted Therapies in Renal Cancer: The Importance of Changing the Mechanism of Action. Target. Oncol. 2017, 12, 19–35. [Google Scholar] [CrossRef]
- Juengel, E.; Makarević, J.; Tsaur, I.; Bartsch, G.; Nelson, K.; Haferkamp, A.; Blaheta, R.A. Resistance after chronic application of the HDAC-inhibitor valproic acid is associated with elevated Akt activation in renal cell carcinoma in vivo. PLoS ONE 2013, 8, e53100. [Google Scholar] [CrossRef] [PubMed]
- Sarmento-Ribeiro, A.B.; Scorilas, A.; Gonçalves, A.C.; Efferth, T.; Trougakos, I.P. The emergence of drug resistance to targeted cancer therapies: Clinical evidence. Drug Resist. Updates 2019, 47, 100646. [Google Scholar] [CrossRef] [PubMed]
- Liang, F. Optimising first-line treatment for metastatic renal cell carcinoma. Lancet 2020, 395, e8. [Google Scholar] [CrossRef]
- Kapoor, A. First-line treatment options in metastatic renal cell cancer. Can. Urol. Assoc. J. 2016, 10, S236–S238. [Google Scholar] [CrossRef] [PubMed]
- Hahn, A.W.; Klaassen, Z.; Agarwal, N.; Haaland, B.; Esther, J.; Ye, X.Y.; Wang, X.; Pal, S.K.; Wallis, C.J.D. First-line Treatment of Metastatic Renal Cell Carcinoma: A Systematic Review and Network Meta-analysis. Eur. Urol. Oncol. 2019, 2, 708–715. [Google Scholar] [CrossRef] [PubMed]
- Rock, E.P.; Goodman, V.; Jiang, J.X.; Mahjoob, K.; Verbois, S.L.; Morse, D.; Dagher, R.; Justice, R.; Pazdur, R. Food and Drug Administration drug approval summary: Sunitinib malate for the treatment of gastrointestinal stromal tumor and advanced renal cell carcinoma. Oncologist 2007, 12, 107–113. [Google Scholar] [CrossRef] [PubMed]
- Motzer, R.J.; Escudier, B.; Gannon, A.; Figlin, R.A. Sunitinib: Ten Years of Successful Clinical Use and Study in Advanced Renal Cell Carcinoma. Oncologist 2017, 22, 41–52. [Google Scholar] [CrossRef] [PubMed]
- Coppin, C. Sunitinib for advanced renal cell cancer. Biologics 2008, 2, 97–105. [Google Scholar] [CrossRef] [PubMed][Green Version]
- Vakkalanka, B.K.; Rini, B.I. Targeted therapy in renal cell carcinoma. Curr. Opin. Urol. 2008, 18, 481–487. [Google Scholar] [CrossRef]
- Morais, C. Sunitinib resistance in renal cell carcinoma. J. Kidney Cancer VHL 2014, 1, 1–11. [Google Scholar] [CrossRef] [PubMed]
- Abdel-Aziz, A.K.; Abdel-Naim, A.B.; Shouman, S.; Minucci, S.; Elgendy, M. From Resistance to Sensitivity: Insights and Implications of Biphasic Modulation of Autophagy by Sunitinib. Front. Pharmacol. 2017, 8, 718. [Google Scholar] [CrossRef] [PubMed]
- Grande, E.; Alonso Gordoa, T.; Reig Torras, O.; Esteban, E.; Castellano, D.; Garcia del Muro, X.; Mendez Vidal, M.J.; García-Donas, J.; Arranz, J.A.; Suarez Rodriguez, C. INMUNOSUN-SOGUG trial: A prospective phase II study to assess the efficacy and safety of sunitinib as second-line (2L) treatment in patients (pts) with metastatic renal cell cancer (RCC) who received immunotherapy-based combination upfront. J. Clin. Oncol. 2020, 38, 5060. [Google Scholar] [CrossRef]
- Kim, S.; Ding, W.; Zhang, L.; Tian, W.; Chen, S. Clinical response to sunitinib as a multitargeted tyrosine-kinase inhibitor (TKI) in solid cancers: A review of clinical trials. OncoTargets Ther. 2014, 7, 719–728. [Google Scholar] [CrossRef]
- Choueiri, T.K.; Heng, D.Y.C.; Lee, J.L.; Cancel, M.; Verheijen, R.B.; Mellemgaard, A.; Ottesen, L.H.; Frigault, M.M.; L’Hernault, A.; Szijgyarto, Z.; et al. Efficacy of Savolitinib vs Sunitinib in Patients with MET-Driven Papillary Renal Cell Carcinoma: The SAVOIR Phase 3 Randomized Clinical Trial. JAMA Oncol. 2020, 6, 1247–1255. [Google Scholar] [CrossRef] [PubMed]
- Tannir, N.M.; Figlin, R.A.; Gore, M.E.; Michaelson, M.D.; Motzer, R.J.; Porta, C.; Rini, B.I.; Hoang, C.; Lin, X.; Escudier, B. Long-Term Response to Sunitinib Treatment in Metastatic Renal Cell Carcinoma: A Pooled Analysis of Clinical Trials. Clin. Genitourin. Cancer 2018, 16, 6–12.e4. [Google Scholar] [CrossRef]
- Gotink, K.J.; Broxterman, H.J.; Labots, M.; de Haas, R.R.; Dekker, H.; Honeywell, R.J.; Rudek, M.A.; Beerepoot, L.V.; Musters, R.J.; Jansen, G.; et al. Lysosomal sequestration of sunitinib: A novel mechanism of drug resistance. Clin. Cancer Res. 2011, 17, 7337–7346. [Google Scholar] [CrossRef]
- Nowak-Sliwinska, P.; Weiss, A.; van Beijnum, J.R.; Wong, T.J.; Kilarski, W.W.; Szewczyk, G.; Verheul, H.M.W.; Sarna, T.; van den Bergh, H.; Griffioen, A.W. Photoactivation of lysosomally sequestered sunitinib after angiostatic treatment causes vascular occlusion and enhances tumor growth inhibition. Cell Death Dis. 2015, 6, e1641. [Google Scholar] [CrossRef] [PubMed]
- Joosten, S.C.; Hamming, L.; Soetekouw, P.M.; Aarts, M.J.; Veeck, J.; van Engeland, M.; Tjan-Heijnen, V.C. Resistance to sunitinib in renal cell carcinoma: From molecular mechanisms to predictive markers and future perspectives. Biochim. Biophys. Acta 2015, 1855, 1–16. [Google Scholar] [CrossRef]
- Giuliano, S.; Cormerais, Y.; Dufies, M.; Grepin, R.; Colosetti, P.; Belaid, A.; Parola, J.; Martin, A.; Lacas-Gervais, S.; Mazure, N.M.; et al. Resistance to sunitinib in renal clear cell carcinoma results from sequestration in lysosomes and inhibition of the autophagic flux. Autophagy 2015, 11, 1891–1904. [Google Scholar] [CrossRef]
- Van der Mijn, J.C.; Panka, D.J.; Geissler, A.K.; Verheul, H.M.; Mier, J.W. Novel drugs that target the metabolic reprogramming in renal cell cancer. Cancer Metab. 2016, 4, 14. [Google Scholar] [CrossRef] [PubMed]
- Weiss, R.H. Metabolomics and Metabolic Reprogramming in Kidney Cancer. Semin. Nephrol. 2018, 38, 175–182. [Google Scholar] [CrossRef] [PubMed]
- Hakimi, A.A.; Reznik, E.; Lee, C.H.; Creighton, C.J.; Brannon, A.R.; Luna, A.; Aksoy, B.A.; Liu, E.M.; Shen, R.; Lee, W.; et al. An Integrated Metabolic Atlas of Clear Cell Renal Cell Carcinoma. Cancer Cell 2016, 29, 104–116. [Google Scholar] [CrossRef] [PubMed]
- Kaddurah-Daouk, R.; Weinshilboum, R.; The Pharmacometabolomics Research Network. Metabolomic Signatures for Drug Response Phenotypes: Pharmacometabolomics Enables Precision Medicine. Clin. Pharmacol. Ther. 2015, 98, 71–75. [Google Scholar] [CrossRef]
- Chhabra, N.; Aseri, M.L.; Padmanabhan, D. A review of drug isomerism and its significance. Int. J. Appl. Basic Med. Res. 2013, 3, 16–18. [Google Scholar] [CrossRef] [PubMed]
- Wainer, I.W. Stereoisomers in clinical oncology: Why it is important to know what the right and left hands are doing. Ann. Oncol. 1993, 4 (Suppl. 2), 7–13. [Google Scholar] [CrossRef]
- Galea, A.M.; Murray, V. The anti-tumour agent, cisplatin, and its clinically ineffective isomer, transplatin, produce unique gene expression profiles in human cells. Cancer Inform. 2008, 6, 315–355. [Google Scholar] [CrossRef] [PubMed]
- Matsunaga, N.; Kitahara, T.; Yamada, M.; Sato, K.; Kodama, Y.; Sasaki, H. The influence of light sources on sunitinib measurements with photoisomerization. Biomed. Chromatogr. 2019, 33, e4407. [Google Scholar] [CrossRef] [PubMed]
- Posocco, B.; Buzzo, M.; Giodini, L.; Crotti, S.; D’Aronco, S.; Traldi, P.; Agostini, M.; Marangon, E.; Toffoli, G. Analytical aspects of sunitinib and its geometric isomerism towards therapeutic drug monitoring in clinical routine. J. Pharm. Biomed. Anal. 2018, 160, 360–367. [Google Scholar] [CrossRef] [PubMed]
- Sato, T.; Kawasaki, Y.; Maekawa, M.; Takasaki, S.; Morozumi, K.; Sato, M.; Shimada, S.; Kawamorita, N.; Yamashita, S.; Mitsuzuka, K.; et al. Metabolomic Analysis to Elucidate Mechanisms of Sunitinib Resistance in Renal Cell Carcinoma. Metabolites 2020, 11, 1. [Google Scholar] [CrossRef] [PubMed]
- Rovithi, M.; de Haas, R.R.; Honeywell, R.J.; Poel, D.; Peters, G.J.; Griffioen, A.W.; Verheul, H.M.W. Alternative scheduling of pulsatile, high dose sunitinib efficiently suppresses tumor growth. J. Exp. Clin. Cancer Res. 2016, 35, 138. [Google Scholar] [CrossRef] [PubMed]
- Hao, Z.; Sadek, I. Sunitinib: The anti-angiogenic effects and beyond. OncoTargets Ther. 2016, 9, 5495–5505. [Google Scholar] [CrossRef] [PubMed]
- Nagyiványi, K.; Budai, B.; Gyergyay, F.; Küronya, Z.; Bíró, K.; Géczi, L. Sunitinib Rechallenge after Other Targeted Therapies in Metastatic Renal Cell Carcinoma Patients: A Single-Center, Retrospective Study. Clin. Drug Investig. 2019, 39, 577–583. [Google Scholar] [CrossRef]
- Rausch, M.; Weiss, A.; Achkhanian, J.; Rotari, A.; Nowak-Sliwinska, P. Identification of low-dose multidrug combinations for sunitinib-naive and pre-treated renal cell carcinoma. Br. J. Cancer 2020, 123, 556–567. [Google Scholar] [CrossRef] [PubMed]
- Rausch, M.; Weiss, A.; Zoetemelk, M.; Piersma, S.R.; Jimenez, C.R.; van Beijnum, J.R.; Nowak-Sliwinska, P. Optimized Combination of HDACI and TKI Efficiently Inhibits Metabolic Activity in Renal Cell Carcinoma and Overcomes Sunitinib Resistance. Cancers 2020, 12, 3172. [Google Scholar] [CrossRef] [PubMed]
- Townson, J.L.; Chambers, A.F. Dormancy of solitary metastatic cells. Cell Cycle 2006, 5, 1744–1750. [Google Scholar] [CrossRef]
- Phan, T.G.; Croucher, P.I. The dormant cancer cell life cycle. Nat. Rev. Cancer 2020, 20, 398–411. [Google Scholar] [CrossRef] [PubMed]
- Rausch, M.; Blanc, L.; Silva, O.D.S.; Dormond, O.; Griffioen, A.W.; Nowak-Sliwinska, P. Characterization of Renal Cell Carcinoma Heterotypic 3D Co-Cultures with Immune Cell Subsets. Cancers 2021, 13, 2551. [Google Scholar] [CrossRef]
- Louhichi, T.; Saad, H.; Dhiab, M.B.; Ziadi, S.; Trimeche, M. Stromal CD10 expression in breast cancer correlates with tumor invasion and cancer stem cell phenotype. BMC Cancer 2018, 18, 49. [Google Scholar] [CrossRef] [PubMed]
- Yang, J.F.; Shi, S.N.; Xu, W.H.; Qiu, Y.H.; Zheng, J.Z.; Yu, K.; Song, X.Y.; Li, F.; Wang, Y.; Wang, R.; et al. Screening, Identification and validation of CCND1 and PECAM1/CD31 for predicting prognosis in renal cell carcinoma patients. Aging 2019, 11, 12057–12079. [Google Scholar] [CrossRef] [PubMed]
- Chevrier, S.; Levine, J.H.; Zanotelli, V.R.T.; Silina, K.; Schulz, D.; Bacac, M.; Ries, C.H.; Ailles, L.; Jewett, M.A.S.; Moch, H.; et al. An Immune Atlas of Clear Cell Renal Cell Carcinoma. Cell 2017, 169, 736–749.e18. [Google Scholar] [CrossRef]
- Weiss, A.; Le Roux-Bourdieu, M.; Zoetemelk, M.; Ramzy, G.M.; Rausch, M.; Harry, D.; Miljkovic-Licina, M.; Falamaki, K.; Wehrle-Haller, B.; Meraldi, P.; et al. Identification of a Synergistic Multi-Drug Combination Active in Cancer Cells via the Prevention of Spindle Pole Clustering. Cancers 2019, 11, 1612. [Google Scholar] [CrossRef] [PubMed]
- Zoetemelk, M.; Ramzy, G.M.; Rausch, M.; Koessler, T.; van Beijnum, J.R.; Weiss, A.; Mieville, V.; Piersma, S.R.; de Haas, R.R.; Delucinge-Vivier, C.; et al. Optimized low-dose combinatorial drug treatment boosts selectivity and efficacy of colorectal carcinoma treatment. Mol. Oncol. 2020, 14, 2894–2919. [Google Scholar] [CrossRef] [PubMed]
- Farber, N.J.; Kim, C.J.; Modi, P.K.; Hon, J.D.; Sadimin, E.T.; Singer, E.A. Renal cell carcinoma: The search for a reliable biomarker. Transl. Cancer Res. 2017, 6, 620–632. [Google Scholar] [CrossRef] [PubMed]
- Hsieh, J.J.; Purdue, M.P.; Signoretti, S.; Swanton, C.; Albiges, L.; Schmidinger, M.; Heng, D.Y.; Larkin, J.; Ficarra, V. Renal cell carcinoma. Nat. Rev. Dis. Primers 2017, 3, 17009. [Google Scholar] [CrossRef] [PubMed]
- Nowak-Sliwinska, P.; van Beijnum, J.R.; Griffioen, C.J.; Huijnen, Z.R.; Grima Sopesens, N.; Schulz, R.; Dings, R.P.M.; Jenkins, S.V.; Groenendijk, F.; Bernards, R.; et al. Proinflammatory activity of VEGF-targeted treatment through reversal of tumor endothelial cell anergy. under review.
- Butz, H.; Ding, Q.; Nofech-Mozes, R.; Lichner, Z.; Ni, H.; Yousef, G.M. Elucidating mechanisms of sunitinib resistance in renal cancer: An integrated pathological-molecular analysis. Oncotarget 2017, 9, 4661–4674. [Google Scholar] [CrossRef] [PubMed]
- Makhov, P.; Naito, S.; Haifler, M.; Kutikov, A.; Boumber, Y.; Uzzo, R.G.; Kolenko, V.M. The convergent roles of NF-κB and ER stress in sunitinib-mediated expression of pro-tumorigenic cytokines and refractory phenotype in renal cell carcinoma. Cell Death Dis. 2018, 9, 374. [Google Scholar] [CrossRef] [PubMed]
- Juengel, E.; Kim, D.; Makarević, J.; Reiter, M.; Tsaur, I.; Bartsch, G.; Haferkamp, A.; Blaheta, R.A. Molecular analysis of sunitinib resistant renal cell carcinoma cells after sequential treatment with RAD001 (everolimus) or sorafenib. J. Cell. Mol. Med. 2015, 19, 430–441. [Google Scholar] [CrossRef] [PubMed]
- Elgendy, M.; Fusco, J.P.; Segura, V.; Lozano, M.D.; Minucci, S.; Echeveste, J.I.; Gurpide, A.; Andueza, M.; Melero, I.; Sanmamed, M.F.; et al. Identification of mutations associated with acquired resistance to sunitinib in renal cell cancer. Int. J. Cancer 2019, 145, 1991–2001. [Google Scholar] [CrossRef]
- Kamli, H.; Glenda, G.C.; Li, L.; Vesey, D.A.; Morais, C. Characterisation of the Morphological, Functional and Molecular Changes in Sunitinib-Resistant Renal Cell Carcinoma Cells. J. Kidney Cancer VHL 2018, 5, 1–9. [Google Scholar] [CrossRef] [PubMed]
- Hatakeyama, H.; Fujiwara, T.; Sato, H.; Terui, A.; Hisaka, A. Investigation of Metabolomic Changes in Sunitinib-Resistant Human Renal Carcinoma 786-O Cells by Capillary Electrophoresis-Time of Flight Mass Spectrometry. Biol. Pharm. Bull. 2018, 41, 619–627. [Google Scholar] [CrossRef] [PubMed]
- Kretschmer, A.; Zhang, F.; Somasekharan, S.P.; Tse, C.; Leachman, L.; Gleave, A.; Li, B.; Asmaro, I.; Huang, T.; Kotula, L.; et al. Stress-induced tunneling nanotubes support treatment adaptation in prostate cancer. Sci. Rep. 2019, 9, 7826. [Google Scholar] [CrossRef] [PubMed]
- Mittal, R.; Karhu, E.; Wang, J.S.; Delgado, S.; Zukerman, R.; Mittal, J.; Jhaveri, V.M. Cell communication by tunneling nanotubes: Implications in disease and therapeutic applications. J. Cell. Physiol. 2019, 234, 1130–1146. [Google Scholar] [CrossRef]
- Sahu, P.; Jena, S.R.; Samanta, L. Tunneling Nanotubes: A Versatile Target for Cancer Therapy. Curr. Cancer Drug Targets 2018, 18, 514–521. [Google Scholar] [CrossRef]
- Li, L.; Zhao, S.; Liu, Z.; Zhang, N.; Pang, S.; Liu, J.; Liu, C.; Fan, Y. Sunitinib treatment promotes metastasis of drug-resistant renal cell carcinoma via TFE3 signaling pathway. Cell Death Dis. 2021, 12, 220. [Google Scholar] [CrossRef] [PubMed]
- Fukusumi, T.; Ishii, H.; Konno, M.; Yasui, T.; Nakahara, S.; Takenaka, Y.; Yamamoto, Y.; Nishikawa, S.; Kano, Y.; Ogawa, H.; et al. CD10 as a novel marker of therapeutic resistance and cancer stem cells in head and neck squamous cell carcinoma. Br. J. Cancer 2014, 111, 506–514. [Google Scholar] [CrossRef]
- Wiedmer, T.; Blank, A.; Pantasis, S.; Normand, L.; Bill, R.; Krebs, P.; Tschan, M.P.; Marinoni, I.; Perren, A. Autophagy Inhibition Improves Sunitinib Efficacy in Pancreatic Neuroendocrine Tumors via a Lysosome-dependent Mechanism. Mol. Cancer Ther. 2017, 16, 2502–2515. [Google Scholar] [CrossRef] [PubMed]
- Riedl, A.; Schlederer, M.; Pudelko, K.; Stadler, M.; Walter, S.; Unterleuthner, D.; Unger, C.; Kramer, N.; Hengstschläger, M.; Kenner, L.; et al. Comparison of cancer cells in 2D vs 3D culture reveals differences in AKT–mTOR–S6K signaling and drug responses. J. Cell Sci. 2017, 130, 203–218. [Google Scholar] [CrossRef] [PubMed]
- Breslin, S.; O’Driscoll, L. The relevance of using 3D cell cultures, in addition to 2D monolayer cultures, when evaluating breast cancer drug sensitivity and resistance. Oncotarget 2016, 7, 45745–45756. [Google Scholar] [CrossRef]
- Imamura, Y.; Mukohara, T.; Shimono, Y.; Funakoshi, Y.; Chayahara, N.; Toyoda, M.; Kiyota, N.; Takao, S.; Kono, S.; Nakatsura, T.; et al. Comparison of 2D- and 3D-culture models as drug-testing platforms in breast cancer. Oncol. Rep. 2015, 33, 1837–1843. [Google Scholar] [CrossRef] [PubMed]
- Le, V.M.; Lang, M.D.; Shi, W.B.; Liu, J.W. A collagen-based multicellular tumor spheroid model for evaluation of the efficiency of nanoparticle drug delivery. Artif. Cells Nanomed. Biotechnol. 2016, 44, 540–544. [Google Scholar] [CrossRef]
- Brodaczewska, K.K.; Bielecka, Z.F.; Maliszewska-Olejniczak, K.; Szczylik, C.; Porta, C.; Bartnik, E.; Czarnecka, A.M. Metastatic renal cell carcinoma cells growing in 3D on poly-D-lysine or laminin present a stem-like phenotype and drug resistance. Oncol. Rep. 2019, 42, 1878–1892. [Google Scholar] [CrossRef] [PubMed]
- Haake, S.M.; Li, J.; Bai, Y.; Kinose, F.; Fang, B.; Welsh, E.A.; Zent, R.; Dhillon, J.; Pow-Sang, J.M.; Chen, Y.A.; et al. Tyrosine Kinase Signaling in Clear Cell and Papillary Renal Cell Carcinoma Revealed by Mass Spectrometry–Based Phosphotyrosine Proteomics. Clin. Cancer Res. 2016, 22, 5605–5616. [Google Scholar] [CrossRef] [PubMed]
- Lai, Y.; Zhao, Z.; Zeng, T.; Liang, X.; Chen, D.; Duan, X.; Zeng, G.; Wu, W. Crosstalk between VEGFR and other receptor tyrosine kinases for TKI therapy of metastatic renal cell carcinoma. Cancer Cell Int. 2018, 18, 31. [Google Scholar] [CrossRef] [PubMed]
- Yang, Z.; Tam, K.Y. Combination Strategies Using EGFR-TKi in NSCLC Therapy: Learning from the Gap between Pre-Clinical Results and Clinical Outcomes. Int. J. Biol. Sci. 2018, 14, 204–216. [Google Scholar] [CrossRef] [PubMed]
- Cava, C.; Bertoli, G.; Castiglioni, I. In silico Identification of drug target pathways in breast cancer subtypes using pathway cross-talk inhibition. J. Transl. Med. 2018, 16, 154. [Google Scholar] [CrossRef] [PubMed]
- Perez-Garcia, J.; Muñoz-Couselo, E.; Soberino, J.; Racca, F.; Cortes, J. Targeting FGFR pathway in breast cancer. Breast 2018, 37, 126–133. [Google Scholar] [CrossRef]
- Fumarola, C.; Bozza, N.; Castelli, R.; Ferlenghi, F.; Marseglia, G.; Lodola, A.; Bonelli, M.; La Monica, S.; Cretella, D.; Alfieri, R.; et al. Expanding the Arsenal of FGFR Inhibitors: A Novel Chloroacetamide Derivative as a New Irreversible Agent with Anti-proliferative Activity against FGFR1-Amplified Lung Cancer Cell Lines. Front. Oncol. 2019, 9, 179. [Google Scholar] [CrossRef] [PubMed]
- Dhillon, A.S.; Hagan, S.; Rath, O.; Kolch, W. MAP kinase signalling pathways in cancer. Oncogene 2007, 26, 3279–3290. [Google Scholar] [CrossRef]
- Tolcher, A.W.; Peng, W.; Calvo, E. Rational Approaches for Combination Therapy Strategies Targeting the MAP Kinase Pathway in Solid Tumors. Mol. Cancer Ther. 2018, 17, 3–16. [Google Scholar] [CrossRef] [PubMed]
- Caumanns, J.J.; van Wijngaarden, A.; Kol, A.; Meersma, G.J.; Jalving, M.; Bernards, R.; van der Zee, A.G.J.; Wisman, G.B.A.; de Jong, S. Low-dose triple drug combination targeting the PI3K/AKT/mTOR pathway and the MAPK pathway is an effective approach in ovarian clear cell carcinoma. Cancer Lett. 2019, 461, 102–111. [Google Scholar] [CrossRef]
- Dobin, A.; Davis, C.A.; Schlesinger, F.; Drenkow, J.; Zaleski, C.; Jha, S.; Batut, P.; Chaisson, M.; Gingeras, T.R. STAR: Ultrafast universal RNA-seq aligner. Bioinformatics 2013, 29, 15–21. [Google Scholar] [CrossRef]
- Robinson, M.D.; McCarthy, D.J.; Smyth, G.K. edgeR: A Bioconductor package for differential expression analysis of digital gene expression data. Bioinformatics 2010, 26, 139–140. [Google Scholar] [CrossRef]
- Song, G.G.; Lee, Y.H. Pathway analysis of genome-wide association studies for Parkinson’s disease. Mol. Biol. Rep. 2013, 40, 2599–2607. [Google Scholar] [CrossRef]
- Chambers, M.C.; Maclean, B.; Burke, R.; Amodei, D.; Ruderman, D.L.; Neumann, S.; Gatto, L.; Fischer, B.; Pratt, B.; Egertson, J.; et al. A cross-platform toolkit for mass spectrometry and proteomics. Nat. Biotechnol. 2012, 30, 918–920. [Google Scholar] [CrossRef]
- Pluskal, T.; Castillo, S.; Villar-Briones, A.; Oresic, M. MZmine 2: Modular framework for processing, visualizing, and analyzing mass spectrometry-based molecular profile data. BMC Bioinform. 2010, 11, 395. [Google Scholar] [CrossRef]
- Kondo, J.; Ekawa, T.; Endo, H.; Yamazaki, K.; Tanaka, N.; Kukita, Y.; Okuyama, H.; Okami, J.; Imamura, F.; Ohue, M.; et al. High-throughput screening in colorectal cancer tissue-originated spheroids. Cancer Sci. 2019, 110, 345–355. [Google Scholar] [CrossRef] [PubMed]


Publisher’s Note: MDPI stays neutral with regard to jurisdictional claims in published maps and institutional affiliations. |
© 2021 by the authors. Licensee MDPI, Basel, Switzerland. This article is an open access article distributed under the terms and conditions of the Creative Commons Attribution (CC BY) license (https://creativecommons.org/licenses/by/4.0/).
Share and Cite
Rausch, M.; Rutz, A.; Allard, P.-M.; Delucinge-Vivier, C.; Docquier, M.; Dormond, O.; Wolfender, J.-L.; Nowak-Sliwinska, P. Molecular and Functional Analysis of Sunitinib-Resistance Induction in Human Renal Cell Carcinoma Cells. Int. J. Mol. Sci. 2021, 22, 6467. https://doi.org/10.3390/ijms22126467
Rausch M, Rutz A, Allard P-M, Delucinge-Vivier C, Docquier M, Dormond O, Wolfender J-L, Nowak-Sliwinska P. Molecular and Functional Analysis of Sunitinib-Resistance Induction in Human Renal Cell Carcinoma Cells. International Journal of Molecular Sciences. 2021; 22(12):6467. https://doi.org/10.3390/ijms22126467
Chicago/Turabian StyleRausch, Magdalena, Adriano Rutz, Pierre-Marie Allard, Céline Delucinge-Vivier, Mylène Docquier, Olivier Dormond, Jean-Luc Wolfender, and Patrycja Nowak-Sliwinska. 2021. "Molecular and Functional Analysis of Sunitinib-Resistance Induction in Human Renal Cell Carcinoma Cells" International Journal of Molecular Sciences 22, no. 12: 6467. https://doi.org/10.3390/ijms22126467
APA StyleRausch, M., Rutz, A., Allard, P.-M., Delucinge-Vivier, C., Docquier, M., Dormond, O., Wolfender, J.-L., & Nowak-Sliwinska, P. (2021). Molecular and Functional Analysis of Sunitinib-Resistance Induction in Human Renal Cell Carcinoma Cells. International Journal of Molecular Sciences, 22(12), 6467. https://doi.org/10.3390/ijms22126467