Article

PERK/ATF4-Dependent ZFAS1 Upregulation Is Associated with Sorafenib Resistance in Hepatocellular Carcinoma Cells

by
Jiunn-Chang Lin
1,2,3,4,5,
Pei-Ming Yang
4,5,6,7,8,* and
Tsang-Pai Liu
1,2,3,4,5,*
1
Department of Surgery, MacKay Memorial Hospital, Taipei 10449, Taiwan
2
MacKay Junior College of Medicine, Nursing, and Management, New Taipei City 11260, Taiwan
3
Department of Medicine, MacKay Medical College, New Taipei City 25245, Taiwan
4
Liver Medical Center, MacKay Memorial Hospital, Taipei 10449, Taiwan
5
PhD Program for Cancer Molecular Biology and Drug Discovery, College of Medical Science and Technology, Taipei Medical University and Academia Sinica, Taipei 11031, Taiwan
6
Graduate Institute of Cancer Biology and Drug Discovery, College of Medical Science and Technology, Taipei Medical University, Taipei 11031, Taiwan
7
TMU Research Center of Cancer Translational Medicine, Taipei 11031, Taiwan
8
Cancer Center, Wan Fang Hospital, Taipei Medical University, Taipei 11696, Taiwan
*
Authors to whom correspondence should be addressed.
Int. J. Mol. Sci. 2021, 22(11), 5848; https://doi.org/10.3390/ijms22115848
Submission received: 27 March 2021 / Revised: 27 April 2021 / Accepted: 26 May 2021 / Published: 29 May 2021
(This article belongs to the Special Issue Endoplasmic Reticulum Stress and Unfolded Protein Response 2021)

Abstract

:
Sorafenib, a multi-kinase inhibitor, is the first-line treatment for advanced hepatocellular carcinoma (HCC) patients. However, this drug only provides a short improvement of patients’ overall survival, and drug resistance is commonly developed. Thus, the identification of resistant factor(s) or biomarker(s) is needed to develop more efficient therapeutic strategies. Long, non-coding RNAs (lncRNAs) have recently been viewed as attractive cancer biomarkers and drive many important cancer phenotypes. A lncRNA, ZFAS1 (ZNFX1 antisense RNA 1) has been found to promote HCC metastasis. This study found that sorafenib induced ZFAS1 expression specifically in sorafenib-resistant HCC cells. Although ZFAS1 knockdown did not restore the sensitivity of HCC cells to sorafenib, its expression may act as a resistant biomarker for sorafenib therapy. Bioinformatics analysis predicted that sorafenib tended to induce pathways related to endoplasmic reticulum (ER) stress and the unfolded protein response (UPR) in sorafenib-resistant HCC cells. In vitro experimental evidence suggested that sorafenib induced protein kinase RNA-like ER kinase (PERK)/activating transcription factor 4 (ATF4)-dependent ZFAS1 expression, and sorafenib resistance could be overcome by PERK/ATF inhibitors. Therefore, PERK/ATF4/ZFAS1 signaling axis might be an attractive therapeutic and prognostic biomarker for sorafenib therapy in HCC.

1. Introduction

Multi-kinase inhibitors have been approved for treating hepatocellular carcinoma (HCC) in recent years, including sorafenib, regorafenib, lenvatinib, and cabozantinib [1,2,3,4]. However, they only provide a short improvement of HCC patients’ overall survival [1,2,3,4]. Therefore, it is urgently needed to identify sensitive and/or resistant factors to develop more effective therapeutic protocols. Sorafenib has been approved for treating advanced HCC since 2007. However, it only benefits about 30% of patients, and acquired resistance usually develops within six months [1,5,6]. Although the clinical inefficiency of sorafenib has raised concerns by researchers, the drug resistance mechanism is still elusive [5]. A recent review article summarizes the potential resistant factors, including activation of EGFR (epidermal growth factor receptor), AKT and c-Jun oncogenic signaling pathways, autophagy, epithelial–mesenchymal transition (EMT), hypoxia, cancer stemness, dysregulation of the cell cycle, and apoptosis resistance. Drugs targeting these resistant factors might be able to improve the sorafenib efficacy or treat sorafenib-refractory HCC patients [7].
The accumulation of unfolded or misfolded proteins within the endoplasmic reticulum (ER), the site for protein synthesis and folding, activates the unfolded protein response (UPR) through three signal arms: PERK (protein kinase RNA-like ER kinase), IRE1 (serine/threonine kinases inositol-requiring enzyme-1), and ATF6 (activating transcription factor 6) [8,9]. The activation of PERK to phosphorylate eIF2α (eukaryotic translation initiation factor alpha) is an immediate response of ER stress/UPR, which attenuates global translation, but selectively induces translation of certain mRNAs, such as ATF4 and CHOP (CCAAT/enhancer binding protein (C/EBP) homologous protein) [10]. ATF4 encodes a basic zipper (bZIP) transcriptional activator for genes associated with protein folding and assembly. It also promotes the expression of CHOP (also a bZIP transcription factor) that directs cell fate to apoptosis [10]. Glucose-regulated protein 78 (GRP78) is also a central modulator for ER stress/UPR by acting as an ER chaperone and controlling the activation of IRE1, PERK, and ATF6 through a binding-release mechanism [11].
Up to 70% of the human genomic DNA sequence are transcribed into RNA with no protein-coding potential. These RNA molecules are named noncoding RNAs (ncRNAs). According to their lengths, ncRNAs are classified as small ncRNAs (such as microRNAs (miRNAs) with 18–25 nucleotides) and long ncRNAs (lncRNAs with more than 200 nucleotides). In recent years, lncRNAs have been found to participate in various biological processes and human disease pathogenesis through binding with macromolecules, including DNA, chromatin, RNA, signaling and regulatory proteins [12]. LncRNAs have been linked to sorafenib resistance. For example, knockdown of lncRNA TUC338 (transcribed ultra-conserved region 338) enhances the anticancer activity of sorafenib in HCC cells [13]. LncRNA-SRLR (sorafenib resistance-associated lncRNA in RCC) elicits intrinsic sorafenib resistance in renal cell carcinoma (RCC) [14]. ZFAS1 (ZNFX1 antisense RNA 1), a lncRNA newly identified in 2011, is shown to be dysregulated in breast cancer [15]. Later, it was found to be an oncogenic lncRNA in multiple human cancers through the regulation of EMT and EMT-regulated genes/miRNAs [16]. The ZFAS1 gene is frequently amplified in HCC, which promotes metastasis through sponging tumor-suppressive miR-150 and then activating ZEB1 (zinc finger E-box-binding homeobox 1), MMP14 (matrix metallopeptidase 14), and MMP16 [17]. Thus, ZFAS1 is viewed as a novel prognostic biomarker for HCC [17,18,19]. However, the role of ZFAS1 in drug resistance of HCC has not been investigated.
Here, we identified that sorafenib induced ZFAS1 expression, specifically in sorafenib-resistant HCC cells via the PERK/ATF4-dependent pathway, which is associated with the sorafenib resistance in HCC cells. Inhibition of PERK/ATF4, but not ZFAS1, could overcome sorafenib resistance. We concluded that the PERK/ATF4/ZFAS1 signaling axis may be used as a therapeutic and prognostic biomarker to improve the clinical efficacy of sorafenib in HCC.

2. Results

2.1. RNA-Sequencing Identifies ZFAS1 as a Sorafenib-Resistant lncRNA

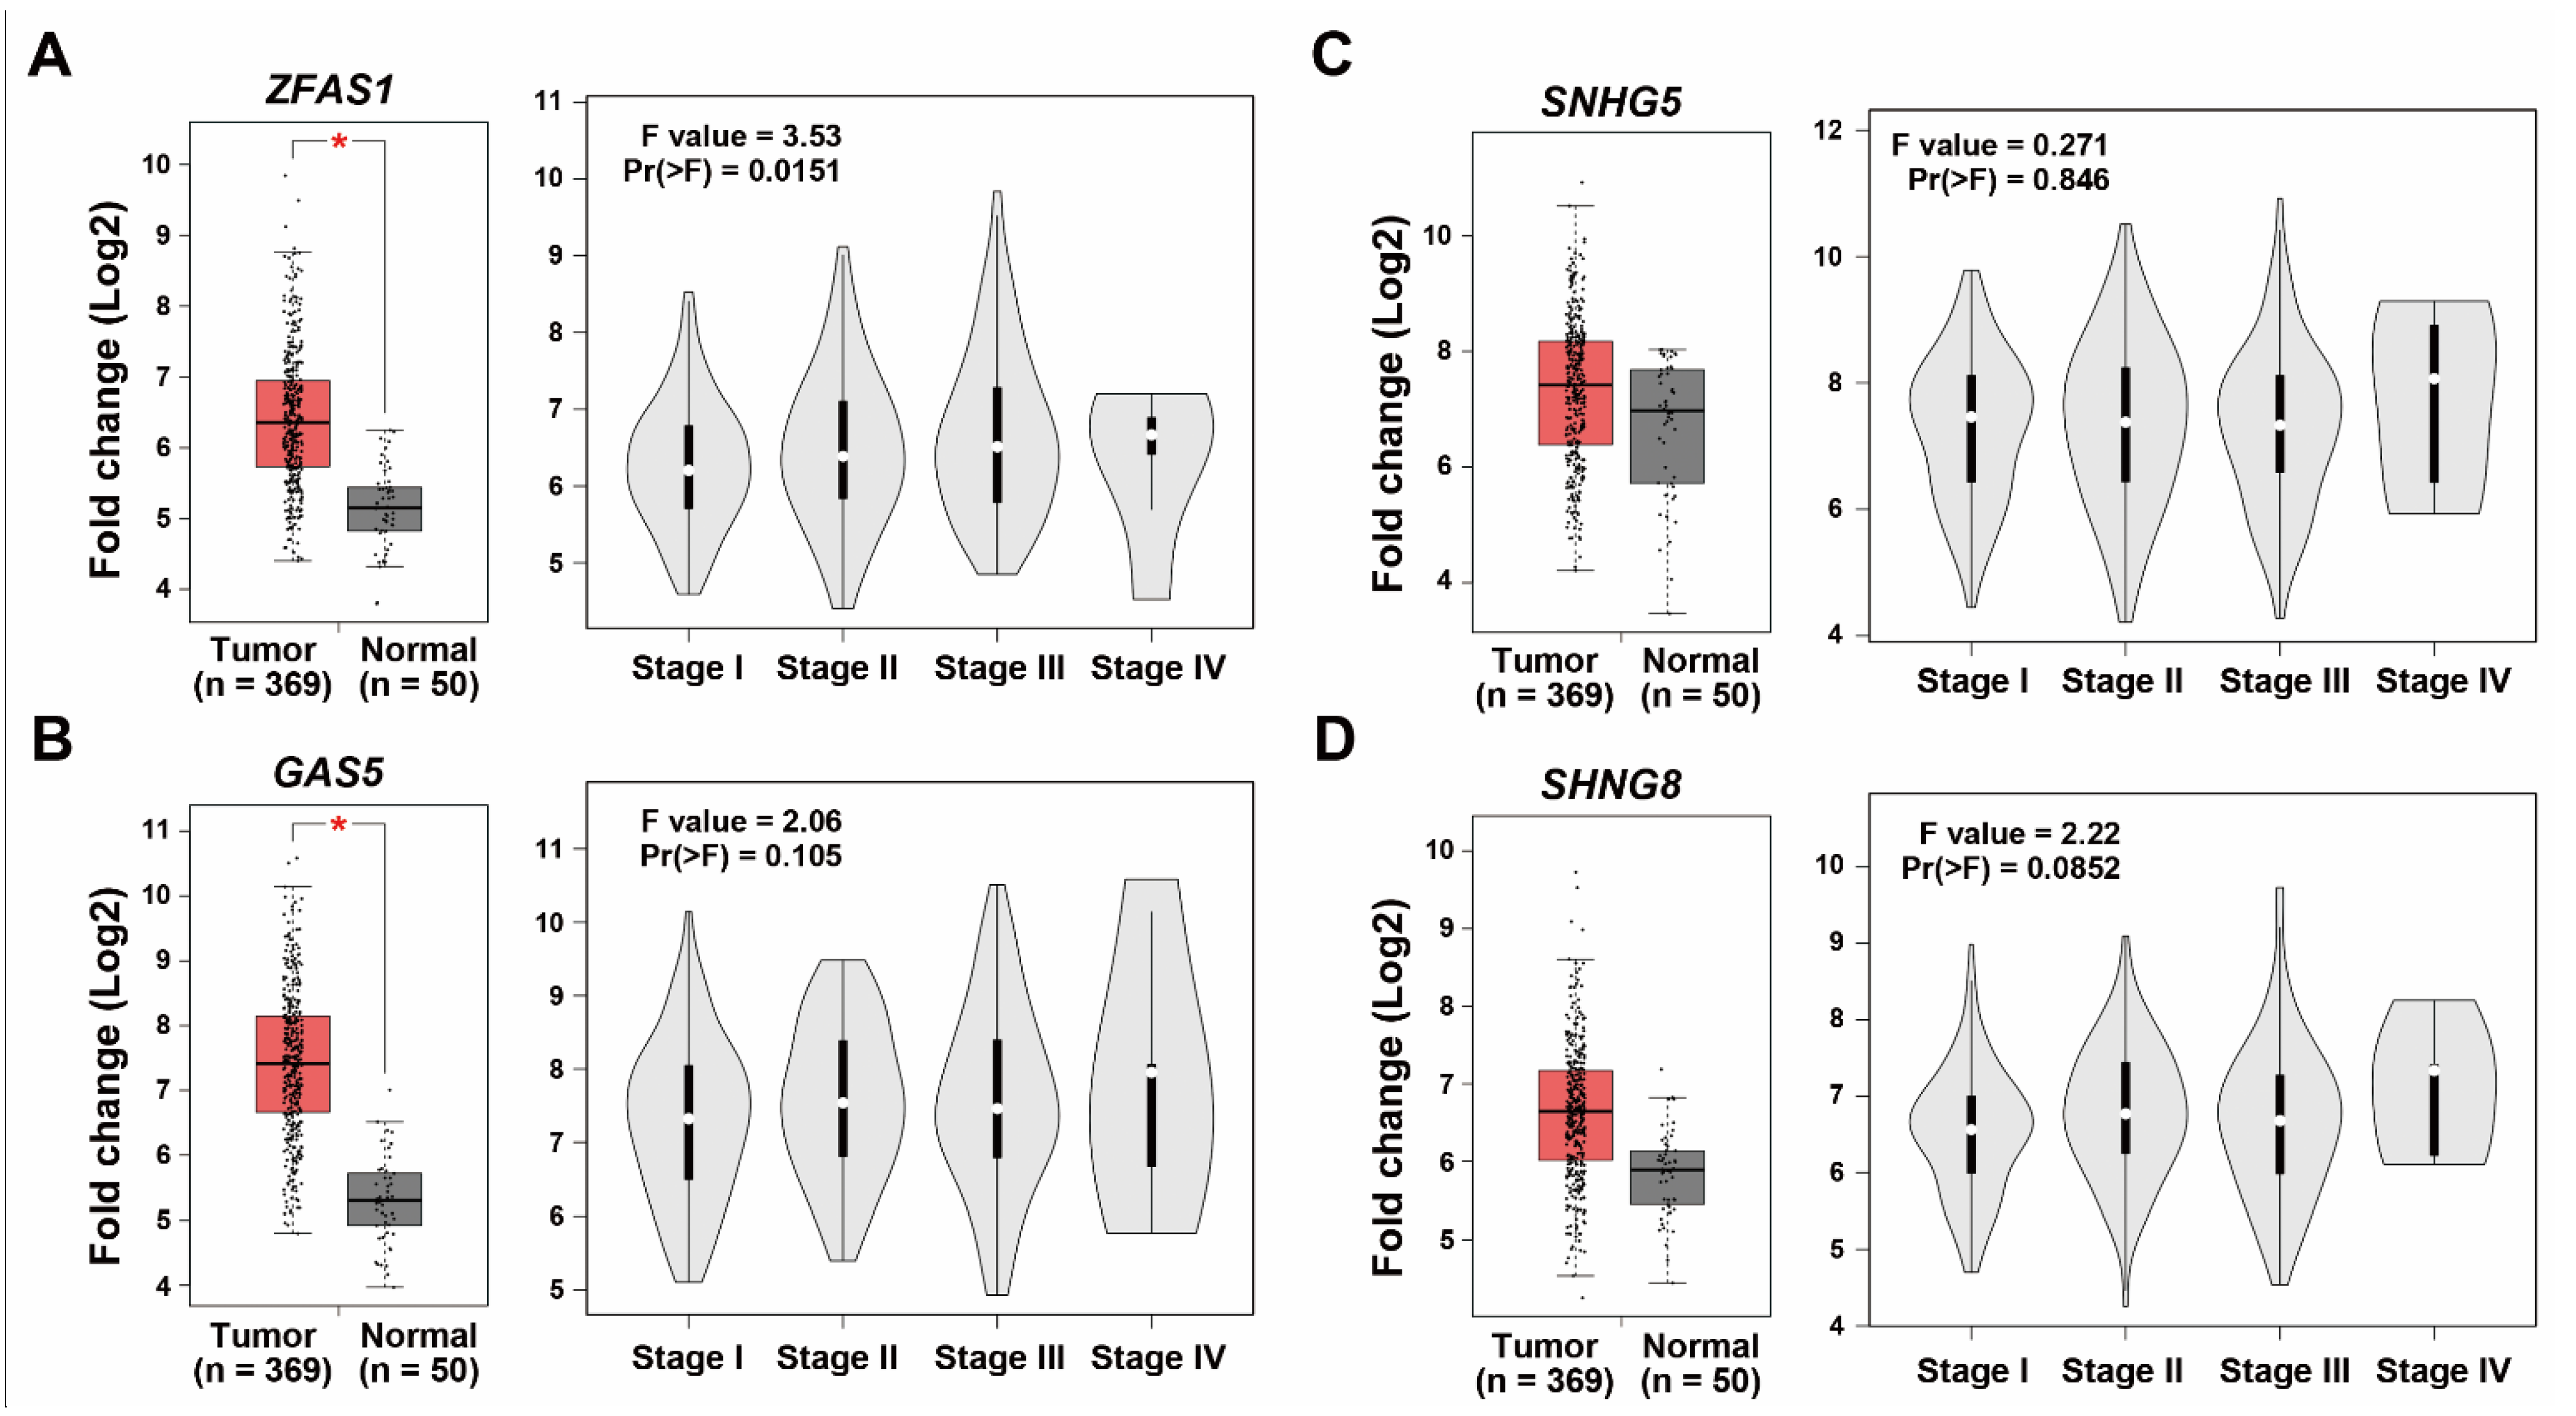
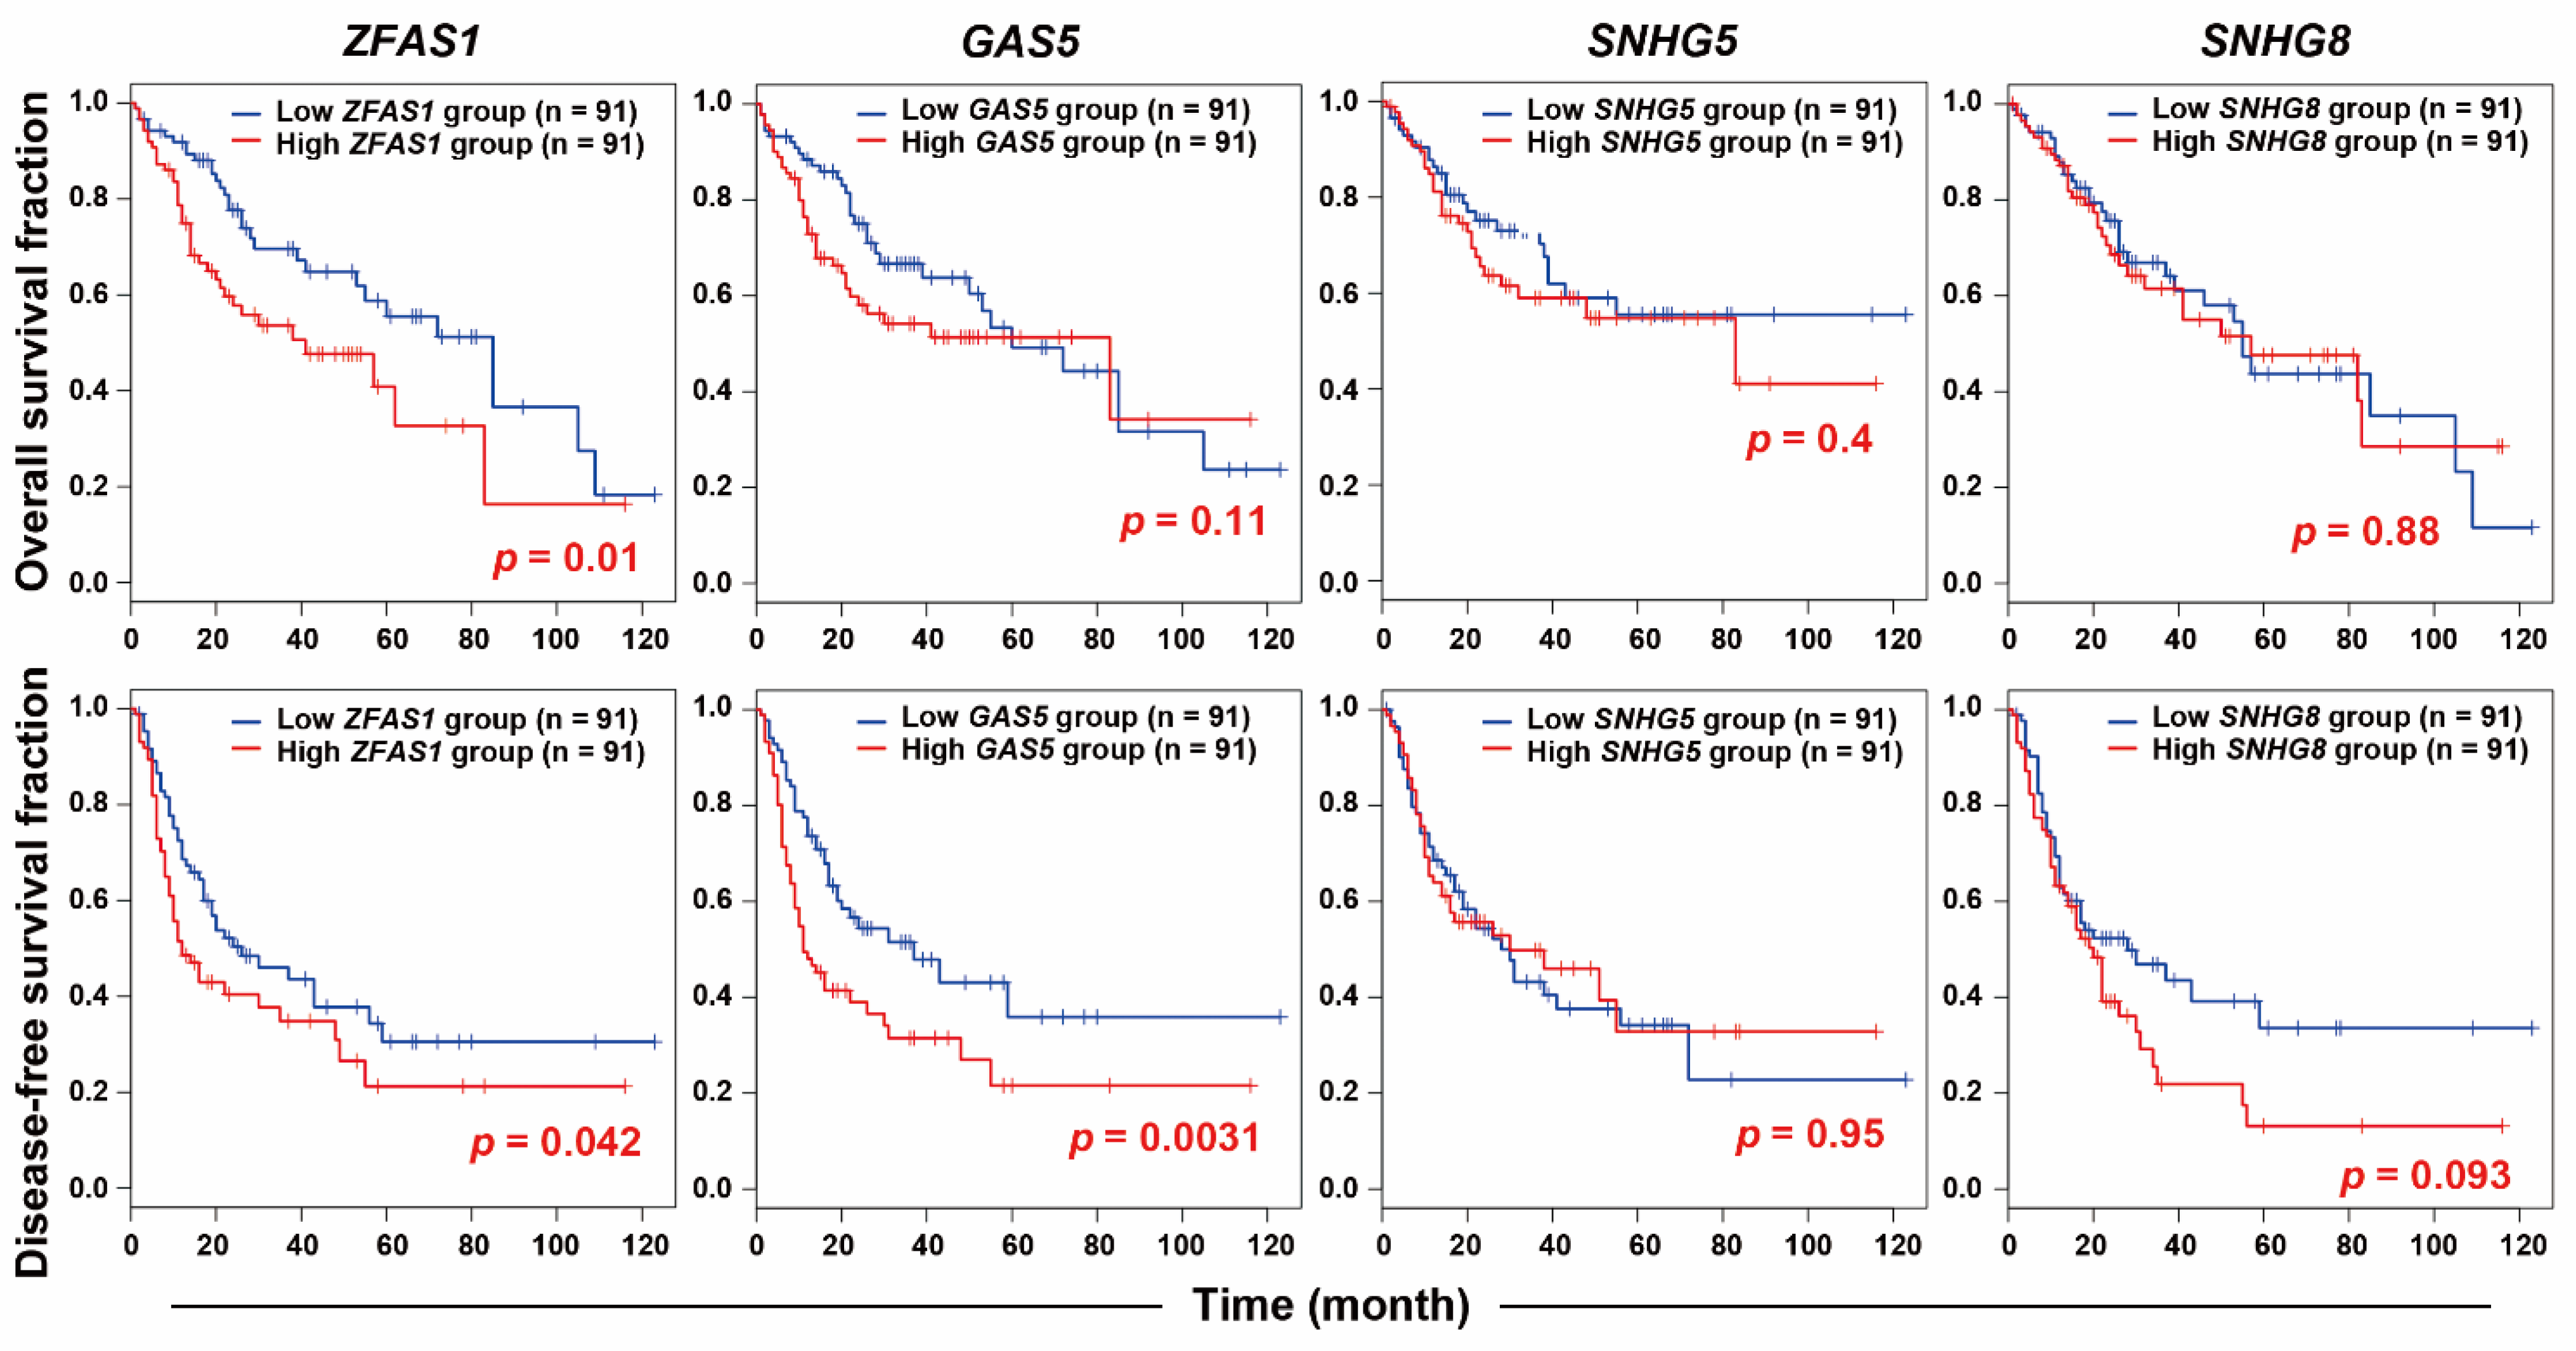
In an attempt to elucidate the potential resistant factors or biomarkers for sorafenib resistance, cell models of both primary and acquired sorafenib resistance were employed. It has been reported that HepG2 is a sorafenib-sensitive HCC cell line, whereas PLC5 cells are a sorafenib-resistant HCC cell line [20]. Indeed, our results also showed the resistance of PLC5 cells to sorafenib (Figure 1A), which will be used as a cell model for primary sorafenib resistance. The acquired sorafenib-resistant HepG2-SR cells were established in our previous study [21]. The resistance of HepG2-SR cells to sorafenib was also confirmed in this study (Figure 1A). To identify the potential lncRNAs contributing to sorafenib resistance, RNA-sequencing was performed for HepG2, HepG2-SR, and PLC5 cells treated with or without 5 μM sorafenib for 24 h. The differentially expressed genes (DEGs) are listed in Table S1. The differentially expressed lncRNAs induced by sorafenib in these cells were visualized as a Venn diagram (Figure 1B). We found that sorafenib induced many lncRNAs in sorafenib-resistant HepG2-SR and PLC5 cells, and there are four commonly upregulated lncRNAs, including GAS5 (growth arrest specific 5), SNHG5 (small nucleolar RNA host gene 5), SNHG8, and ZFAS1 (Figure 1B). To identify the most important lncRNA(s) in HCC, their gene expressions and prognostic values were analyzed by mining The Cancer Genome Atlas-Liver Hepatocellular Carcinoma (TCGA-LIHC) data via the GEPIA website [22]. As shown in Figure 2, ZFAS1 and GAS5, but not SNHG5 and SNHG8 were significantly upregulated in cancer tissues in HCC patients. Only ZFAS1 was significantly associated with tumor progression (Figure 2), and its high expression predicted poorer overall (p = 0.01) and disease-free (p = 0.042) survival in HCC patients (Figure 3). Other lncRNAs did not show prognostic values in HCC patients, except for GAS5, which had an unfavorable prognostic value in overall survival (p = 0.0031) (Figure 3). Therefore, we will focus on investigating the role of ZFAS1 in sorafenib resistance in HCC.

2.2. ZFAS1 Knockdown Does Not Reverse Sorafenib Resistance in HCC Cells

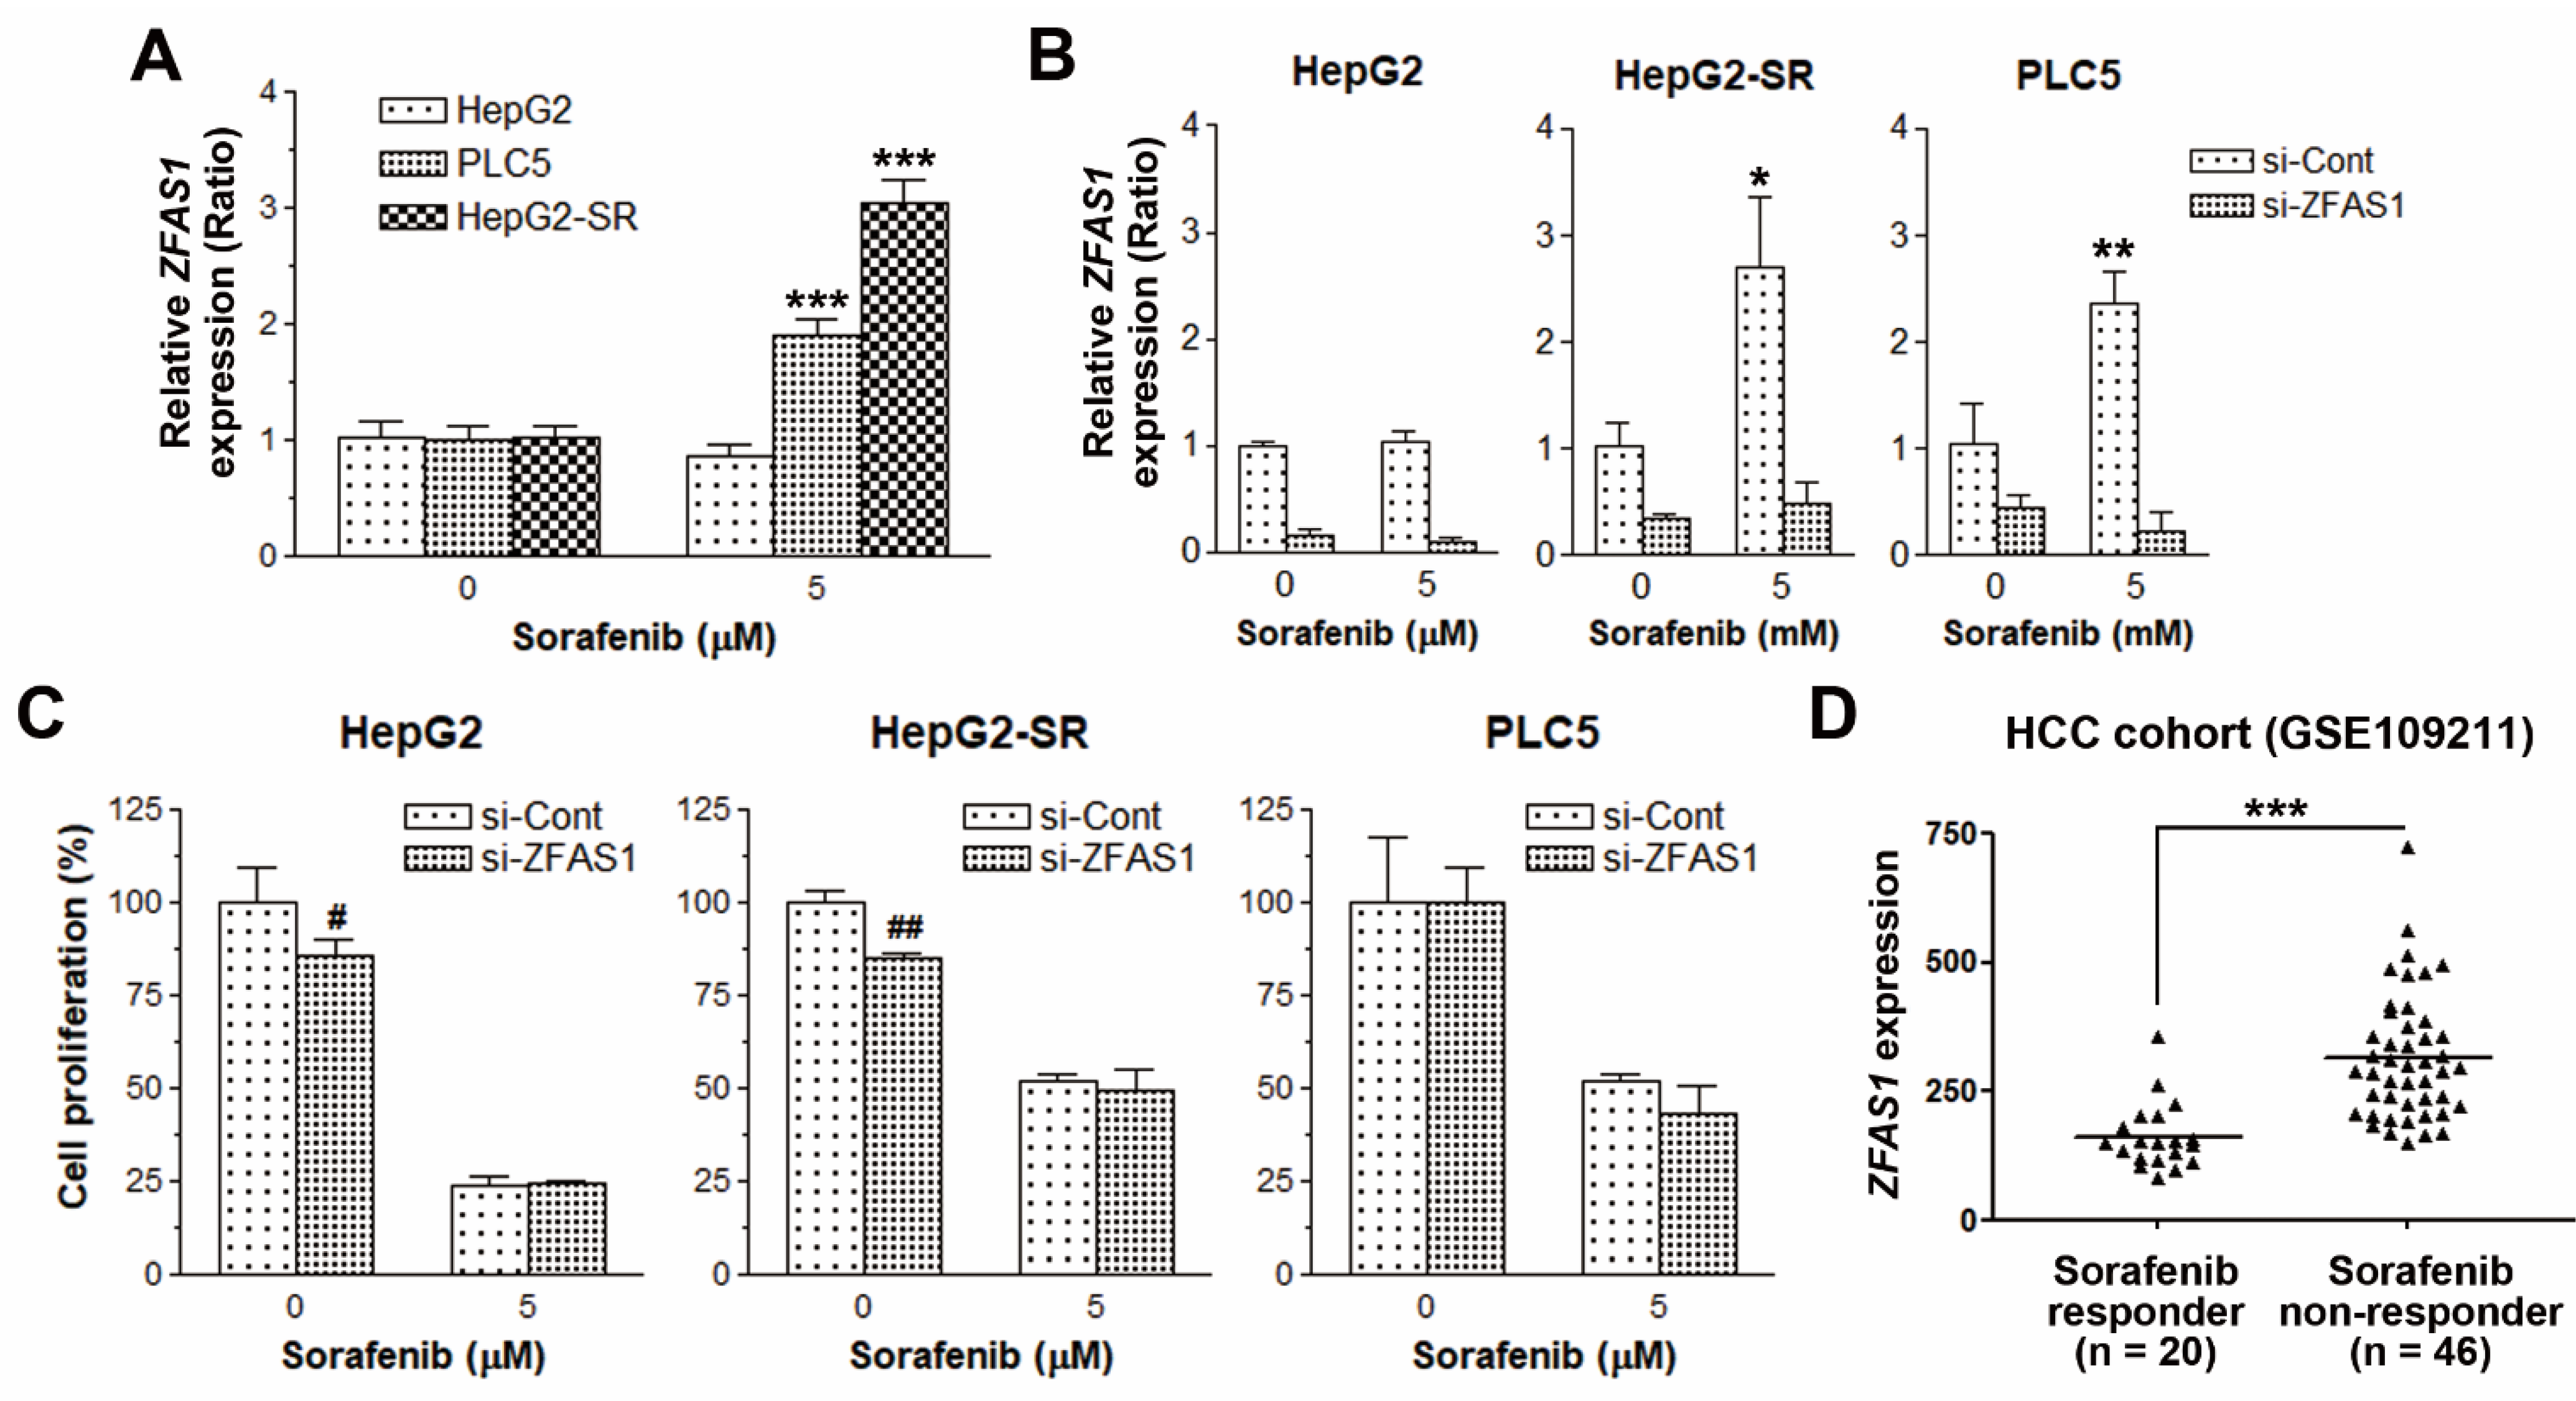
To validate whether sorafenib induced ZFAS1 expression specifically in sorafenib-resistant HCC cells, a real-time quantitative polymerase chain reaction (qPCR) was performed. As shown in Figure 4A, ZFAS1 was indeed induced by sorafenib in sorafenib-resistant HepG2-SR and PLC5 cells, but not sorafenib-sensitive HepG2 cells. To confirm the role of ZFAS1 in sorafenib resistance, its expression was knocked down by siRNA (Figure 4B). However, ZFAS1 knockdown was not sufficient to reverse sorafenib resistance in both HepG2-SR and PLC5 cells (Figure 4C). Therefore, we hypothesized that, although ZFAS1 itself did not contribute to the sorafenib resistance, its upregulation by sorafenib may act as a predictive prognostic biomarker in HCC patients receiving sorafenib therapy. To demonstrate this hypothesis, an HCC cohort containing sorafenib responders and non-responders (GSE109211 [23]) was employed. Indeed, ZFAS1 tended to express higher in sorafenib non-responders (Figure 4D).

2.3. Pathway Enrichment Predicts a Potential Role of UPR in Sorafenib Resistance

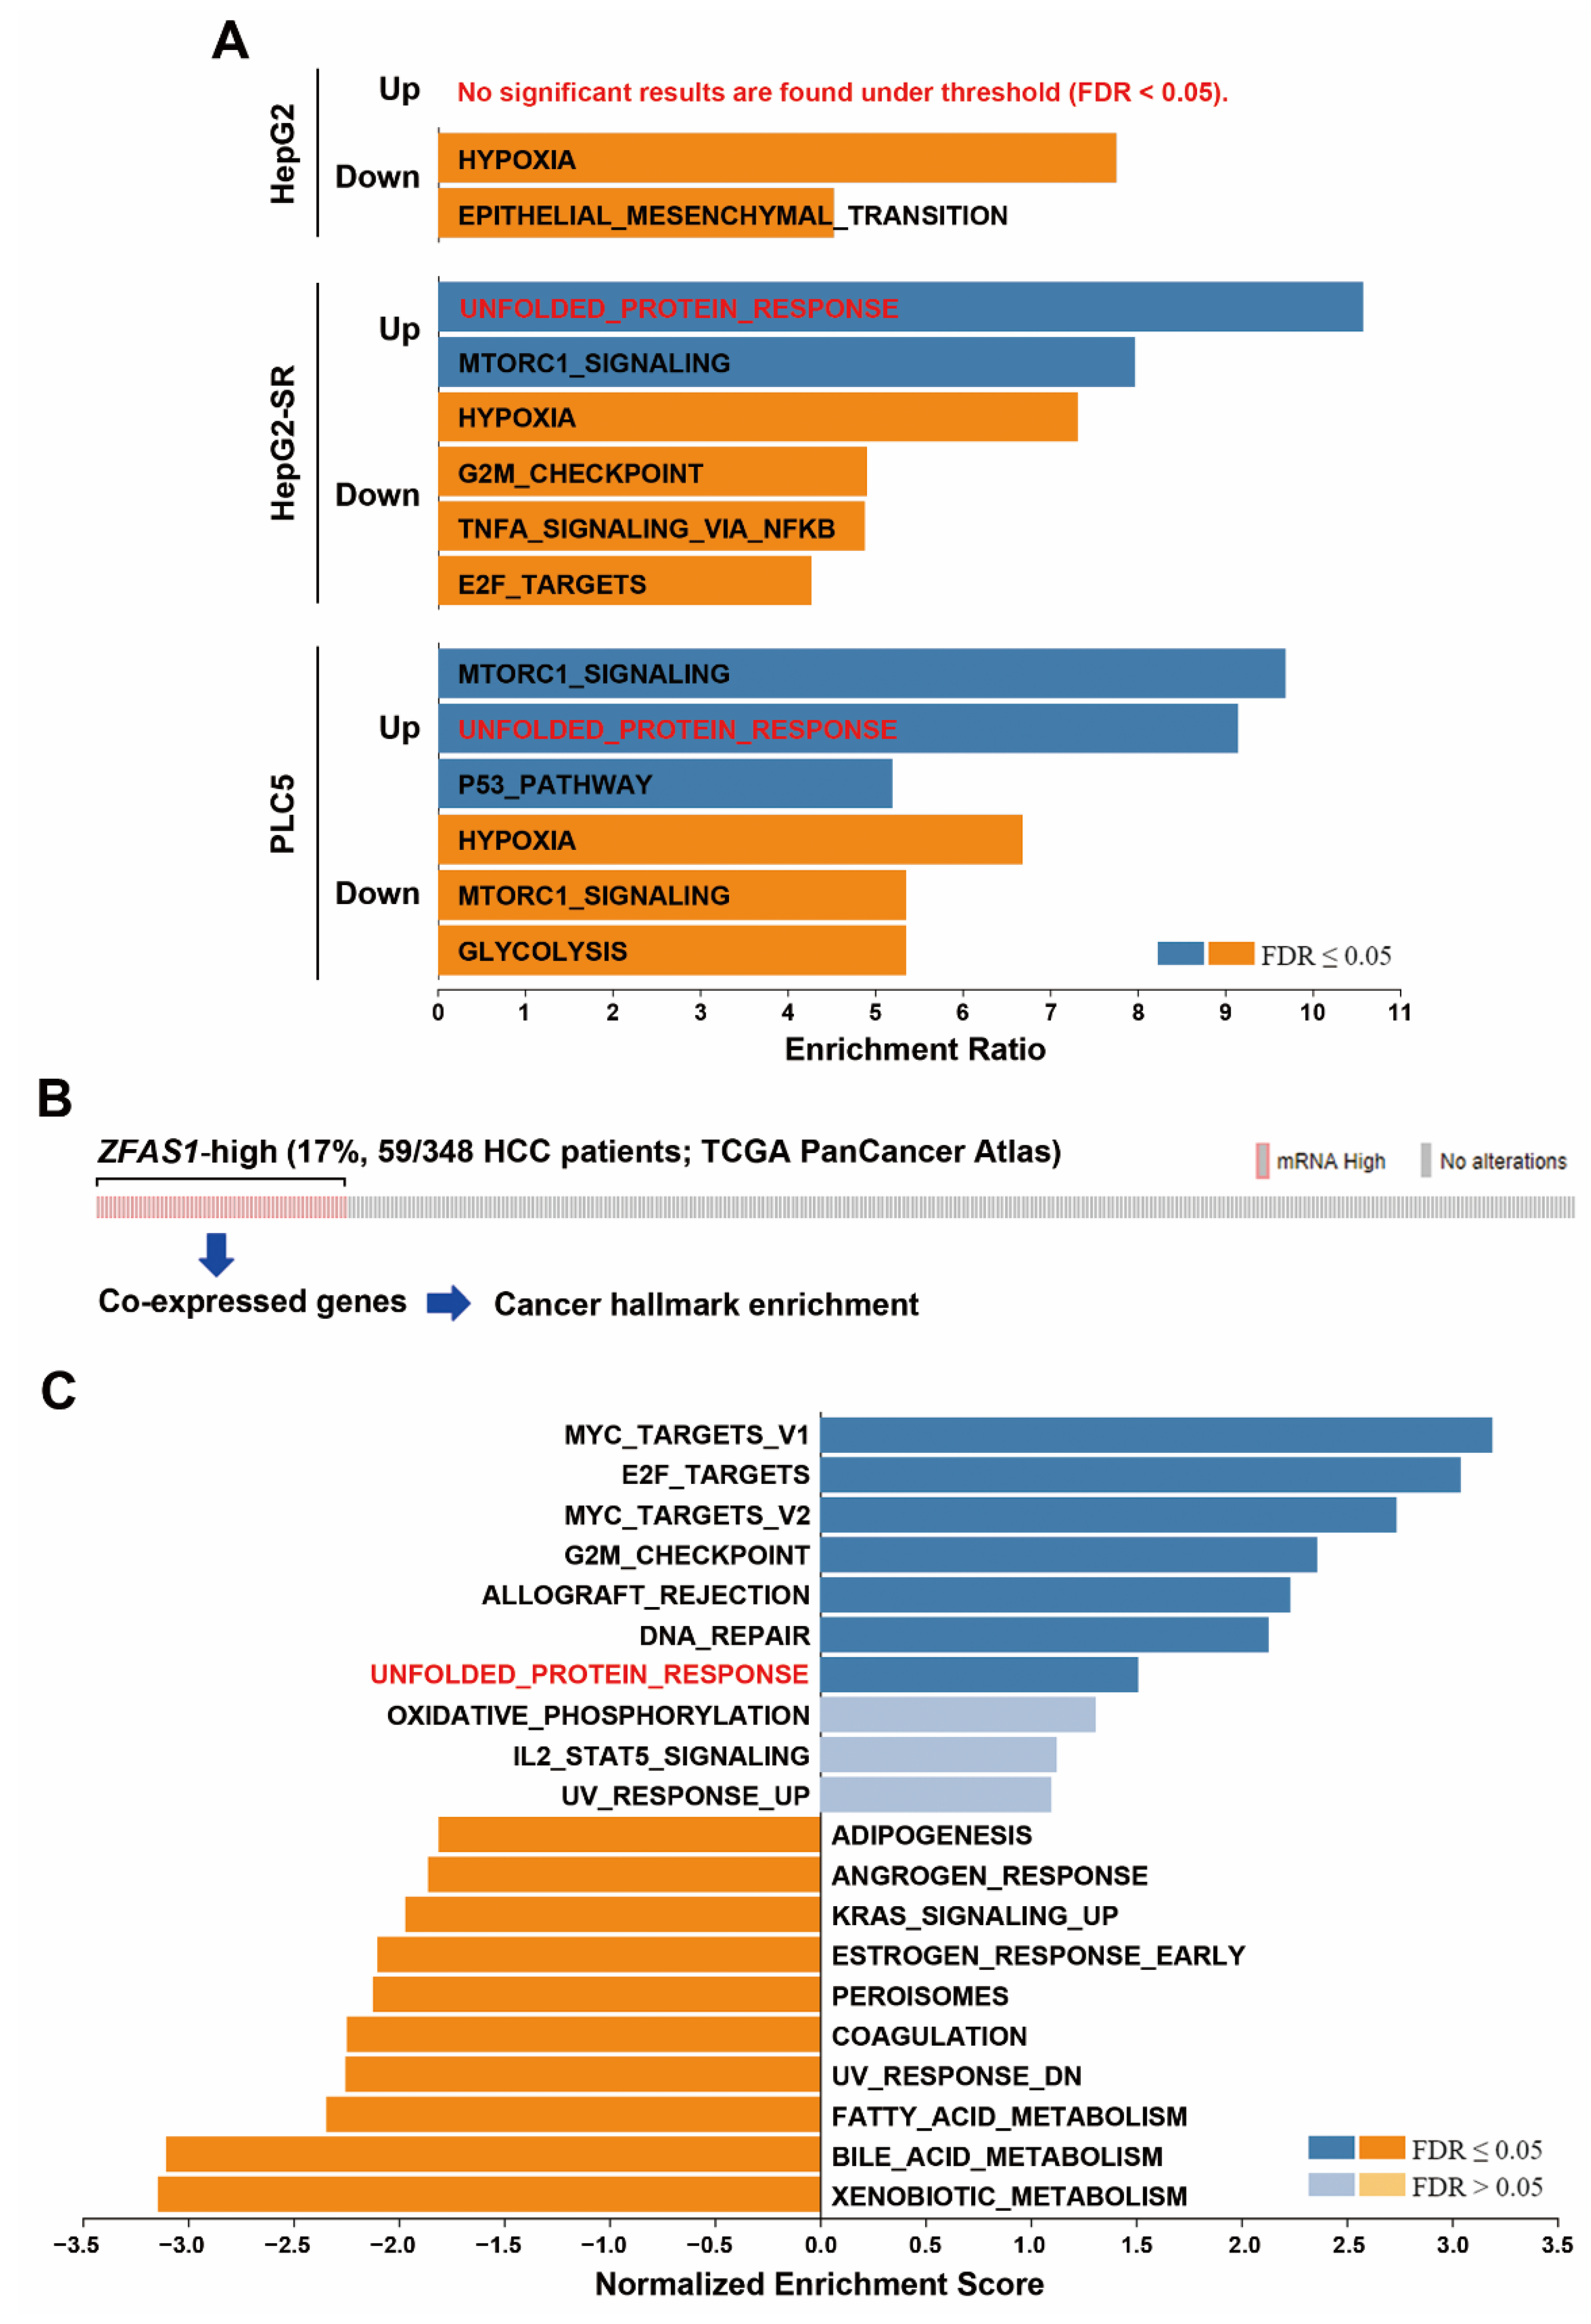
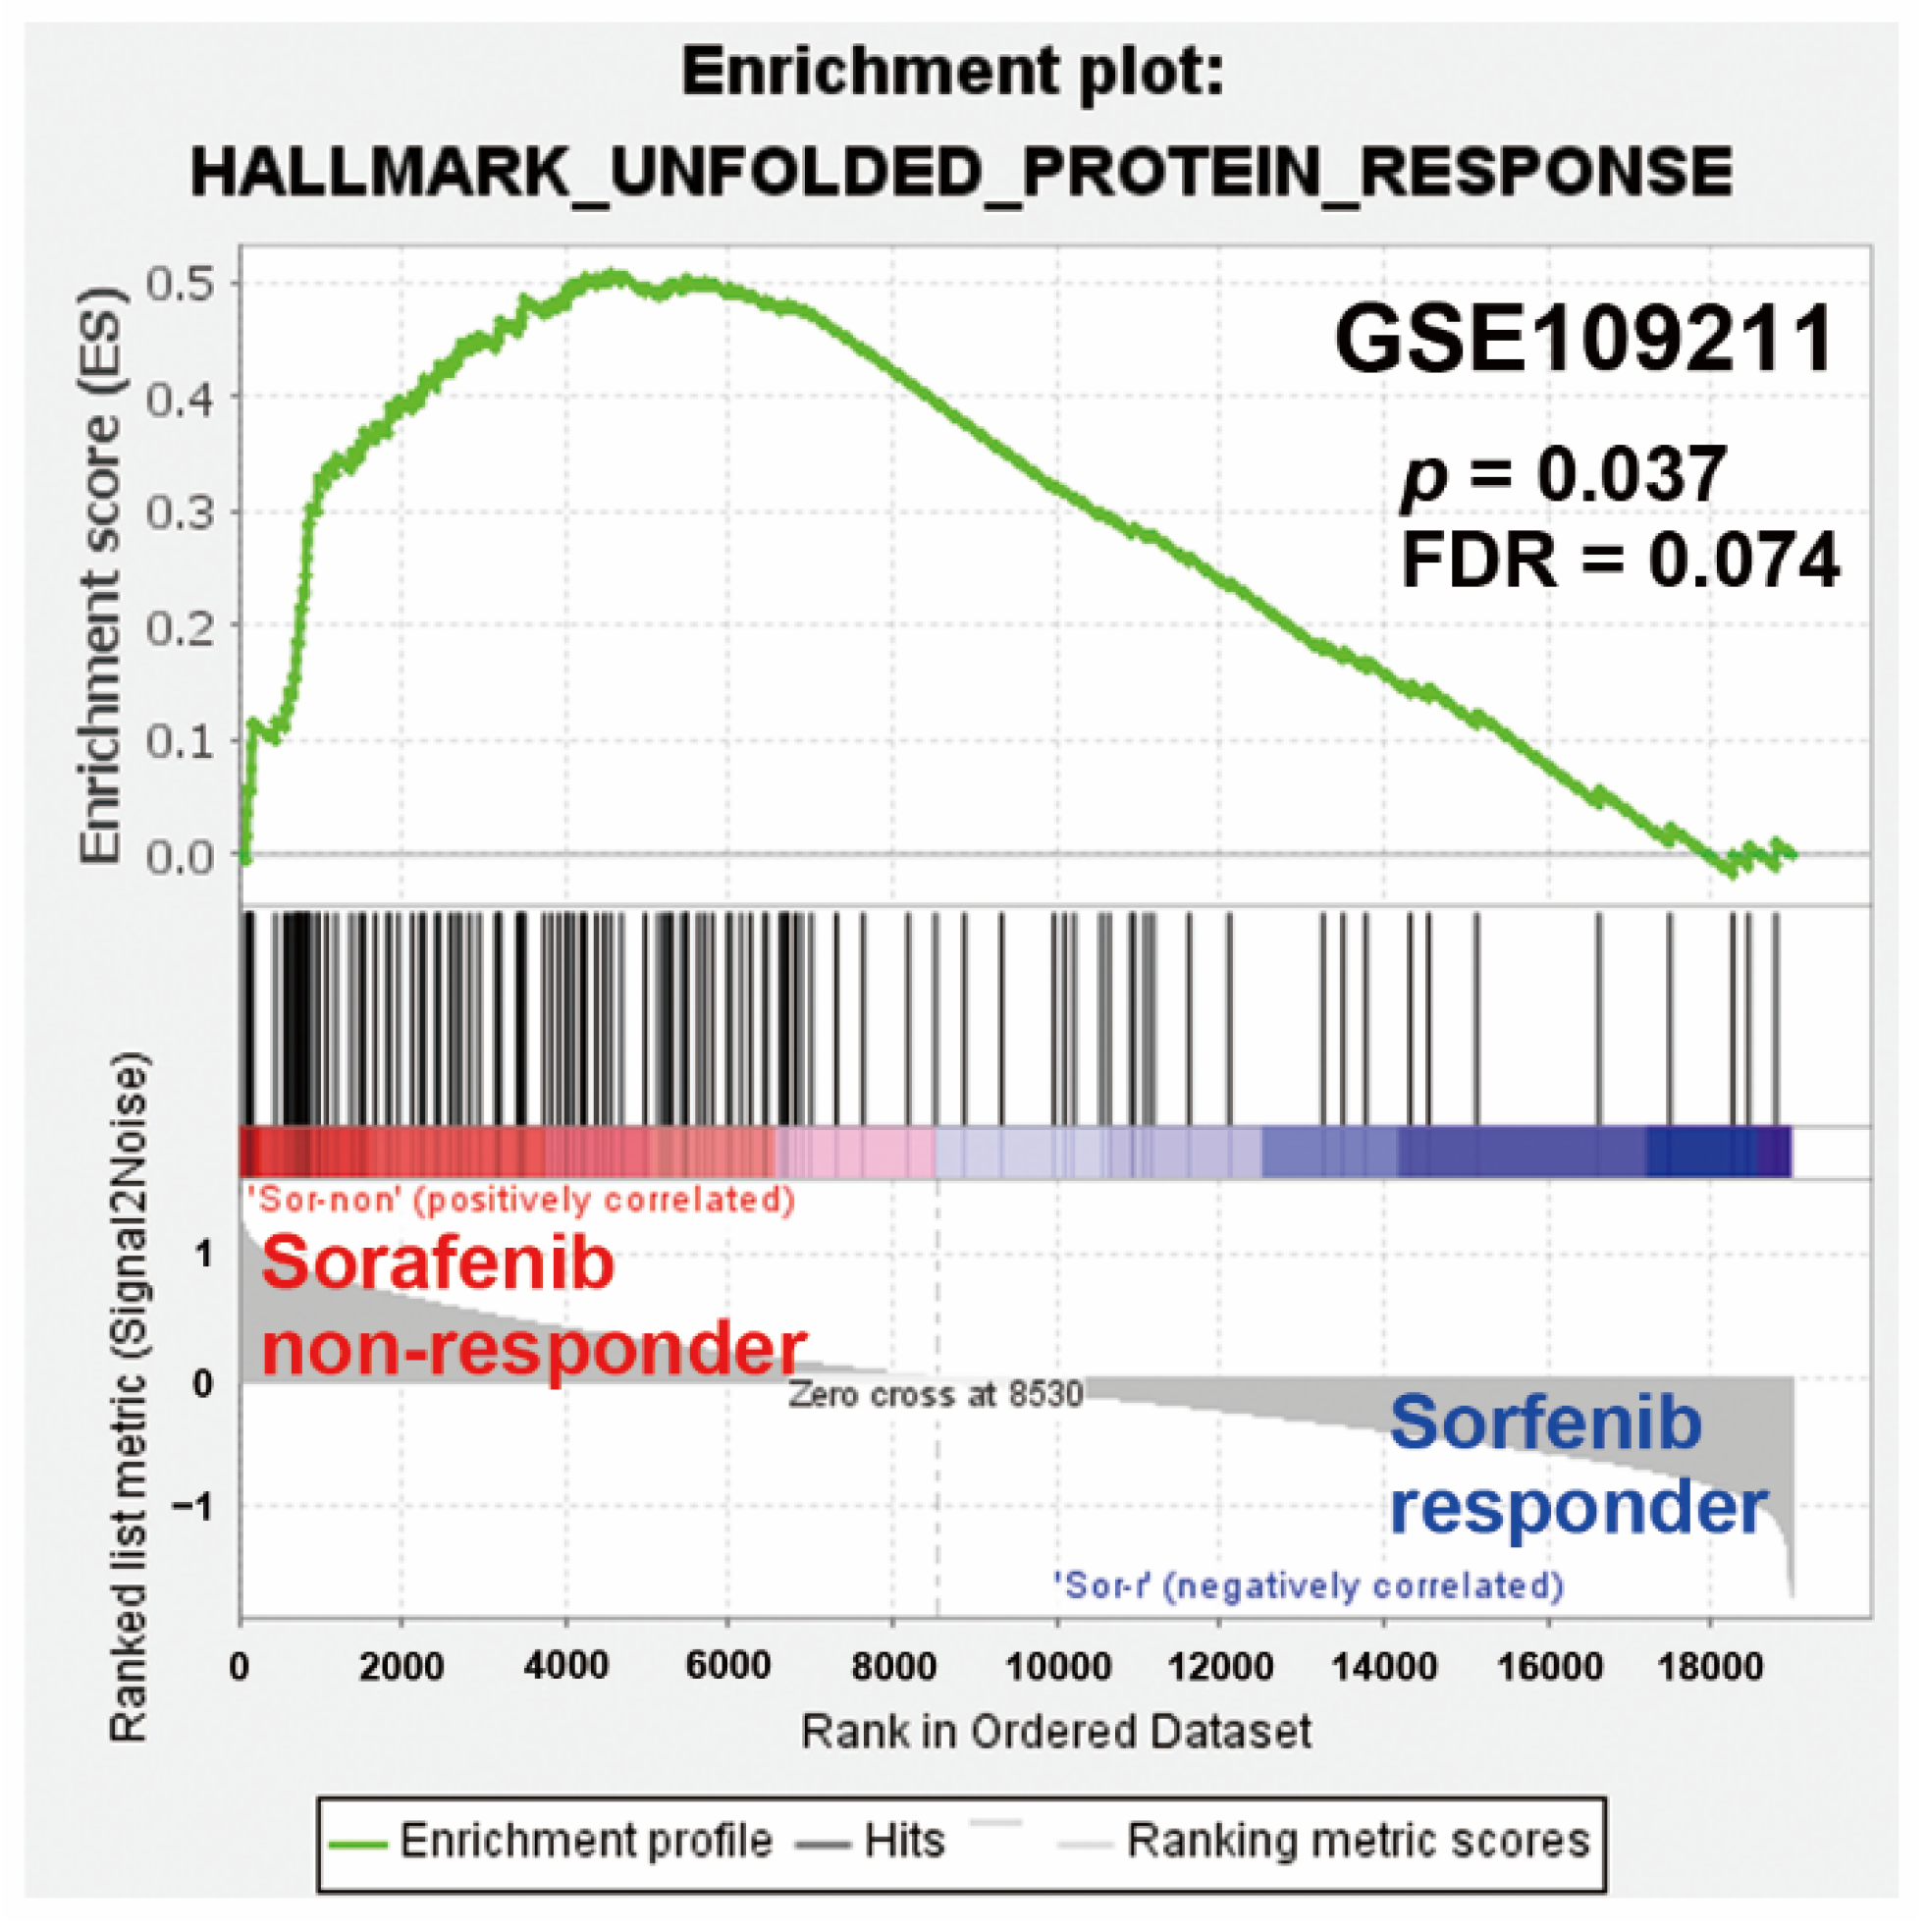
To identify the potential signaling pathways linking to the upregulation of ZFAS1 in response to sorafenib in sorafenib-resistant HCC cells, the RNA-sequencing data (Table S1) were further analyzed, using the WebGestalt for cancer hallmark enrichment [24,25]. As shown in Figure 5A, UPR and mTORC1 (mammalian target of rapamycin complex 1) signaling were two commonly enriched cancer hallmarks upregulated by sorafenib in HepG2-SR and PLC5 cells, implying their roles in sorafenib resistance. To further investigate the relationship of ZFAS1 with these cancer hallmarks, ZFAS1-high expressing HCC patients were selected from the TCGA-LIHC dataset (via the cBioPortal website [26,27]) to obtain the ZFAS1-associated over- and under-expressed genes. As shown in Figure 5B, 59 out of 348 (17%) HCC patients exhibited higher ZFAS1 expression. The ZFAS1-associated genes (Table S2) were also analyzed by the WebGestalt and it was found that UPR was one of the enriched cancer hallmarks (Figure 4C). Furthermore, like ZFAS1, UPR was also enriched in sorafenib non-responders (Figure 6). Therefore, ZFAS1 upregulation may be associated with ER stress/UPR in sorafenib-resistant HCC.

2.4. PERK/ATF4 Inhibitors Inhibits ZFAS1 Expression and Reverses Sorafenib Resistance

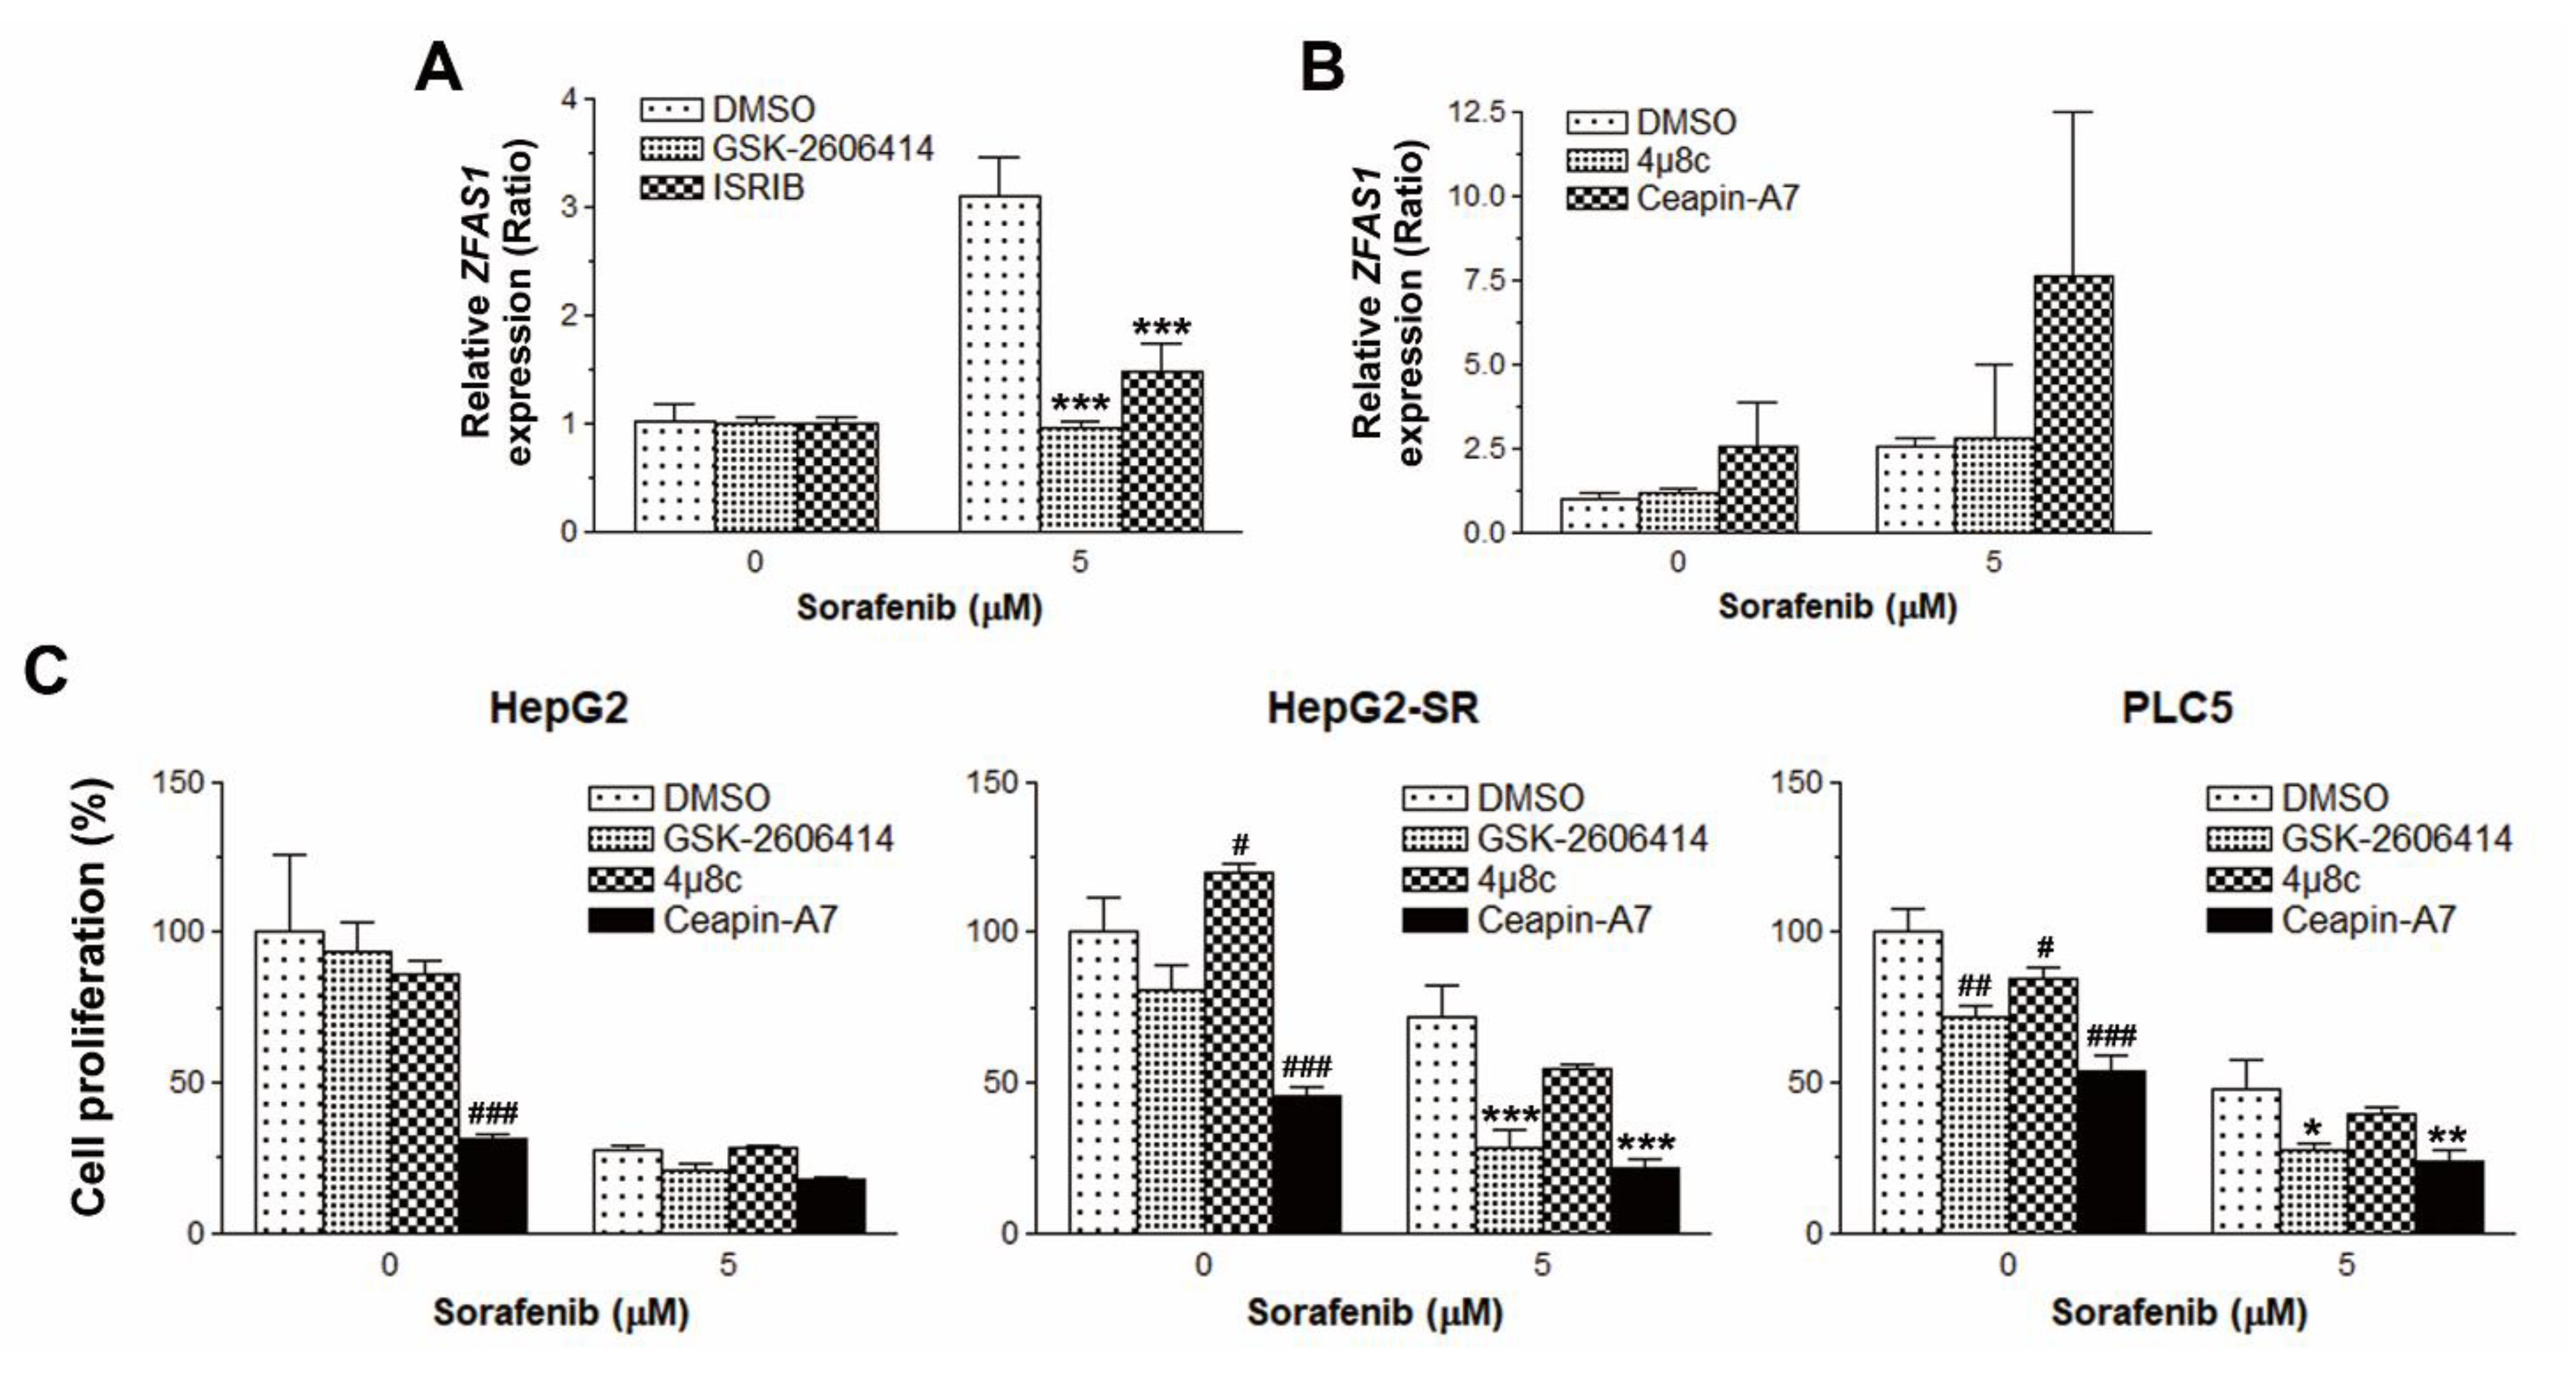
To investigate whether ER stress/UPR was responsible for the induction of ZFAS1 by sorafenib, chemical inhibitors of PERK (GSK-2606414), ATF4 (ISRIB), IRE1 (4μ8c), and ATF6 (Ceapin-A7) were used. As shown in Figure 7A,B, only GSK-2606414 and ISRIB could suppress sorafenib-induced ZFAS1 expression in PLC5 cells, suggesting that the PERK/ATF4 arm of UPR is responsible for the upregulation of ZFAS1 by sorafenib in sorafenib-resistant HCC cells. To ascertain the role of three arms of UPR in sorafenib resistance, HepG2, HepG2-SR, and PLC5 cells were pretreated with GSK-2606414, 4μ8c, and Ceapin-A7, and then exposed to sorafenib. The cell proliferation assay indicated that GSK-2606414 enhanced the anticancer activity of sorafenib in HepG2-SR and PLC5 cells (Figure 7C). Therefore, the PERK/ATF4 arm of UPR is responsible for sorafenib resistance in HCC cells.

3. Discussion

ER stress/UPR was identified to participate in hepatocarcinogenesis. The expression of GRP78 and ATF6 mRNAs and the splicing of XBP1 mRNA were elevated in HCC tissues with increased histological grading [28]. In a hepatitis B virus (HBV) surface antigen (HBsAg)-driven HCC model, prolonged ER stress leads to the accumulation of DNA damage in hepatocytes and promotes HCC incidence [29]. CHOP-knockout mice develop smaller tumor nodules, relative to wild-type mice, in a carcinogen-induced HCC model [30]. Tauroursodeoxycholic acid (TUDCA), a well-known chemical chaperone, retards Mst1/2 (macrophage-stimulating 1/2) mutant-driven liver tumorigenesis in mice [31]. Therefore, inhibition of ER stress/UPR may have clinical benefits for HCC.
It was found that sorafenib activates the PERK and IRE1 arms of UPR but inhibits the ATF6 arm in HCC cells [32,33]. However, the inhibitors of PERK (GSK-2606414) and IRE1 (4μ8c) had no or minimal inhibitory effect on the clonogenic growth of HCC cells exposed to sorafenib [34]. In another study, sorafenib activated three UPR arms and ER stress inhibitors, TUDCA and 4-phenylbutyrate (4-PBA), and enhanced sorafenib-induced apoptosis in HCC cells, suggesting a protective role of ER stress/UPR [35]. Moreover, it was characterized that sorafenib-induced IRE1 arm of UPR is responsible for the induction of autophagy that counteracts with sorafenib-induced ER stress-dependent apoptosis in HCC cells [36]. In addition, early induction of ER stress/UPR by sorafenib is correlated with the induction of pro-survival autophagy, whereas prolonged ER stress/UPR during sustained sorafenib treatment leads to the shift from autophagy to apoptosis in HCC cells [37]. Given the ambiguous role of ER stress/UPR in the sorafenib sensitivity of HCC cells, modulation of ER stress/UPR by genetic manipulation and pharmacological intervention can either sensitize or block the anticancer activity of sorafenib in HCC cells [35,38,39,40,41,42,43]. Therefore, the exact role of ER stress/UPR in sorafenib sensitivity of HCC warrants further investigations.
How ZFAS1 is transcriptionally regulated is still largely unclear. The only experimentally confirmed transcription factor binding site on the ZFAS1 promoter is the SP1 site [44,45]. In addition, there are two potential upstream transcription factor 1 (USF1)-binding sites on the ZFAS1 promoter, which was predicted in a previous study without any experimental evidence [46]. Therefore, more investigations are needed to understand how to regulate ZFAS1 gene transcription. Our results suggest that ZFAS1 may also be transcriptionally regulated by ATF4. Supportively, two potential ATF4-binding sites on ZFAS1 gene promoter were predicted using the JASPAR database (http://jaspar.genereg.net/, last accessed on 27 March 2021) [47] (Figure S1), which warrants further investigation.
One limitation in this study is that the RNA-sequencing data were obtained from two biological replicates, which may cause false-positive or false-negative results. It is proposed that at least 6 biological replicates should be used for RNA-sequencing experiments, and the numbers should be increased to 12 when identifying significant DEGs [48]. In contrast, according to the “ENCODE Experimental Guidelines for ENCODE3 RNA-seq” at https://www.encodeproject.org/about/experiment-guidelines/ (last accessed on 26 April 2021), two or more biological replicates should be performed for RNA-sequencing experiments. Although the RNA-sequencing experimental design in this study was not the most optimized, subsequent in vitro experiments could support the conclusion.
In conclusion, this study identifies ZFAS1 as a sorafenib-inducible lncRNA, specifically in sorafenib-resistant HCC cells. Mechanistically, sorafenib induces ZFAS1 via the activation of the PERK/ATF4 arm of UPR. Interestingly, inhibition of PERK/ATF4, but not ZFAS1, could overcome sorafenib resistance. Our results provide a molecular basis for using ZFAS1 as a therapeutic and prognostic biomarker to predict the clinical efficacy of sorafenib therapy in HCC. In addition, the inhibition of PERK/ATF4 may be an attractive strategy to overcome sorafenib resistance.

4. Materials and Methods

4.1. Chemicals and Reagents

The RNeasy Kit, RT2 First Strand Kit, RT2 SYBR Green ROX qPCR Mastermix, and RT2 lncRNA qPCR Assay for Human ZFAS1 were purchased from Qiagen (Valencia, CA, USA). The BrdU Cell Proliferation Assay Kit was purchased from BioVision (Mountain View, CA, USA). The sorafenib was purchased from LC Laboratories (Woburn, MA, USA). The GSK-2606414 was purchased from APExBIO (Boston, MA, USA). The trans-ISRIB was purchased from Tocris Bioscience (Ellisville, MO, USA). Ceapin-A7 and 4μ8c were purchased from Sigma-Aldrich (St. Louis, MO, USA). Silencer Select pre-designed siRNA for human ZFAS1, negative control siRNA, and RNAiMAX transfection reagent were purchased from Thermo Fisher Scientific (Wilmington, DE, USA).

4.2. Cell Culture and Cell Proliferation Assay

Human HCC cells, HepG2 and PLC/PRF/5 (PLC5), were purchased from the Bioresource Collection and Research Center (Hsinchu, Taiwan). The sorafenib-resistant HepG2 (HepG2-SR) cells were established in our previous study [21]. Cells were cultured in DMEM with the following supplements: 10% fetal bovine serum (FBS), 1% L-glutamine, 1 mM sodium pyruvate, and 1% antibiotic-antimycotic solution (100 units/mL penicillin, 100 µg/mL streptomycin, and 0.25 µg/mL of Gibco Amphotericin B). The cell proliferation was examined using the bromodeoxyuridine (BrdU) cell proliferation assay kit, which is based on the ability of proliferating cells to incorporate BrdU, the thymidine analog, into newly synthesized DNA strands.

4.3. RNA-Sequencing and Real-Time Quantitative Polymerase Chain Reaction (qPCR)

HepG2 and PLC5 cells were treated with 5 μM sorafenib for 24 h. Total RNA was isolated by the RNeasy Kit. The extracted RNA was quantified by the Nanodrop (Thermo Fisher Scientific, Wilmington, DE, USA) and the RNA quality was checked by the ratio of absorbance at 260 nm and 280 nm. Sequencing (two biological replicates) was performed using the BGISEQ-500 platform (Beijing Genomics Institute, Beijing, China) to averagely generate 23,568,563 clean reads. Gene expression levels were quantified by a software package called RSEM [49]. DEGs were screened using the NOISeq method [50] according to the following criteria: |fold-change| ≥ 2 and diverge probability ≥ 0.8. The full DEGs are shown in Table S1. The VENNY 2.1 online tool [51] was used to compare the overlapped genes and generate the Venn diagram. For the determination of ZFAS1 expression, the first-strand cDNA was synthesized using the RT2 First Strand Kit. Then, PCR amplification was performed in triplicate on the Applied Biosystems ABI 7500 Real-Time PCR System (Foster City, CA, USA), using the RT2 lncRNA qPCR Assay for human ZFAS1 gene and the RT2 SYBR Green ROX qPCR Mastermix for human 18S ribosomal (r)RNA (forward 5′-CGGCGACGACCCATTCGAAC-3′ and reverse 5′-GAATCGAACCCTGATTCCCCGTC-3′). No-revere transcription controls were included in each run to detect potential contamination. Gene expression fold-changes were calculated by the comparative CT method, using the 18S rRNA as the reference gene and untreated cells as the calibrator.

4.4. siRNA Knockdown Analysis

HepG2 and PLC5 cells were transfected with ZFAS1 siRNA and the negative control siRNA using RNAiMAX transfection reagent according to the manufacturer’s instruction. Twenty-four hours later, the transfection mixture was replaced with the regular medium, and cells were prepared for further experiments.

4.5. Bioinformatics Tools

The GEPIA (Gene Expression Profiling Interactive Analysis) database at the website (http://gepia2.cancer-pku.cn/ [22]) was used to compare the lncRNA levels in normal/cancer liver tissues and their impacts on cancer patients’ overall/disease-free survivals in TCGA-LIHC data set. The cBioPortal (http://www.cbioportal.org/ [25,26]) was used to obtain the over- and under-expressed genes (Table S2) associated with ZFAS1-high expressing patients in TCGA-LIHC (PanCancer Atlas) dataset. Genes in Tables S1 and S2 were subjected to cancer hallmark enrichment using the WebGestalt (WEB-based Gene SeT AnaLysis Toolkit; http://www.webgestalt.org/ [13,24]). The over-representation analysis (ORA) and gene set enrichment analysis (GSEA) approaches were used for analyzing sorafenib-induced DEGs (Table S1) and ZFAS1-associated genes (Table S2), respectively. The GSEA v3.0 software (http://www.broadinstitute.org/gsea/ [14,15]) was used for the enrichment of ZFAS1 and cancer hallmarks in an HCC patient cohort (GSE109211 [27]). The last accessed date for the above analyses was 23 March 2021.

4.6. Statistical Analysis

All in vitro experimental results (cell proliferation assay and qPCR) were represented by the mean ± standard deviation of at least three independent experiments. Statistical analysis was performed using a two-way analysis of variance (ANOVA) with the Bonferroni post-test. A p-value less than 0.05 was considered statistically significant.

Supplementary Materials

The following are available online at https://www.mdpi.com/article/10.3390/ijms22115848/s1.

Author Contributions

Conceptualization, T.-P.L. and P.-M.Y.; methodology, T.-P.L. and J.-C.L.; validation, T.-P.L. and J.-C.L.; formal analysis, T.-P.L. and J.-C.L.; investigation, T.-P.L. and J.-C.L.; resources, T.-P.L. and P.-M.Y.; data curation, P.-M.Y.; writing—original draft preparation, T.-P.L. and P.-M.Y.; writing—review and editing, T.-P.L. and P.-M.Y.; visualization, T.-P.L. and J.-C.L.; supervision, T.-P.L. and P.-M.Y.; project administration, T.-P.L. and P.-M.Y.; funding acquisition, T.-P.L. and P.-M.Y. All authors have read and agreed to the published version of the manuscript.

Funding

This research was funded by the Ministry of Science and Technology, grant numbers MOST109-2314-B-195-006, MOST109-2314-B-038-040; the Mackay Memorial Hospital, grant numbers MMH-108-086 and MMH110-09; the health and welfare surcharge of tobacco products (WanFang Hospital, Chi-Mei Medical Center, and Hualien Tzu-Chi Hospital Joing Cancer Center Grant-Focus on Colon Cancer Research), grant number MOHW110-TDU-B-212-144020.

Institutional Review Board Statement

Not applicable.

Informed Consent Statement

Not applicable.

Data Availability Statement

The datasets used in this article are publicly available as described in Materials and Methods.

Acknowledgments

This work was financially supported by the “TMU Research Center of Cancer Translational Medicine” from The Featured Areas Research Center Program within the framework of the Higher Education Sprout Project by the Ministry of Education (MOE) in Taiwan.

Conflicts of Interest

The authors declare no conflict of interest.

References

  1. Llovet, J.M.; Ricci, S.; Mazzaferro, V.; Hilgard, P.; Gane, E.; Blanc, J.F.; De Oliveira, A.C.; Santoro, A.; Raoul, J.L.; Forner, A.; et al. Sorafenib in Advanced Hepatocellular Carcinoma. N. Engl. J. Med. 2008, 359, 378–390. [Google Scholar] [CrossRef] [PubMed]
  2. Bruix, J.; Qin, S.; Merle, P.; Granito, A.; Huang, Y.-H.; Bodoky, G.; Pracht, M.; Yokosuka, O.; Rosmorduc, O.; Breder, V.; et al. Regorafenib for patients with hepatocellular carcinoma who progressed on sorafenib treatment (RESORCE): A randomised, double-blind, placebo-controlled, phase 3 trial. Lancet 2017, 389, 56–66. [Google Scholar] [CrossRef] [Green Version]
  3. Kudo, M.; Finn, R.S.; Qin, S.; Han, K.-H.; Ikeda, K.; Piscaglia, F.; Baron, A.; Park, J.-W.; Han, G.; Jassem, J.; et al. Lenvatinib versus sorafenib in first-line treatment of patients with unresectable hepatocellular carcinoma: A randomised phase 3 non-inferiority trial. Lancet 2018, 391, 1163–1173. [Google Scholar] [CrossRef] [Green Version]
  4. Abou-Alfa, G.K.; Meyer, T.; Cheng, A.-L.; El-Khoueiry, A.B.; Rimassa, L.; Ryoo, B.-Y.; Cicin, I.; Merle, P.; Chen, Y.; Park, J.-W.; et al. Cabozantinib in Patients with Advanced and Progressing Hepatocellular Carcinoma. N. Engl. J. Med. 2018, 379, 54–63. [Google Scholar] [CrossRef] [PubMed]
  5. Chen, J.; Jin, R.; Zhao, J.; Liu, J.; Ying, H.; Yan, H.; Zhou, S.; Liang, Y.; Huang, D.; Liang, X.; et al. Potential molecular, cellular and microenvironmental mechanism of sorafenib resistance in hepatocellular carcinoma. Cancer Lett. 2015, 367, 1–11. [Google Scholar] [CrossRef]
  6. Cheng, A.-L.; Kang, Y.-K.; Chen, Z.; Tsao, C.-J.; Qin, S.; Kim, J.S.; Luo, R.; Feng, J.; Ye, S.; Yang, T.-S.; et al. Efficacy and safety of sorafenib in patients in the Asia-Pacific region with advanced hepatocellular carcinoma: A phase III randomised, double-blind, placebo-controlled trial. Lancet Oncol. 2009, 10, 25–34. [Google Scholar] [CrossRef]
  7. Niu, L.; Liu, L.; Yang, S.; Ren, J.; Lai, P.B.S.; Chen, G.G. New insights into sorafenib resistance in hepatocellular carcinoma: Responsible mechanisms and promising strategies. Biochim. Biophys. Acta Rev. Cancer 2017, 1868, 564–570. [Google Scholar] [CrossRef]
  8. Kim, I.; Xu, W.; Reed, J.C. Cell death and endoplasmic reticulum stress: Disease relevance and therapeutic opportunities. Nat. Rev. Drug Discov. 2008, 7, 1013–1030. [Google Scholar] [CrossRef]
  9. Shore, G.C.; Papa, F.R.; Oakes, S.A. Signaling cell death from the endoplasmic reticulum stress response. Curr. Opin. Cell Biol. 2011, 23, 143–149. [Google Scholar] [CrossRef] [PubMed] [Green Version]
  10. Wu, J.; Kaufman, R.J. From acute ER stress to physiological roles of the Unfolded Protein Response. Cell Death Differ. 2006, 13, 374–384. [Google Scholar] [CrossRef]
  11. Li, J.; Ni, M.; Lee, B.; Barron, E.; Hinton, D.R.; Lee, A.S. The unfolded protein response regulator GRP78/BiP is required for endoplasmic reticulum integrity and stress-induced autophagy in mammalian cells. Cell Death Differ. 2008, 15, 1460–1471. [Google Scholar] [CrossRef]
  12. Schmitt, A.M.; Chang, H.Y. Long Noncoding RNAs in Cancer Pathways. Cancer Cell 2016, 29, 452–463. [Google Scholar] [CrossRef] [PubMed] [Green Version]
  13. Jin, W.; Chen, L.; Cai, X.; Zhang, Y.; Zhang, J.; Ma, D.; Cai, X.; Fu, T.; Yu, Z.; Yu, F.; et al. Long non-coding RNA TUC338 is functionally involved in sorafenib-sensitized hepatocarcinoma cells by targeting RASAL1. Oncol. Rep. 2017, 37, 273–280. [Google Scholar] [CrossRef] [PubMed] [Green Version]
  14. Xu, Z.; Yang, F.; Wei, D.; Liu, B.; Chen, C.; Bao, Y.; Wu, Z.; Wu, D.; Tan, H.; Li, J.; et al. Long noncoding RNA-SRLR elicits intrinsic sorafenib resistance via evoking IL-6/STAT3 axis in renal cell carcinoma. Oncogene 2016, 36, 1965–1977. [Google Scholar] [CrossRef] [PubMed]
  15. Askarian-Amiri, M.E.; Crawford, J.; French, J.D.; Smart, C.E.; Smith, M.A.; Clark, M.B.; Ru, K.; Mercer, T.R.; Thompson, E.R.; Lakhani, S.R.; et al. SNORD-host RNA Zfas1 is a regulator of mammary development and a potential marker for breast cancer. RNA 2011, 17, 878–891. [Google Scholar] [CrossRef] [PubMed] [Green Version]
  16. He, A.; He, S.; Li, X.; Zhou, L. ZFAS1: A novel vital oncogenic lncRNA in multiple human cancers. Cell Prolif. 2018, 52, e12513. [Google Scholar] [CrossRef] [PubMed] [Green Version]
  17. Li, T.; Xie, J.; Shen, C.; Cheng, D.; Shi, Y.; Wu, Z.; Deng, X.; Chen, H.; Shen, B.; Peng, C.; et al. Amplification of Long Noncoding RNA ZFAS1 Promotes Metastasis in Hepatocellular Carcinoma. Cancer Res. 2015, 75, 3181–3191. [Google Scholar] [CrossRef] [Green Version]
  18. Luo, P.; Liang, C.; Zhang, X.; Liu, X.; Wang, Y.; Wu, M.; Feng, X.; Tu, J. Identification of long non-coding RNA ZFAS1 as a novel biomarker for diagnosis of HCC. Biosci. Rep. 2018, 38, 38. [Google Scholar] [CrossRef] [Green Version]
  19. Tan, C.; Cao, J.; Chen, L.; Xi, X.; Wang, S.; Zhu, Y.; Yang, L.; Ma, L.; Wang, D.; Yin, J.; et al. Noncoding RNAs Serve as Diagnosis and Prognosis Biomarkers for Hepatocellular Carcinoma. Clin. Chem. 2019, 65, 905–915. [Google Scholar] [CrossRef]
  20. Shen, Y.-C.; Ou, D.-L.; Hsu, C.; Lin, K.-L.; Chang, C.-Y.; Lin, C.-Y.; Liu, S.-H.; Cheng, A.-L. Activating oxidative phosphorylation by a pyruvate dehydrogenase kinase inhibitor overcomes sorafenib resistance of hepatocellular carcinoma. Br. J. Cancer 2012, 108, 72–81. [Google Scholar] [CrossRef] [Green Version]
  21. Liu, T.-P.; Hong, Y.-H.; Yang, P.-M. In silico and in vitro identification of inhibitory activities of sorafenib on histone deacetylases in hepatocellular carcinoma cells. Oncotarget 2017, 8, 86168–86180. [Google Scholar] [CrossRef] [PubMed] [Green Version]
  22. Tang, Z.; Li, C.; Kang, B.; Gao, G.; Li, C.; Zhang, Z. GEPIA: A web server for cancer and normal gene expression profiling and interactive analyses. Nucleic Acids Res. 2017, 45, W98–W102. [Google Scholar] [CrossRef] [PubMed] [Green Version]
  23. Pinyol, R.; Montal, R.; Bassaganyas, L.; Sia, D.; Takayama, T.; Chau, G.-Y.; Mazzaferro, V.; Roayaie, S.; Lee, H.C.; Kokudo, N.; et al. Molecular predictors of prevention of recurrence in HCC with sorafenib as adjuvant treatment and prognostic factors in the phase 3 STORM trial. Gut 2019, 68, 1065–1075. [Google Scholar] [CrossRef] [Green Version]
  24. Liao, Y.; Wang, J.; Jaehnig, E.J.; Shi, Z.; Zhang, B. WebGestalt 2019: Gene set analysis toolkit with revamped UIs and APIs. Nucleic Acids Res. 2019, 47, W199–W205. [Google Scholar] [CrossRef] [Green Version]
  25. Liberzon, A.; Birger, C.; Thorvaldsdottir, H.; Ghandi, M.; Mesirov, J.P.; Tamayo, P. The Molecular Signatures Database (MSigDB) hallmark gene set collection. Cell Syst. 2015, 1, 417–425. [Google Scholar] [CrossRef] [Green Version]
  26. Cerami, E.; Gao, J.; Dogrusoz, U.; Gross, B.E.; Sumer, S.O.; Aksoy, B.A.; Jacobsen, A.; Byrne, C.J.; Heuer, M.L.; Larsson, E.; et al. The cBio Cancer Genomics Portal: An Open Platform for Exploring Multidimensional Cancer Genomics Data. Cancer Discov. 2012, 2, 401–404. [Google Scholar] [CrossRef] [Green Version]
  27. Gao, J.; Aksoy, B.A.; Dogrusoz, U.; Dresdner, G.; Gross, B.; Sumer, S.O.; Sun, Y.; Jacobsen, A.; Sinha, R.; Larsson, E.; et al. Integrative Analysis of Complex Cancer Genomics and Clinical Profiles Using the cBioPortal. Sci. Signal. 2013, 6, pl1. [Google Scholar] [CrossRef] [Green Version]
  28. Shuda, M.; Kondoh, N.; Imazeki, N.; Tanaka, K.; Okada, T.; Mori, K.; Hada, A.; Arai, M.; Wakatsuki, T.; Matsubara, O.; et al. Activation of the ATF6, XBP1 and grp78 genes in human hepatocellular carcinoma: A possible involvement of the ER stress pathway in hepatocarcinogenesis. J. Hepatol. 2003, 38, 605–614. [Google Scholar] [CrossRef]
  29. Sunami, Y.; Ringelhan, M.; Kokai, E.; Lu, M.; O’Connor, T.; Lorentzen, A.; Weber, A.; Rodewald, A.K.; Mullhaupt, B.; Terracciano, L.; et al. Canonical NF-kappaB signaling in hepatocytes acts as a tumor-suppressor in hepatitis B virus surface antigen-driven hepatocellular carcinoma by controlling the unfolded protein response. Hepatology 2016, 63, 1592–1607. [Google Scholar] [CrossRef]
  30. Scaiewicz, V.; Nahmias, A.; Chung, R.T.; Mueller, T.; Tirosh, B.; Shibolet, O. CCAAT/Enhancer-Binding Protein Homologous (CHOP) Protein Promotes Carcinogenesis in the DEN-Induced Hepatocellular Carcinoma Model. PLoS ONE 2013, 8, e81065. [Google Scholar] [CrossRef] [PubMed] [Green Version]
  31. Wu, H.; Wei, L.; Fan, F.; Ji, S.; Zhang, S.; Geng, J.; Hong, L.; Fan, X.; Chen, Q.; Tian, J.; et al. Integration of Hippo signalling and the unfolded protein response to restrain liver overgrowth and tumorigenesis. Nat. Commun. 2015, 6, 6239. [Google Scholar] [CrossRef] [Green Version]
  32. Yi, P.; Higa, A.; Taouji, S.; Bexiga, M.G.; Marza, E.; Arma, D.; Castain, C.; Le Bail, B.; Simpson, J.C.; Rosenbaum, J.; et al. Sorafenib-Mediated Targeting of the AAA+ ATPase p97/VCP Leads to Disruption of the Secretory Pathway, Endoplasmic Reticulum Stress, and Hepatocellular Cancer Cell Death. Mol. Cancer Ther. 2012, 11, 2610–2620. [Google Scholar] [CrossRef] [Green Version]
  33. Houessinon, A.; Gicquel, A.; Bochereau, F.; Louandre, C.; Nyga, R.; Godin, C.; Degonville, J.; Fournier, E.; Saidak, Z.; Drullion, C.; et al. Alpha-fetoprotein is a biomarker of unfolded protein response and altered proteostasis in hepatocellular carcinoma cells exposed to sorafenib. Cancer Lett. 2016, 370, 242–249. [Google Scholar] [CrossRef]
  34. Sauzay, C.; Louandre, C.; Bodeau, S.; Anglade, F.; Godin, C.; Saidak, Z.; Fontaine, J.-X.; Usureau, C.; Martin, N.; Molinie, R.; et al. Protein biosynthesis, a target of sorafenib, interferes with the unfolded protein response (UPR) and ferroptosis in hepatocellular carcinoma cells. Oncotarget 2018, 9, 8400–8414. [Google Scholar] [CrossRef] [PubMed] [Green Version]
  35. Zhou, B.; Lu, Q.; Liu, J.; Fan, L.; Wang, Y.; Wei, W.; Wang, H.; Sun, G. Melatonin Increases the Sensitivity of Hepatocellular Carcinoma to Sorafenib through the PERK-ATF4-Beclin1 Pathway. Int. J. Biol. Sci. 2019, 15, 1905–1920. [Google Scholar] [CrossRef] [PubMed] [Green Version]
  36. Shi, Y.-H.; Ding, Z.-B.; Zhou, J.; Hui, B.; Shi, G.-M.; Ke, A.-W.; Wang, X.-Y.; Dai, Z.; Peng, Y.-F.; Gu, C.-Y.; et al. Targeting autophagy enhances sorafenib lethality for hepatocellular carcinoma via ER stress-related apoptosis. Autophagy 2011, 7, 1159–1172. [Google Scholar] [CrossRef]
  37. Rodríguez-Hernández, M.A.; González, R.; De La, R.; Ángel, J.; Gallego, P.; Ordóñez, R.; Navarro-Villarán, E.; Contreras, L.; Rodríguez-Arribas, M.; González-Gallego, J.; et al. Molecular characterization of autophagic and apoptotic signaling induced by sorafenib in liver cancer cells. J. Cell. Physiol. 2018, 234, 692–708. [Google Scholar] [CrossRef] [Green Version]
  38. Ma, M.K.F.; Lau, E.Y.T.; Leung, D.H.W.; Lo, J.; Ho, N.P.Y.; Cheng, L.K.W.; Ma, S.; Lin, C.H.; Copland, J.A.; Ding, J.; et al. Stearoyl-CoA desaturase regulates sorafenib resistance via modulation of ER stress-induced differentiation. J. Hepatol. 2017, 67, 979–990. [Google Scholar] [CrossRef] [Green Version]
  39. Machihara, K.; Tanaka, H.; Hayashi, Y.; Murakami, I.; Namba, T. Questiomycin A stimulates sorafenib-induced cell death via suppression of glucose-regulated protein 78. Biochem. Biophys. Res. Commun. 2017, 492, 33–40. [Google Scholar] [CrossRef]
  40. Yang, N.; Fu, Y.; Zhang, H.; Sima, H.; Zhu, N.; Yang, G. LincRNA-p21 activates endoplasmic reticulum stress and inhibits hepatocellular carcinoma. Oncotarget 2015, 6, 28151–28163. [Google Scholar] [PubMed] [Green Version]
  41. Zhai, B.; Hu, F.; Yan, H.; Zhao, D.; Jin, X.; Fang, T.; Pan, S.; Sun, X.; Xu, L. Bufalin Reverses Resistance to Sorafenib by Inhibiting Akt Activation in Hepatocellular Carcinoma: The Role of Endoplasmic Reticulum Stress. PLoS ONE 2015, 10, e0138485. [Google Scholar] [CrossRef]
  42. Zhong, J.; Xiu, P.; Dong, X.; Wang, F.; Wei, H.; Wang, X.; Xu, Z.; Liu, F.; Li, T.; Wang, Y.; et al. Meloxicam combined with sorafenib synergistically inhibits tumor growth of human hepatocellular carcinoma cells via ER stress-related apoptosis. Oncol. Rep. 2015, 34, 2142–2150. [Google Scholar] [CrossRef] [Green Version]
  43. Zhou, T.; Lv, X.; Guo, X.; Ruan, B.; Liu, D.; Ding, R.; Gao, Y.; Ding, J.; Dou, K.; Chen, Y. RACK1 modulates apoptosis induced by sorafenib in HCC cells by interfering with the IRE1/XBP1 axis. Oncol. Rep. 2015, 33, 3006–3014. [Google Scholar] [CrossRef] [PubMed] [Green Version]
  44. Liu, G.; Wang, L.; Han, H.; Li, Y.; Lu, S.; Li, T.; Cheng, C. LncRNA ZFAS1 promotes growth and metastasis by regulating BMI1 and ZEB2 in osteosarcoma. Am. J. Cancer Res. 2017, 7, 1450–1462. [Google Scholar] [PubMed]
  45. Chen, X.; Zeng, K.; Xu, M.; Hu, X.; Liu, X.; Xu, T.; He, B.; Pan, Y.; Sun, H.; Wang, S. SP1-induced lncRNA-ZFAS1 contributes to colorectal cancer progression via the miR-150-5p/VEGFA axis. Cell Death Dis. 2018, 9, 982. [Google Scholar] [CrossRef] [PubMed]
  46. Li, Z.; Jiang, X.; Huang, L.; Li, J.; Ji, D.; Xu, Y.; Leng, K.; Cui, Y. Up-regulation of ZFAS1 indicates dismal prognosis for cholangiocarcinoma and promotes proliferation and metastasis by modulating USF1 via miR-296-5p. J. Cell. Mol. Med. 2019, 23, 8258–8268. [Google Scholar] [CrossRef]
  47. Fornes, O.; Castro-Mondragon, J.A.; Khan, A.; Van Der Lee, R.; Zhang, X.; Richmond, P.A.; Modi, B.P.; Correard, S.; Gheorghe, M.; Baranašić, D.; et al. JASPAR 2020: Update of the open-access database of transcription factor binding profiles. Nucleic Acids Res. 2019, 48, D87–D92. [Google Scholar] [CrossRef]
  48. Schurch, N.J.; Schofield, P.; Gierliński, M.; Cole, C.; Sherstnev, A.; Singh, V.; Wrobel, N.; Gharbi, K.; Simpson, G.G.; Owen-Hughes, T.; et al. How many biological replicates are needed in an RNA-seq experiment and which differential expression tool should you use? RNA 2016, 22, 839–851. [Google Scholar] [CrossRef] [Green Version]
  49. Li, B.; Dewey, C.N. RSEM: Accurate transcript quantification from RNA-Seq data with or without a reference genome. BMC Bioinform. 2011, 12, 323. [Google Scholar] [CrossRef] [Green Version]
  50. Tarazona, S.; García-Alcalde, F.; Dopazo, J.; Ferrer, A.; Conesa, A. Differential expression in RNA-seq: A matter of depth. Genome Res. 2011, 21, 2213–2223. [Google Scholar] [CrossRef] [Green Version]
  51. NBSP; Oliveros, J.C. VENNY. An Interactive Tool for Comparing Lists with Venn Diagrams. 2007. Available online: http://bioinfogp.cnb.csic.es/tools/venny/index.html (accessed on 20 November 2013).
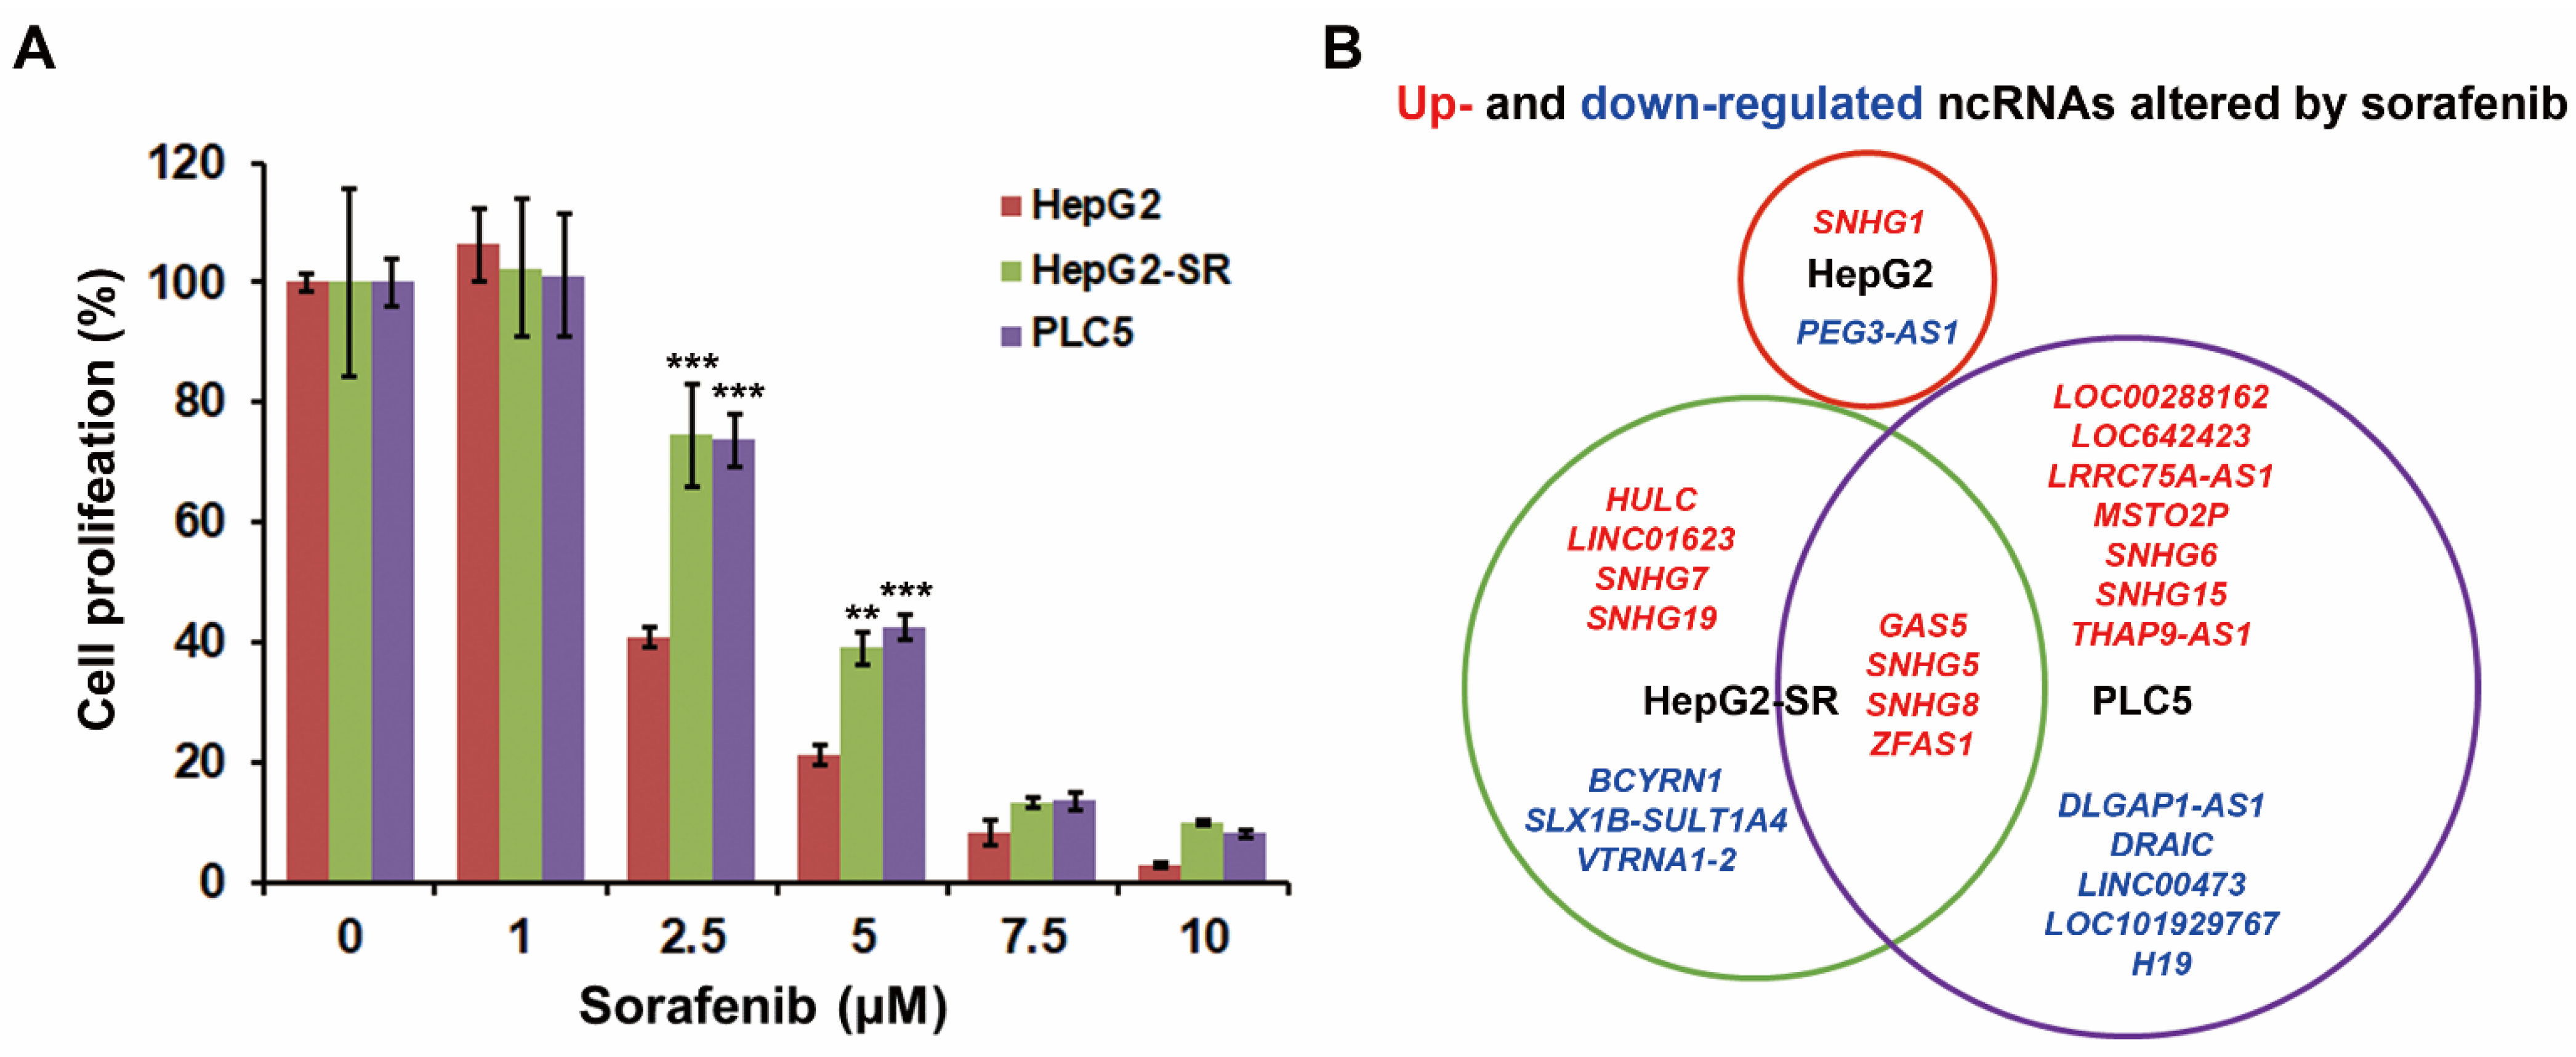
Figure 1. Identification of sorafenib-induced lncRNAs in sorafenib-resistant HCC cells. (A) HepG2, HepG2-SR, and PLC5 cells were treated with 0–10 μM sorafenib for 48 h. The cell proliferation was examined by BrdU incorporation assay. ** p < 0.01 and *** p < 0.001 indicated the statistically significant difference compared to sorafenib-treated HepG2 cells. (B) HepG2, HepG2-SR, and PLC5 cells were treated with 5 μM sorafenib for 24 h. Total RNAs were subjected to RNA-sequencing. The altered lncRNAs were shown as a Venn diagram. Genes in red or blue indicated that they were upregulated or downregulated by sorafenib, respectively.
Ijms 22 05848 g001
Figure 2. The expression of lncRNAs in HCC. The expressions of ZFAS1 (A), GAS5 (B), SNHG5 (C), and SNHG8 (D) in normal and cancer tissues (left part), and during tumor stage (right part) in HCC patients were obtained from the GEPIA database. * p < 0.05 indicated the statistically significant difference compared to the normal group.
Ijms 22 05848 g002
Figure 3. The prognostic values of lncRNAs in HCC. The Kaplan–Meier plots for the relationship between lncRNA expression and overall/disease-free survivals were generated from the GEPIA database. The group cut-off value was set as “quartile”.
Ijms 22 05848 g003
Figure 4. The effect of ZFAS1 knockdown on sorafenib resistance in HCC cells. (A) HepG2, HepG2-SR, and PLC5 cells were treated with 5 μM sorafenib for 18 h, and then ZFAS1 expression was analyzed by real-time qPCR. *** p < 0.001 indicated the statistically significant difference between sorafenib-treated and untreated cells. (B,C) HepG2, HepG2-SR, and PLC5 cells were transfected with si-ZFAS1 or its negative control siRNA (si-Cont) for 24 h, and then ZFAS1 expression was analyzed by real-time qPCR (B). The transfected cells were treated with 5 μM sorafenib for 48 h. The cell proliferation was examined by BrdU incorporation assay (C). * p < 0.05 and ** p < 0.01 indicated the statistically significant difference between sorafenib-treated and untreated cells. # p < 0.05 and ## p < 0.01 indicated the statistically significant difference between si-Cont and si-ZFAS1-transfected cells. (D) The ZFAS1 mRNA expression levels in sorafenib responsive and non-responsive HCC patients were obtained from the microarray data set (GSE109211). *** p < 0.001 indicated the statistically significant difference between sorafenib responders and non-responders.
Ijms 22 05848 g004
Figure 5. Pathway enrichment for ZFAS1-associated cancer hallmark. (A) The RNA-sequencing data in Table S1 were analyzed using the WebGestalt for cancer hallmark analysis. (B) The OncoPrint for ZFAS1 mRNA expression in TCGA-LIHC dataset. (C) The over- and under-expressed genes in ZFAS1-high expressing HCC patients were obtained from the cBioPortal website and these genes were analyzed using the WebGestalt for cancer hallmark analysis.
Ijms 22 05848 g005
Figure 6. GSEA for UPR genes in HCC patients receiving sorafenib therapy. The microarray dataset (GSE109211) of sorafenib responsive and non-responsive HCC patients were analyzed by GSEA for the enrichment of the UPR cancer hallmark.
Ijms 22 05848 g006
Figure 7. The effect of UPR inhibitors on sorafenib-induced ZFAS1. (A,B) PLC5 cells were pretreated with 10 μM GSK-2606414, 0.2 μM ISRIB, 10 μM 4μ8C, or 10 μM Ceapin-A7 for 0.5 h, and then exposed to 5 μM sorafenib for 18 h. ZFAS1 expression was analyzed by real-time qPCR. *** p < 0.001 indicated the statistically significant difference between sorafenib-treated and UPR inhibitor/sorafenib-treated cells. (C) HepG2, HepG2-SR, and PLC5 cells were treated with 5 μM sorafenib for 48 h in the absence or presence of 10 μM GSK-2606414, 10 μM 4μ8C, or 5 μM Ceapin-A7. The cell proliferation was examined by BrdU incorporation assay. # p < 0.05, ## p < 0.01, and ### p < 0.001 indicated the statistically significant difference between untreated and UPR inhibitor-treated cells. * p < 0.05, ** p < 0.01, and *** p < 0.001 indicated the statistically significant difference between sorafenib-treated and UPR inhibitor/sorafenib-treated cells.
Ijms 22 05848 g007
Publisher’s Note: MDPI stays neutral with regard to jurisdictional claims in published maps and institutional affiliations.