
FLTX2: A Novel Tamoxifen Derivative Endowed with Antiestrogenic, Fluorescent, and Photosensitizer Properties

 ,
,  ,
, 
 ,
,  and
and 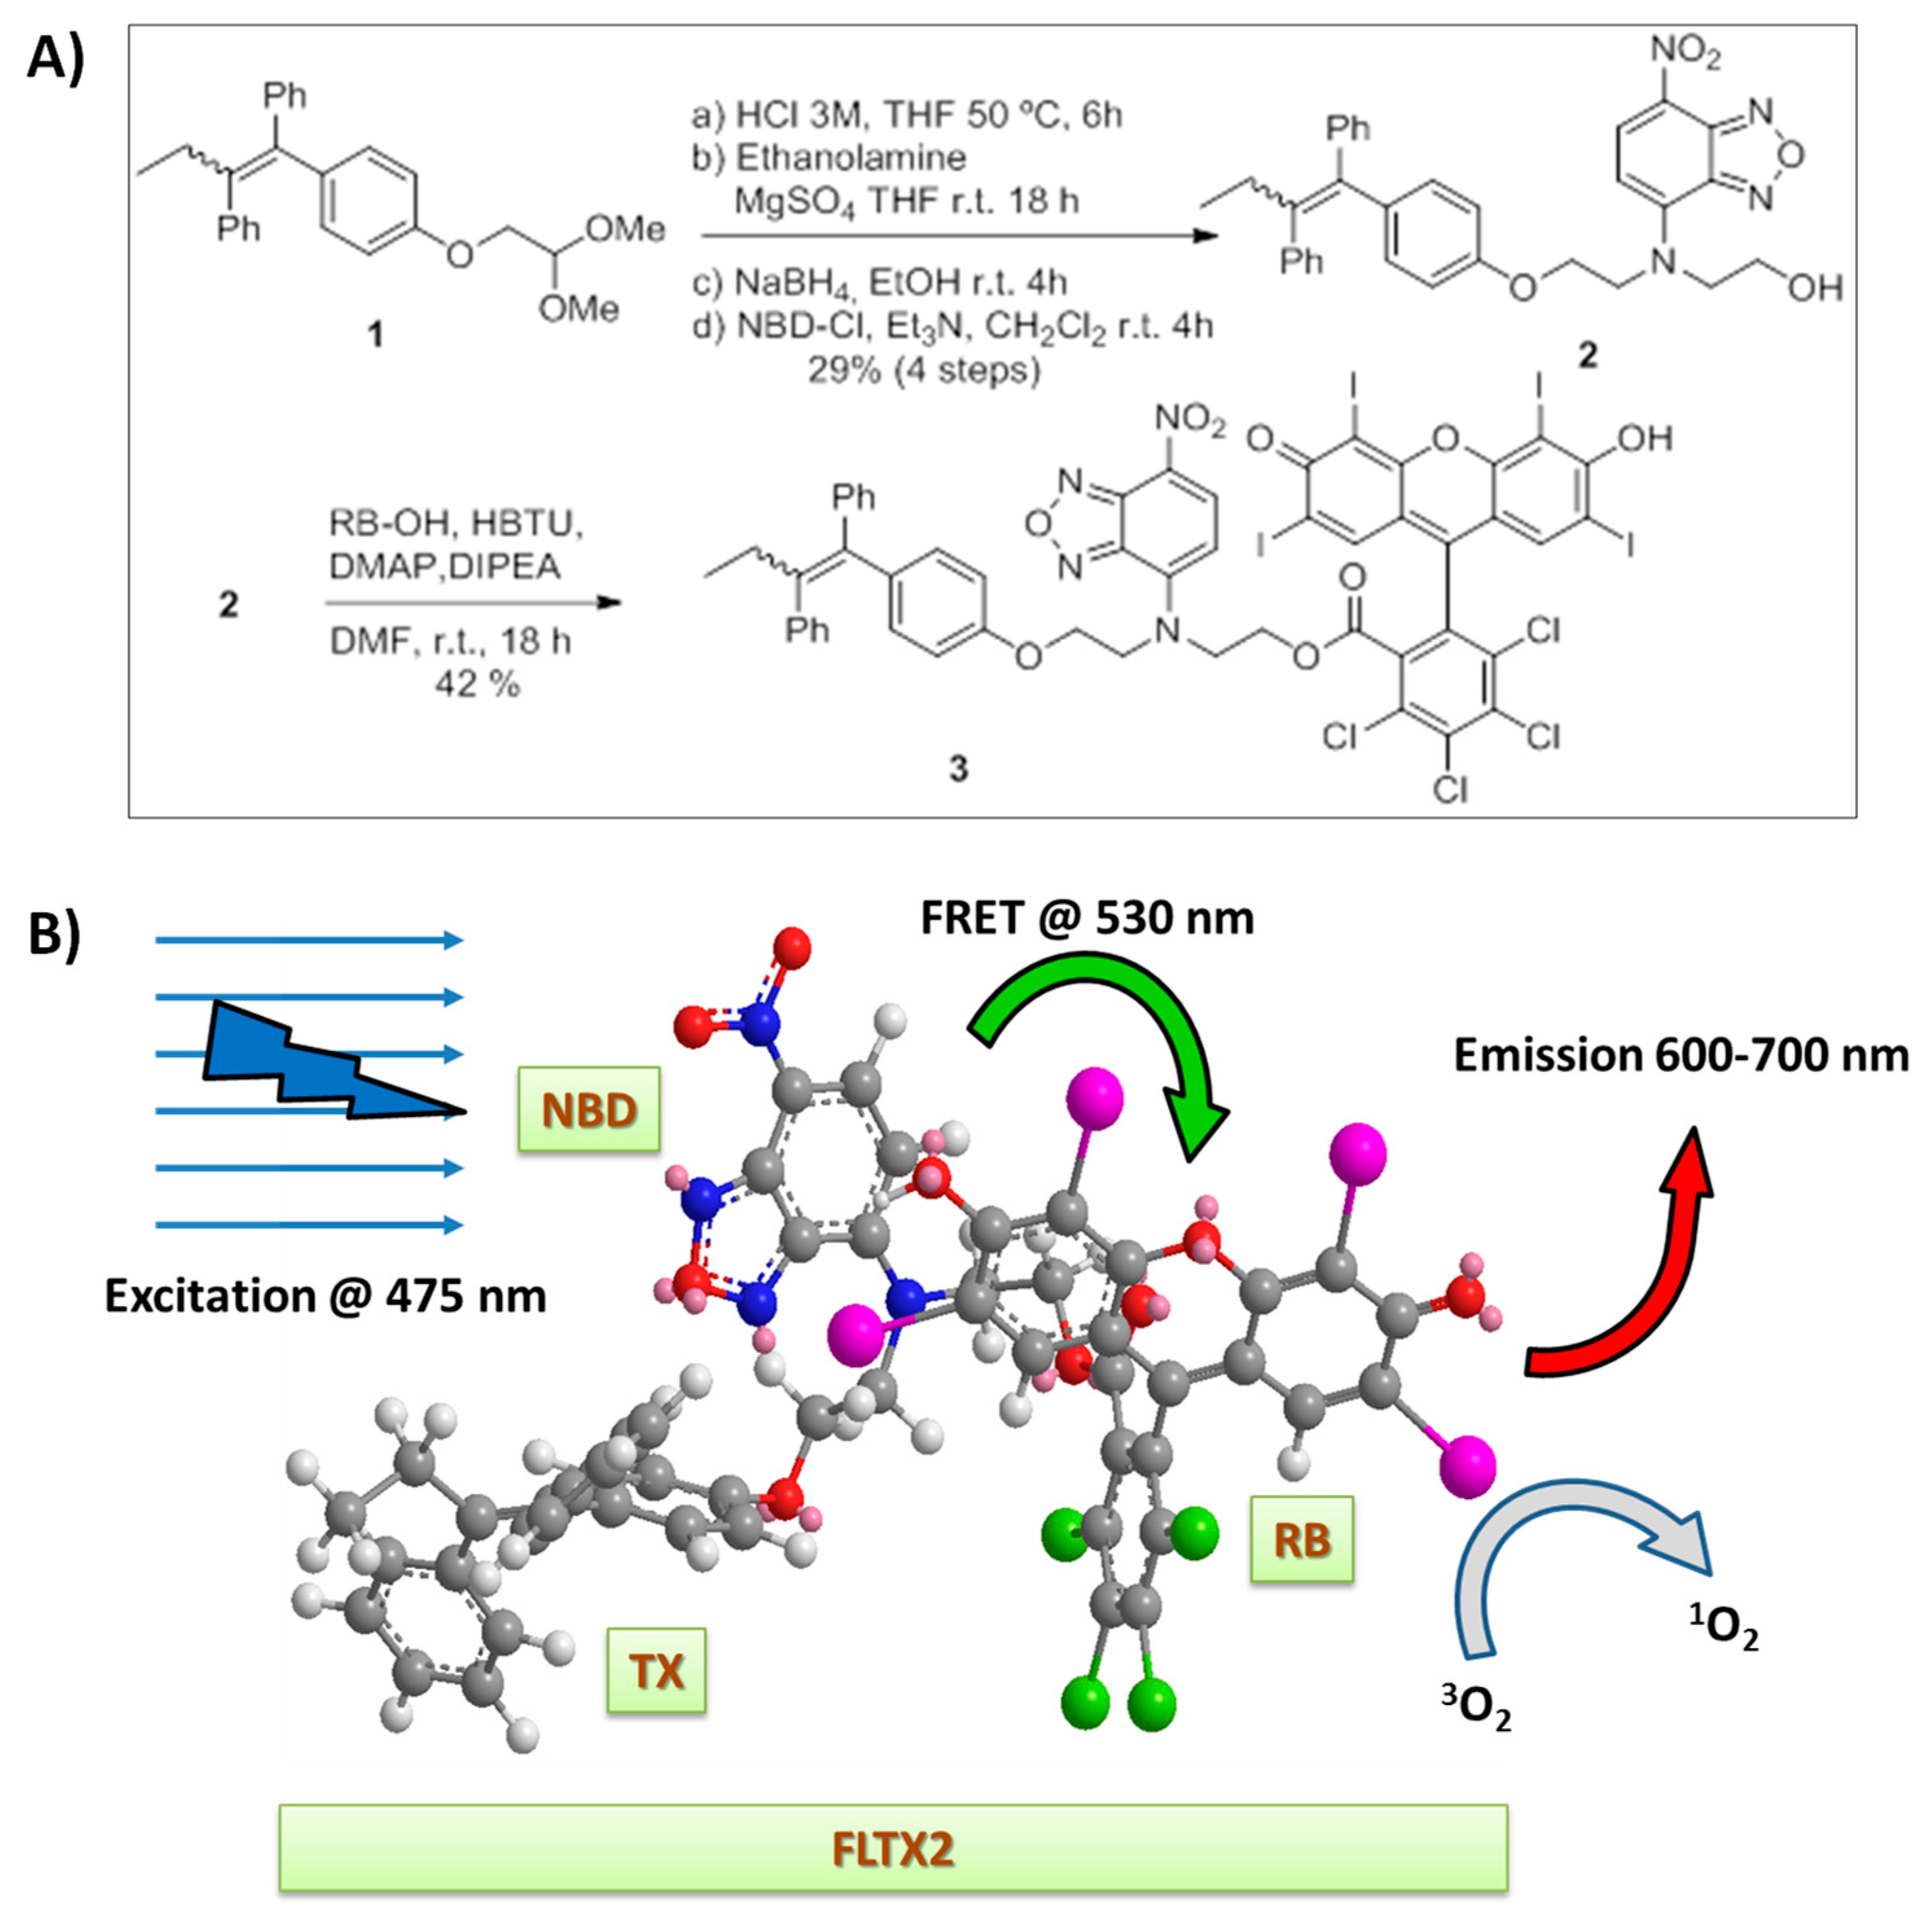
Abstract
1. Introduction
2. Results and Discussion
2.1. Synthesis of FLTX2 (FLTX1-RB)
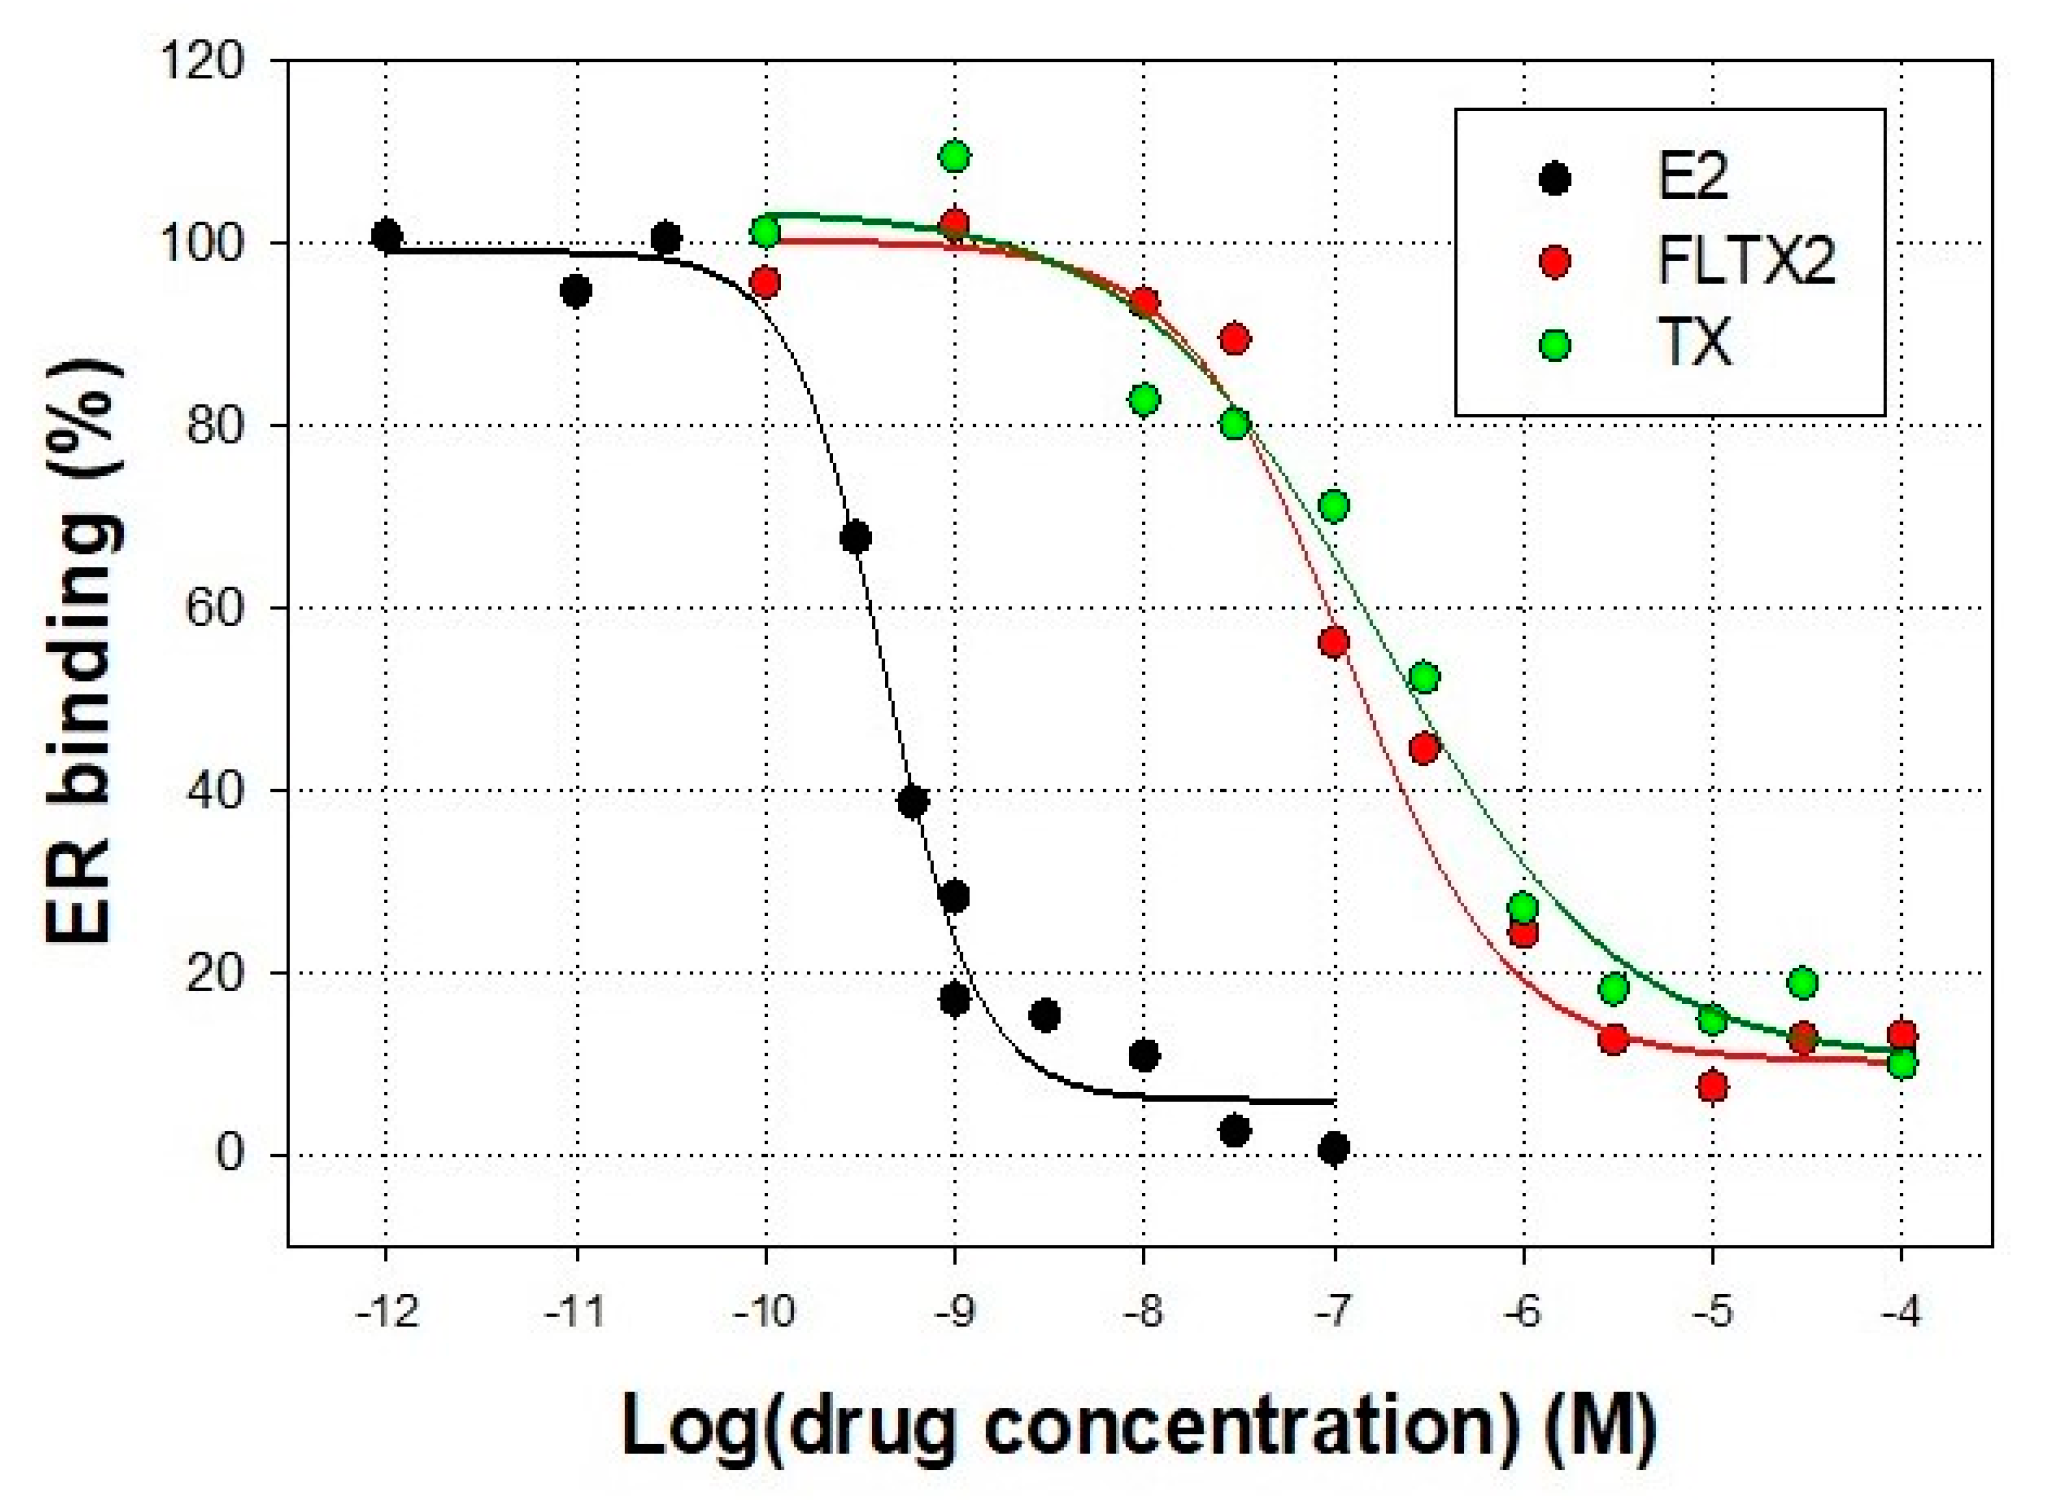
2.2. Affinity Studies of FLTX2 on ER. Comparison with FLTX1
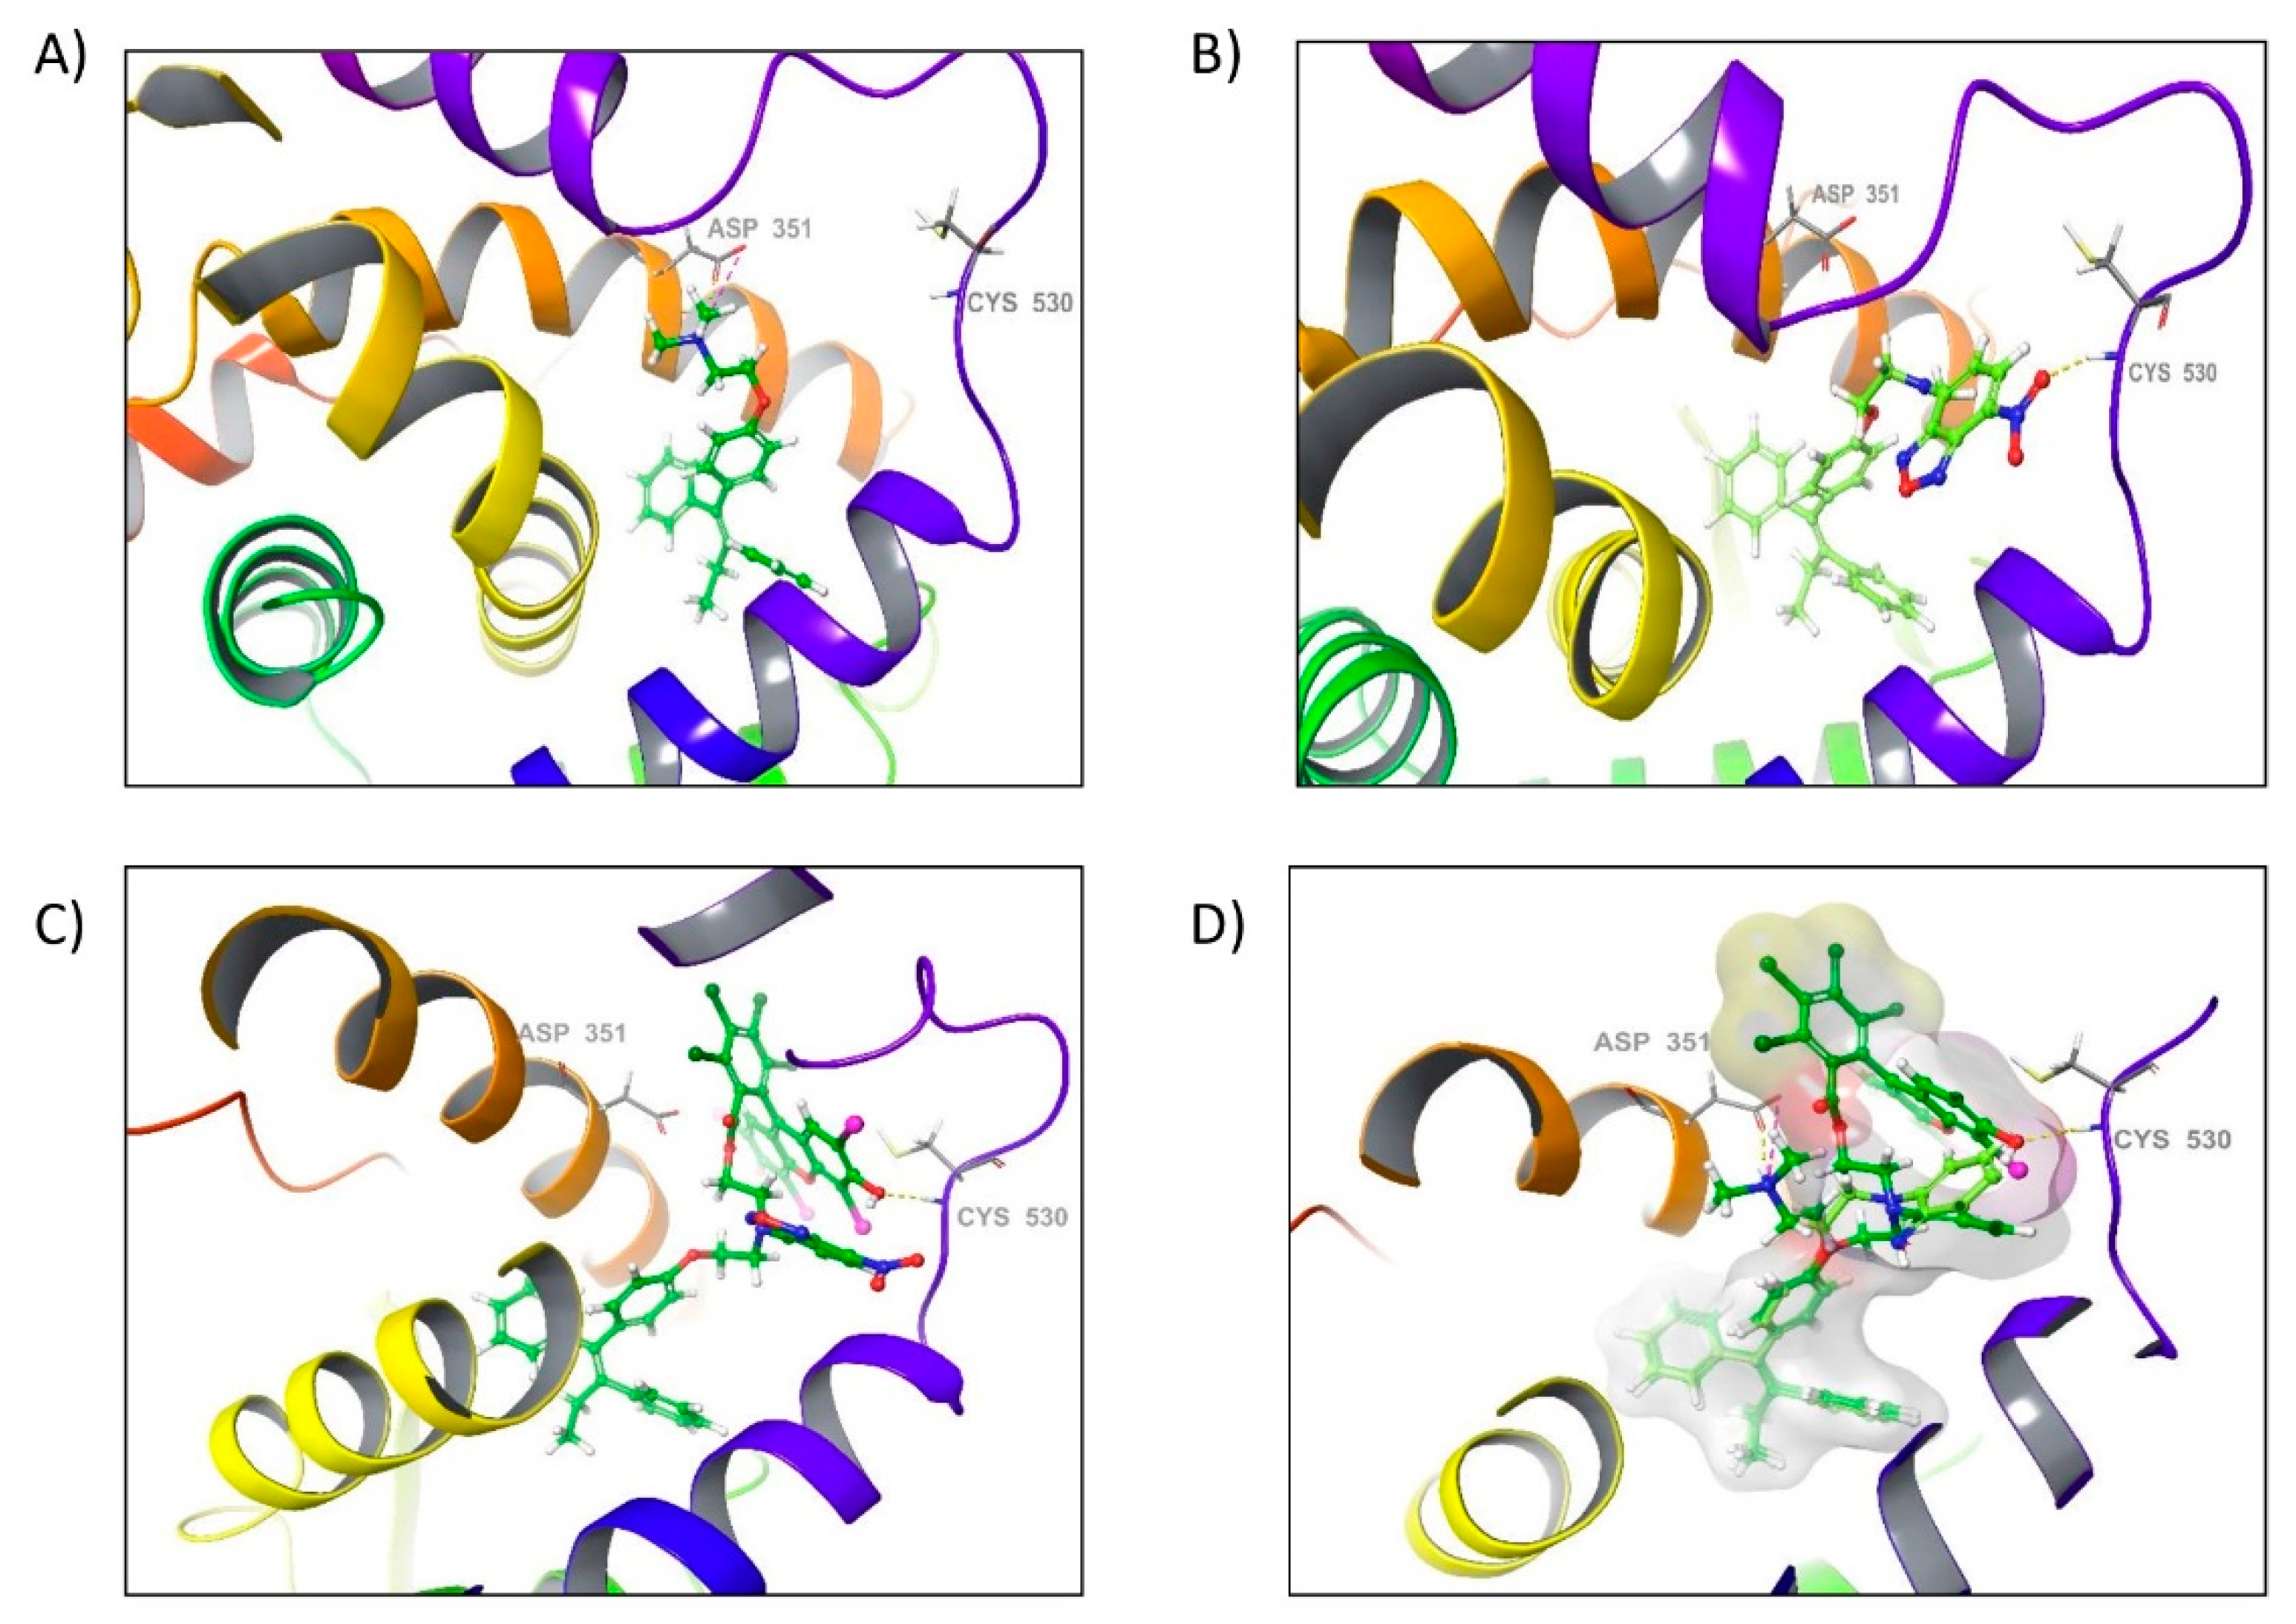
2.3. Docking of FLTX2 on ERα. Comparison with FLTX1
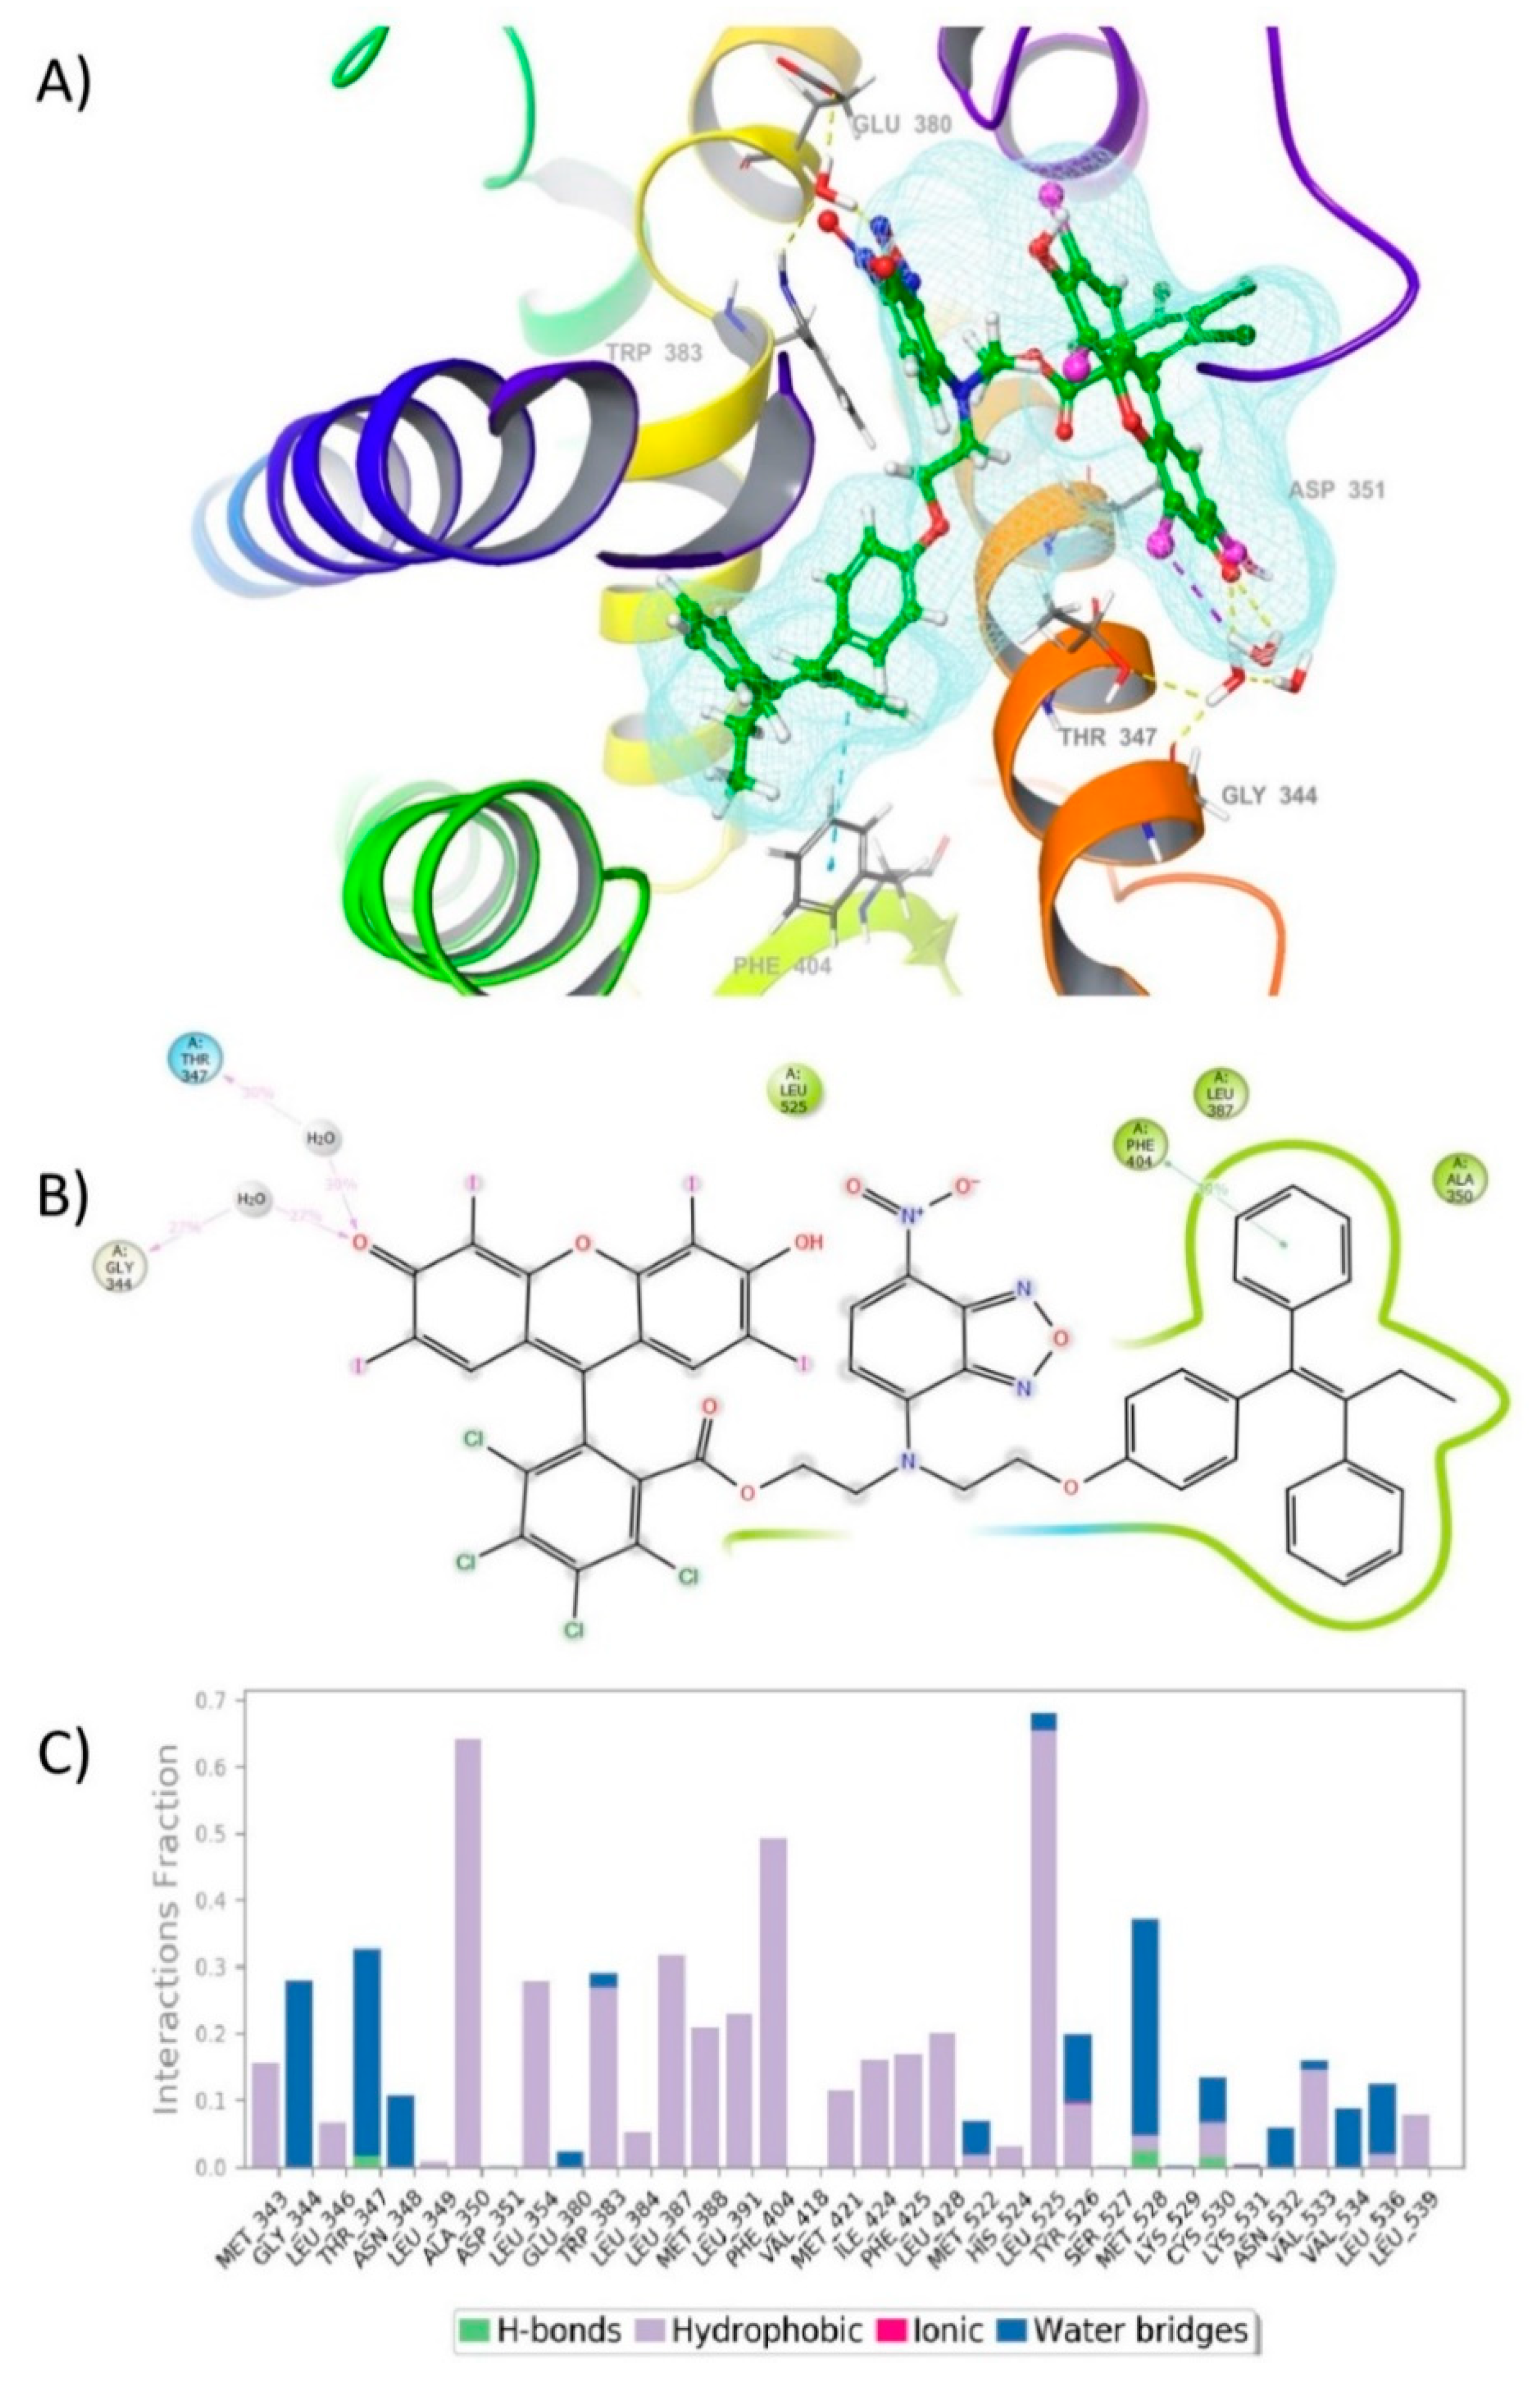
2.4. Molecular Dynamic (MD) Simulation
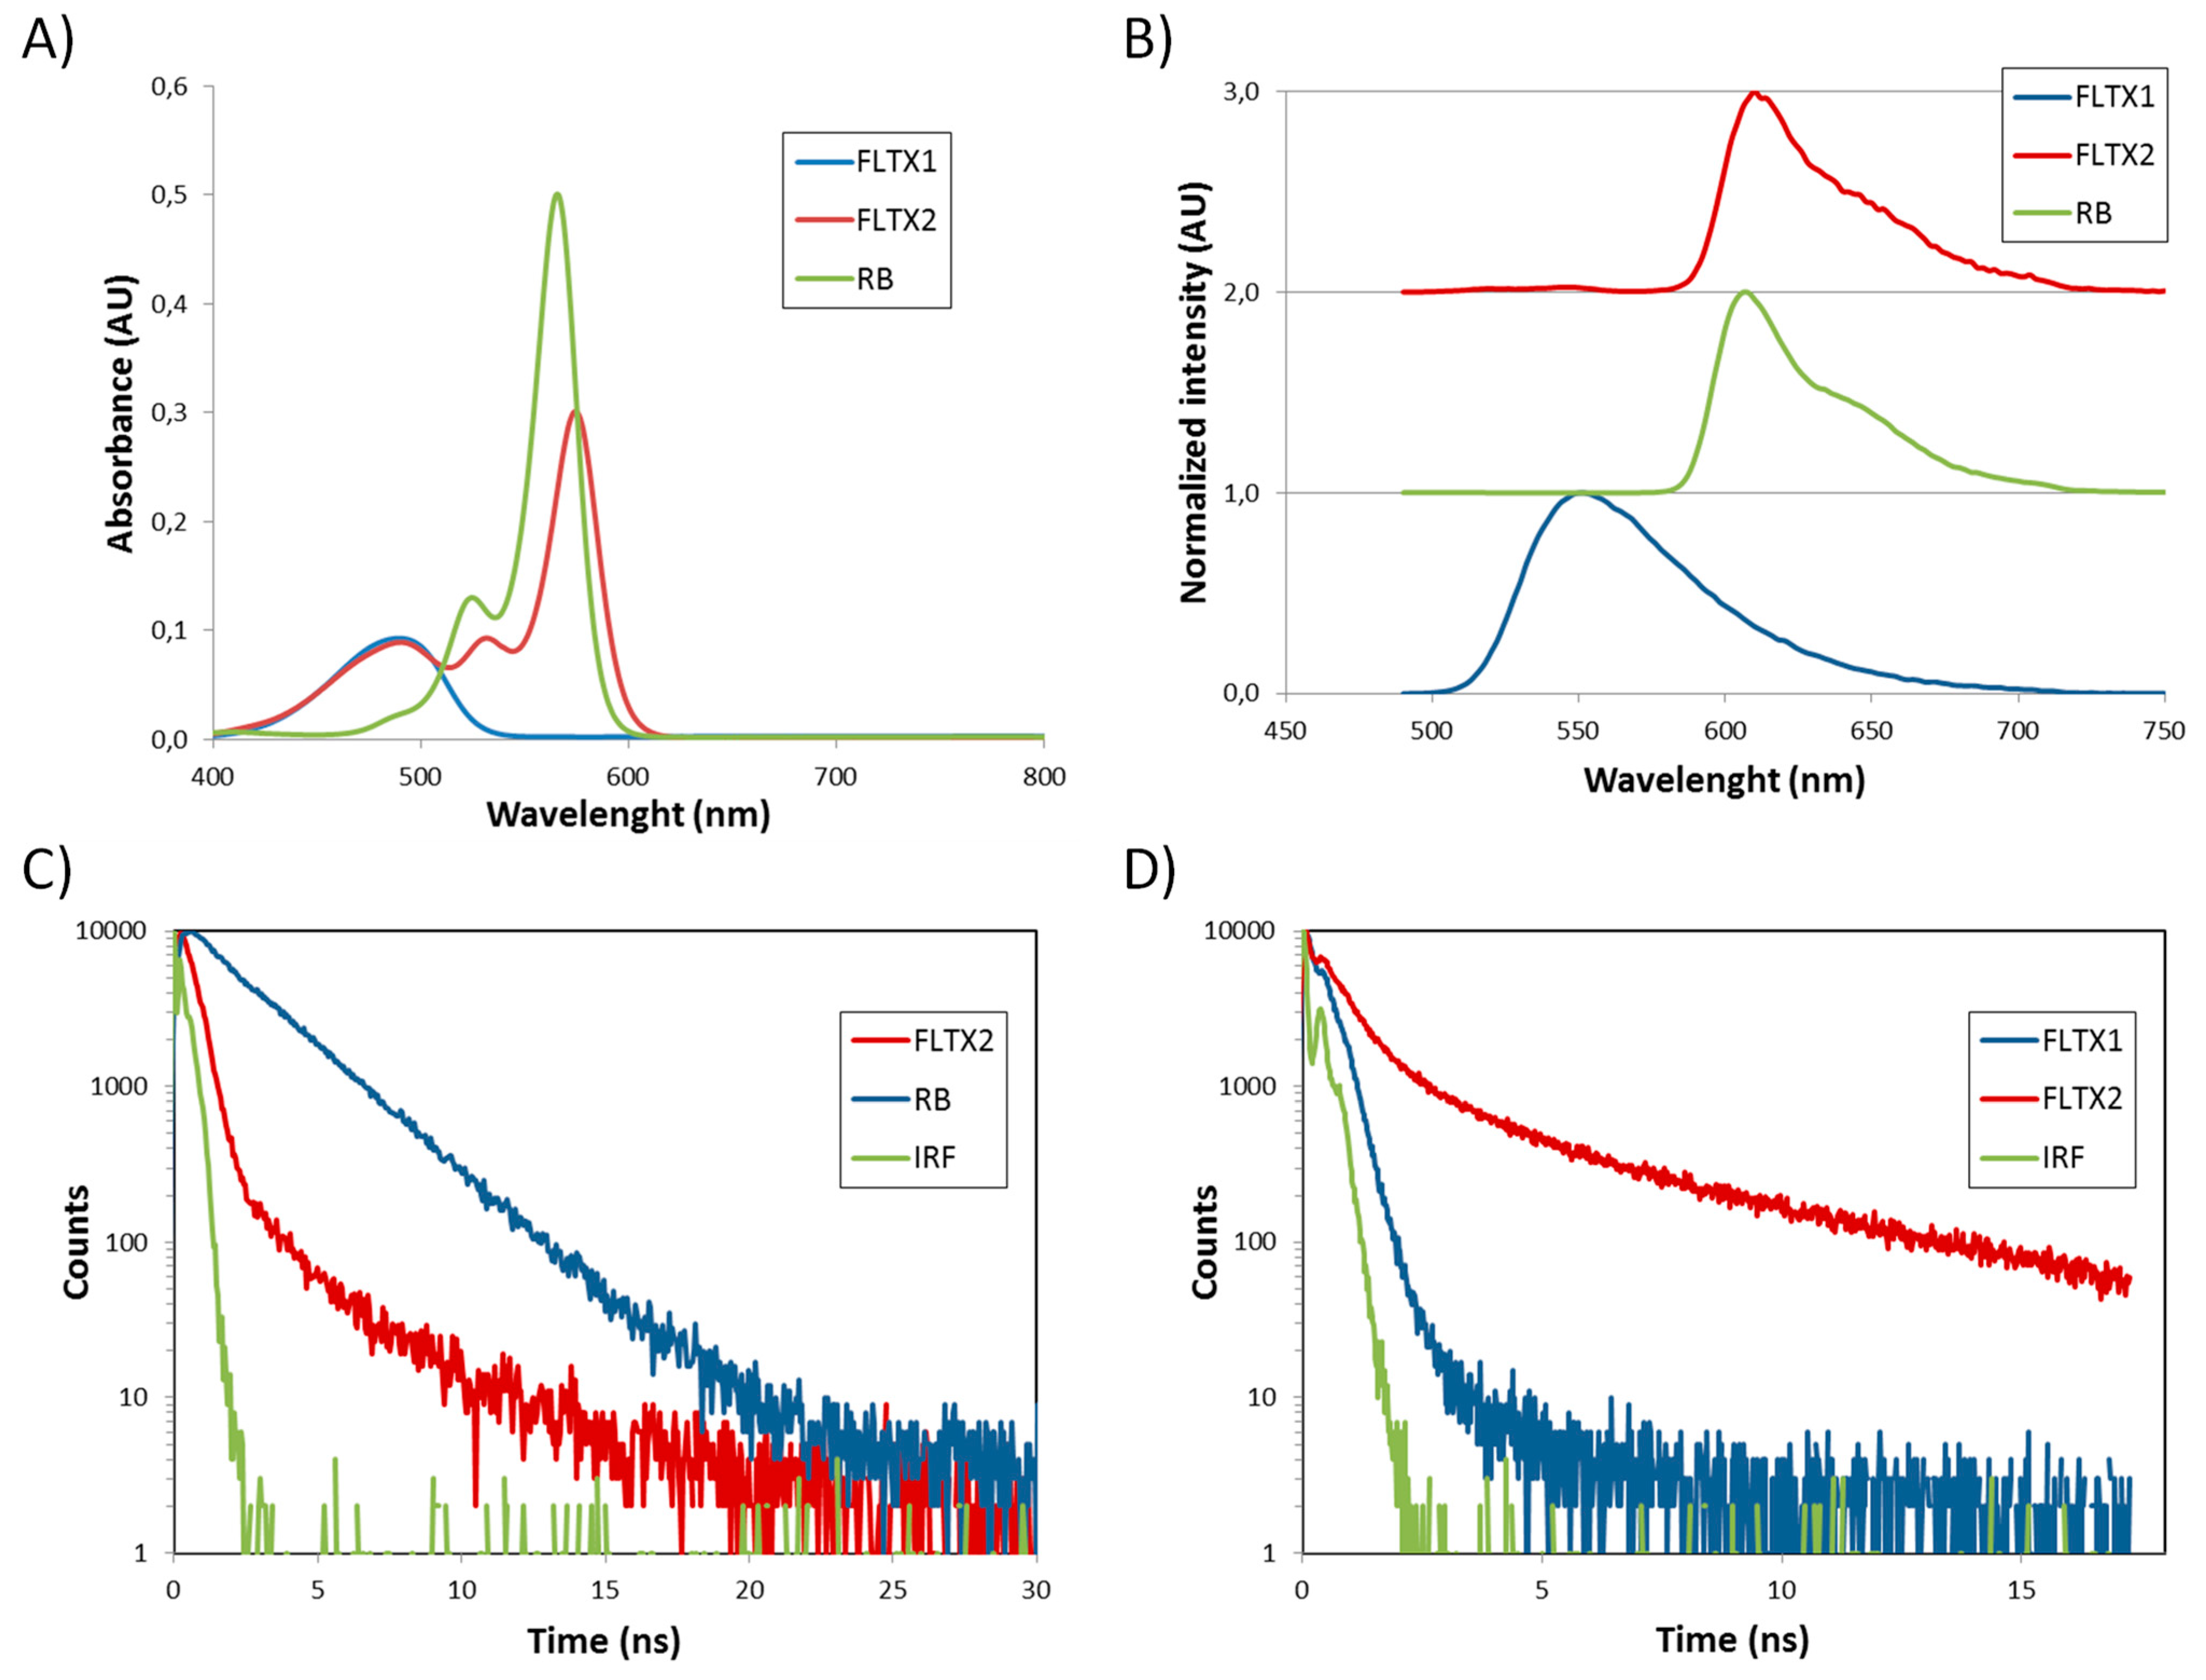
2.5. Fluorescence Properties and FRET Mechanism
2.6. Absorption and Fluorescence Analysis
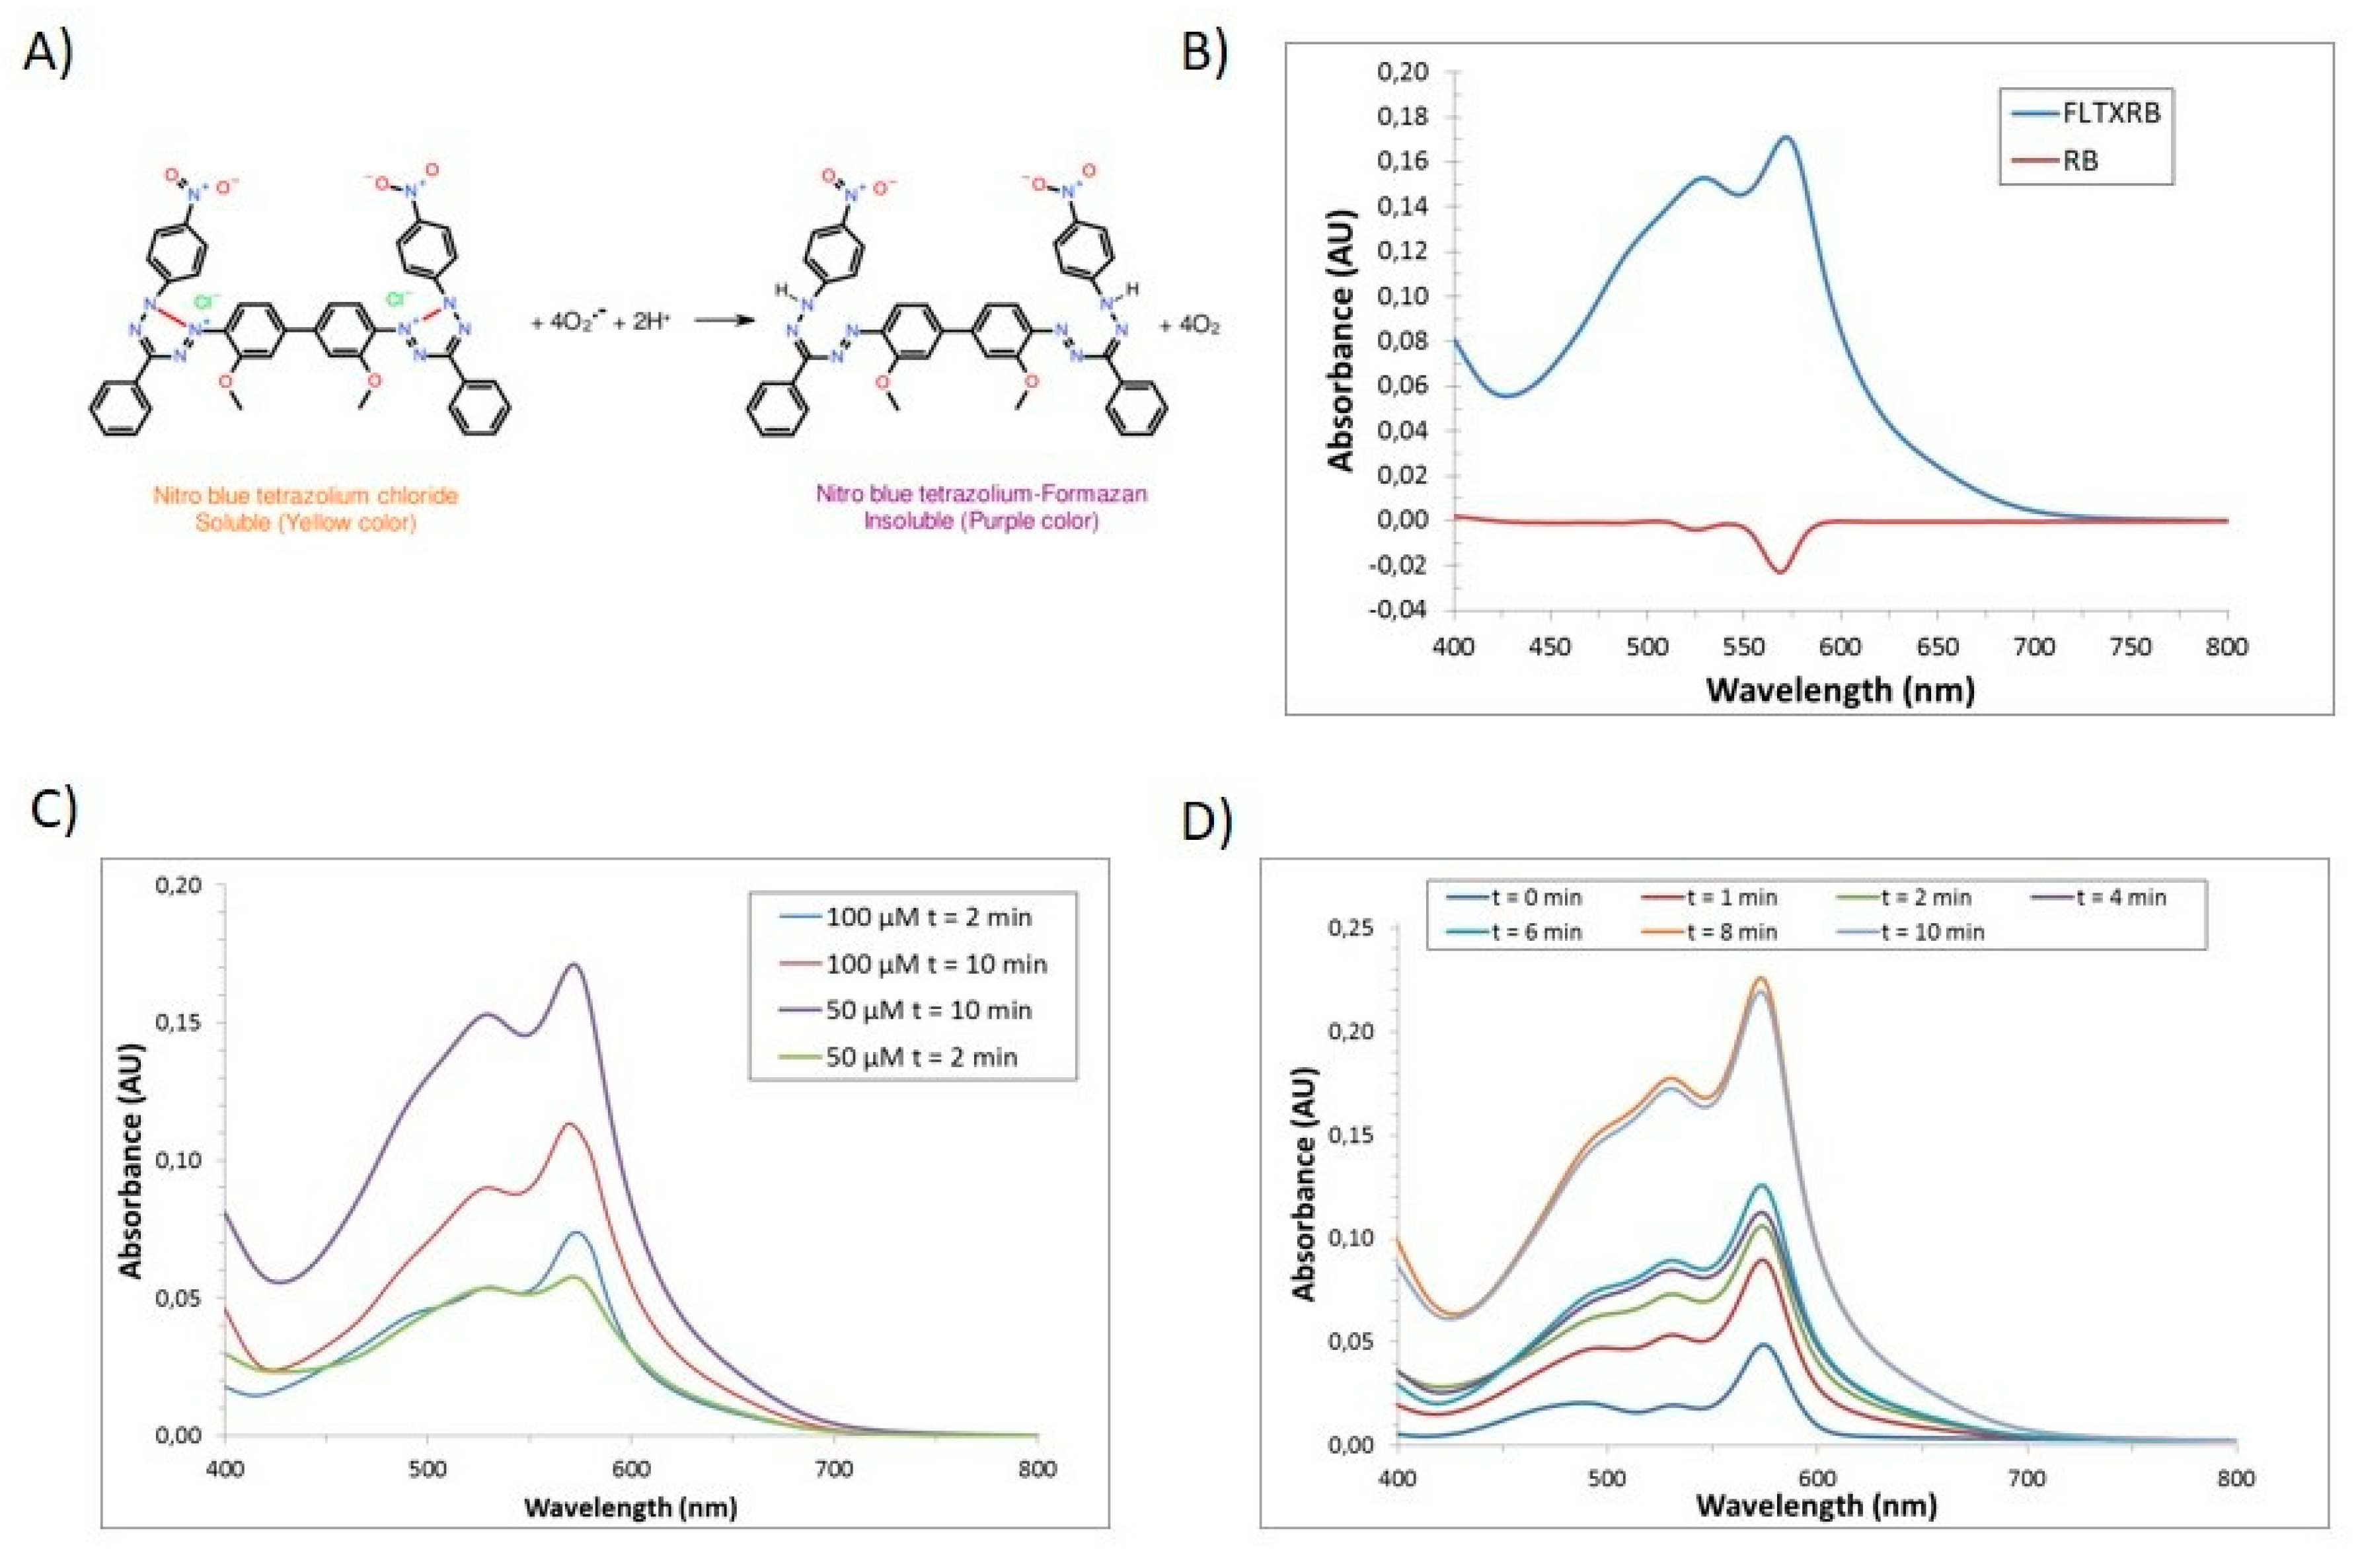
2.7. Laser-Stimulated ROS Generation In Vitro
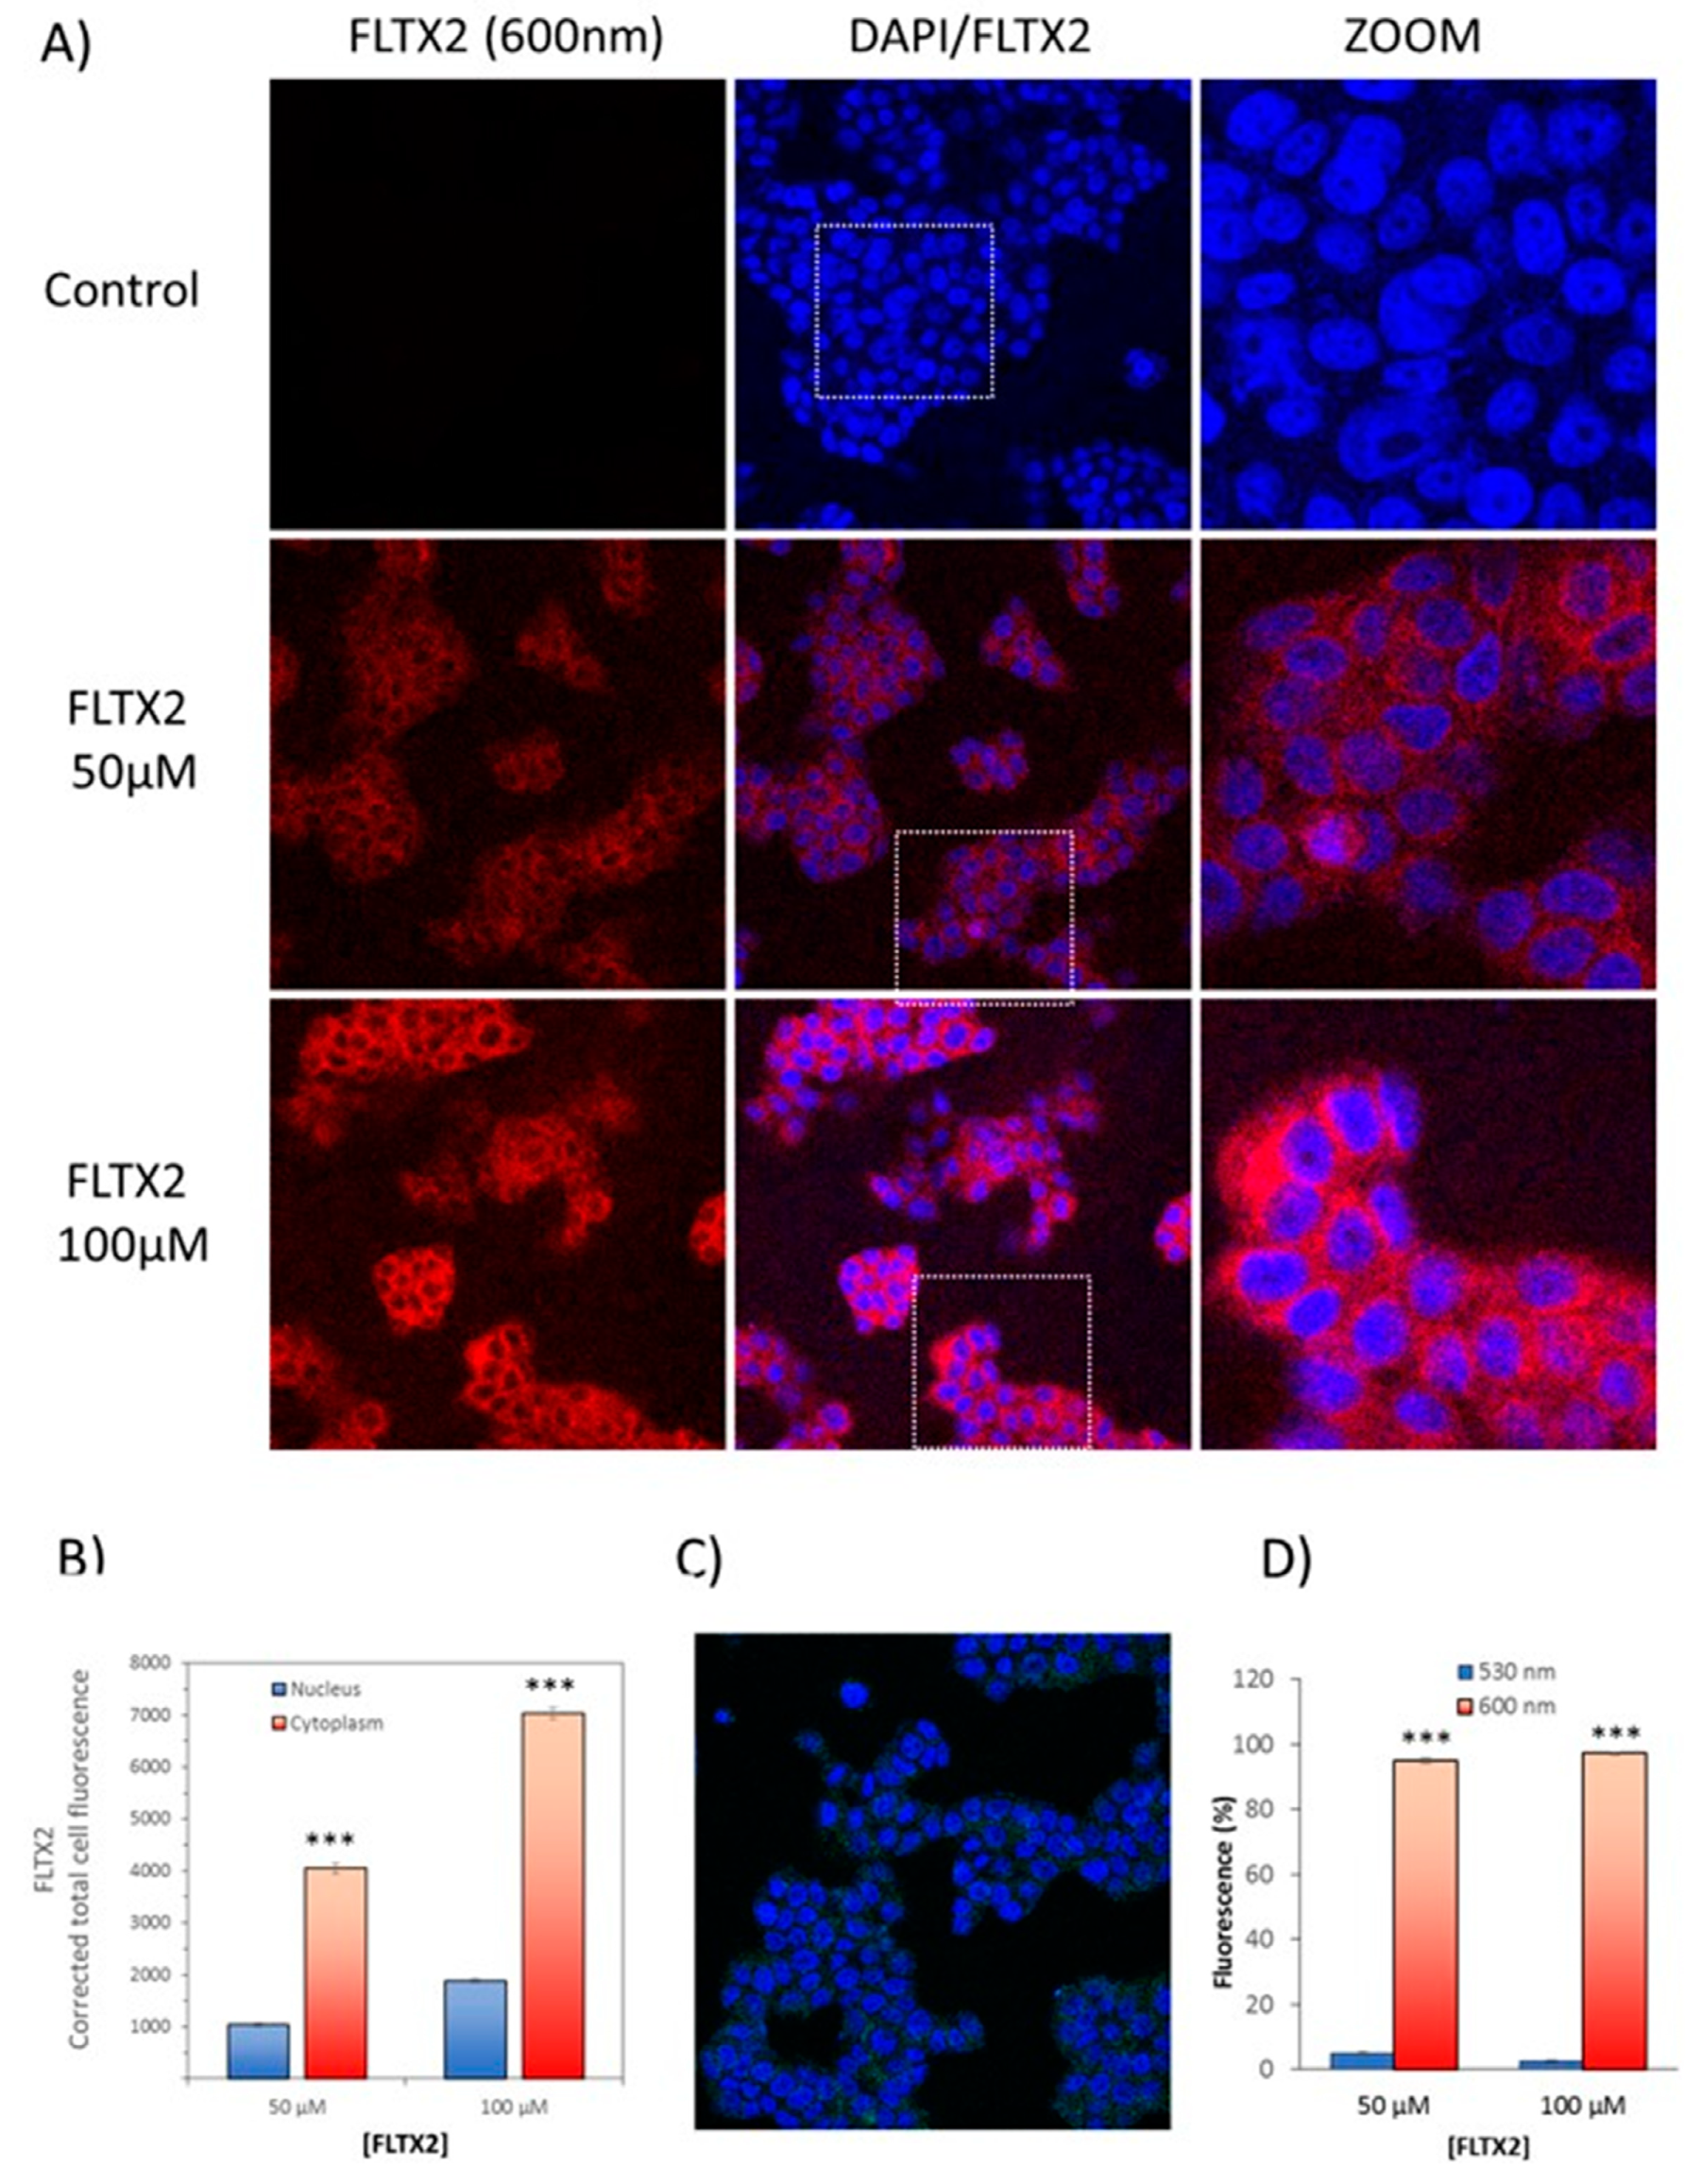
2.8. Cellular Labeling of FLTX2 and Occurrence of FRET on MCF-7 Cells
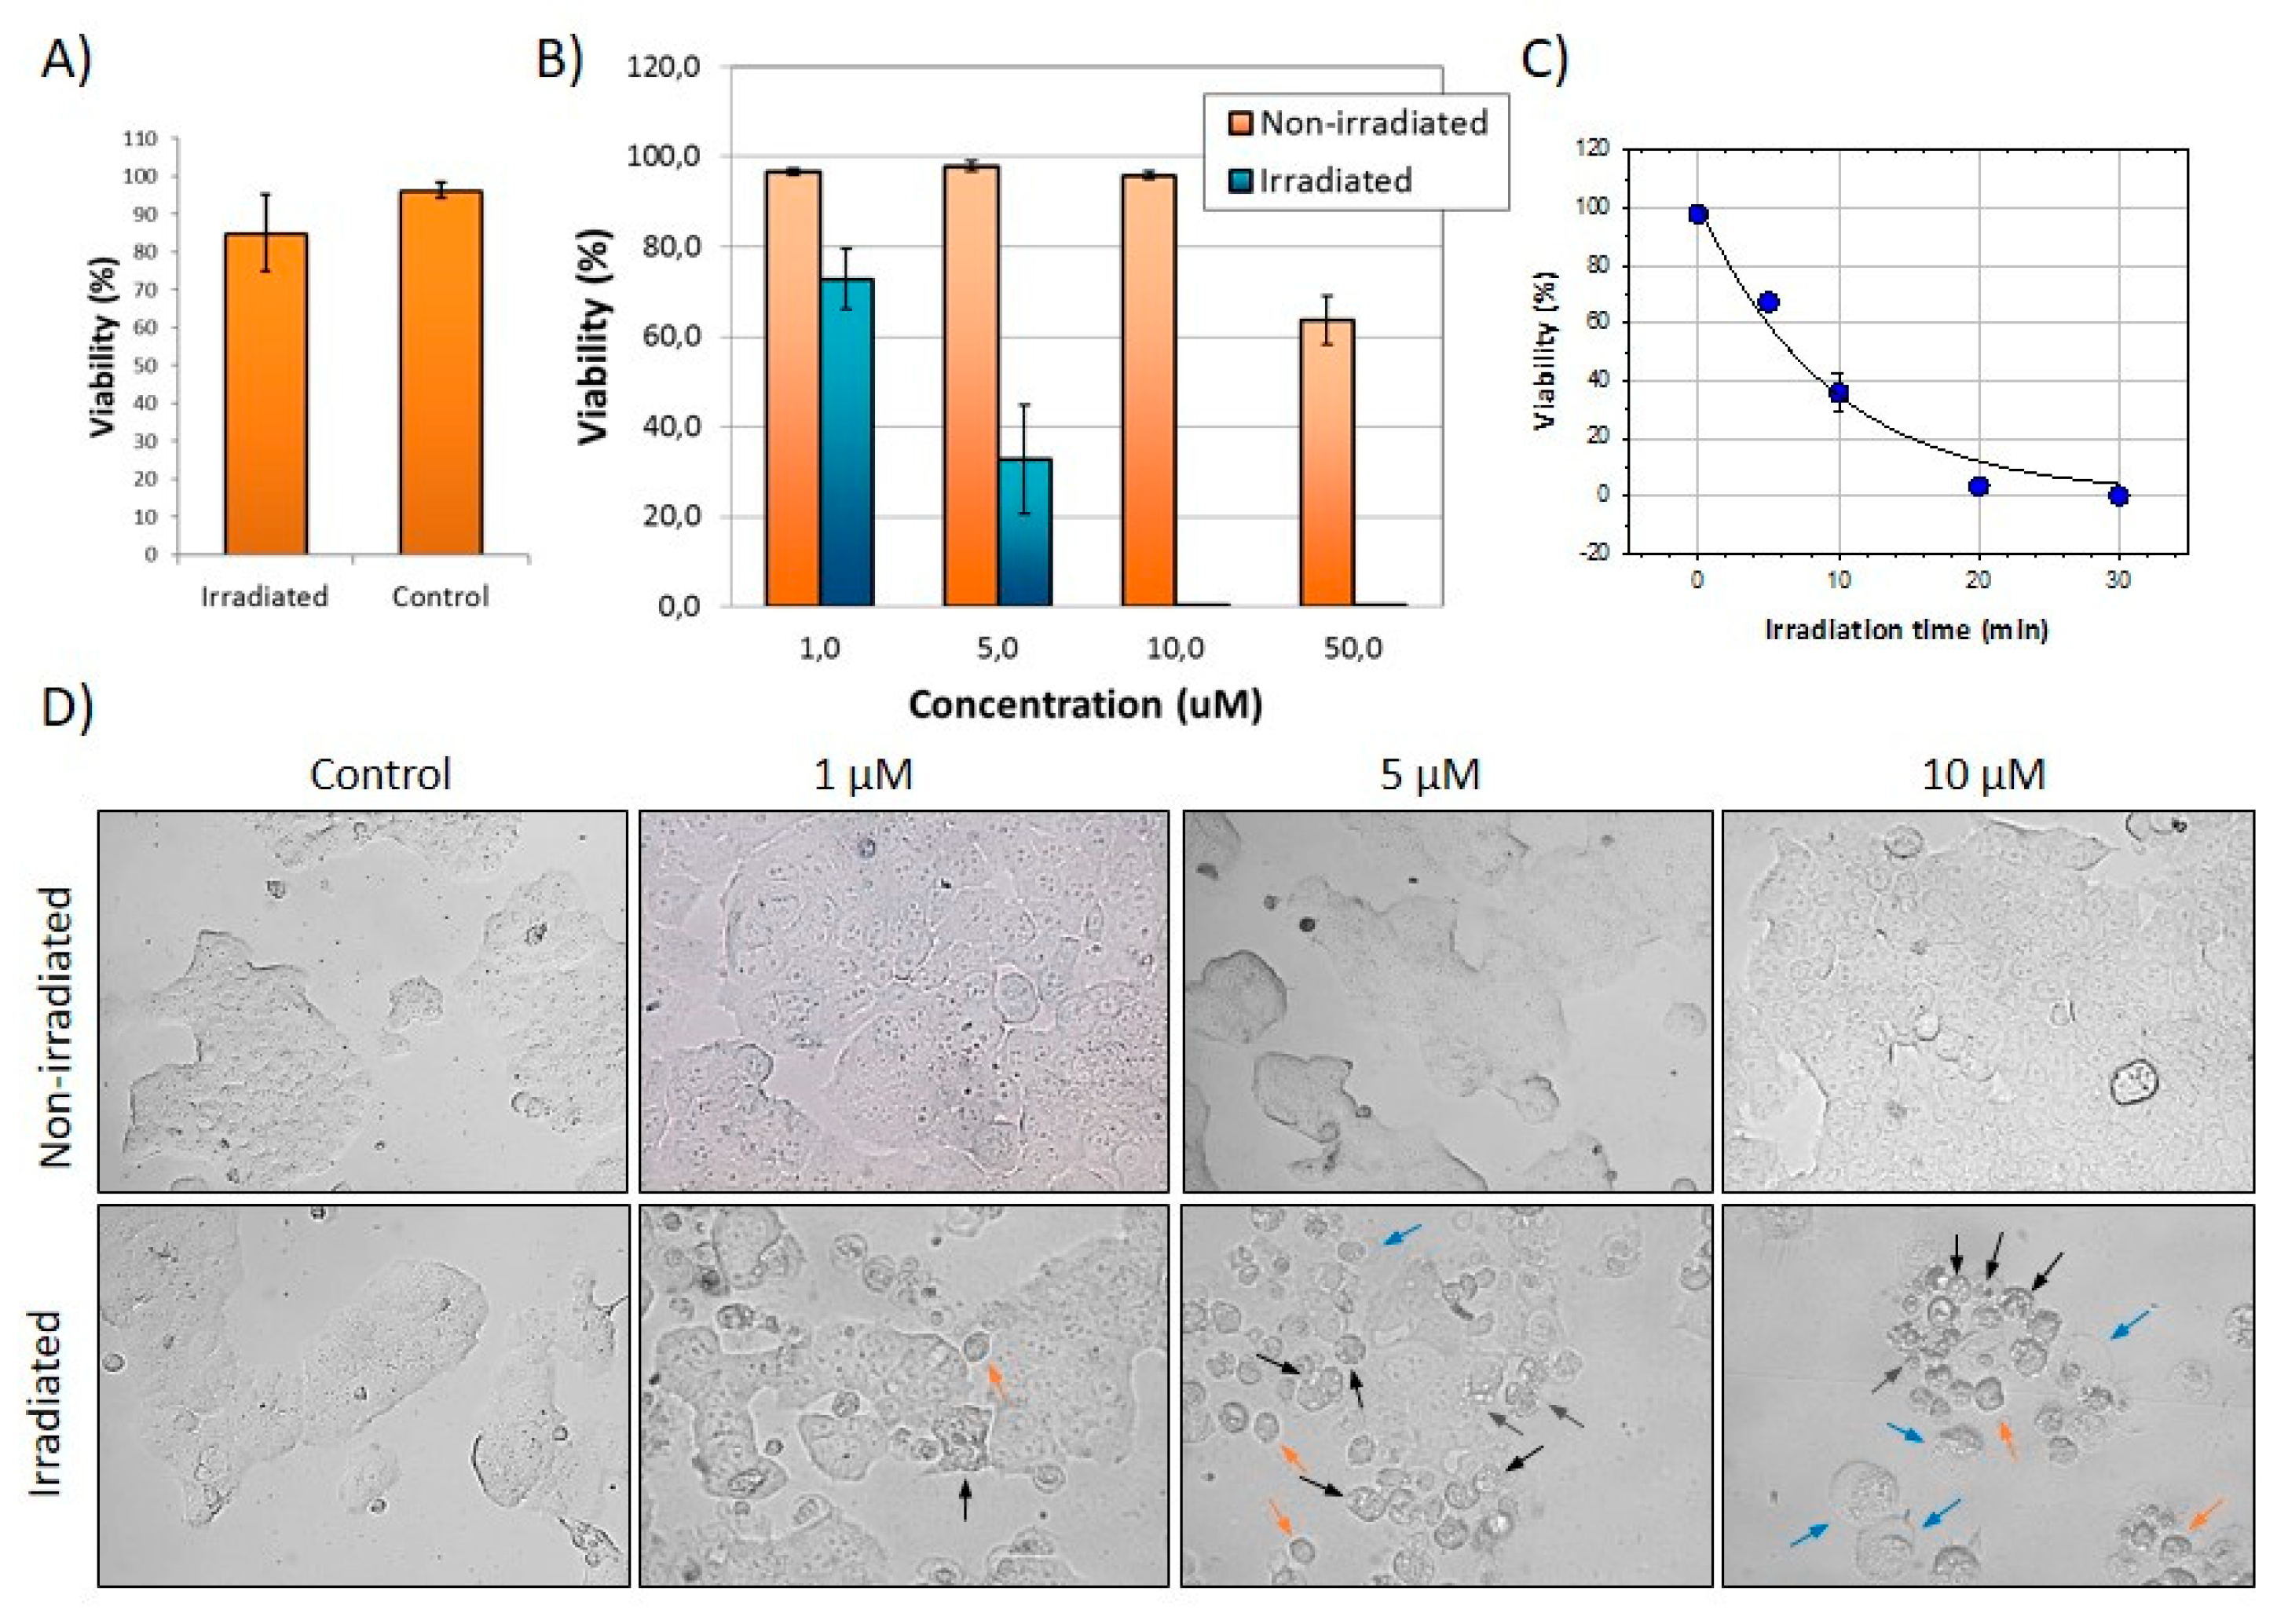
2.9. Photodynamic Effects of FLTX2 on Cell Cultures
3. Materials and Methods
3.1. Synthesis of FLTX2
3.1.1. Synthesis of Compound 2
3.1.2. Synthesis of FLTX2 (Compound 3)
3.2. Estrogen Receptor Competitive Binding Assay
3.3. Docking Studies
3.4. Molecular Dynamics Simulation
3.5. Optical Measurements
3.6. ROS Generation
3.7. Cellular Culture
3.8. FLTX2-Induced Cellular Toxicity
3.9. Confocal Microscopy Studies
3.10. Statistical Analysis
4. Conclusions
Supplementary Materials
Author Contributions
Funding
Institutional Review Board Statement
Informed Consent Statement
Data Availability Statement
Acknowledgments
Conflicts of Interest
References
- Jordan, V.C. Tamoxifen as the first targeted long-term adjuvant therapy for breast cancer. Endocr. Relat. Cancer 2014, 21, 235–246. [Google Scholar] [CrossRef]
- Jordan, V.C.; Obiorah, I.; Fan, P.; Kim, H.R.; Ariazi, E.; Cunliffe, H.; Brauch, H. The St. Gallen Prize Lecture 2011: Evolution of long-term adjuvant anti-hormone therapy: Consequences and opportunities. Breast 2011, 20, 1–11. [Google Scholar] [CrossRef]
- Cersosimo, R.J.; Hernández, L.; Gagnon, L. Tamoxifen for prevention of breast cancer. Ann. Pharmacother. 2003, 37, 268–273. [Google Scholar] [CrossRef] [PubMed]
- Waks, A.G.; Winer, E.P. Breast Cancer Treatment: A Review. JAMA 2019, 321, 288–300. [Google Scholar] [CrossRef]
- Senkus-Konefka, E.; Konefka, T.; Jassem, J. The effects of tamoxifen on the female geniatal tract. Cancer Treat. Rev. 2004, 30, 291–301. [Google Scholar] [CrossRef] [PubMed]
- Mourits, M.J.E.; De Vries, E.G.E.; Willemse, P.H.B.; Ten Hoor, K.A.; Hollema, H.; Van Der Zee, A.G.J. Tamoxifen treatment and gynecologic side effects: A review. Obstet. Gynecol. 2001, 97, 855–866. [Google Scholar] [CrossRef] [PubMed]
- Iqbal, J.; Ginsburg, O.M.; Wijeratne, T.D.; Howell, A.; Evans, G.; Sestak, I.; Narod, S.A. Endometrial cancer and venous thromboembolism in women under age 50 who take tamoxifen for prevention of breast cancer: A systematic review. Cancer Treat. Rev. 2012, 38, 318–328. [Google Scholar] [CrossRef]
- Díaz, M.; Marrero-Alonso, J.; García Marrero, B.; Marín, R.; Gomez, T.; Alonso, R. Cellular and molecular basis for acute nongenomically mediated actions of SERMs. In Selective Estrogen Receptor Modulators: A New Brand of Multitarget Drugs; Springer: Berlin/Heidelberg, Germany, 2006; pp. 79–102. ISBN 3540242279. [Google Scholar]
- Dong, C.; Chen, L. Second malignancies after breast cancer: The impact of adjuvant therapy. Mol. Clin. Oncol. 2014, 2, 331–336. [Google Scholar] [CrossRef]
- Early Breast Cancer Trialists’ Collaborative Group (EBCTCG). Aromatase inhibitors versus tamoxifen in early breast cancer: Patient-level meta-analysis of the randomised trials. Lancet 2015, 386, 1341–1352. [Google Scholar] [CrossRef]
- Hu, R.; Hilakivi-Clarke, L.; Clarke, R. Molecular mechanisms of tamoxifen-associated endometrial cancer (Review). Oncol. Lett. 2015, 9, 1495–1501. [Google Scholar] [CrossRef]
- McDonnell, D.P.; Wardell, S.E. The molecular mechanisms underlying the pharmacological actions of ER modulators: Implications for new drug discovery in breast cancer. Curr. Opin. Pharmacol. 2010, 10, 620–628. [Google Scholar] [CrossRef]
- Rivera-Guevara, C.; Camacho, J. Tamoxifen and its New Derivatives in Cancer Research. Recent Pat. Anticancer Drug Discov. 2011, 6, 237–245. [Google Scholar] [CrossRef]
- Davies, C.; Godwin, J.; Gray, R.; Clarke, M.; Cutter, D.; Darby, S.; McGale, P.; Pan, H.C.; Taylor, C.; Wang, Y.C.; et al. Relevance of breast cancer hormone receptors and other factors to the efficacy of adjuvant tamoxifen: Patient-level meta-analysis of randomised trials. Lancet 2011, 378, 771–784. [Google Scholar] [CrossRef]
- May, F.E. Novel drugs that target the estrogen-related receptor alpha: Their therapeutic potential in breast cancer. Cancer Manag. Res. 2014, 6, 225–252. [Google Scholar] [CrossRef] [PubMed]
- Marrero-Alonso, J.; Morales, A.; García Marrero, B.; Boto, A.; Marín, R.; Cury, D.; Gómez, T.; Fernández-Pérez, L.; Lahoz, F.; Díaz, M. Unique SERM-like properties of the novel fluorescent tamoxifen derivative FLTX1. Eur. J. Pharm. Biopharm. 2013, 85, 898–910. [Google Scholar] [CrossRef] [PubMed]
- Lahoz, F.; Oton, C.J.; López, D.; Marrero-Alonso, J.; Boto, A.; Díaz, M. Whispering gallery mode laser based on antitumor drug–dye complex gain medium. Opt. Lett. 2012, 37, 4756. [Google Scholar] [CrossRef] [PubMed]
- Lahoz, F.; Oton, C.J.; López, D.; Marrero-Alonso, J.; Boto, A.; Díaz, M. High efficiency amplified spontaneous emission from a fluorescent anticancer drug-dye complex. Org. Electron. 2013, 14, 1225–1230. [Google Scholar] [CrossRef][Green Version]
- Lahoz, F.; Martín, I.R.; Urgellés, M.; Marrero-Alonso, J.; Marín, R.; Saavedra, C.J.; Boto, A.; Díaz, M. Random laser in biological tissues impregnated with a fluorescent anticancer drug. Laser Phys. Lett. 2015, 12, 045805. [Google Scholar] [CrossRef]
- Díaz, M.; Scholz, L.E.; Marrero-Alonso, J.; Boto, A.; Marín, R.; Lobo, F.; Hernández, D.; Amesty, A.; Estévez-Braun, A.; Quinto-Alemany, D.; et al. Opto-chemical and laser properties of FLTX1, a novel fluorescent tamoxifen derivative, and its potential applications in breast cancer photodynamic chemotherapy. Opt. Mater. (Amst) 2018, 84, 442–446. [Google Scholar] [CrossRef]
- Kushner, P.; Cyrus, H.; Davis, M. Subsituted Triphenyl Buthenes. U.S. Patent 8063249, 22 November 2011. [Google Scholar]
- Lahoz, F.; Scholz, L.E.; Boto, A.; Díaz, M. FRET mechanism between a fluorescent breast-cancer drug and photodynamic therapy sensitizers. Spectrochim. Acta Part A Mol. Biomol. Spectrosc. 2020, 239, 1–5. [Google Scholar] [CrossRef]
- Katzenellenbogen, B.S.; Choi, I.; Delage-Mourroux, R.; Ediger, T.R.; Martini, P.G.V.; Montano, M.; Sun, J.; Weis, K.; Katzenellenbogen, J.A. Molecular mechanisms of estrogen action: Selective ligands and receptor pharmacology. J. Steroid Biochem. Mol. Biol. 2000, 74, 279–285. [Google Scholar] [CrossRef]
- Wilson, S.; Ruenitz, P.C.; Ruzicka, J.A. Estrogen receptor affinity and effects on MCF-7 cell growth of triarylethylene carboxylic acids related to tamoxifen. J. Steroid Biochem. Mol. Biol. 1992, 42, 613–616. [Google Scholar] [CrossRef]
- Rickert, E.L.; Oriana, S.; Hartman-Frey, C.; Long, X.; Webb, T.T.; Nephew, K.P.; Weatherman, R.V. Synthesis and characterization of fluorescent 4-hydroxytamoxifen conjugates with unique antiestrogenic properties. Bioconjug. Chem. 2010, 21, 903–910. [Google Scholar] [CrossRef] [PubMed]
- Yaşar, P.; Ayaz, G.; User, S.D.; Güpür, G.; Muyan, M. Molecular mechanism of estrogen–estrogen receptor signaling. Reprod. Med. Biol. 2017, 16, 4–20. [Google Scholar] [CrossRef] [PubMed]
- Tecalco-Cruz, A.C.; Pérez-Alvarado, I.A.; Ramírez-Jarquín, J.O.; Rocha-Zavaleta, L. Nucleo-cytoplasmic transport of estrogen receptor alpha in breast cancer cells. Cell. Signal. 2017, 34, 121–132. [Google Scholar] [CrossRef]
- Arnal, J.-F.; Lenfant, F.; Metivier, R.; Flouriot, G.; Henrion, D.; Adlanmerini, M.; Fontaine, C.; Gourdy, P.; Chambon, P.; Katzenellenbogen, B.; et al. Membrane and Nuclear Estrogen Receptor Alpha Actions: From Tissue Specificity to Medical Implications. Physiol. Rev. 2017, 97, 1045–1087. [Google Scholar] [CrossRef]
- Gu, X. Helix 12 in the human estrogen receptor (hER) is essential for the hER function by overcoming nucleosome repression in yeast. J. Cell. Biochem. 2002, 86, 224–238. [Google Scholar] [CrossRef]
- Souza, P.C.T.; Textor, L.C.; Melo, D.C.; Nascimento, A.S.; Skaf, M.S.; Polikarpov, I. An alternative conformation of ERβ bound to estradiol reveals H12 in a stable antagonist position. Sci. Rep. 2017, 7, 1–11. [Google Scholar] [CrossRef]
- Bruning, J.B.; Parent, A.A.; Gil, G.; Zhao, M.; Nowak, J.; Pace, M.C.; Smith, C.L.; Afonine, P.V.; Adams, P.D.; Katzenellenbogen, J.A.; et al. Coupling of receptor conformation and ligand orientation determine graded activity. Nat. Chem. Biol. 2010, 6, 837–843. [Google Scholar] [CrossRef]
- Heldring, N.; Pawson, T.; McDonnell, D.; Treuter, E.; Gustafsson, J.Å.; Pike, A.C.W. Structural insights into corepressor recognition by antagonist-bound estrogen receptors. J. Biol. Chem. 2007, 282, 10449–10455. [Google Scholar] [CrossRef]
- Foulds, C.E.; Feng, Q.; Ding, C.; Bailey, S.; Hunsaker, T.L.; Malovannaya, A.; Hamilton, R.A.; Gates, L.A.; Zhang, Z.; Li, C.; et al. Proteomic analysis of coregulators bound to ERα on DNA and nucleosomes reveals coregulator dynamics. Mol. Cell 2013, 51, 185–199. [Google Scholar] [CrossRef] [PubMed]
- Jordan, V.C. Antiestrogens and selective estrogen receptor modulators as multifunctional medicines. 1. Receptor interactions. J. Med. Chem. 2003, 46, 883–908. [Google Scholar] [CrossRef] [PubMed]
- Shiau, A.K.; Barstad, D.; Loria, P.M.; Cheng, L.; Kushner, P.J.; Agard, D.A.; Greene, G.L. The structural basis of estrogen receptor/coactivator recognition and the antagonism of this interaction by tamoxifen. Cell 1998, 95, 927–937. [Google Scholar] [CrossRef]
- Brzozowski, A.M.; Pike, A.C.W.; Dauter, Z.; Hubbard, R.E.; Bonn, T.; Engström, O.; Öhman, L.; Greene, G.L.; Gustafsson, J.Å.; Carlquist, M. Molecular basis of agonism and antagonism in the oestrogen receptor. Nature 1997, 389, 753–758. [Google Scholar] [CrossRef]
- Shang, Y. Molecular mechanisms of oestrogen and SERMs in endometrial carcinogenesis. Nat. Rev. Cancer 2006, 6, 360–368. [Google Scholar] [CrossRef]
- Hall, J.M.; McDonnell, D.P. Coregulators in nuclear estrogen receptor action: From concept to therapeutic targeting. Mol. Interv. 2005, 5, 343–357. [Google Scholar] [CrossRef]
- Nettles, K.W.; Bruning, J.B.; Gil, G.; O’Neill, E.E.; Nowak, J.; Hughs, A.; Kim, Y.; DeSombre, E.R.; Dilis, R.; Hanson, R.N.; et al. Structural plasticity in the oestrogen receptor ligand-binding domain. EMBO Rep. 2007, 8, 563–568. [Google Scholar] [CrossRef]
- Shang, Y.; Brown, M. Molecular determinants for the tissue specificity of SERMs. Science 2002, 295, 2465–2468. [Google Scholar] [CrossRef]
- Manavathi, B.; Dey, O.; Gajulapalli, V.N.R.; Bhatia, R.S.; Bugide, S.; Kumar, R. Derailed estrogen signaling and breast cancer: An authentic couple. Endocr. Rev. 2013, 34, 1–32. [Google Scholar] [CrossRef]
- Chang, C.C.; Yang, Y.T.; Yang, J.C.; Da Wu, H.; Tsai, T. Absorption and emission spectral shifts of rose bengal associated with DMPC liposomes. Dye. Pigment. 2008, 79, 170–175. [Google Scholar] [CrossRef]
- Islam, S.D.M.; Ito, O. Solvent effects on rates of photochemical reactions of rose bengal triplet state studied by nanosecond laser photolysis. J. Photochem. Photobiol. A Chem. 1999, 123, 53–59. [Google Scholar] [CrossRef]
- Lakowicz, J.R. Principles of Fluorescence Spectroscopy, 3rd ed.; Lakowicz, J.R., Ed.; Springer: Berlin/Heidelberg, Germany, 2006. [Google Scholar]
- Zhang, Y.; Dai, M.; Yuan, Z. Methods for the detection of reactive oxygen species. Anal. Methods 2018, 10, 4625–4638. [Google Scholar] [CrossRef]
- Morales, A.; Marín, R.; Marrero-Alonso, J.; Boto, A.; Díaz, M. Colocalization of estrogen receptors with the fluorescent tamoxifen derivative, FLTX1, analyzed by confocal microscopy. In Methods in Molecular Biology; Humana Press Inc.: Totowa, NJ, USA, 2016; Volume 1366, pp. 163–173. [Google Scholar]
- Ford, C.H.J.; Al-Bader, M.; Al-Ayadhi, B.; Francis, I. Reassessment of estrogen receptor expression in human breast cancer cell lines. Anticancer Res. 2011, 31, 521–527. [Google Scholar] [PubMed]
- Elmore, S. Apoptosis: A Review of Programmed Cell Death. Toxicol. Pathol. 2007, 35, 495–516. [Google Scholar] [CrossRef]
- Tower, J. Programmed cell death in aging. Ageing Res. Rev. 2015, 23, 90–100. [Google Scholar] [CrossRef]
- Panzarini, E.; Inguscio, V.; Fimia, G.M.; Dini, L. Rose Bengal Acetate PhotoDynamic Therapy (RBAc-PDT) Induces Exposure and Release of Damage-Associated Molecular Patterns (DAMPs) in Human HeLa Cells. PLoS ONE 2014, 9, e105778. [Google Scholar] [CrossRef]
- Atenco-Cuautle, J.C.; Delgado-López, M.G.; Ramos-García, R.; Ramírez-San-Juan, J.C.; Ramirez-Ramirez, J.; Spezzia-Mazzocco, T. Rose bengal as a photosensitizer in the photodynamic therapy of breast cancer cell lines. Proc. SPIE 2019, 11070. [Google Scholar] [CrossRef]
- Friesner, R.A.; Murphy, R.B.; Repasky, M.P.; Frye, L.L.; Greenwood, J.R.; Halgren, T.A.; Sanschagrin, P.C.; Mainz, D.T. Extra precision glide: Docking and scoring incorporating a model of hydrophobic enclosure for protein-ligand complexes. J. Med. Chem. 2006, 49, 6177–6196. [Google Scholar] [CrossRef]
- Friesner, R.A.; Banks, J.L.; Murphy, R.B.; Halgren, T.A.; Klicic, J.J.; Mainz, D.T.; Repasky, M.P.; Knoll, E.H.; Shelley, M.; Perry, J.K.; et al. Glide: A New Approach for Rapid, Accurate Docking and Scoring. 1. Method and Assessment of Docking Accuracy. J. Med. Chem. 2004, 47, 1739–1749. [Google Scholar] [CrossRef]
- Banks, J.L.; Beard, H.S.; Cao, Y.; Cho, A.E.; Damm, W.; Farid, R.; Felts, A.K.; Halgren, T.A.; Mainz, D.T.; Maple, J.R.; et al. Integrated Modeling Program, Applied Chemical Theory (IMPACT). J. Comput. Chem. 2005, 26, 1752–1780. [Google Scholar] [CrossRef]
- Jorgensen, W.L.; Chandrasekhar, J.; Madura, J.D.; Impey, R.W.; Klein, M.L. Comparison of simple potential functions for simulating liquid water. J. Chem. Phys. 1983, 79, 926–935. [Google Scholar] [CrossRef]
- Bowers, K.J.; Dror, R.O.; Shaw, D.E. The midpoint method for parallelization of particle simulations. J. Chem. Phys. 2006, 124, 184109. [Google Scholar] [CrossRef]
- Gibson, D.A.; Carter, E.A. Time-reversible multiple time scale ab initio molecular dynamics. J. Phys. Chem. 1993, 97, 13429–13434. [Google Scholar] [CrossRef]
- Halliwell, B.; Gutteridge, J.M.C. Free Radicals in Biology and Medicine; Halliwell, B., Gutteridge, J.M.C., Eds.; Oxford University Press: New York, NY, USA, 2015; ISBN 9780198717485. [Google Scholar]


Publisher’s Note: MDPI stays neutral with regard to jurisdictional claims in published maps and institutional affiliations. |
© 2021 by the authors. Licensee MDPI, Basel, Switzerland. This article is an open access article distributed under the terms and conditions of the Creative Commons Attribution (CC BY) license (https://creativecommons.org/licenses/by/4.0/).
Share and Cite
Díaz, M.; Lobo, F.; Hernández, D.; Amesty, Á.; Valdés-Baizabal, C.; Canerina-Amaro, A.; Mesa-Herrera, F.; Soler, K.; Boto, A.; Marín, R.; et al. FLTX2: A Novel Tamoxifen Derivative Endowed with Antiestrogenic, Fluorescent, and Photosensitizer Properties. Int. J. Mol. Sci. 2021, 22, 5339. https://doi.org/10.3390/ijms22105339
Díaz M, Lobo F, Hernández D, Amesty Á, Valdés-Baizabal C, Canerina-Amaro A, Mesa-Herrera F, Soler K, Boto A, Marín R, et al. FLTX2: A Novel Tamoxifen Derivative Endowed with Antiestrogenic, Fluorescent, and Photosensitizer Properties. International Journal of Molecular Sciences. 2021; 22(10):5339. https://doi.org/10.3390/ijms22105339
Chicago/Turabian StyleDíaz, Mario, Fernando Lobo, Dácil Hernández, Ángel Amesty, Catalina Valdés-Baizabal, Ana Canerina-Amaro, Fátima Mesa-Herrera, Kevin Soler, Alicia Boto, Raquel Marín, and et al. 2021. "FLTX2: A Novel Tamoxifen Derivative Endowed with Antiestrogenic, Fluorescent, and Photosensitizer Properties" International Journal of Molecular Sciences 22, no. 10: 5339. https://doi.org/10.3390/ijms22105339
APA StyleDíaz, M., Lobo, F., Hernández, D., Amesty, Á., Valdés-Baizabal, C., Canerina-Amaro, A., Mesa-Herrera, F., Soler, K., Boto, A., Marín, R., Estévez-Braun, A., & Lahoz, F. (2021). FLTX2: A Novel Tamoxifen Derivative Endowed with Antiestrogenic, Fluorescent, and Photosensitizer Properties. International Journal of Molecular Sciences, 22(10), 5339. https://doi.org/10.3390/ijms22105339