
INTACT vs. FANS for Cell-Type-Specific Nuclei Sorting: A Comprehensive Qualitative and Quantitative Comparison

 , and
, and
Abstract

1. Introduction
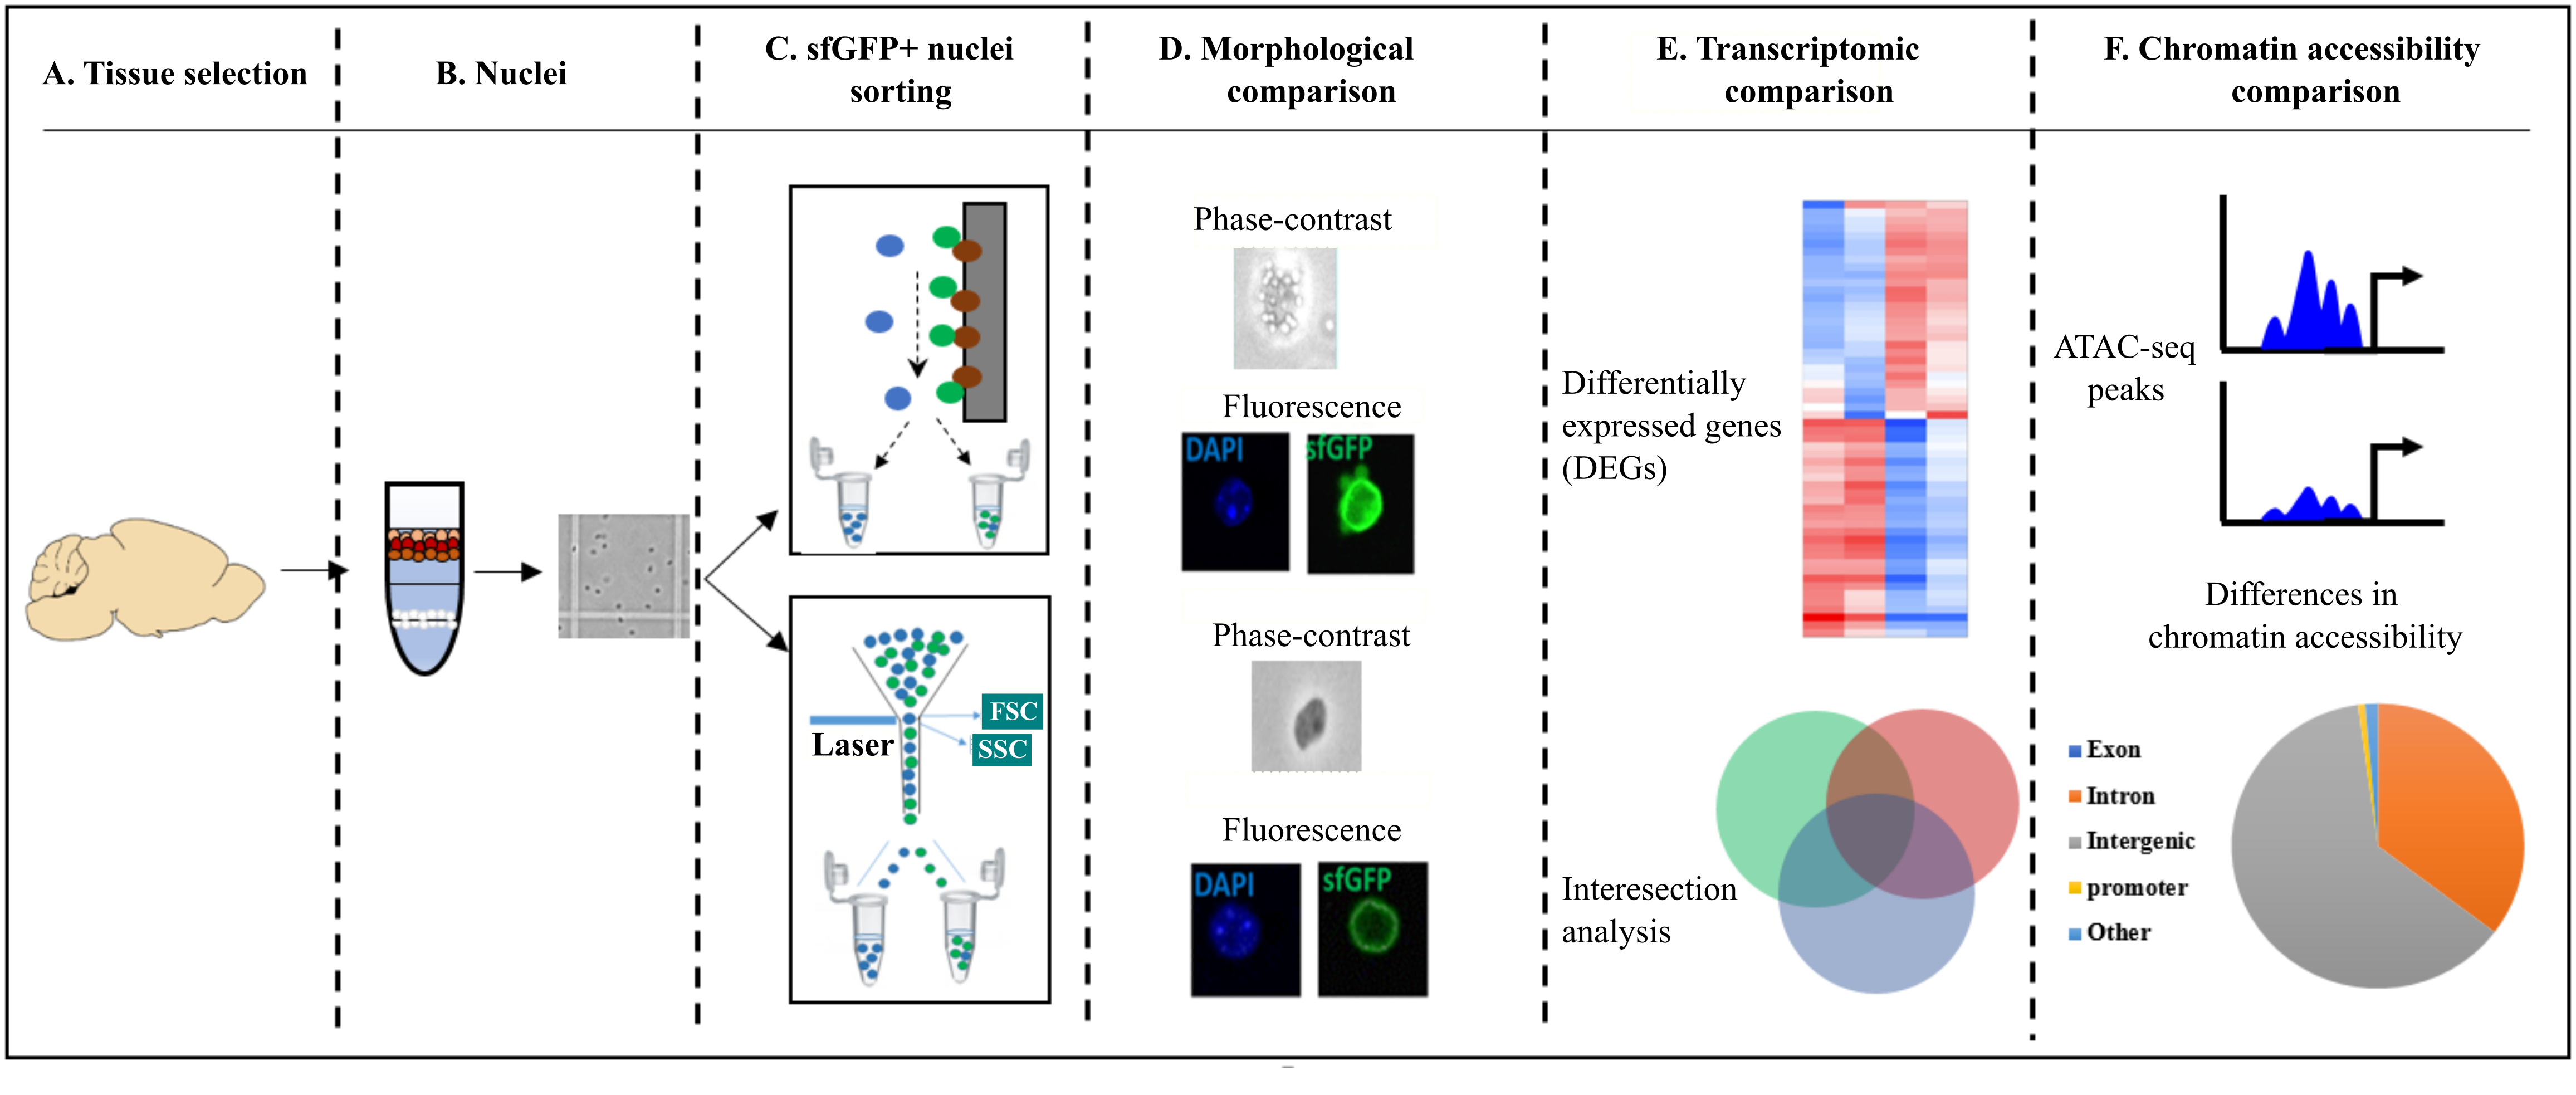
2. Results
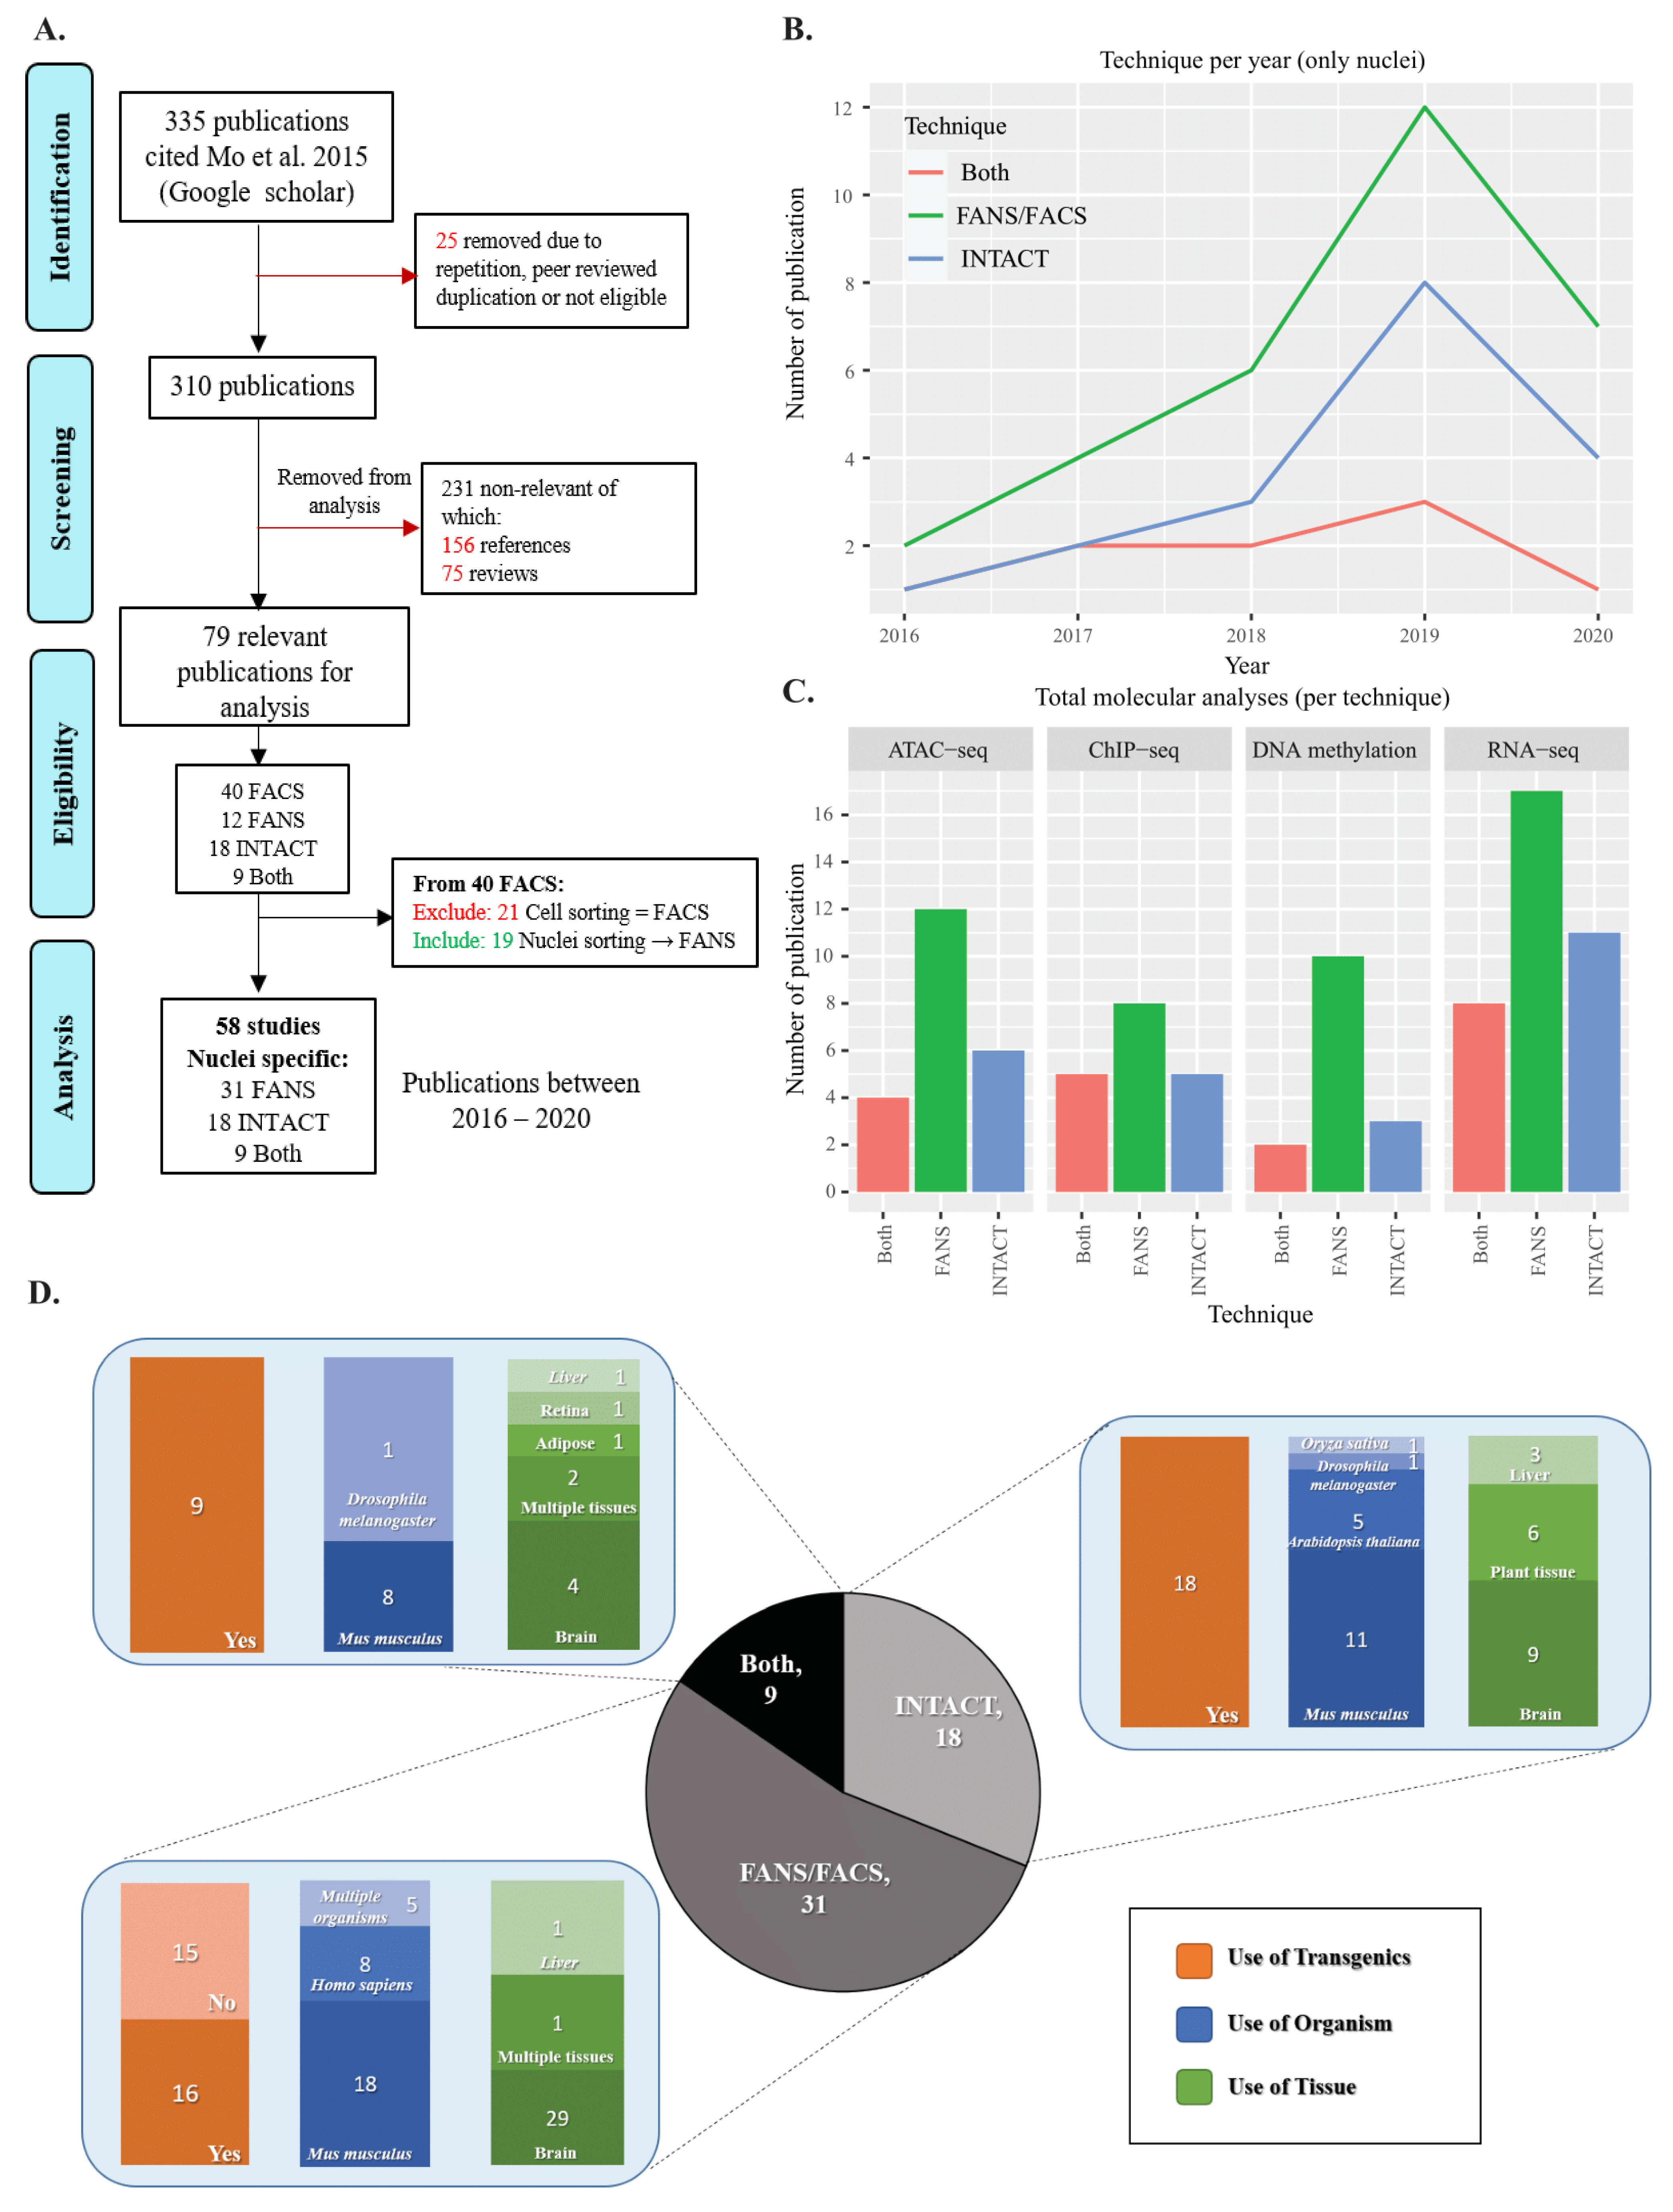
2.1. Literature Review of INTACT and FANS/FACS Studies
2.2. Assessing Differences in Speed and Sorting Efficiency between FANS and INTACT
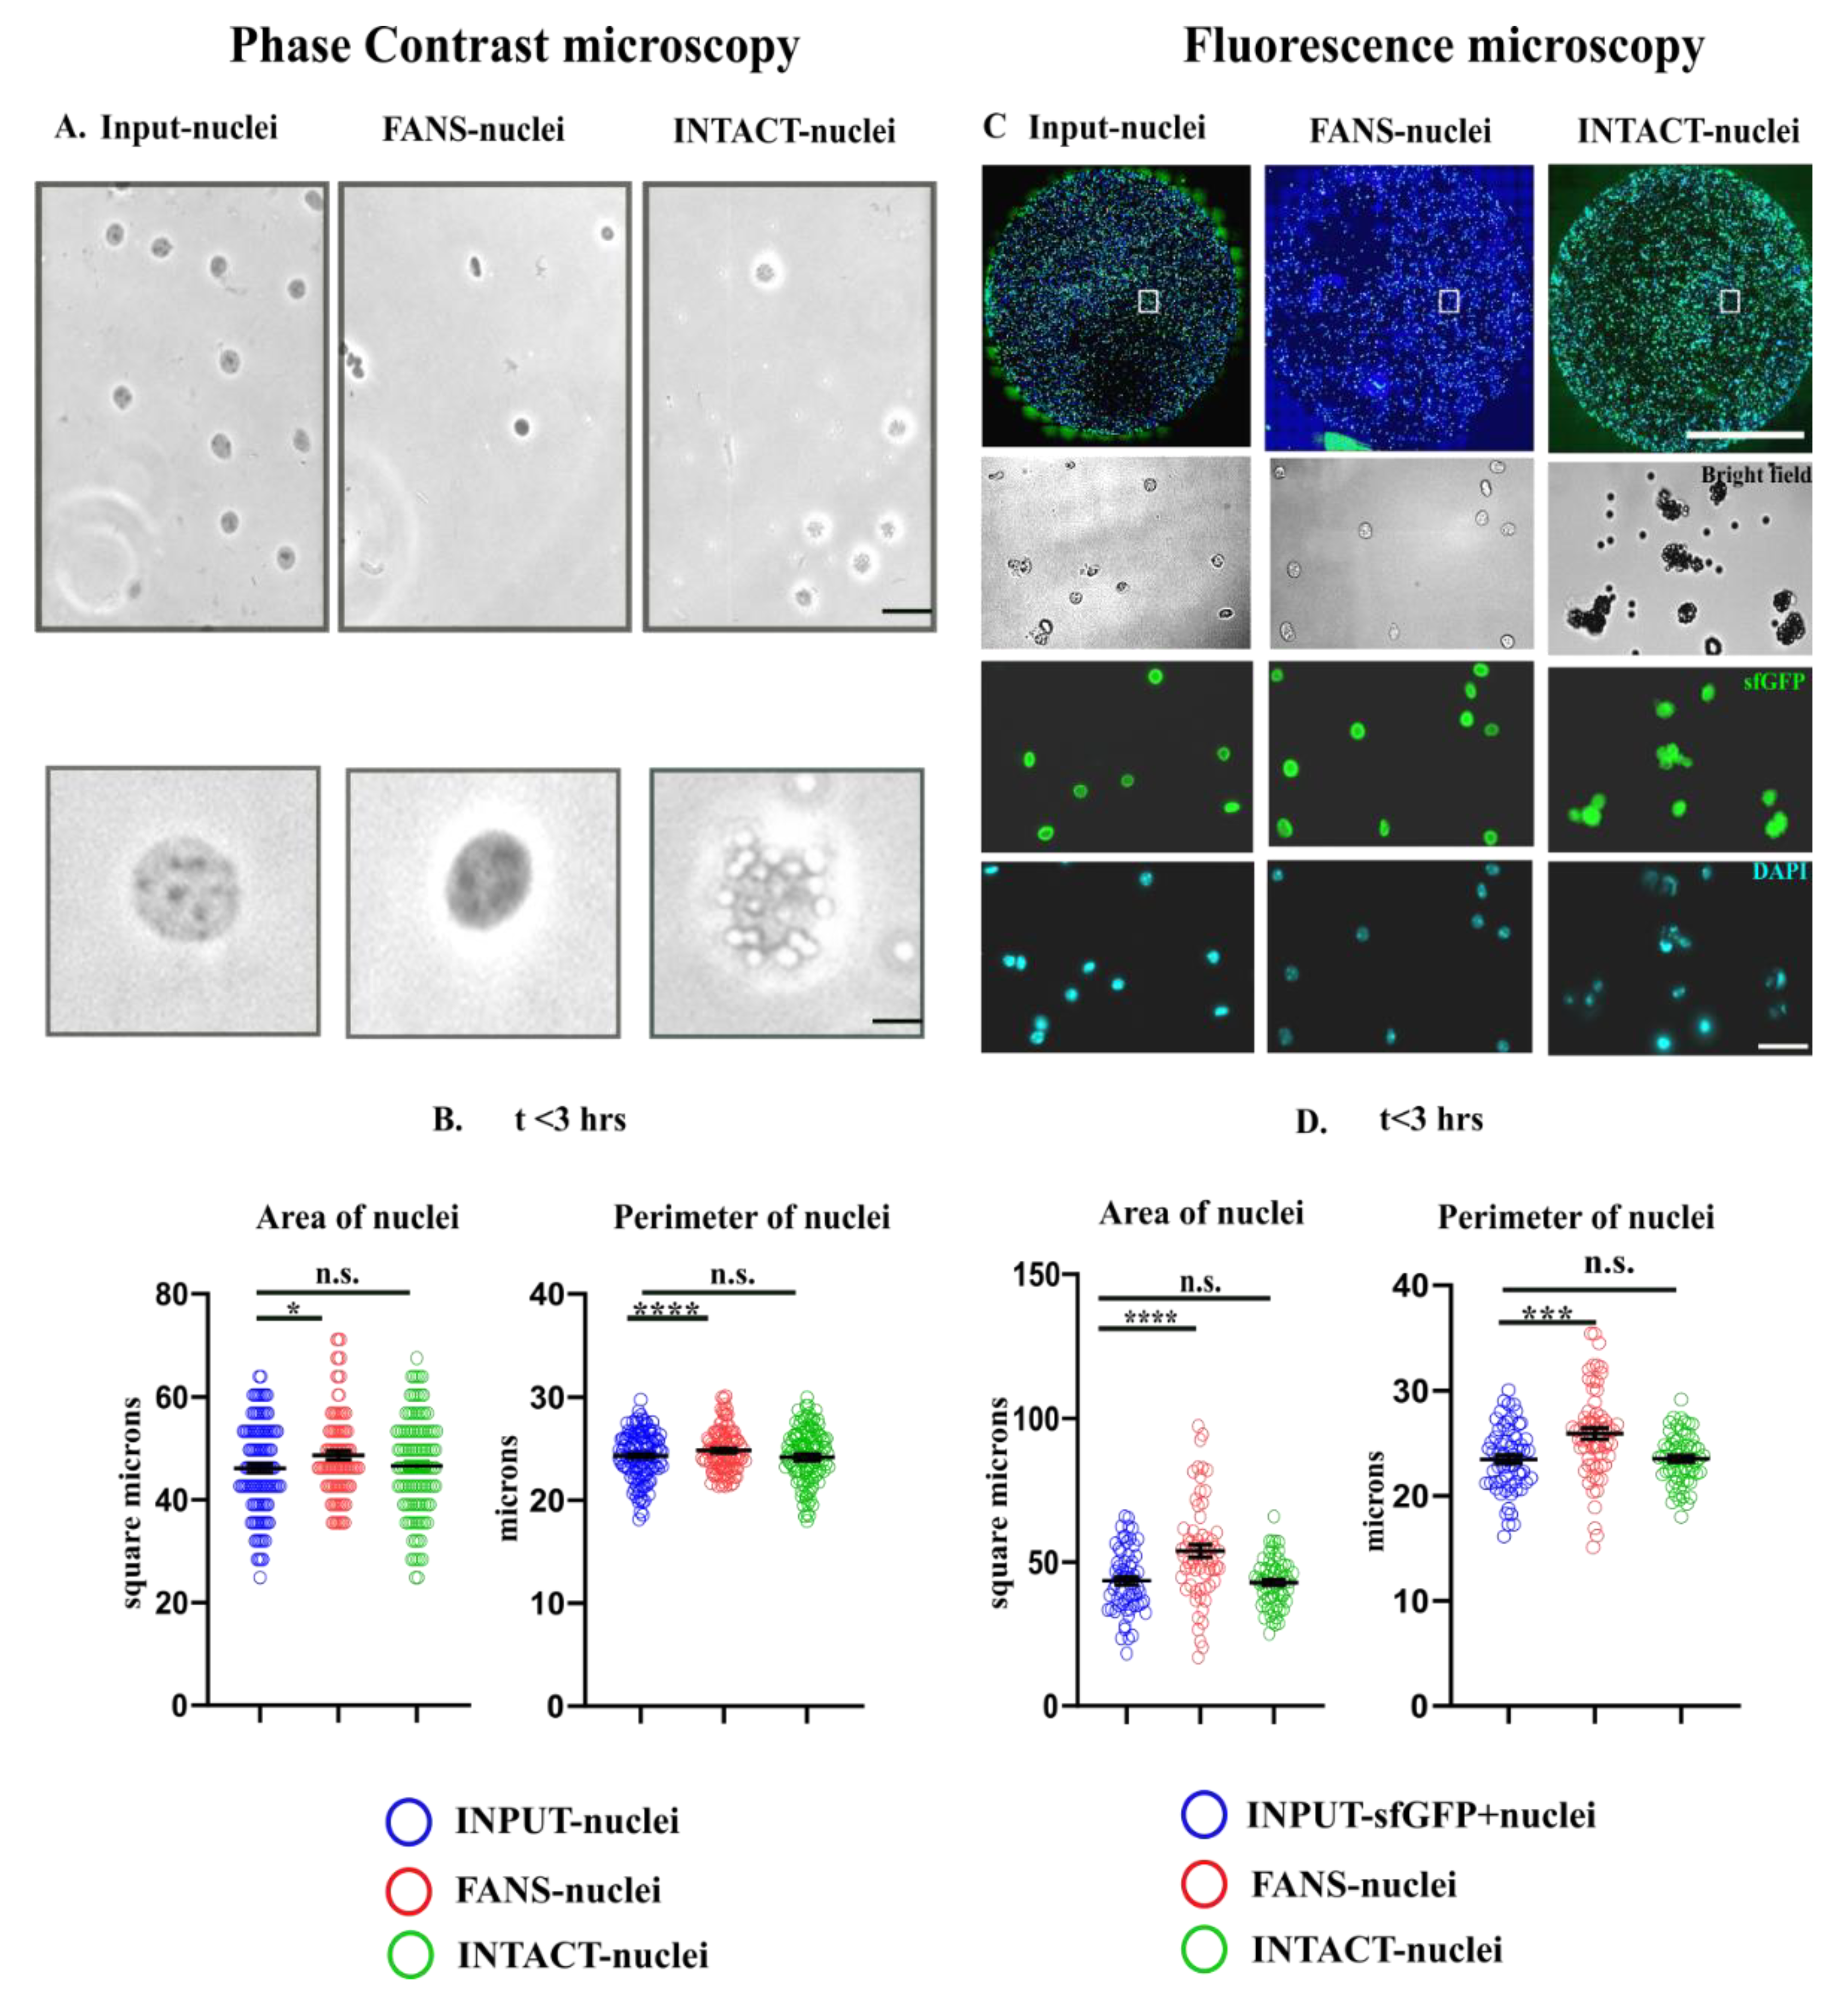
2.3. Quantification of Morphological Attributes: FANS- and INTACT-Nuclei in Comparison to INPUT-Nuclei
2.4. Structural and Optical Modifications Observed under Phase-Contrast Microscopy and Fluorescence Microscopy
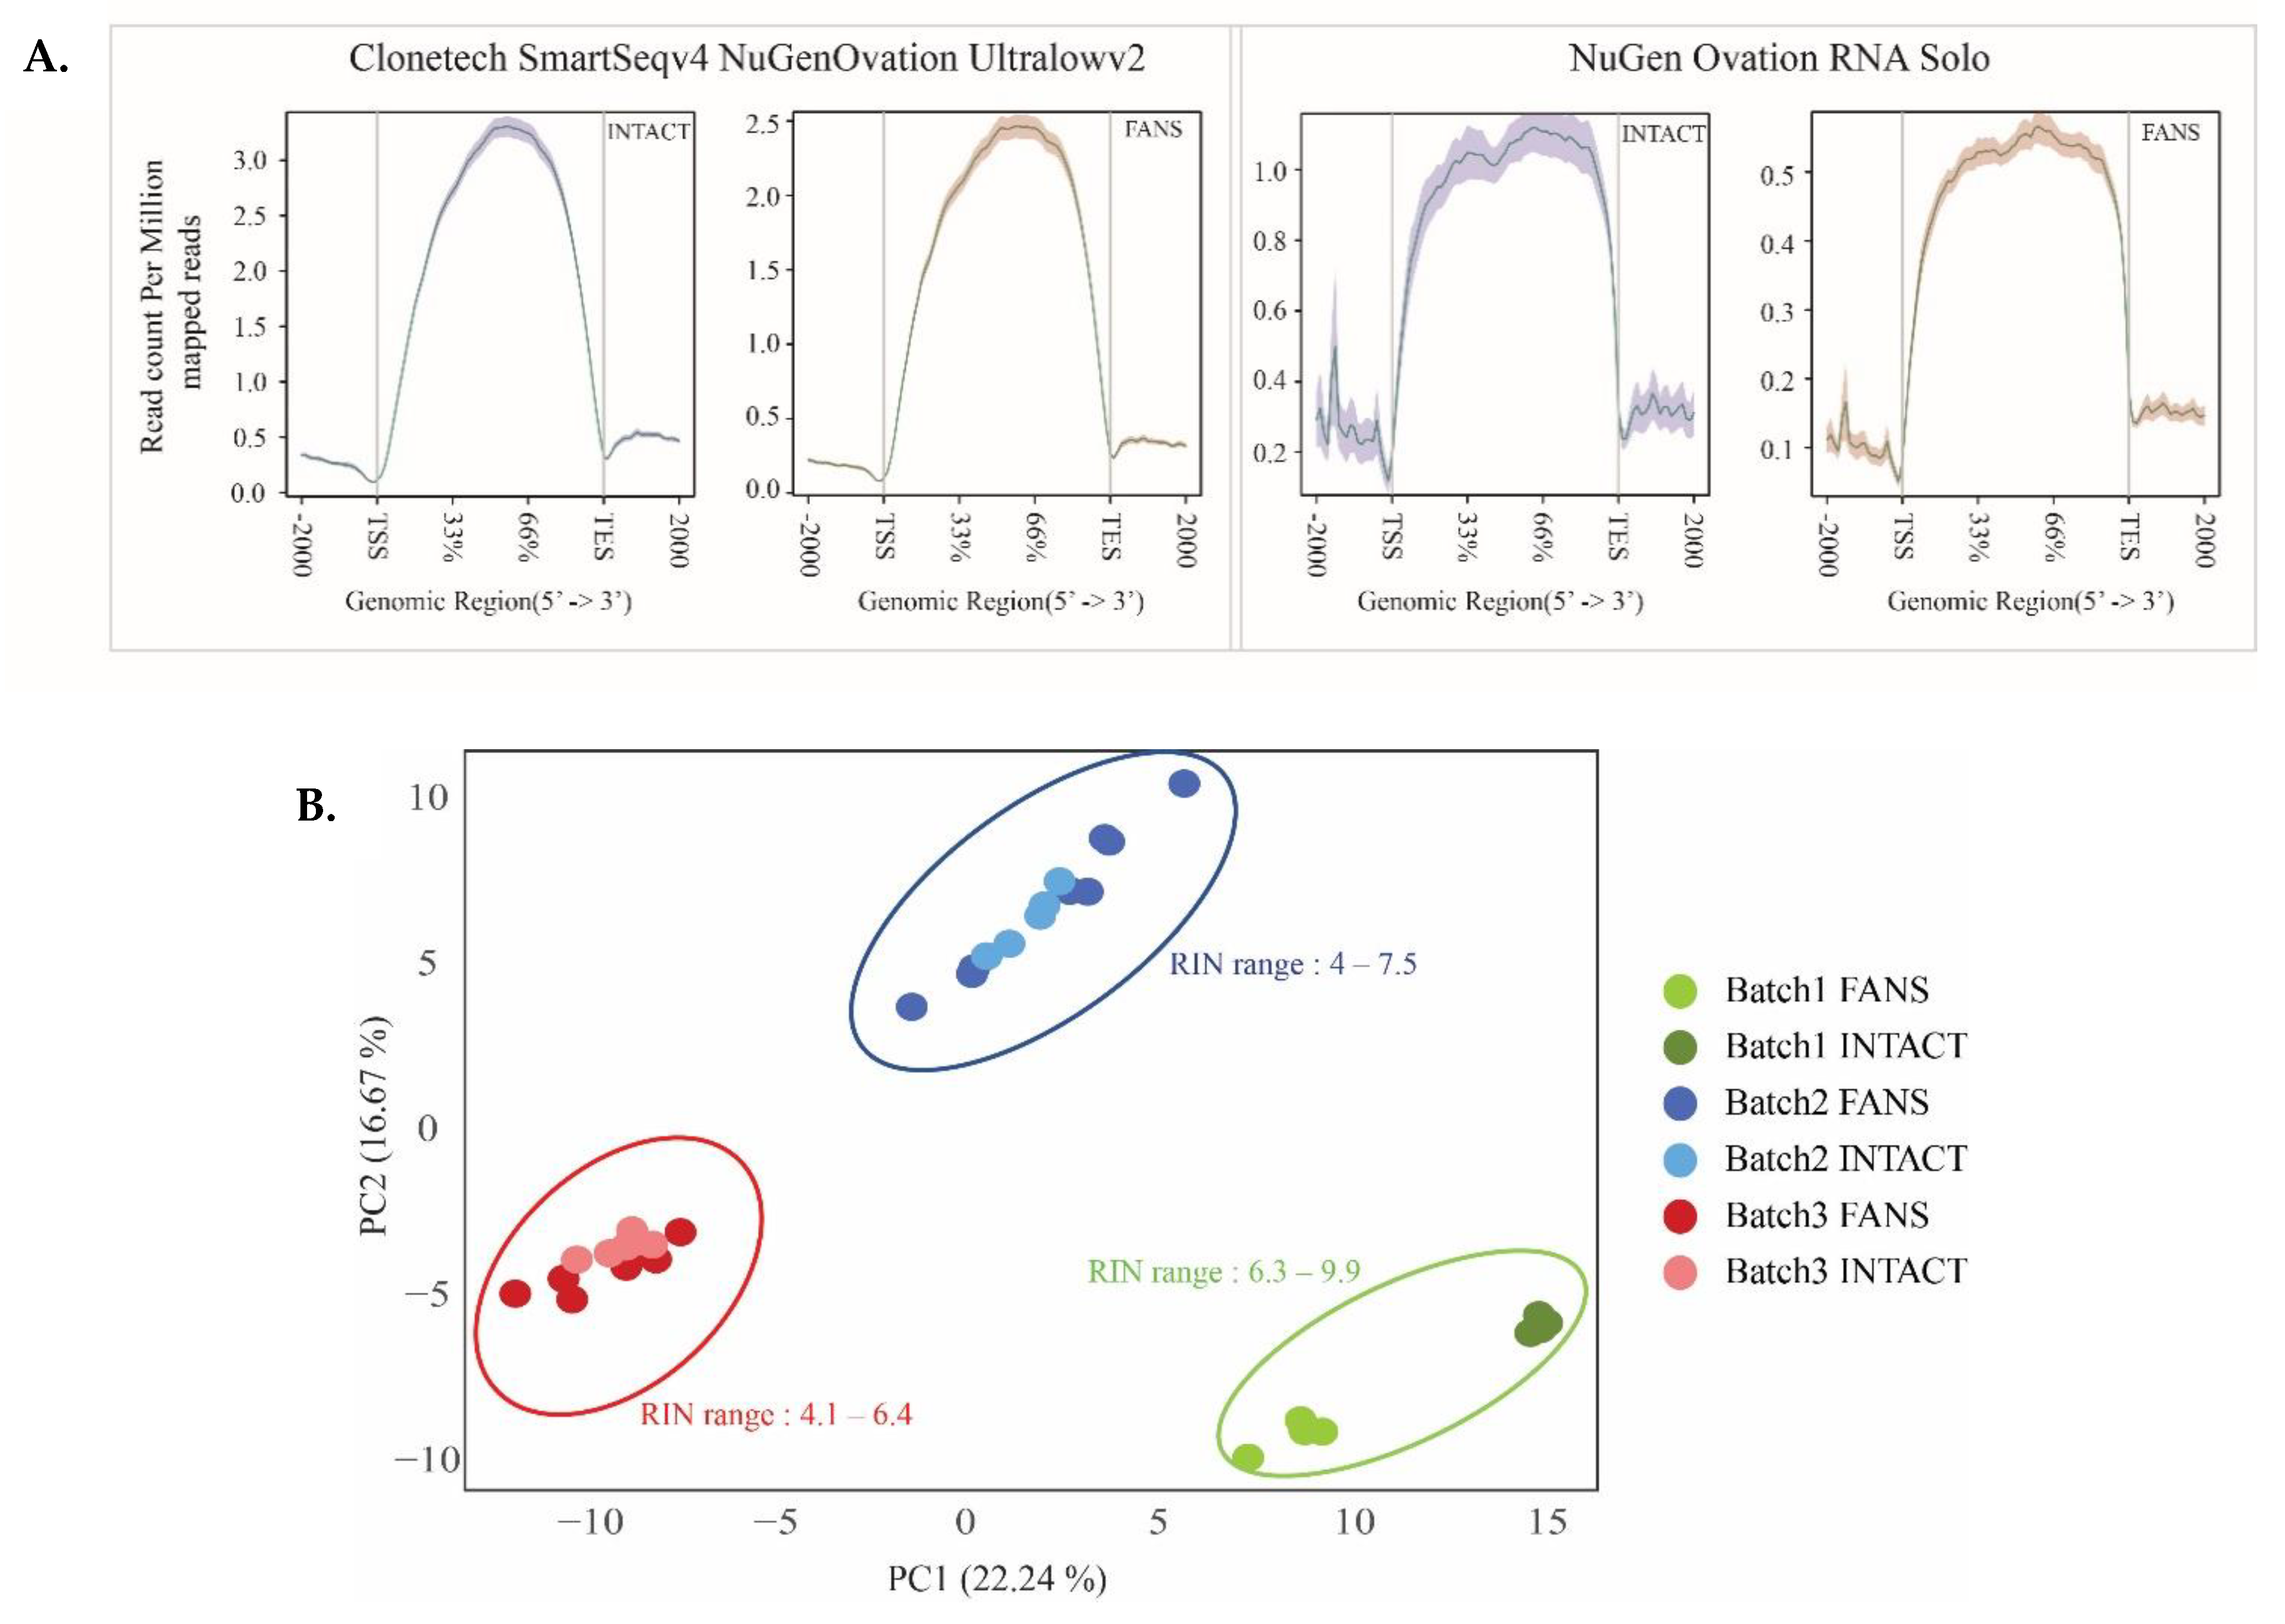
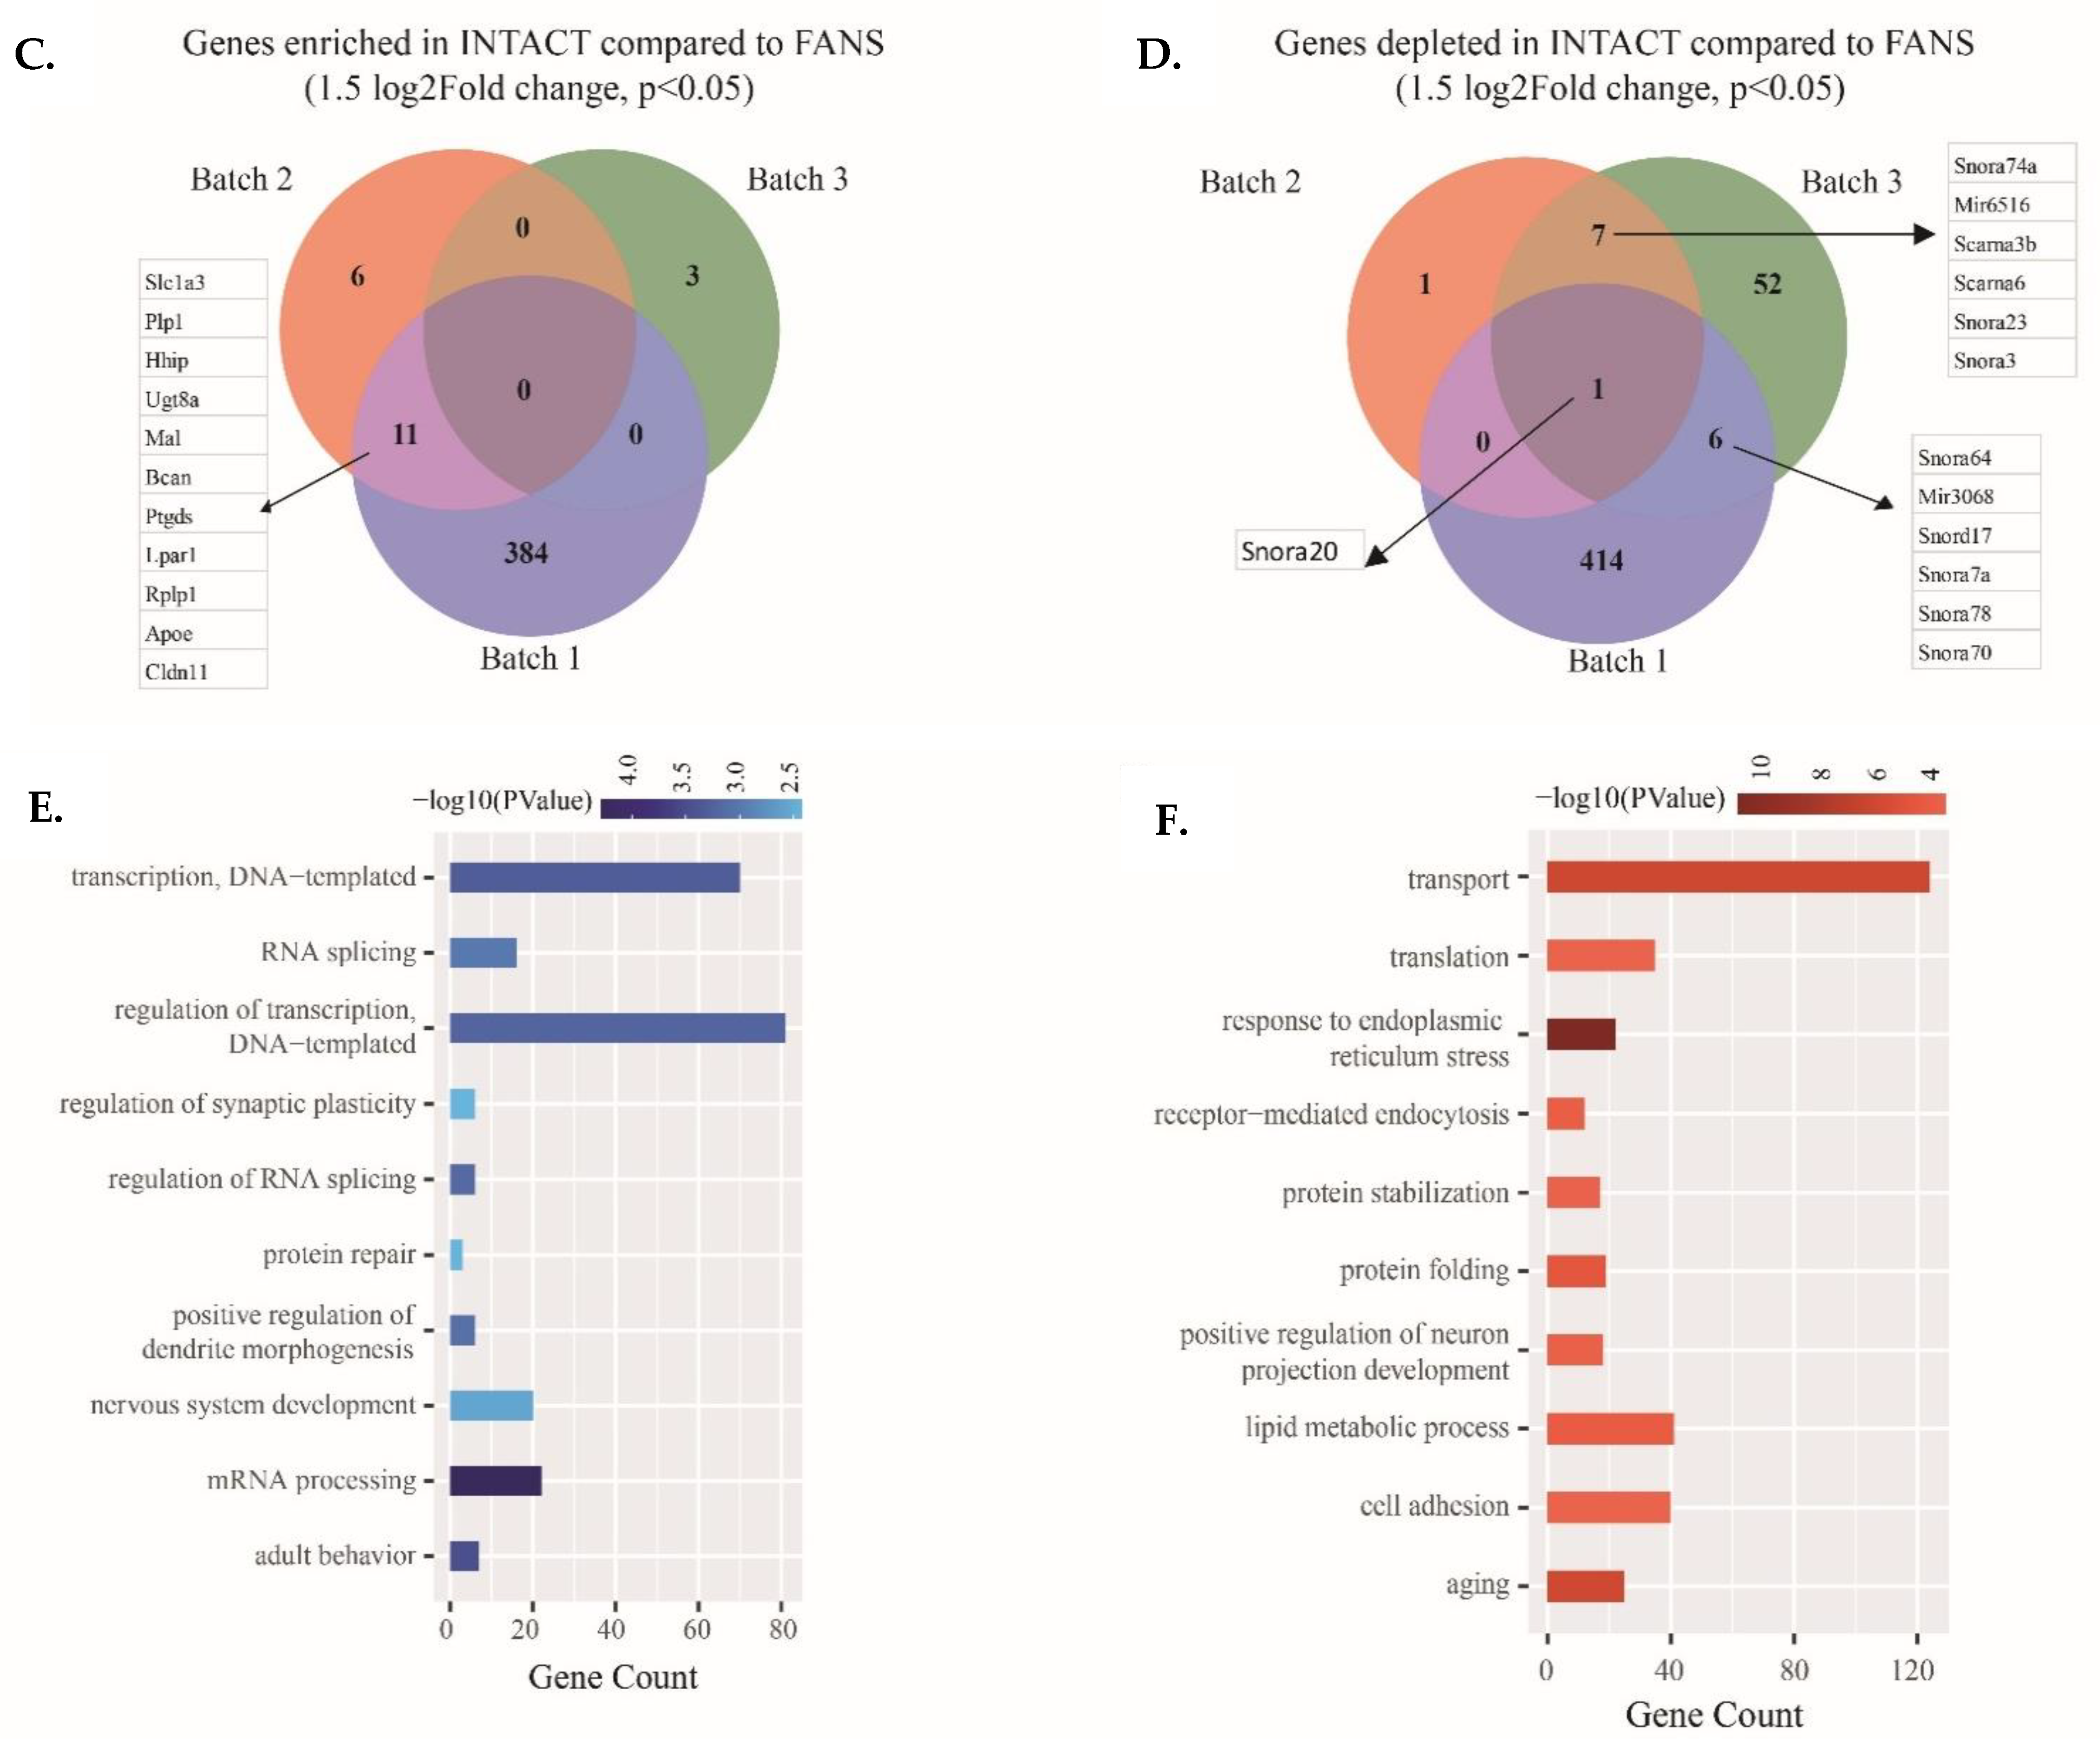
2.5. Transcriptional Differences of Low-Input RNA-Seq from FANS-Nuclei vs. INTACT-Nuclei
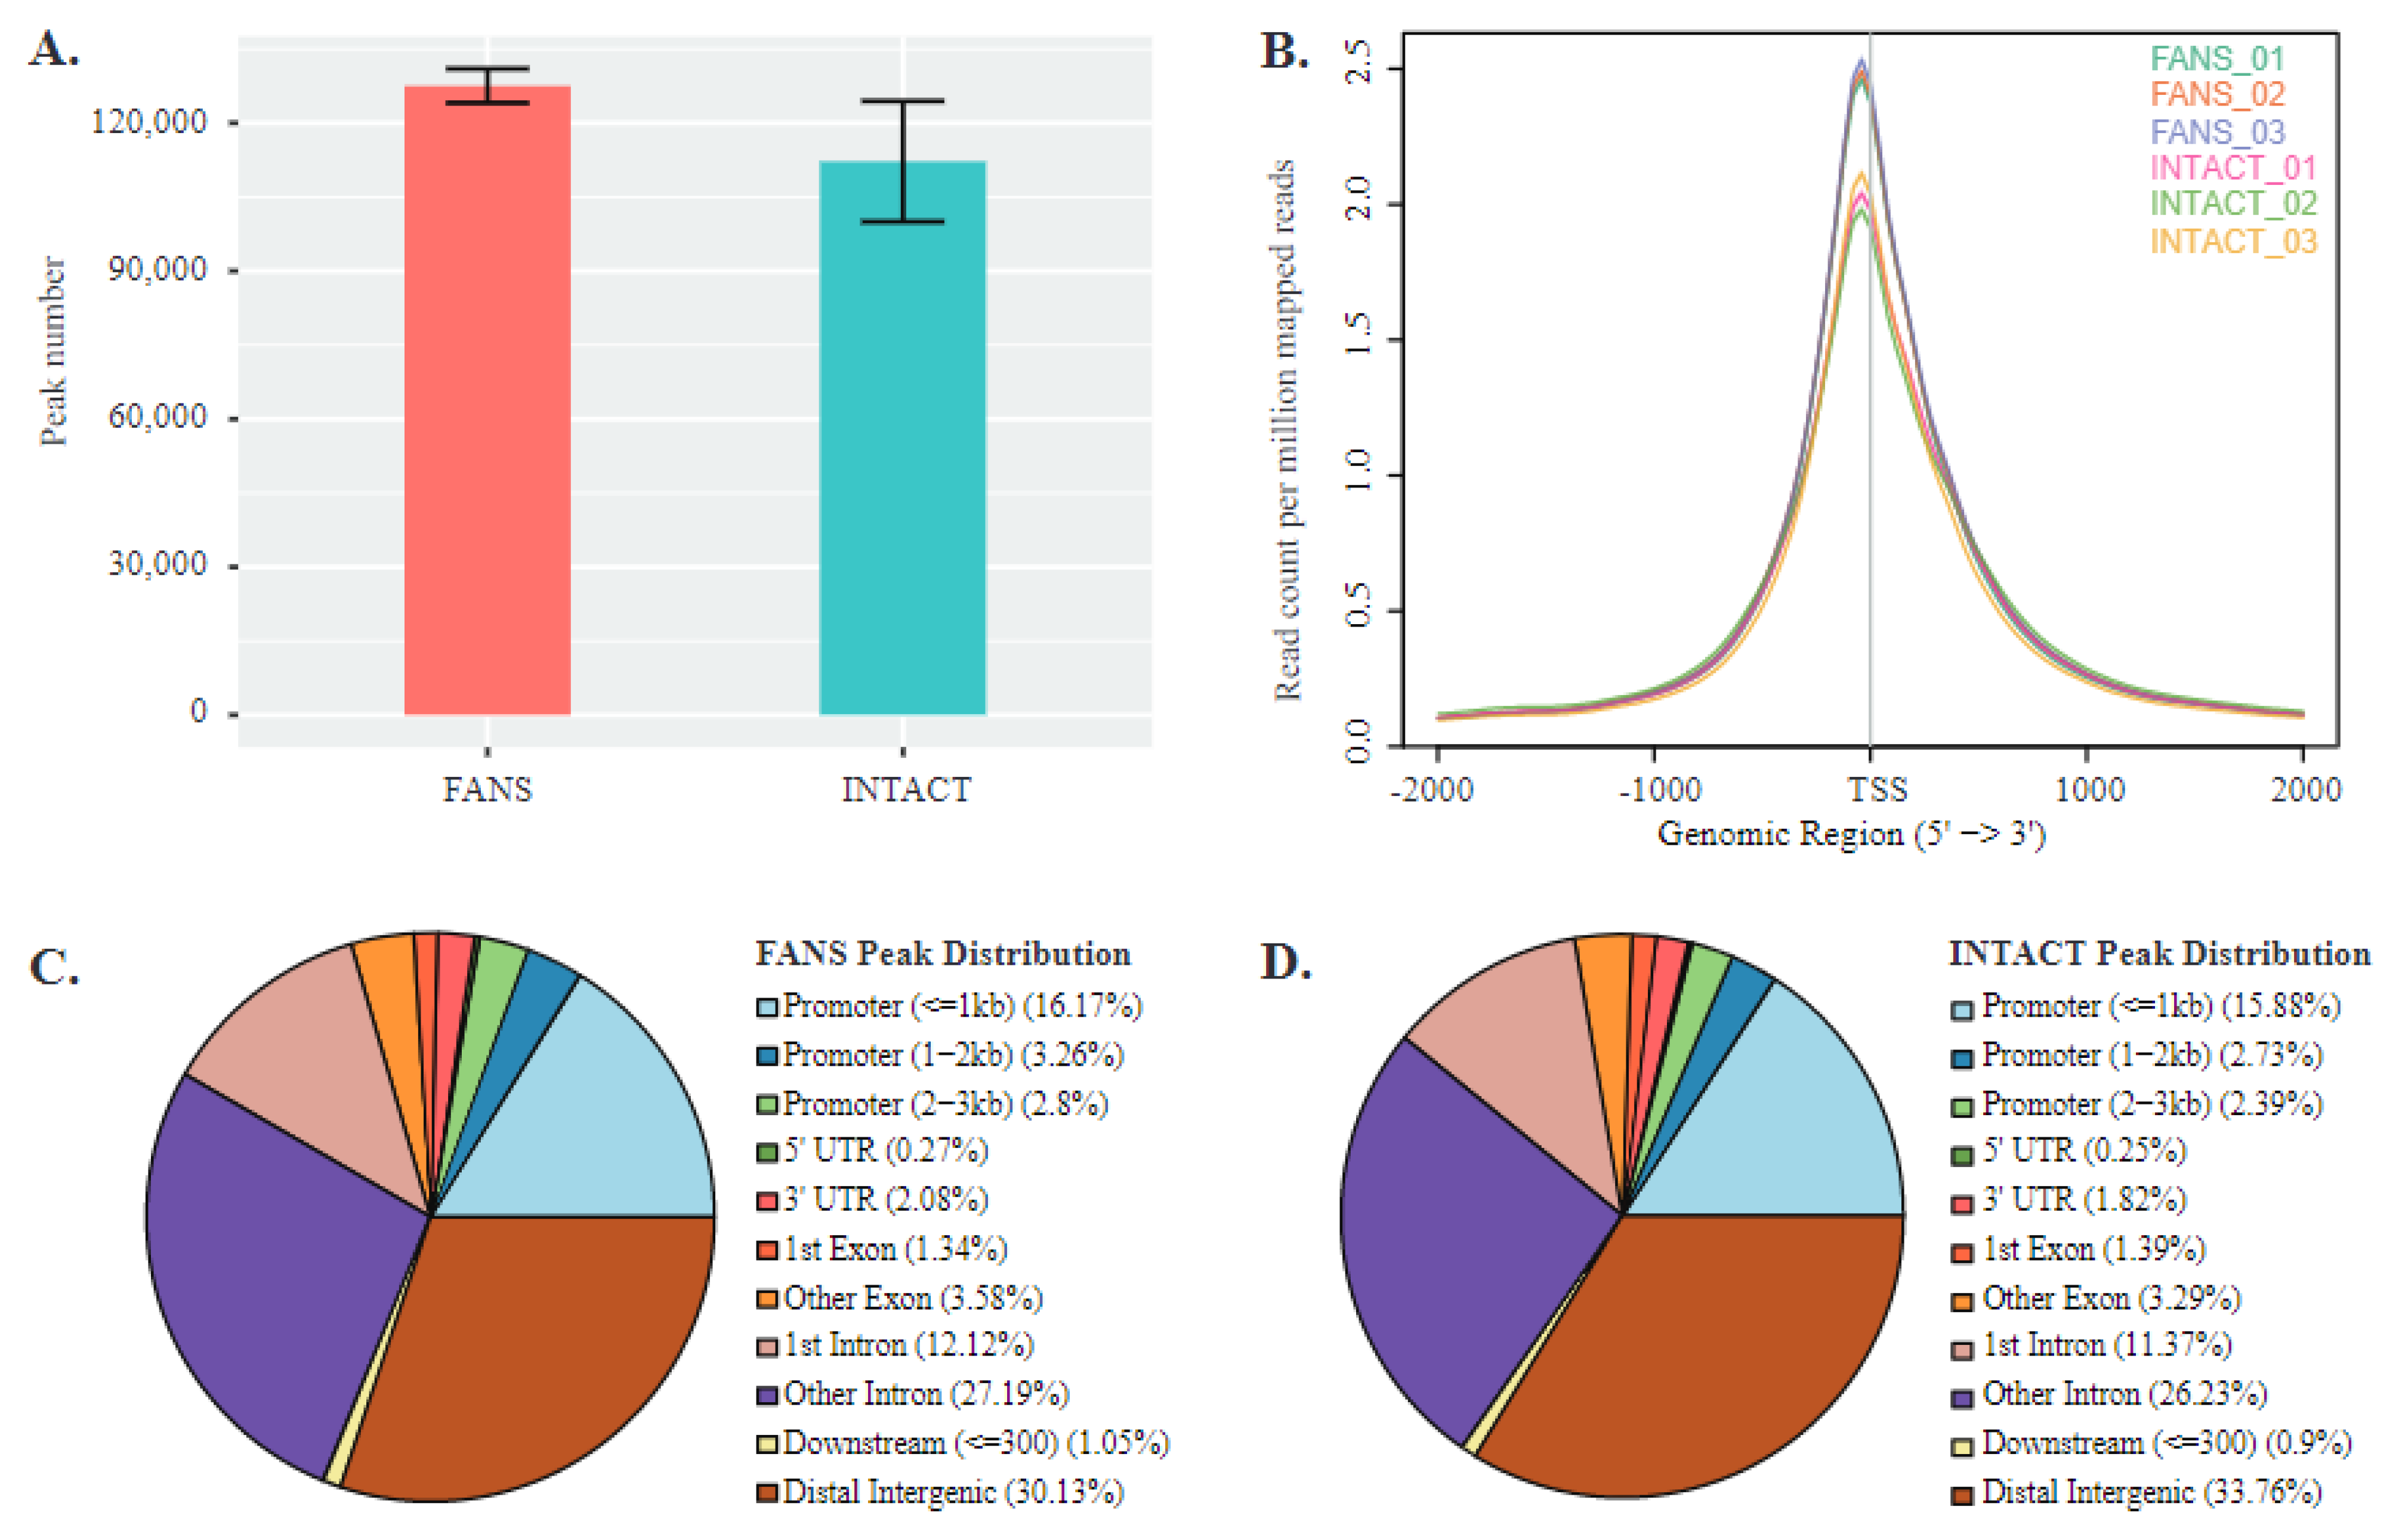
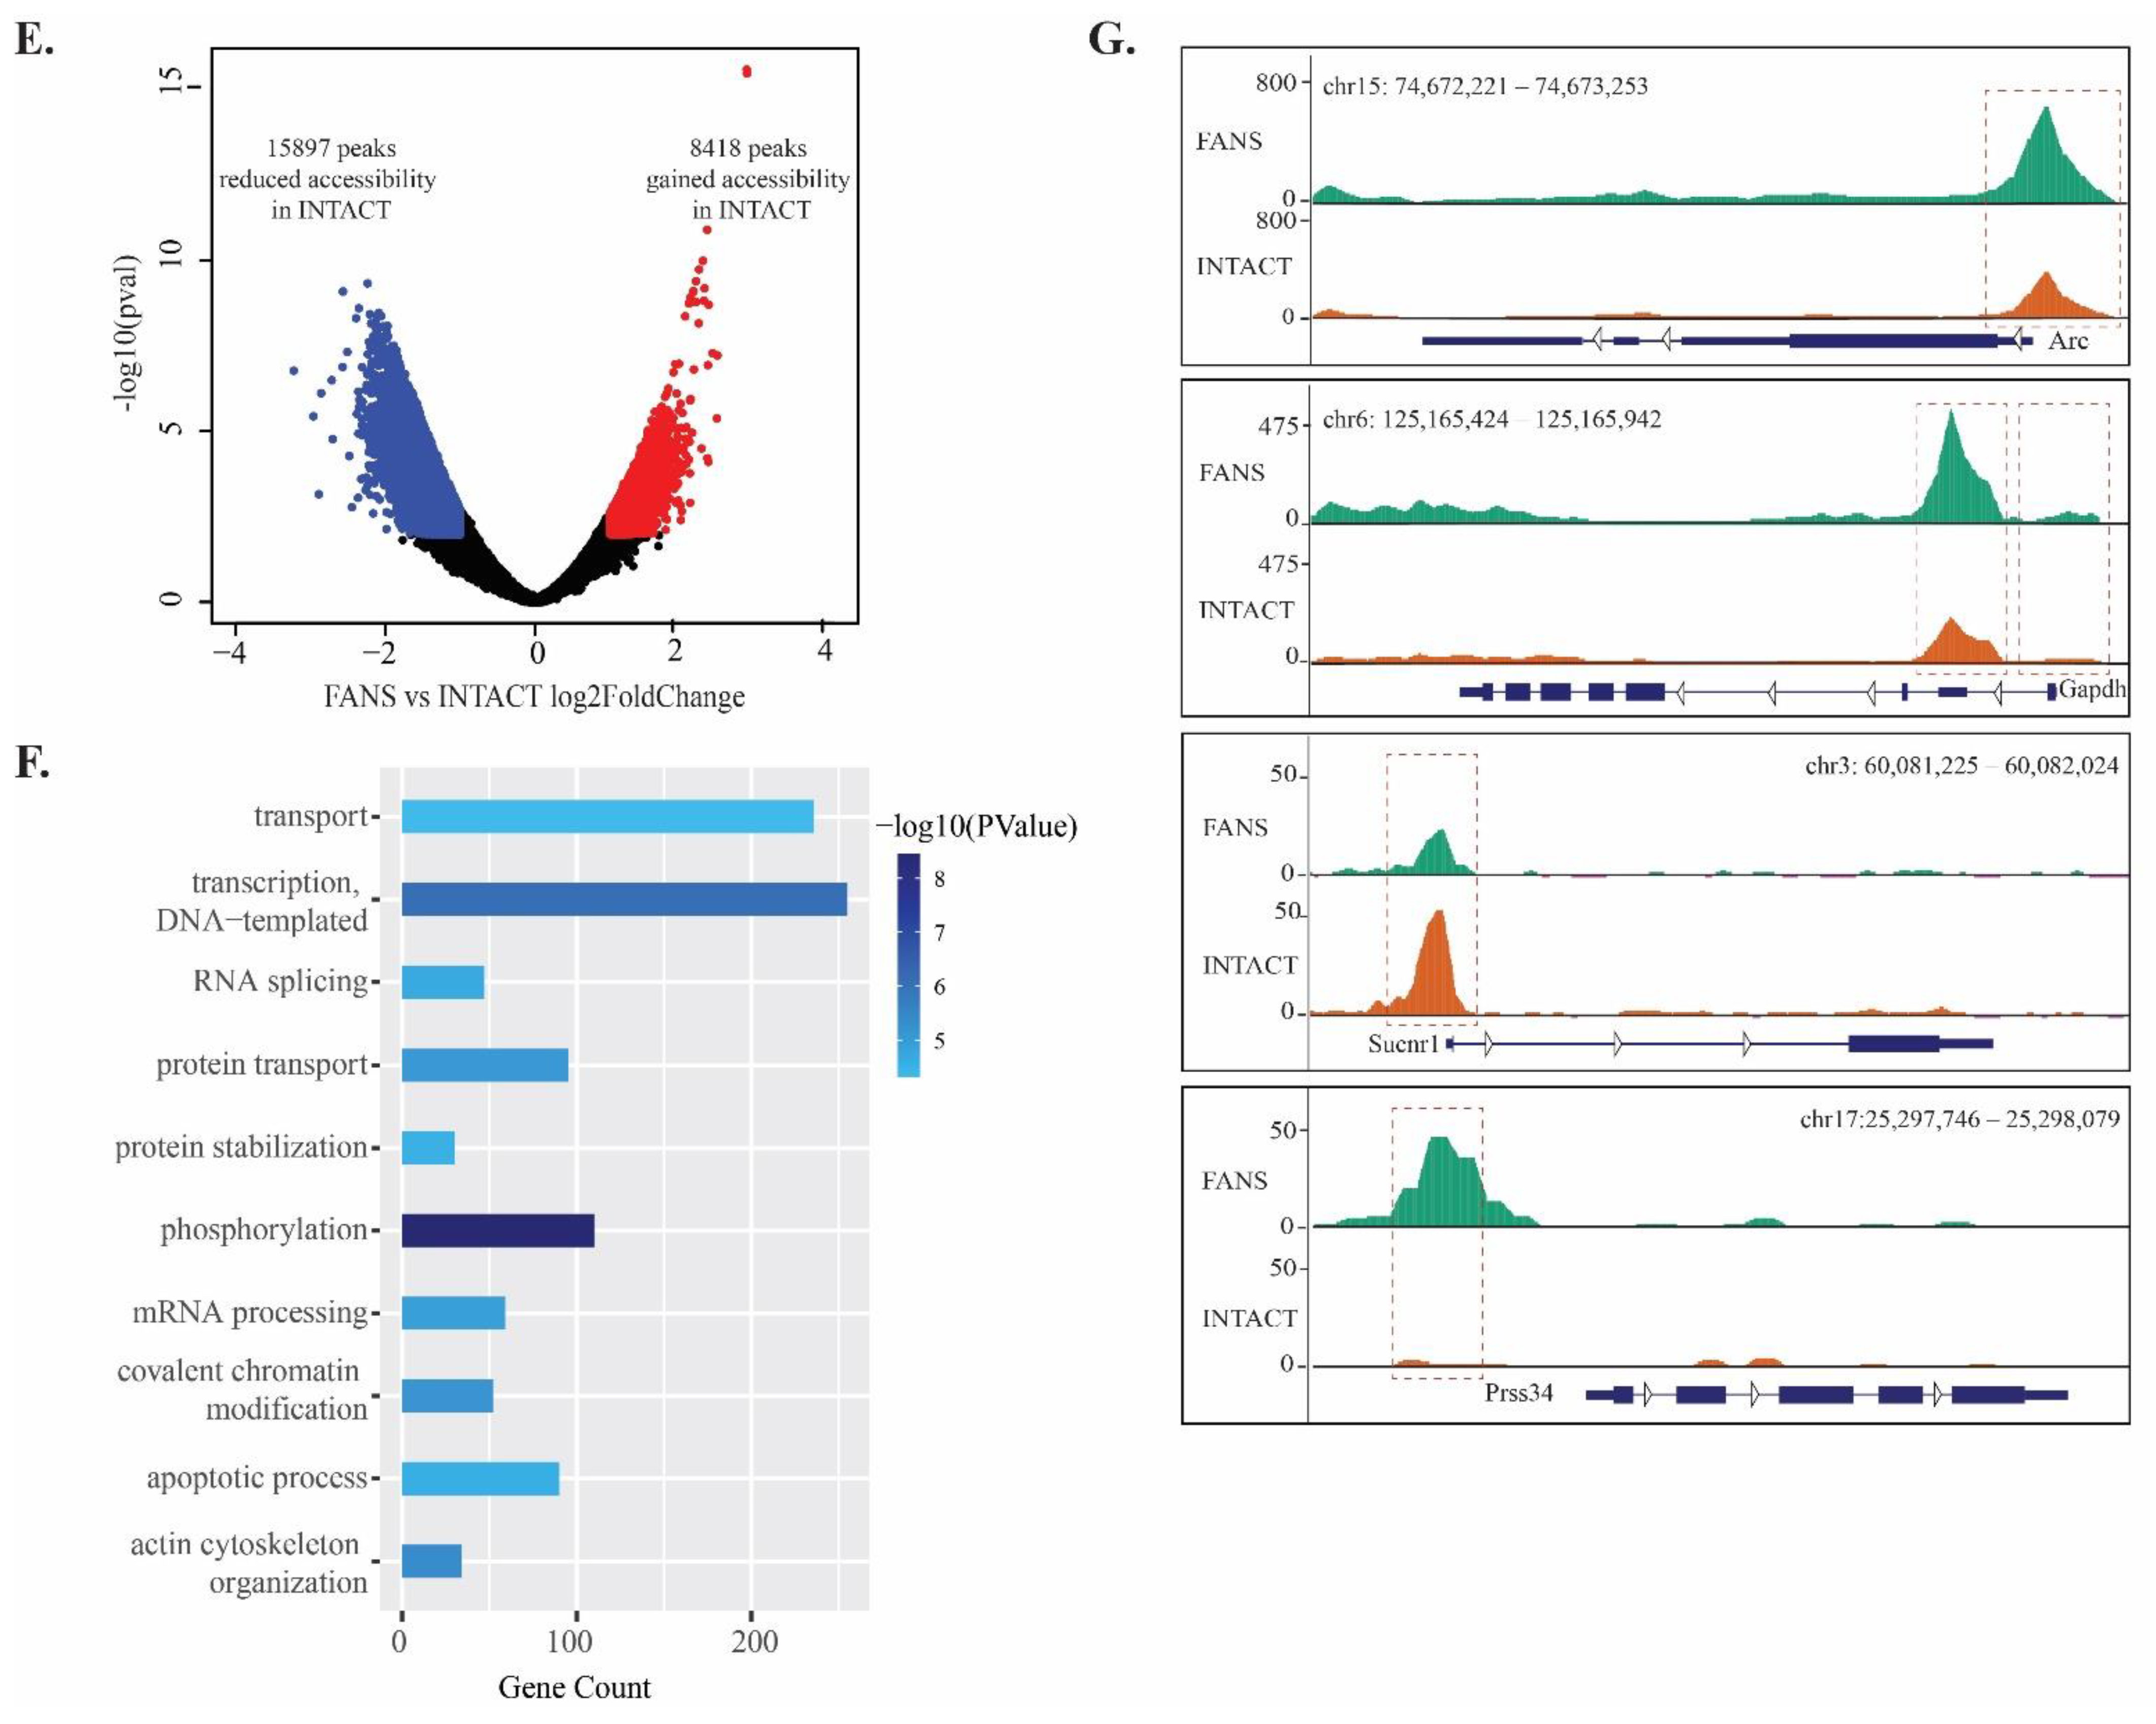
2.6. ATAC-Seq Reveals Differences in Chromatin Accessibility State between FANS- and INTACT-Nuclei
3. Discussion
3.1. Physiological Differences between INTACT- and FANS-Nuclei
3.2. Molecular Differences between FANS-and INTACT-Nuclei
4. Materials and Methods
4.1. Literature Review of INTACT FANS/FACS Studies
4.2. Animals and Ethics Statement
4.3. Tamoxifen Injection and Behavioral Experiments
4.4. Nuclei Isolation from Different Brain Regions
4.5. sfGFP Positive Nuclei Separation
4.5.1. INTACT
4.5.2. FANS
4.5.3. Purity Analysis of INTACT- and FANS-Nuclei
4.6. Parallel Processing of INTACT- and FANS-Nuclei
4.7. Microscopy
4.8. RNA Isolation and nucRNA-Seq Library Preparation
4.9. RNA-Seq Data Analysis
4.10. ATAC-Seq Library Preparation
4.11. ATAC-Seq Data Analysis
Supplementary Materials
Author Contributions
Funding
Institutional Review Board Statement
Informed Consent Statement
Data Availability Statement
Acknowledgments
Conflicts of Interest
References
- Handley, A.; Schauer, T.; Ladurner, A.G.; Margulies, C.E. Designing Cell-Type-Specific Genome-wide Experiments. Mol. Cell 2015, 58, 621–631. [Google Scholar] [CrossRef] [PubMed]
- Stuart, T.; Satija, R. Integrative single-cell analysis. Nat. Rev. Genet. 2019, 20, 257–272. [Google Scholar] [CrossRef] [PubMed]
- Krishnaswami, S.R.; Grindberg, R.V.; Novotny, M.; Venepally, P.; Lacar, B.; Bhutani, K.; Linker, S.B.; Pham, S.; Erwin, J.A.; Miller, J.A.; et al. Using single nuclei for RNA-seq to capture the transcriptome of postmortem neurons. Nat. Protoc. 2016, 11, 499–524. [Google Scholar] [CrossRef] [PubMed]
- Vembadi, A.; Menachery, A.; Qasaimeh, M.A. Cell Cytometry: Review and Perspective on Biotechnological Advances. Front. Bioeng. Biotechnol. 2019, 7, 147. [Google Scholar] [CrossRef] [PubMed]
- Julius, M.H.; Masuda, T.; Herzenberg, L.A. Demonstration that antigen-binding cells are precursors of antibody-producing cells after purification with a fluorescence-activated cell sorter. Proc. Natl. Acad. Sci. USA 1972, 69, 1934–1938. [Google Scholar] [CrossRef] [PubMed]
- Haenni, S.; Ji, Z.; Hoque, M.; Rust, N.; Sharpe, H.; Eberhard, R.; Browne, C.; Hengartner, M.O.; Mellor, J.; Tian, B.; et al. Analysis of C. elegans intestinal gene expression and polyadenylation by fluorescence-activated nuclei sorting and 3′-end-seq. Nucleic Acids Res. 2012, 40, 6304–6318. [Google Scholar] [CrossRef]
- Dammer, E.B.; Duong, D.M.; Diner, I.; Gearing, M.; Feng, Y.; Lah, J.J.; Levey, A.I.; Seyfried, N.T. Neuron enriched nuclear proteome isolated from human brain. J. Proteome Res. 2013, 12, 3193–3206. [Google Scholar] [CrossRef]
- Mo, A.; Mukamel, E.A.; Davis, F.P.; Luo, C.; Henry, G.L.; Picard, S.; Urich, M.A.; Nery, J.R.; Sejnowski, T.J.; Lister, R.; et al. Epigenomic Signatures of Neuronal Diversity in the Mammalian Brain. Neuron 2015, 86, 1369–1384. [Google Scholar] [CrossRef]
- Bohlen, C.J.; Bennett, F.C.; Bennett, M.L. Isolation and Culture of Microglia. Curr. Protoc. Immunol. 2019, 125, e70. [Google Scholar] [CrossRef]
- Box, A.; DeLay, M.; Tighe, S.; Chittur, S.V.; Bergeron, A.; Cochran, M.; Lopez, P.; Meyer, E.M.; Saluk, A.; Thornton, S.; et al. Evaluating the Effects of Cell Sorting on Gene Expression. J. Biomol. Tech. 2020, 31, 100–111. [Google Scholar] [CrossRef]
- Holt, L.M.; Olsen, M.L. Novel Applications of Magnetic Cell Sorting to Analyze Cell-Type Specific Gene and Protein Expression in the Central Nervous System. PLoS ONE 2016, 11, e0150290. [Google Scholar] [CrossRef]
- Llufrio, E.M.; Wang, L.; Naser, F.J.; Patti, G.J. Sorting cells alters their redox state and cellular metabolome. Redox Biol. 2018, 16, 381–387. [Google Scholar] [CrossRef]
- Binek, A.; Rojo, D.; Godzien, J.; Ruperez, F.J.; Nunez, V.; Jorge, I.; Ricote, M.; Vazquez, J.; Barbas, C. Flow Cytometry Has a Significant Impact on the Cellular Metabolome. J. Proteome Res. 2019, 18, 169–181. [Google Scholar] [CrossRef] [PubMed]
- Andra, I.; Ulrich, H.; Durr, S.; Soll, D.; Henkel, L.; Angerpointner, C.; Ritter, J.; Przibilla, S.; Stadler, H.; Effenberger, M.; et al. An Evaluation of T-Cell Functionality After Flow Cytometry Sorting Revealed p38 MAPK Activation. Cytom. A 2020, 97, 171–183. [Google Scholar] [CrossRef]
- Deal, R.B.; Henikoff, S. A simple method for gene expression and chromatin profiling of individual cell types within a tissue. Dev. Cell 2010, 18, 1030–1040. [Google Scholar] [CrossRef]
- Henry, G.L.; Davis, F.P.; Picard, S.; Eddy, S.R. Cell type-specific genomics of Drosophila neurons. Nucleic Acids Res. 2012, 40, 9691–9704. [Google Scholar] [CrossRef] [PubMed]
- Steiner, F.A.; Talbert, P.B.; Kasinathan, S.; Deal, R.B.; Henikoff, S. Cell-type-specific nuclei purification from whole animals for genome-wide expression and chromatin profiling. Genome Res. 2012, 22, 766–777. [Google Scholar] [CrossRef] [PubMed]
- Stroud, H.; Su, S.C.; Hrvatin, S.; Greben, A.W.; Renthal, W.; Boxer, L.D.; Nagy, M.A.; Hochbaum, D.R.; Kinde, B.; Gabel, H.W.; et al. Early-Life Gene Expression in Neurons Modulates Lasting Epigenetic States. Cell 2017, 171, 1151–1164 e1116. [Google Scholar] [CrossRef]
- Hrvatin, S.; Tzeng, C.P.; Nagy, M.A.; Stroud, H.; Koutsioumpa, C.; Wilcox, O.F.; Assad, E.G.; Green, J.; Harvey, C.D.; Griffith, E.C.; et al. A scalable platform for the development of cell-type-specific viral drivers. Elife 2019, 8. [Google Scholar] [CrossRef]
- Mo, A.; Luo, C.; Davis, F.P.; Mukamel, E.A.; Henry, G.L.; Nery, J.R.; Urich, M.A.; Picard, S.; Lister, R.; Eddy, S.R.; et al. Epigenomic landscapes of retinal rods and cones. Elife 2016, 5, e11613. [Google Scholar] [CrossRef]
- Kuboyama, T.; Wahane, S.; Huang, Y.; Zhou, X.; Wong, J.K.; Koemeter-Cox, A.; Martini, M.; Friedel, R.H.; Zou, H. HDAC3 inhibition ameliorates spinal cord injury by immunomodulation. Sci. Rep. 2017, 7, 8641. [Google Scholar] [CrossRef] [PubMed]
- Sharma, N.; Pollina, E.A.; Nagy, M.A.; Yap, E.L.; Di Biase, F.A.; Hrvatin, S.; Hu, L.; Lin, C.; Greenberg, M.E. ARNT2 Tunes Activity-Dependent Gene Expression through NCoR2-Mediated Repression and NPAS4-Mediated Activation. Neuron 2019, 102, 390–406 e399. [Google Scholar] [CrossRef] [PubMed]
- Monroe, T.O.; Hill, M.C.; Morikawa, Y.; Leach, J.P.; Heallen, T.; Cao, S.; Krijger, P.H.L.; de Laat, W.; Wehrens, X.H.T.; Rodney, G.G.; et al. YAP Partially Reprograms Chromatin Accessibility to Directly Induce Adult Cardiogenesis In Vivo. Dev. Cell 2019, 48, 765–779 e767. [Google Scholar] [CrossRef] [PubMed]
- Zhang, M.; Hill, M.C.; Kadow, Z.A.; Suh, J.H.; Tucker, N.R.; Hall, A.W.; Tran, T.T.; Swinton, P.S.; Leach, J.P.; Margulies, K.B.; et al. Long-range Pitx2c enhancer-promoter interactions prevent predisposition to atrial fibrillation. Proc. Natl. Acad. Sci. USA 2019, 116, 22692–22698. [Google Scholar] [CrossRef] [PubMed]
- Bhattacharyya, S.; Sathe, A.A.; Bhakta, M.; Xing, C.; Munshi, N.V. PAN-INTACT enables direct isolation of lineage-specific nuclei from fibrous tissues. PLoS ONE 2019, 14, e0214677. [Google Scholar] [CrossRef] [PubMed]
- Wang, A.W.; Wang, Y.J.; Zahm, A.M.; Morgan, A.R.; Wangensteen, K.J.; Kaestner, K.H. The Dynamic Chromatin Architecture of the Regenerating Liver. Cell Mol. Gastroenterol. Hepatol. 2020, 9, 121–143. [Google Scholar] [CrossRef] [PubMed]
- Wang, A.W.; Wangensteen, K.J.; Wang, Y.J.; Zahm, A.M.; Moss, N.G.; Erez, N.; Kaestner, K.H. TRAP-seq identifies cystine/glutamate antiporter as a driver of recovery from liver injury. J. Clin. Investig. 2018, 128, 2297–2309. [Google Scholar] [CrossRef]
- Chongtham, M.C.; Todorov, H.; Wettschereck, J.E.; Gerber, S.; Winter, J. Isolation of nuclei and downstream processing of cell-type-specific nuclei from micro-dissected mouse brain regions–techniques and caveats. bioRxiv. 2020. [Google Scholar] [CrossRef]
- Denny, C.A.; Kheirbek, M.A.; Alba, E.L.; Tanaka, K.F.; Brachman, R.A.; Laughman, K.B.; Tomm, N.K.; Turi, G.F.; Losonczy, A.; Hen, R. Hippocampal memory traces are differentially modulated by experience, time, and adult neurogenesis. Neuron 2014, 83, 189–201. [Google Scholar] [CrossRef]
- Krishnan, V.; Han, M.H.; Graham, D.L.; Berton, O.; Renthal, W.; Russo, S.J.; Laplant, Q.; Graham, A.; Lutter, M.; Lagace, D.C.; et al. Molecular adaptations underlying susceptibility and resistance to social defeat in brain reward regions. Cell 2007, 131, 391–404. [Google Scholar] [CrossRef]
- Young, I.T.; Verbeek, P.W.; Mayall, B.H. Characterization of chromatin distribution in cell nuclei. Cytometry 1986, 7, 467–474. [Google Scholar] [CrossRef] [PubMed]
- Dahl, K.N.; Ribeiro, A.J.; Lammerding, J. Nuclear shape, mechanics, and mechanotransduction. Circ. Res. 2008, 102, 1307–1318. [Google Scholar] [CrossRef]
- Webster, M.; Witkin, K.L.; Cohen-Fix, O. Sizing up the nucleus: Nuclear shape, size and nuclear-envelope assembly. J. Cell Sci. 2009, 122, 1477–1486. [Google Scholar] [CrossRef] [PubMed]
- Schreiner, S.M.; Koo, P.K.; Zhao, Y.; Mochrie, S.G.; King, M.C. The tethering of chromatin to the nuclear envelope supports nuclear mechanics. Nat. Commun. 2015, 6, 7159. [Google Scholar] [CrossRef]
- Stephens, A.D.; Banigan, E.J.; Adam, S.A.; Goldman, R.D.; Marko, J.F. Chromatin and lamin A determine two different mechanical response regimes of the cell nucleus. Mol. Biol. Cell 2017, 28, 1984–1996. [Google Scholar] [CrossRef]
- Todorov, H.; Searle-White, E.; Gerber, S. Applying univariate vs. multivariate statistics to investigate therapeutic efficacy in (pre)clinical trials: A Monte Carlo simulation study on the example of a controlled preclinical neurotrauma trial. PLoS ONE 2020, 15, e0230798. [Google Scholar] [CrossRef]
- Buenrostro, J.D.; Giresi, P.G.; Zaba, L.C.; Chang, H.Y.; Greenleaf, W.J. Transposition of native chromatin for fast and sensitive epigenomic profiling of open chromatin, DNA-binding proteins and nucleosome position. Nat. Methods 2013, 10, 1213–1218. [Google Scholar] [CrossRef] [PubMed]
- Benner, C.; Konovalov, S.; Mackintosh, C.; Hutt, K.R.; Stunnenberg, R.; Garcia-Bassets, I. Decoding a Signature-Based Model of Transcription Cofactor Recruitment Dictated by Cardinal Cis-Regulatory Elements in Proximal Promoter Regions. PLoS Genet. 2013, 9, 1003906. [Google Scholar] [CrossRef] [PubMed]
- Kozlenkov, A.; Wang, M.; Roussos, P.; Rudchenko, S.; Barbu, M.; Bibikova, M.; Klotzle, B.; Dwork, A.J.; Zhang, B.; Hurd, Y.L.; et al. Substantial DNA methylation differences between two major neuronal subtypes in human brain. Nucleic Acids Res. 2016, 44, 2593–2612. [Google Scholar] [CrossRef]
- Johnson, B.S.; Zhao, Y.T.; Fasolino, M.; Lamonica, J.M.; Kim, Y.J.; Georgakilas, G.; Wood, K.H.; Bu, D.; Cui, Y.; Goffin, D.; et al. Biotin tagging of MeCP2 in mice reveals contextual insights into the Rett syndrome transcriptome. Nat. Med. 2017, 23, 1203–1214. [Google Scholar] [CrossRef]
- Xu, X.; Stoyanova, E.I.; Lemiesz, A.E.; Xing, J.; Mash, D.C.; Heintz, N. Species and cell-type properties of classically defined human and rodent neurons and glia. Elife 2018, 7. [Google Scholar] [CrossRef]
- Inoue, F.; Eckalbar, W.L.; Wang, Y.; Murphy, K.K.; Matharu, N.; Vaisse, C.; Ahituv, N. Genomic and epigenomic mapping of leptin-responsive neuronal populations involved in body weight regulation. Nat. Metab. 2019, 1, 475–484. [Google Scholar] [CrossRef]
- MacKay, H.; Scott, C.A.; Duryea, J.D.; Baker, M.S.; Laritsky, E.; Elson, A.E.; Garland, T.; Fiorotto, M.L., Jr.; Chen, R.; Li, Y.; et al. DNA methylation in AgRP neurons regulates voluntary exercise behavior in mice. Nat. Commun. 2019, 10, 5364. [Google Scholar] [CrossRef]
- Lima, A.F.; May, G.; Diaz-Colunga, J.; Pedreiro, S.; Paiva, A.; Ferreira, L.; Enver, T.; Iborra, F.J.; Pires das Neves, R. Osmotic modulation of chromatin impacts on efficiency and kinetics of cell fate modulation. Sci. Rep. 2018, 8, 7210. [Google Scholar] [CrossRef] [PubMed]
- Strober, W. Trypan blue exclusion test of cell viability. Curr. Protoc. Immunol. 1997, 21, A-3B. [Google Scholar] [CrossRef]
- Zhu, K.; Didier, A.; Dietrich, R.; Heilkenbrinker, U.; Waltenberger, E.; Jessberger, N.; Martlbauer, E.; Benz, R. Formation of small transmembrane pores: An intermediate stage on the way to Bacillus cereus non-hemolytic enterotoxin (Nhe) full pores in the absence of NheA. Biochem. Biophys. Res. Commun. 2016, 469, 613–618. [Google Scholar] [CrossRef] [PubMed]
- Birch, D.; Christensen, M.V.; Staerk, D.; Franzyk, H.; Nielsen, H.M. Stereochemistry as a determining factor for the effect of a cell-penetrating peptide on cellular viability and epithelial integrity. Biochem. J. 2018, 475, 1773–1788. [Google Scholar] [CrossRef] [PubMed]
- Barthelson, R.A.; Lambert, G.M.; Vanier, C.; Lynch, R.M.; Galbraith, D.W. Comparison of the contributions of the nuclear and cytoplasmic compartments to global gene expression in human cells. BMC Genom. 2007, 8, 340. [Google Scholar] [CrossRef]
- Solnestam, B.W.; Stranneheim, H.; Hallman, J.; Kaller, M.; Lundberg, E.; Lundeberg, J.; Akan, P. Comparison of total and cytoplasmic mRNA reveals global regulation by nuclear retention and miRNAs. BMC Genom. 2012, 13, 574. [Google Scholar] [CrossRef]
- Price, A.J.; Hwang, T.; Tao, R.; Burke, E.E.; Rajpurohit, A.; Shin, J.H.; Hyde, T.M.; Kleinman, J.E.; Jaffe, A.E.; Weinberger, D.R. Characterizing the nuclear and cytoplasmic transcriptomes in developing and mature human cortex uncovers new insight into psychiatric disease gene regulation. Genom. Res. 2020, 30, 1–11. [Google Scholar] [CrossRef]
- Cui, P.; Lin, Q.; Ding, F.; Xin, C.; Gong, W.; Zhang, L.; Geng, J.; Zhang, B.; Yu, X.; Yang, J.; et al. A comparison between ribo-minus RNA-sequencing and polyA-selected RNA-sequencing. Genomics 2010, 96, 259–265. [Google Scholar] [CrossRef] [PubMed]
- Ma, F.; Fuqua, B.K.; Hasin, Y.; Yukhtman, C.; Vulpe, C.D.; Lusis, A.J.; Pellegrini, M. A comparison between whole transcript and 3′ RNA sequencing methods using Kapa and Lexogen library preparation methods. BMC Genom. 2019, 20, 9. [Google Scholar] [CrossRef] [PubMed]
- Gallego Romero, I.; Pai, A.A.; Tung, J.; Gilad, Y. RNA-seq: Impact of RNA degradation on transcript quantification. BMC Biol. 2014, 12, 42. [Google Scholar] [CrossRef] [PubMed]
- Reiman, M.; Laan, M.; Rull, K.; Sober, S. Effects of RNA integrity on transcript quantification by total RNA sequencing of clinically collected human placental samples. FASEB J. 2017, 31, 3298–3308. [Google Scholar] [CrossRef] [PubMed]
- Mas-Ponte, D.; Carlevaro-Fita, J.; Palumbo, E.; Hermoso Pulido, T.; Guigo, R.; Johnson, R. LncATLAS database for subcellular localization of long noncoding RNAs. RNA 2017, 23, 1080–1087. [Google Scholar] [CrossRef] [PubMed]
- Zaghlool, A.; Niazi, A.; Bjorklund, A.K.; Westholm, J.O.; Ameur, A.; Feuk, L. Characterization of the nuclear and cytosolic transcriptomes in human brain tissue reveals new insights into the subcellular distribution of RNA transcripts. Sci. Rep. 2021, 11, 4076. [Google Scholar] [CrossRef]
- Akhtar, A.; Gasser, S.M. The nuclear envelope and transcriptional control. Nat Rev. Genet. 2007, 8, 507–517. [Google Scholar] [CrossRef]
- Malhas, A.; Goulbourne, C.; Vaux, D.J. The nucleoplasmic reticulum: Form and function. Trends Cell Biol. 2011, 1, 362–373. [Google Scholar] [CrossRef]
- Cho, S.; Irianto, J.; Discher, D.E. Mechanosensing by the nucleus: From pathways to scaling relationships. J. Cell Biol. 2017, 216, 305–315. [Google Scholar] [CrossRef]
- Chitikova, Z.; Steiner, F.A. Cell type-specific epigenome profiling using affinity-purified nuclei. Genesis 2016, 54, 160–169. [Google Scholar] [CrossRef][Green Version]
- Fernandez-Albert, J.; Lipinski, M.; Lopez-Cascales, M.T.; Rowley, M.J.; Martin-Gonzalez, A.M.; Del Blanco, B.; Corces, V.G.; Barco, A. Immediate and deferred epigenomic signatures of in vivo neuronal activation in mouse hippocampus. Nat. Neurosci. 2019, 22, 1718–1730. [Google Scholar] [CrossRef] [PubMed]
- Dobin, A.; Davis, C.A.; Schlesinger, F.; Drenkow, J.; Zaleski, C.; Jha, S.; Batut, P.; Chaisson, M.; Gingeras, T.R. STAR: Ultrafast universal RNA-seq aligner. Bioinformatics 2013, 29, 15–21. [Google Scholar] [CrossRef] [PubMed]
- Li, H.; Handsaker, B.; Wysoker, A.; Fennell, T.; Ruan, J.; Homer, N.; Marth, G.; Abecasis, G.; Durbin, R. Genome Project Data Processing S. The Sequence Alignment/Map format and SAMtools. Bioinformatics 2009, 25, 2078–2079. [Google Scholar] [CrossRef]
- Anders, S.; Pyl, P.T.; Huber, W. HTSeq--a Python framework to work with high-throughput sequencing data. Bioinformatics 2015, 31, 166–169. [Google Scholar] [CrossRef] [PubMed]
- Bolger, A.M.; Lohse, M.; Usadel, B. Trimmomatic: A flexible trimmer for Illumina sequence data. Bioinformatics 2014, 30, 2114–2120. [Google Scholar] [CrossRef]
- Zhang, Y.; Liu, T.; Meyer, C.A.; Eeckhoute, J.; Johnson, D.S.; Bernstein, B.E.; Nusbaum, C.; Myers, R.M.; Brown, M.; Li, W.; et al. Model-based analysis of ChIP-Seq (MACS). Genome Biol. 2008, 9, R137. [Google Scholar] [CrossRef]


| Brain Region\Property Tested | Nuclei Yield (×104/mL) | Total Volume (μL) | Input Nuclei sfGFP+% | Actual 5k Nuclei/Sample (mins) | Theoretical 50k Nuclei/10 Samples (mins) | sfGFP+ Nuclei Yield from INTACT | ||||
|---|---|---|---|---|---|---|---|---|---|---|
| FANS | INTACT | FANS | INTACT | GFP% Supernatant | Yield % | Purity | ||||
| Small–medium brain regions | ||||||||||
| Nucleus accumbens | 73 | 300 | 18.95 | 2 | 35 | 200 | 60 | 16.5 | 15 | 98.5 |
| Hypothalamus | 60 | 400 | 12.8 | 3 | 35 | 300 | 60 | 7.6 | 44 | 98.2 |
| Pituitary | 140 | 400 | 47.45 | 1 | 35 | 100 | 60 | 28.9 | 40 | 99.1 |
| Hippocampus | 136 | 400 | 23 | 1.5 | 35 | 150 | 60 | 12.3 | 50 | 99.8 |
| Large brain regions | ||||||||||
| Neocortex 1 | >200 | 900 | 29.3 | - | - | - | - | 3.6 | 87 | 98.5 |
| Neocortex 2 | >200 | 900 | 26.7 | - | - | - | - | 3.7 | 86 | 93.6 |
| Parameter Compared | INTACT | FANS |
|---|---|---|
| Experimental approach |
|
|
| Processing speed |
|
|
| Quantification accuracy |
|
|
| Tissue/cellular amounts requirement |
|
|
| Effect on nuclear structure |
|
|
| Transcriptional alterations |
|
|
| Chromatin accessibility alteration |
|
|
| Cost |
|
|
Publisher’s Note: MDPI stays neutral with regard to jurisdictional claims in published maps and institutional affiliations. |
© 2021 by the authors. Licensee MDPI, Basel, Switzerland. This article is an open access article distributed under the terms and conditions of the Creative Commons Attribution (CC BY) license (https://creativecommons.org/licenses/by/4.0/).
Share and Cite
Chongtham, M.C.; Butto, T.; Mungikar, K.; Gerber, S.; Winter, J. INTACT vs. FANS for Cell-Type-Specific Nuclei Sorting: A Comprehensive Qualitative and Quantitative Comparison. Int. J. Mol. Sci. 2021, 22, 5335. https://doi.org/10.3390/ijms22105335
Chongtham MC, Butto T, Mungikar K, Gerber S, Winter J. INTACT vs. FANS for Cell-Type-Specific Nuclei Sorting: A Comprehensive Qualitative and Quantitative Comparison. International Journal of Molecular Sciences. 2021; 22(10):5335. https://doi.org/10.3390/ijms22105335
Chicago/Turabian StyleChongtham, Monika Chanu, Tamer Butto, Kanak Mungikar, Susanne Gerber, and Jennifer Winter. 2021. "INTACT vs. FANS for Cell-Type-Specific Nuclei Sorting: A Comprehensive Qualitative and Quantitative Comparison" International Journal of Molecular Sciences 22, no. 10: 5335. https://doi.org/10.3390/ijms22105335
APA StyleChongtham, M. C., Butto, T., Mungikar, K., Gerber, S., & Winter, J. (2021). INTACT vs. FANS for Cell-Type-Specific Nuclei Sorting: A Comprehensive Qualitative and Quantitative Comparison. International Journal of Molecular Sciences, 22(10), 5335. https://doi.org/10.3390/ijms22105335