Nephrotoxicity Evaluation of Indium Phosphide Quantum Dots with Different Surface Modifications in BALB/c Mice

 ,
,
Abstract
:
1. Introduction
2. Results
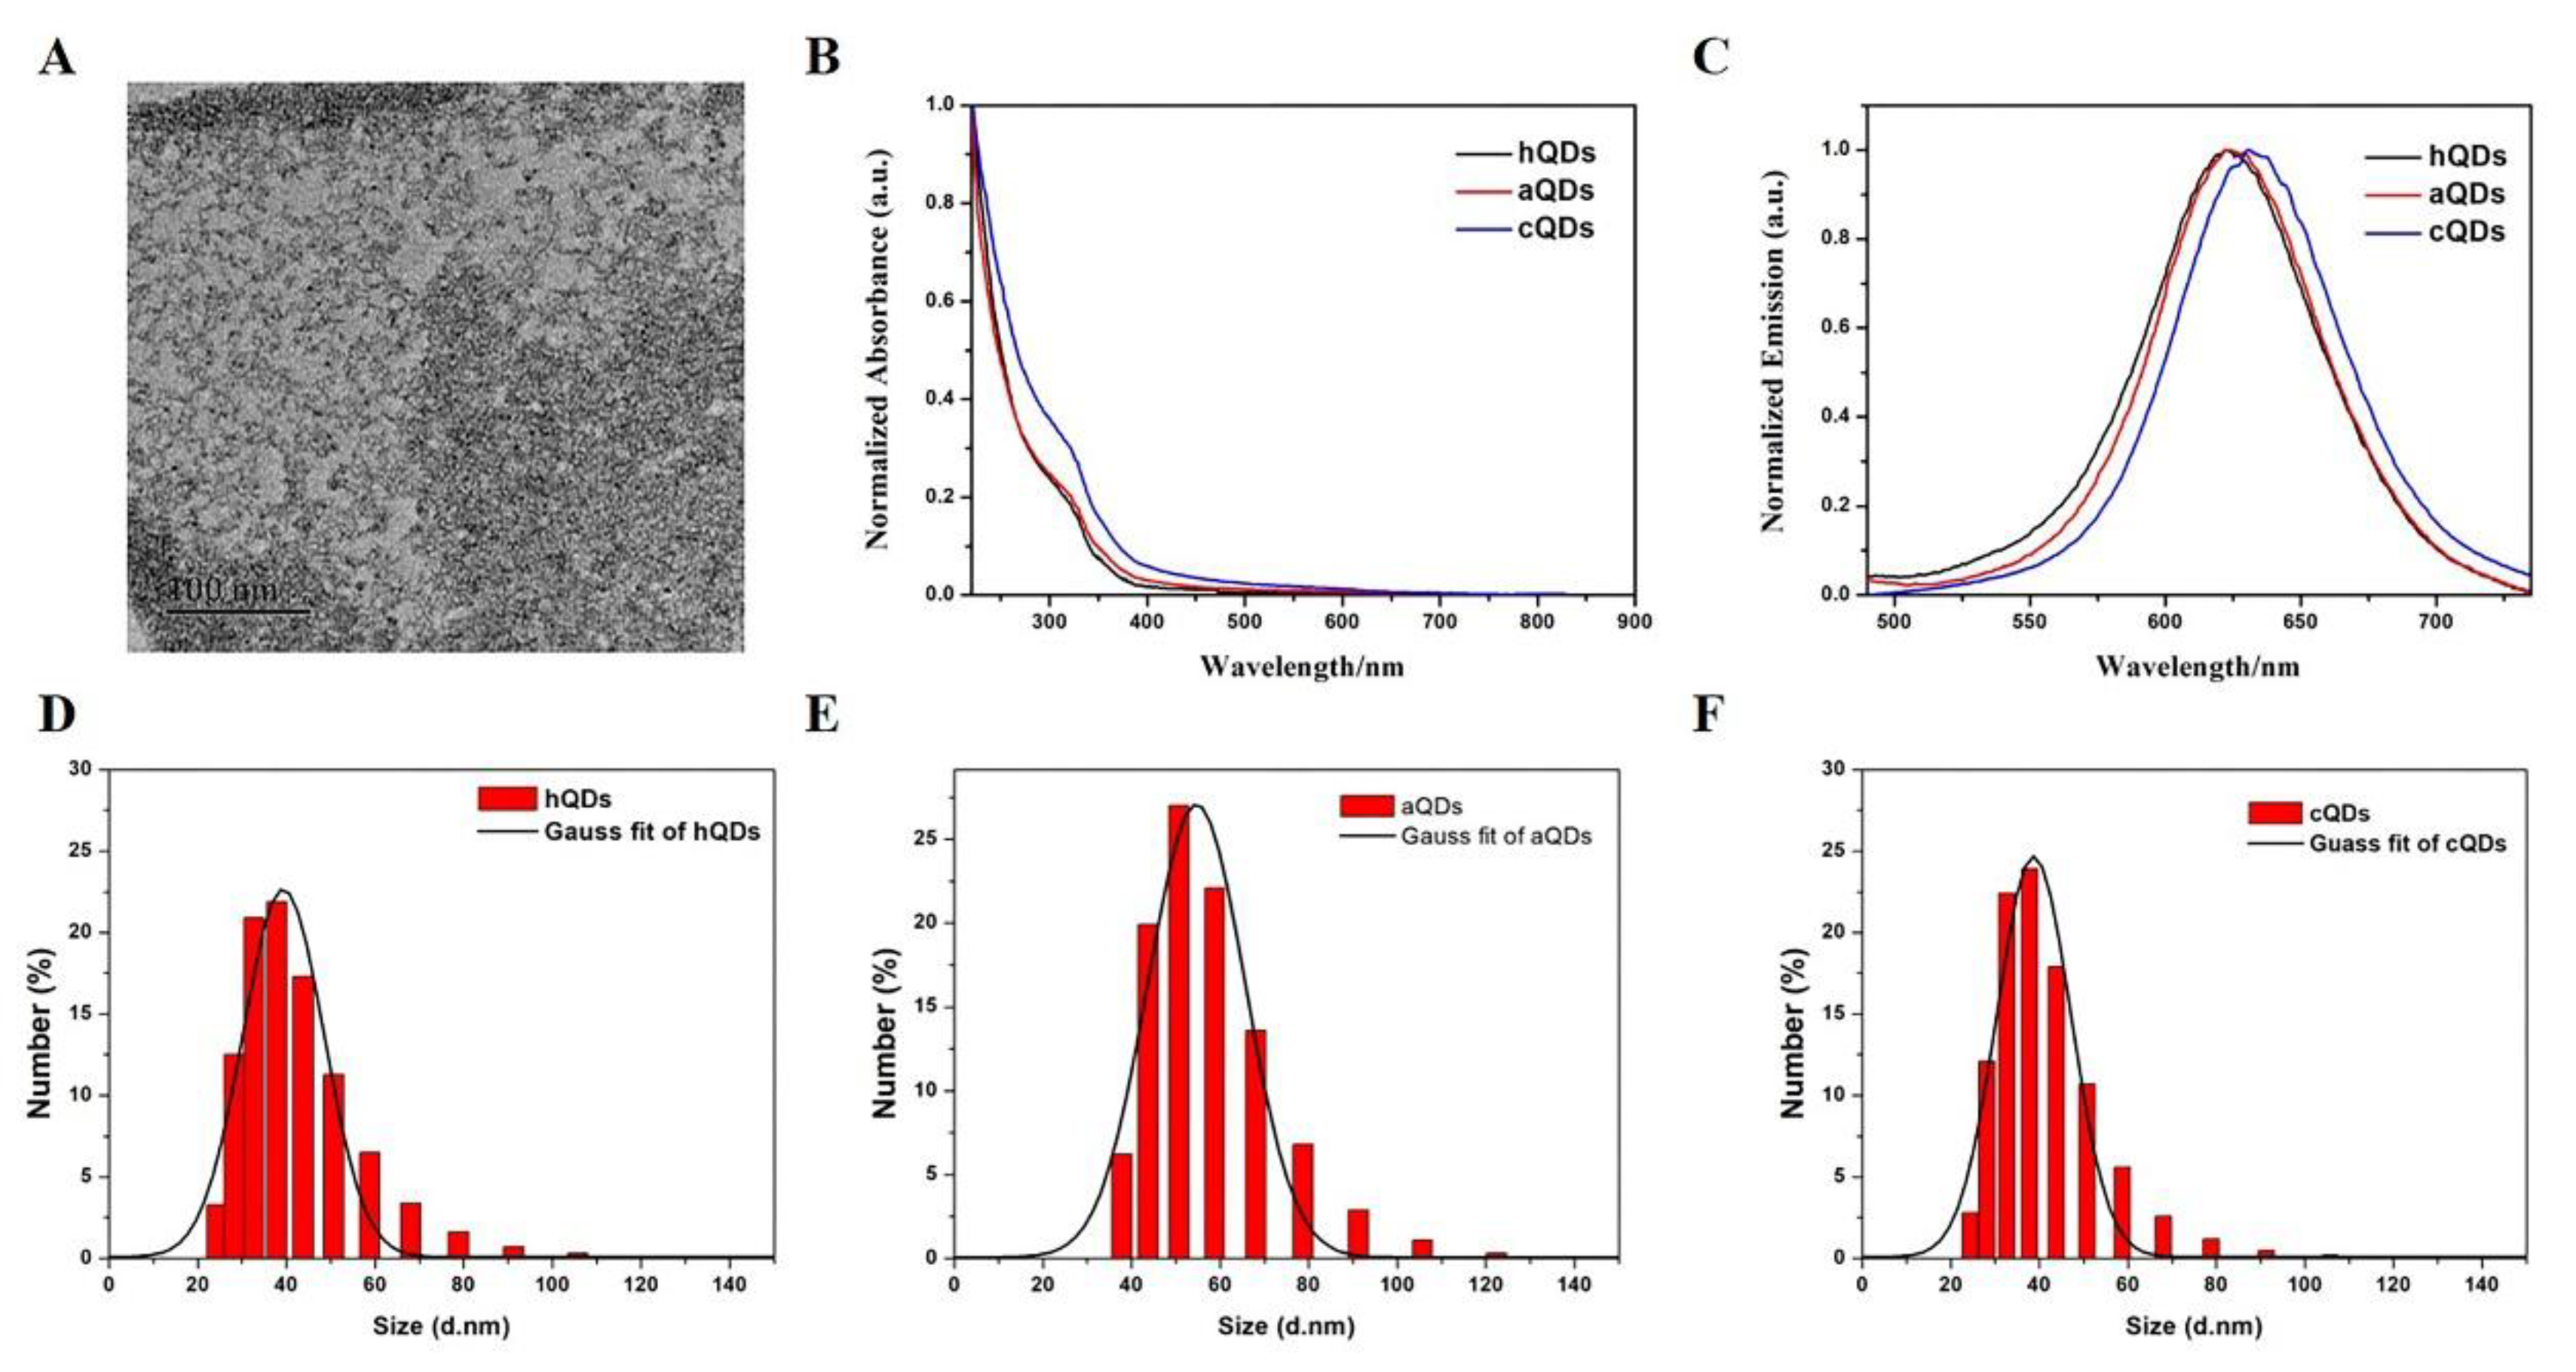
2.1. Characterization of InP/ZnS QDs
2.2. Body Weight and Organ Weight/BW Coefficients
2.3. Distribution of QDs in Kidney
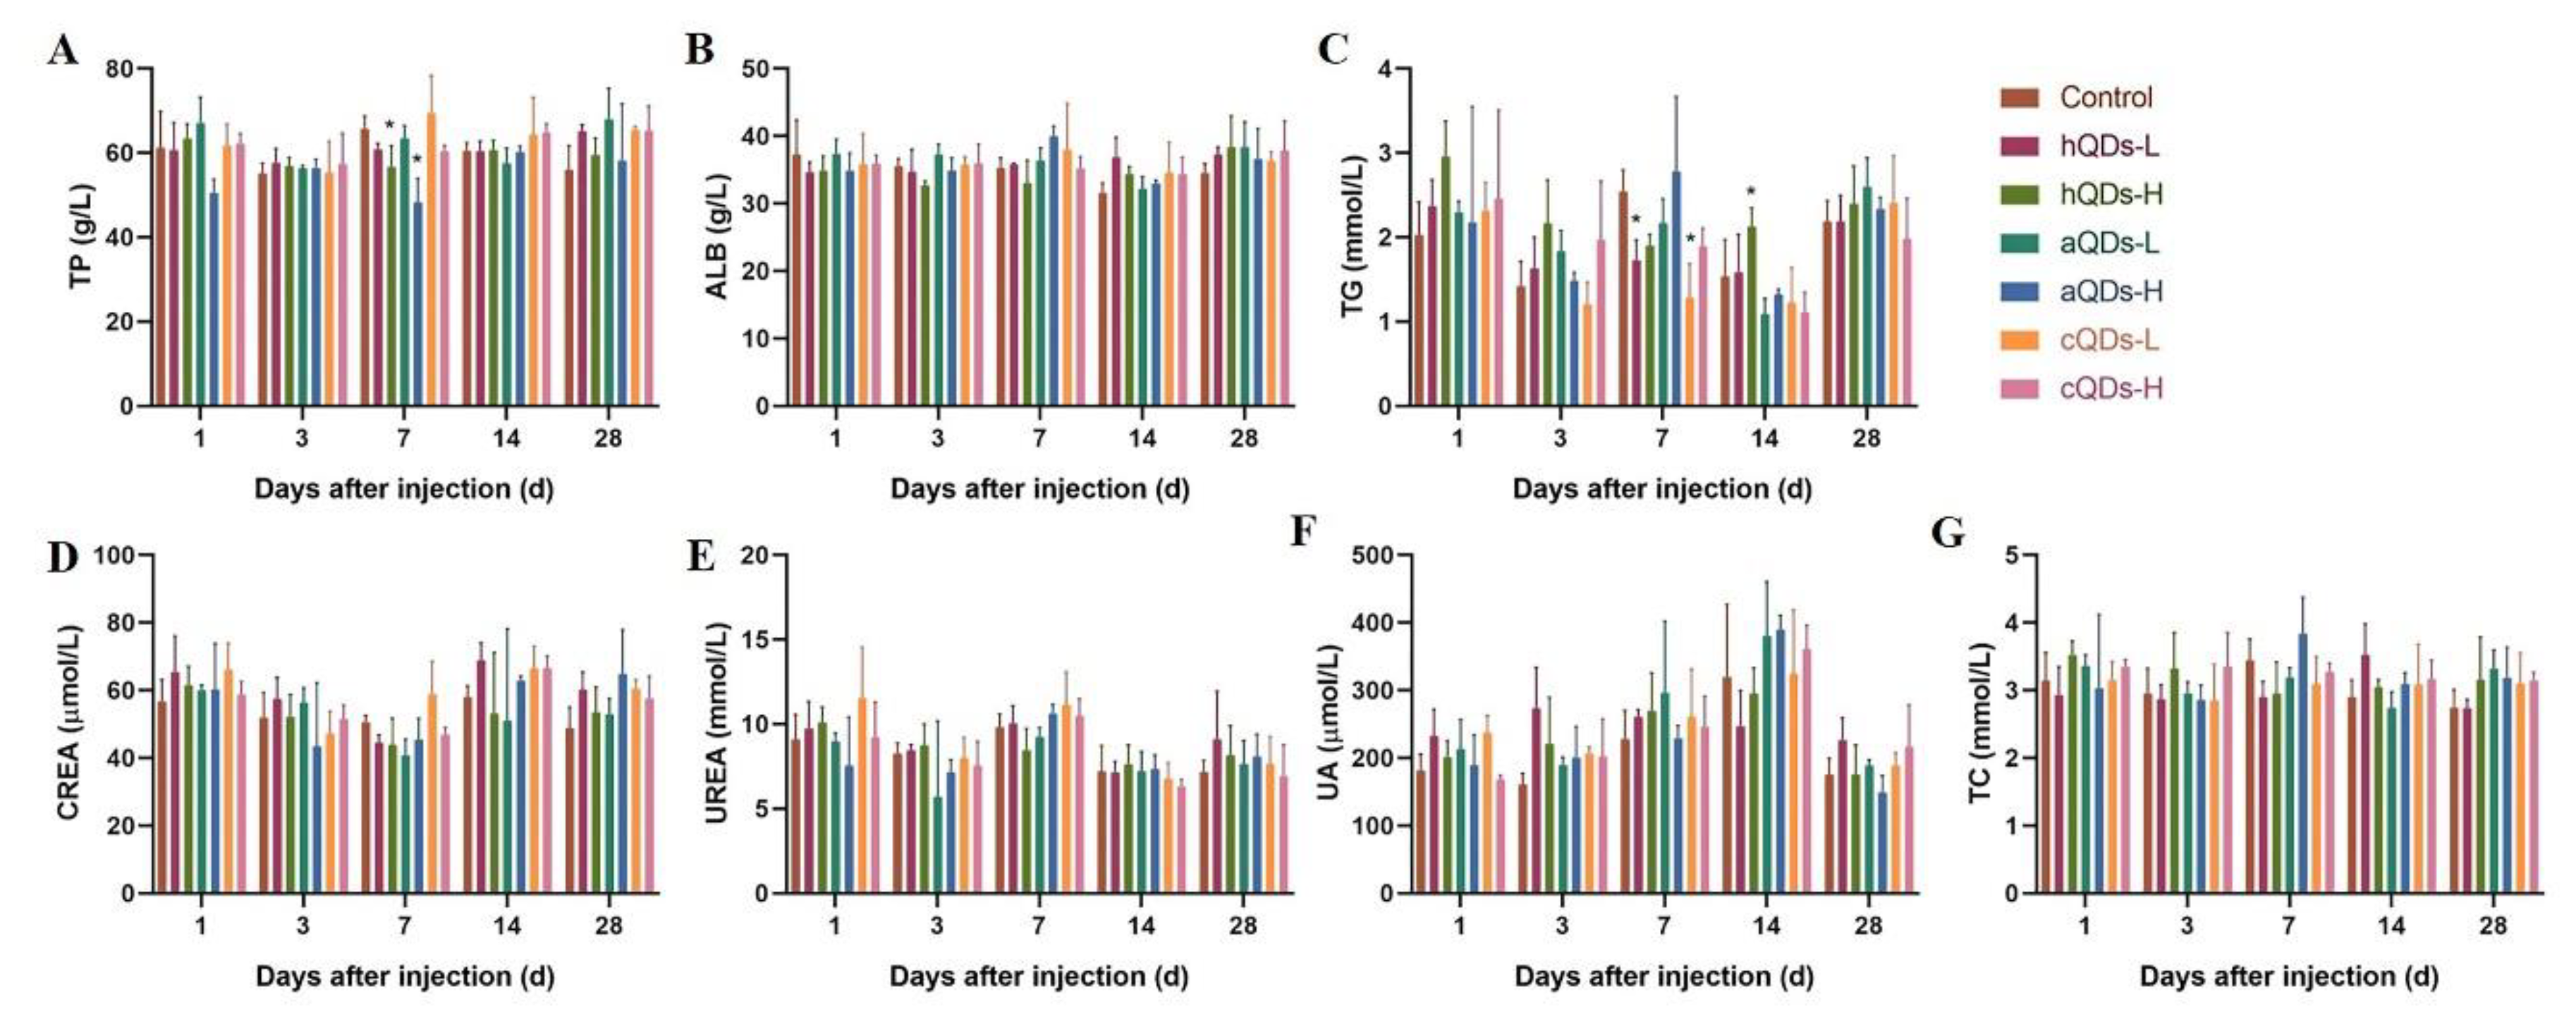
2.4. Changes of Serum Biochemical Parameters
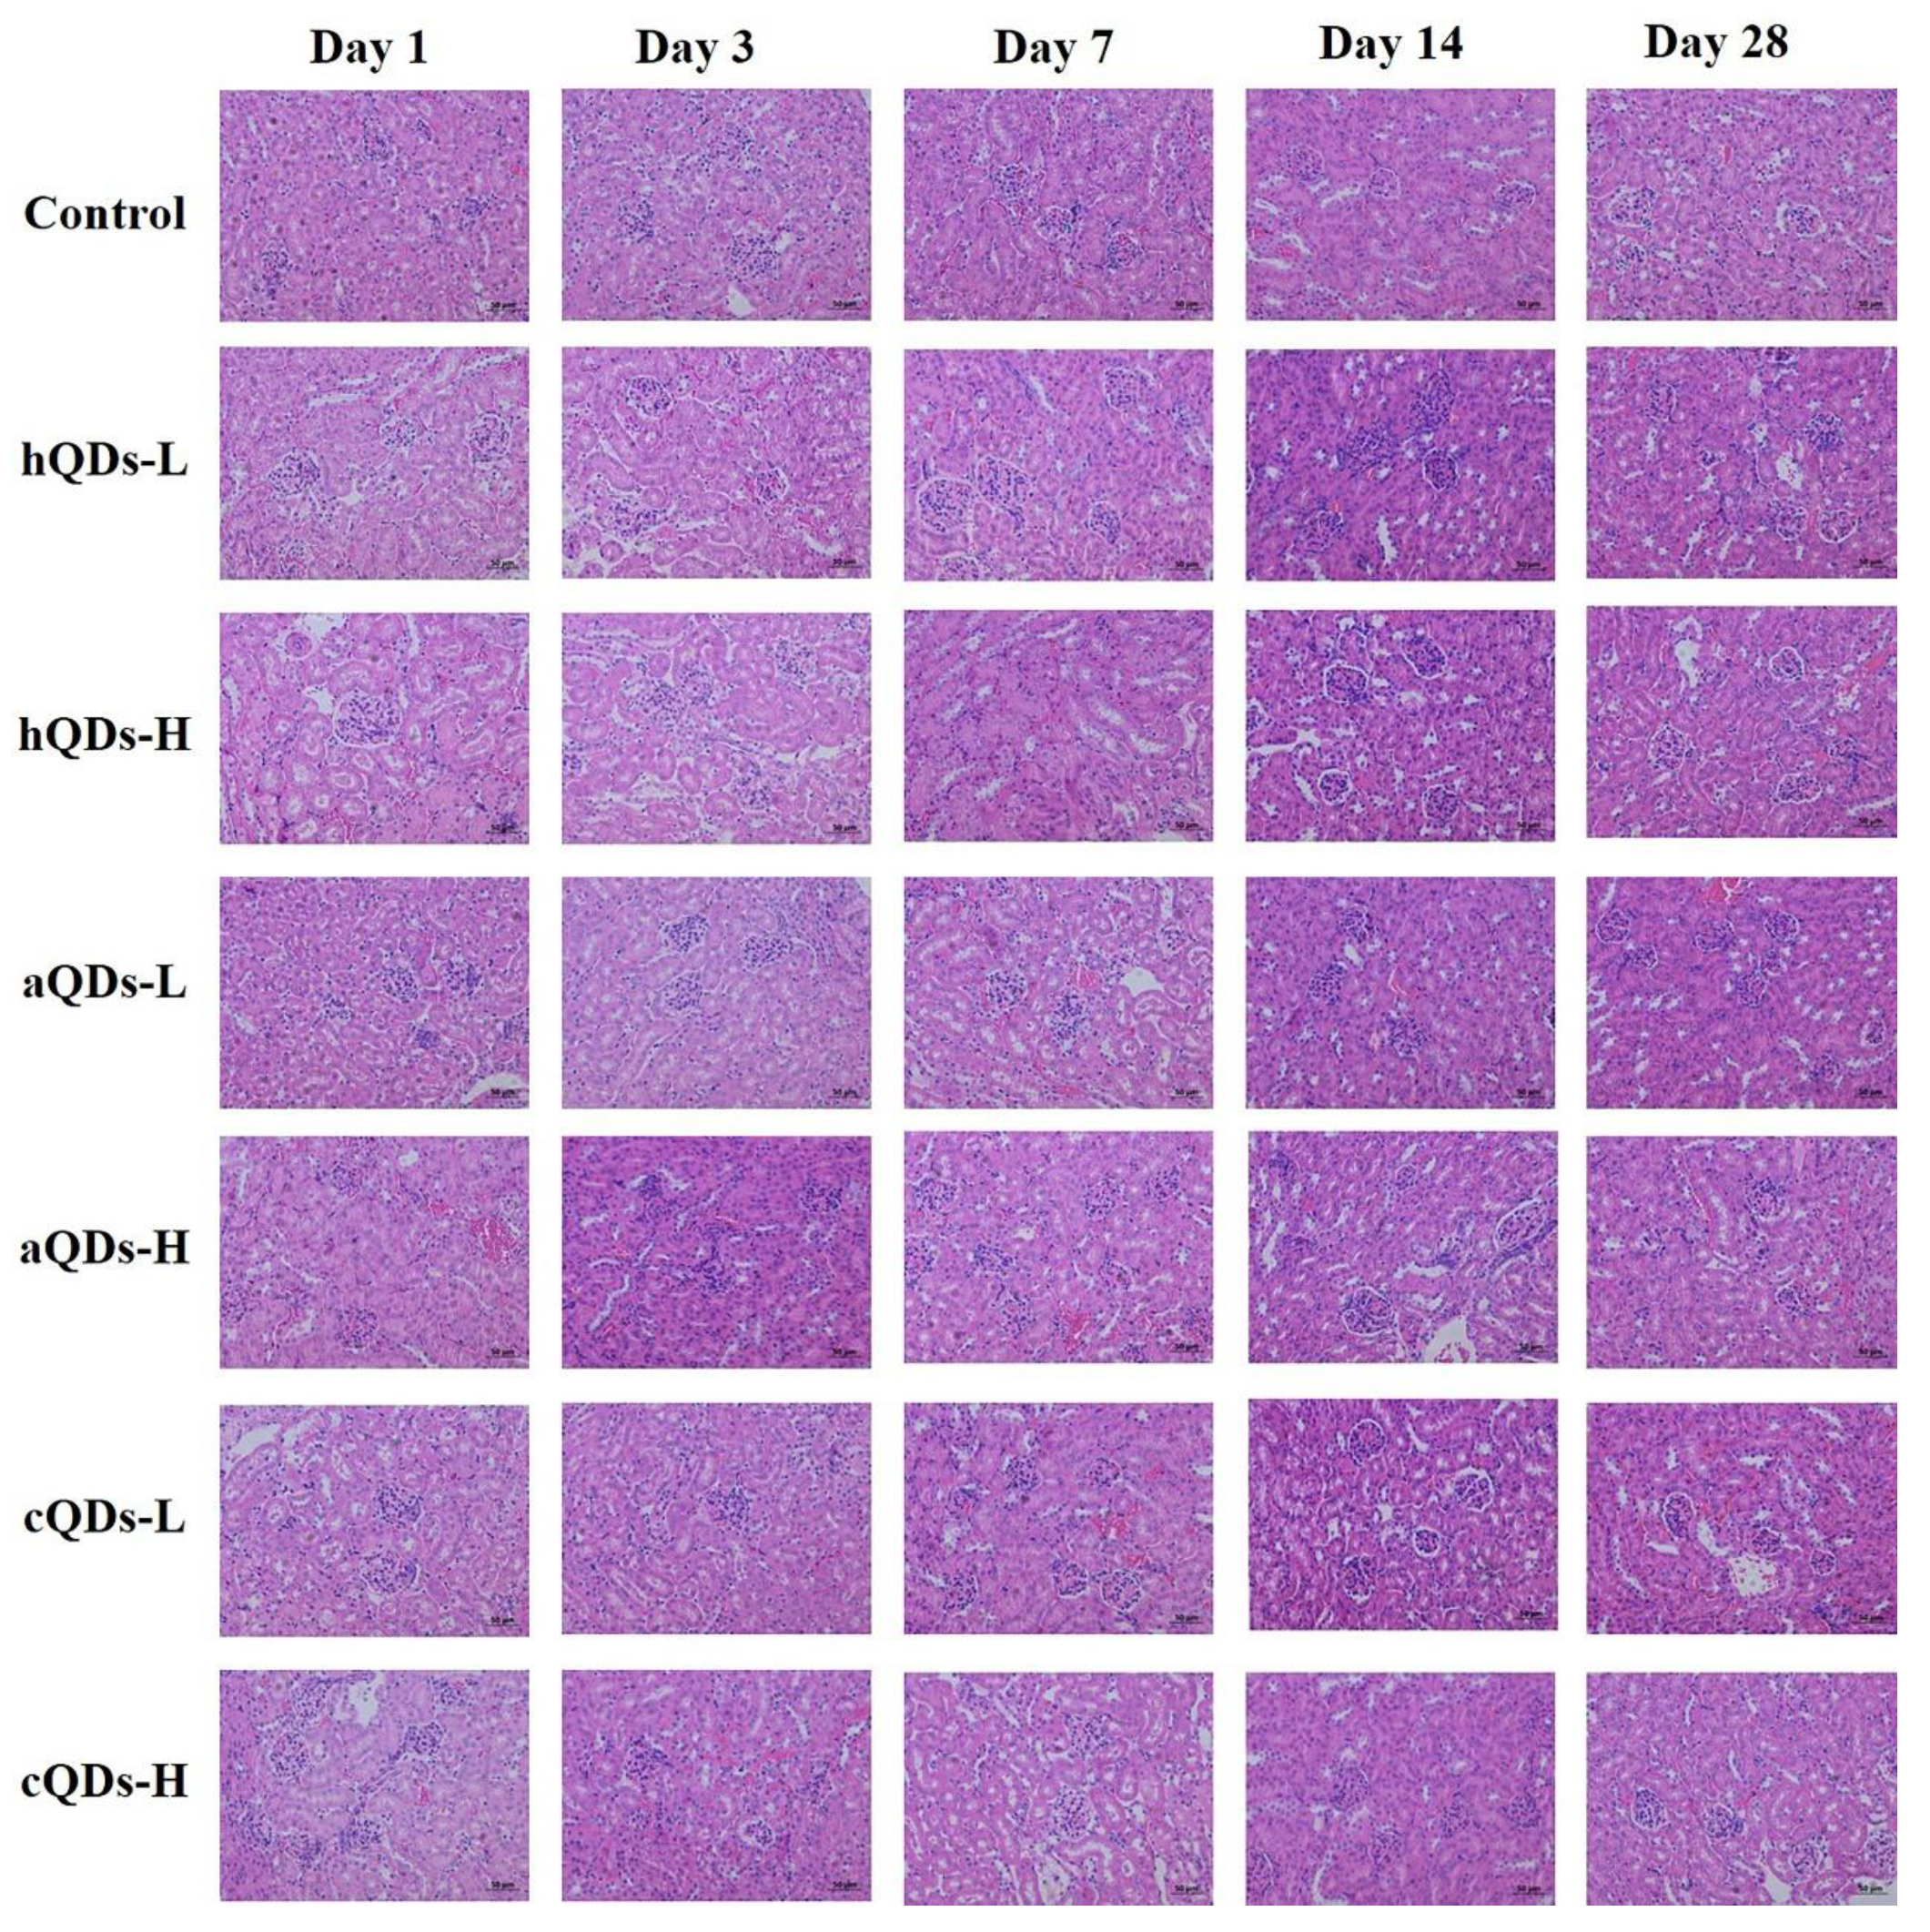
2.5. Histopathological Detection in Kidney Tissues
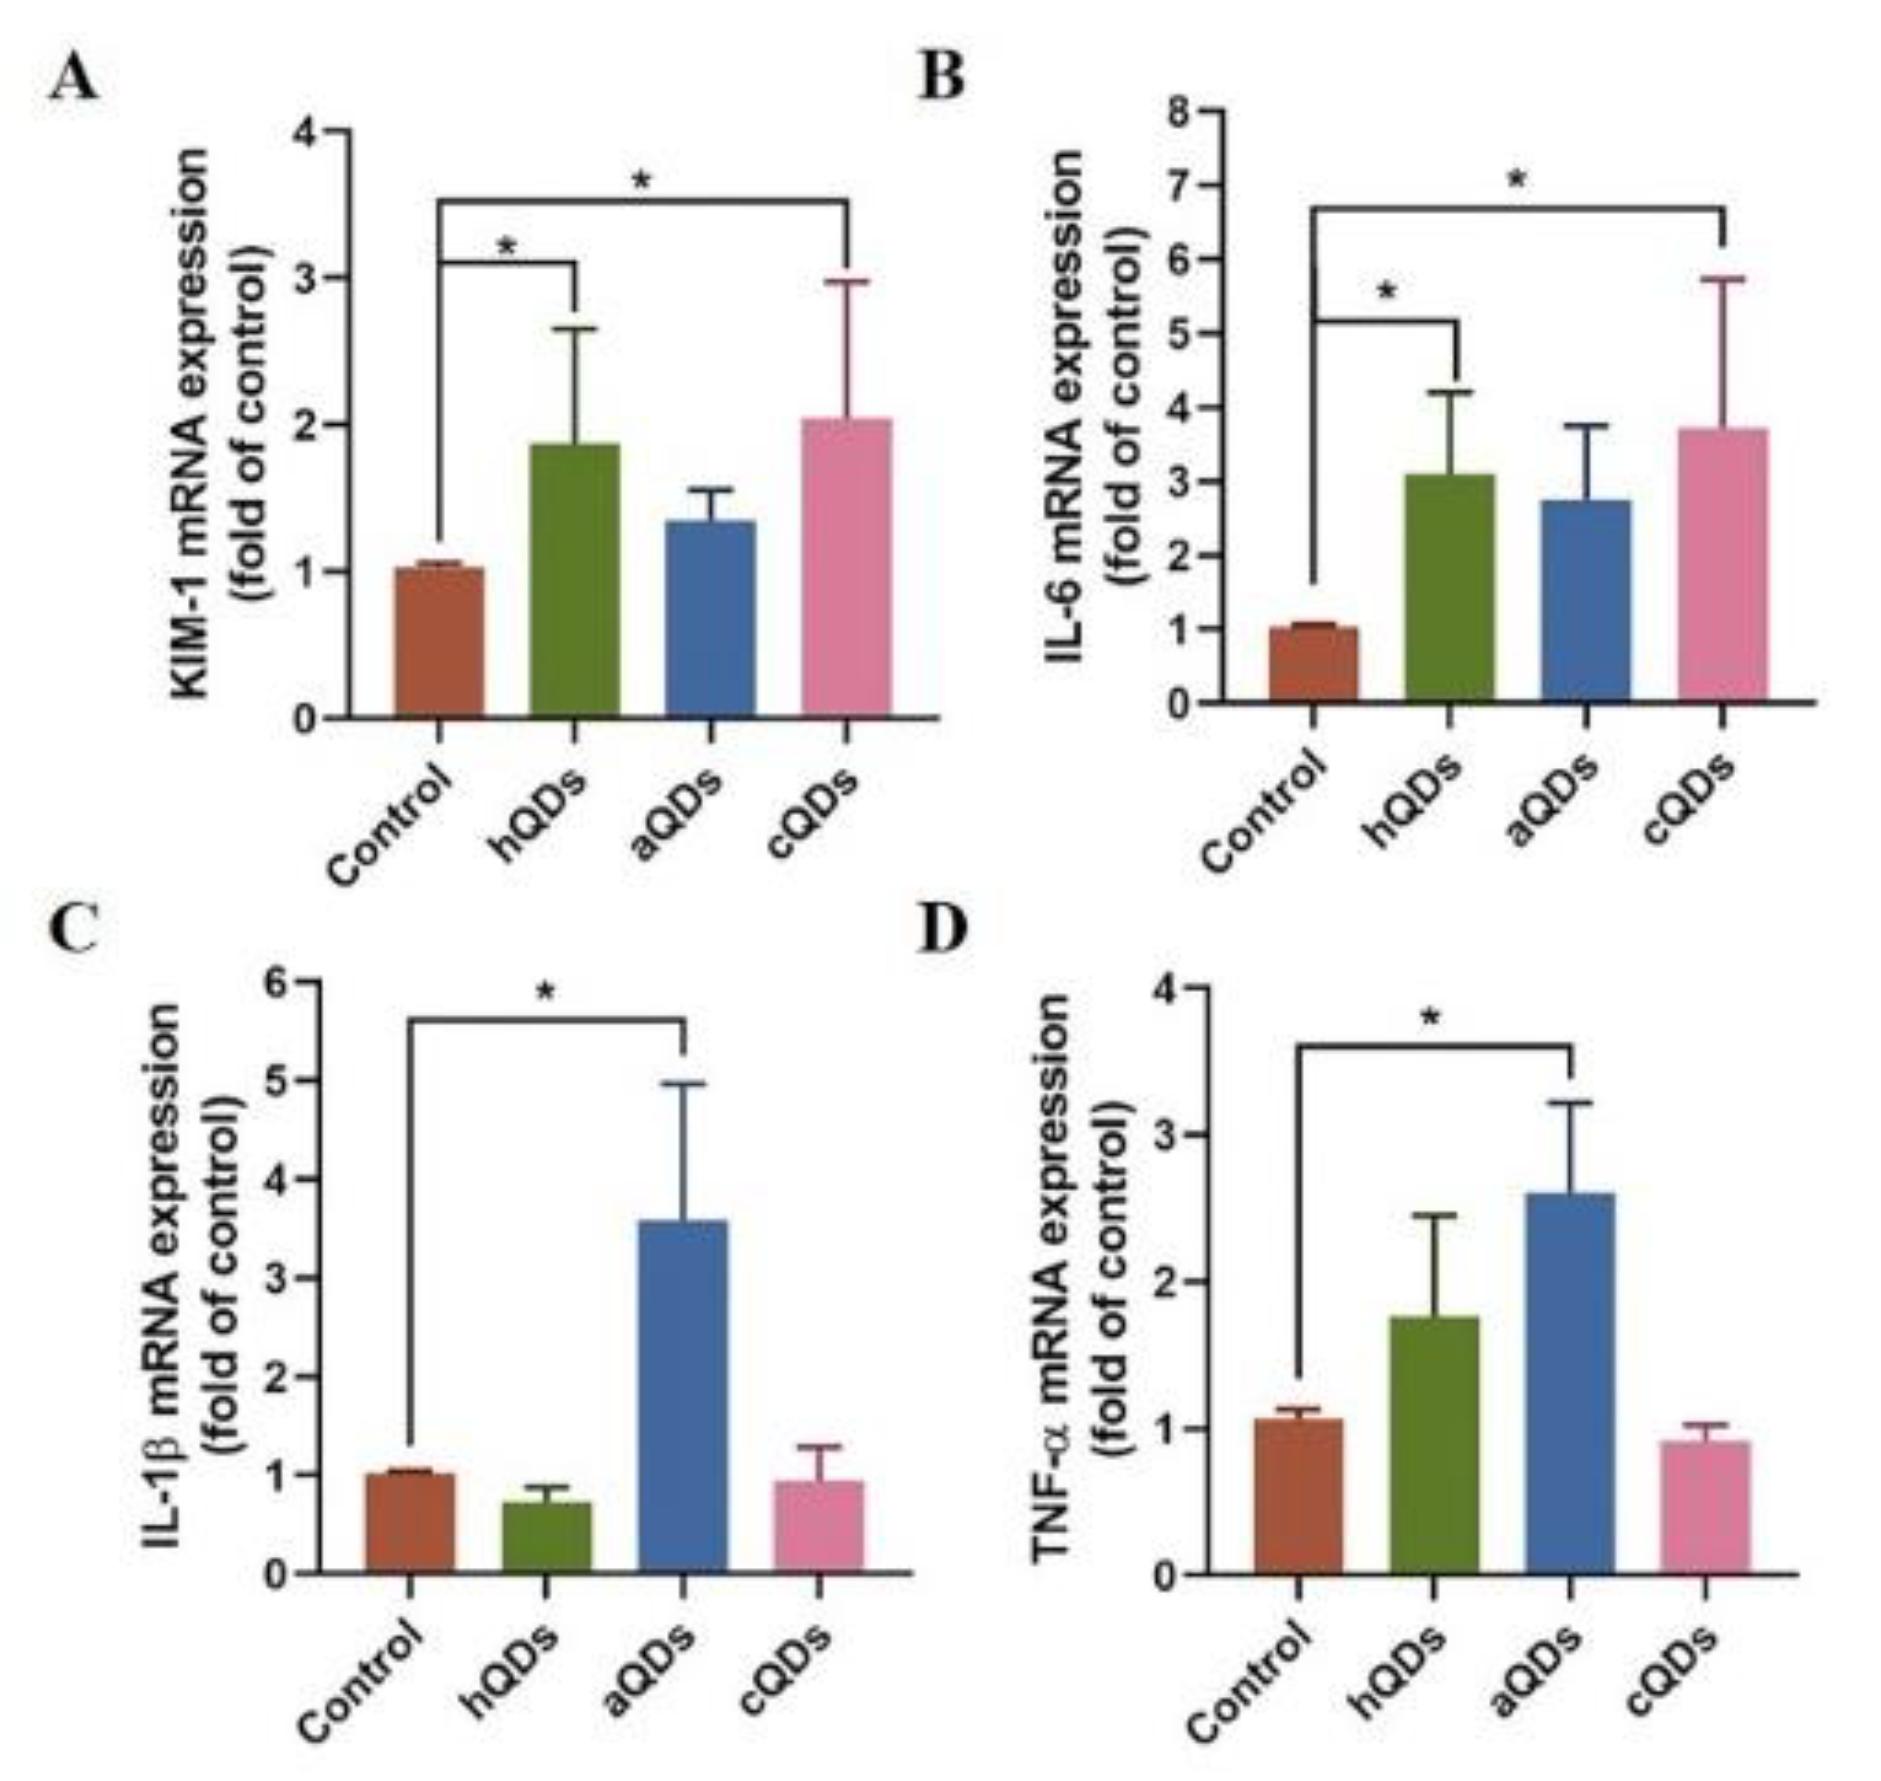
2.6. Inflammatory Responses in Kidney Tissues
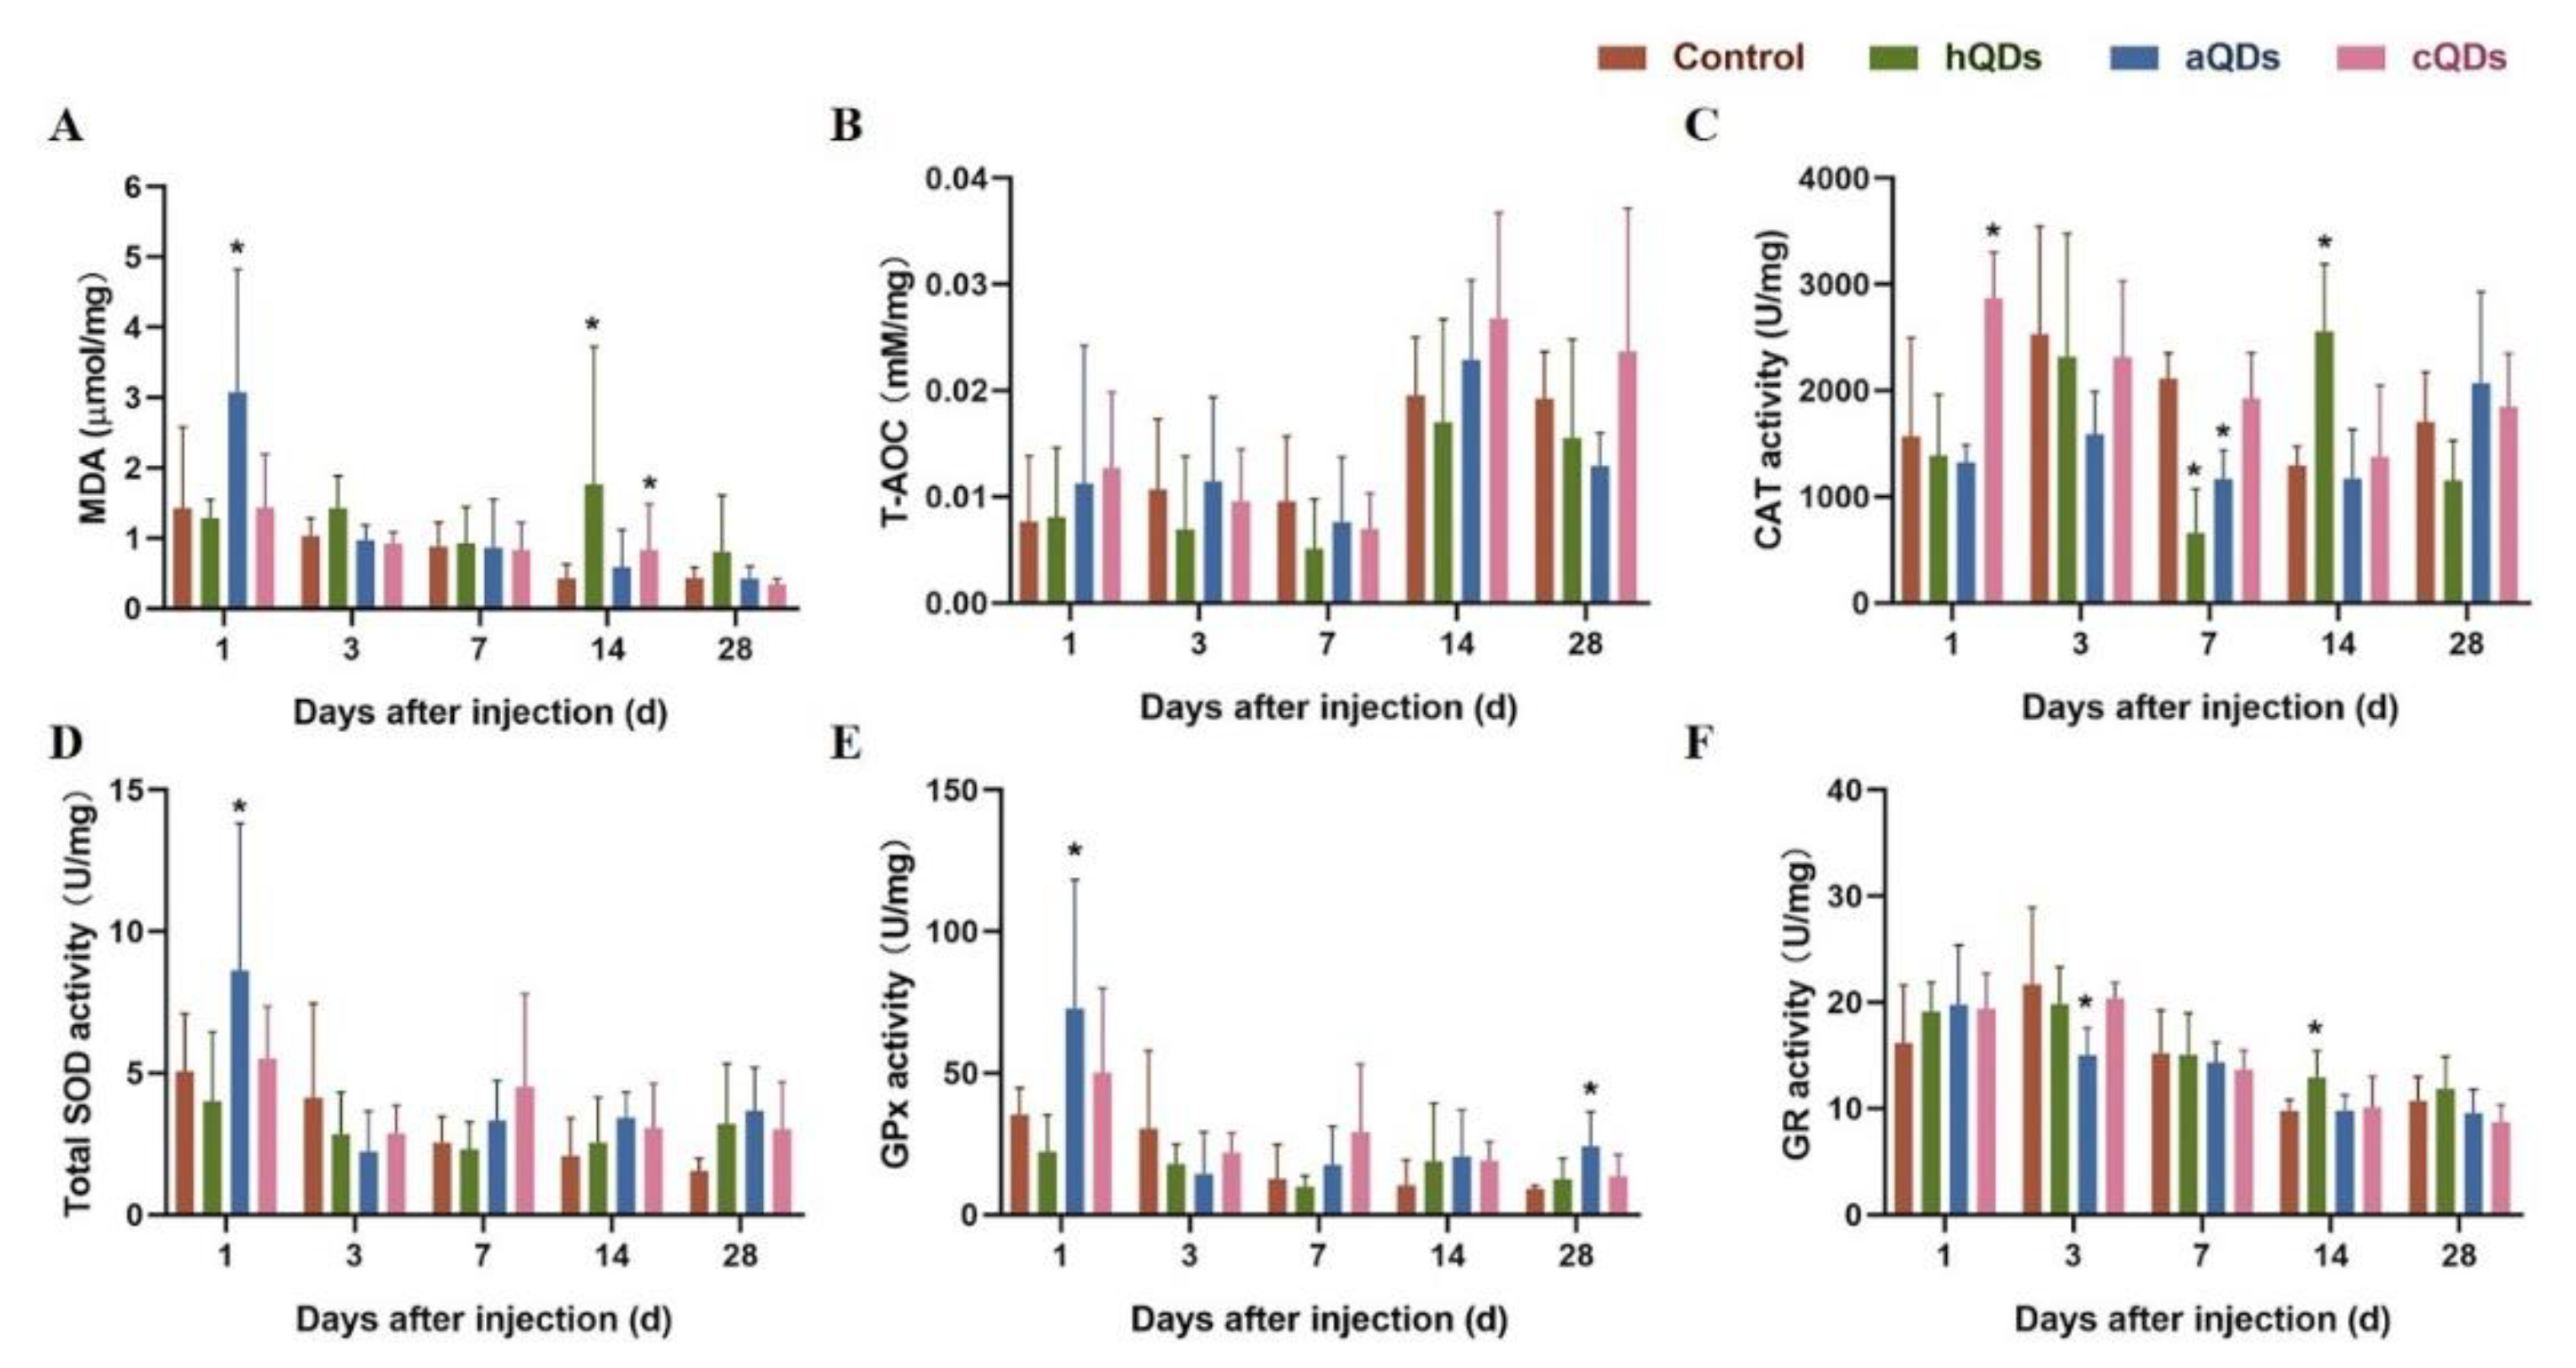
2.7. Oxidative Stress Alterations in Kidney Tissues
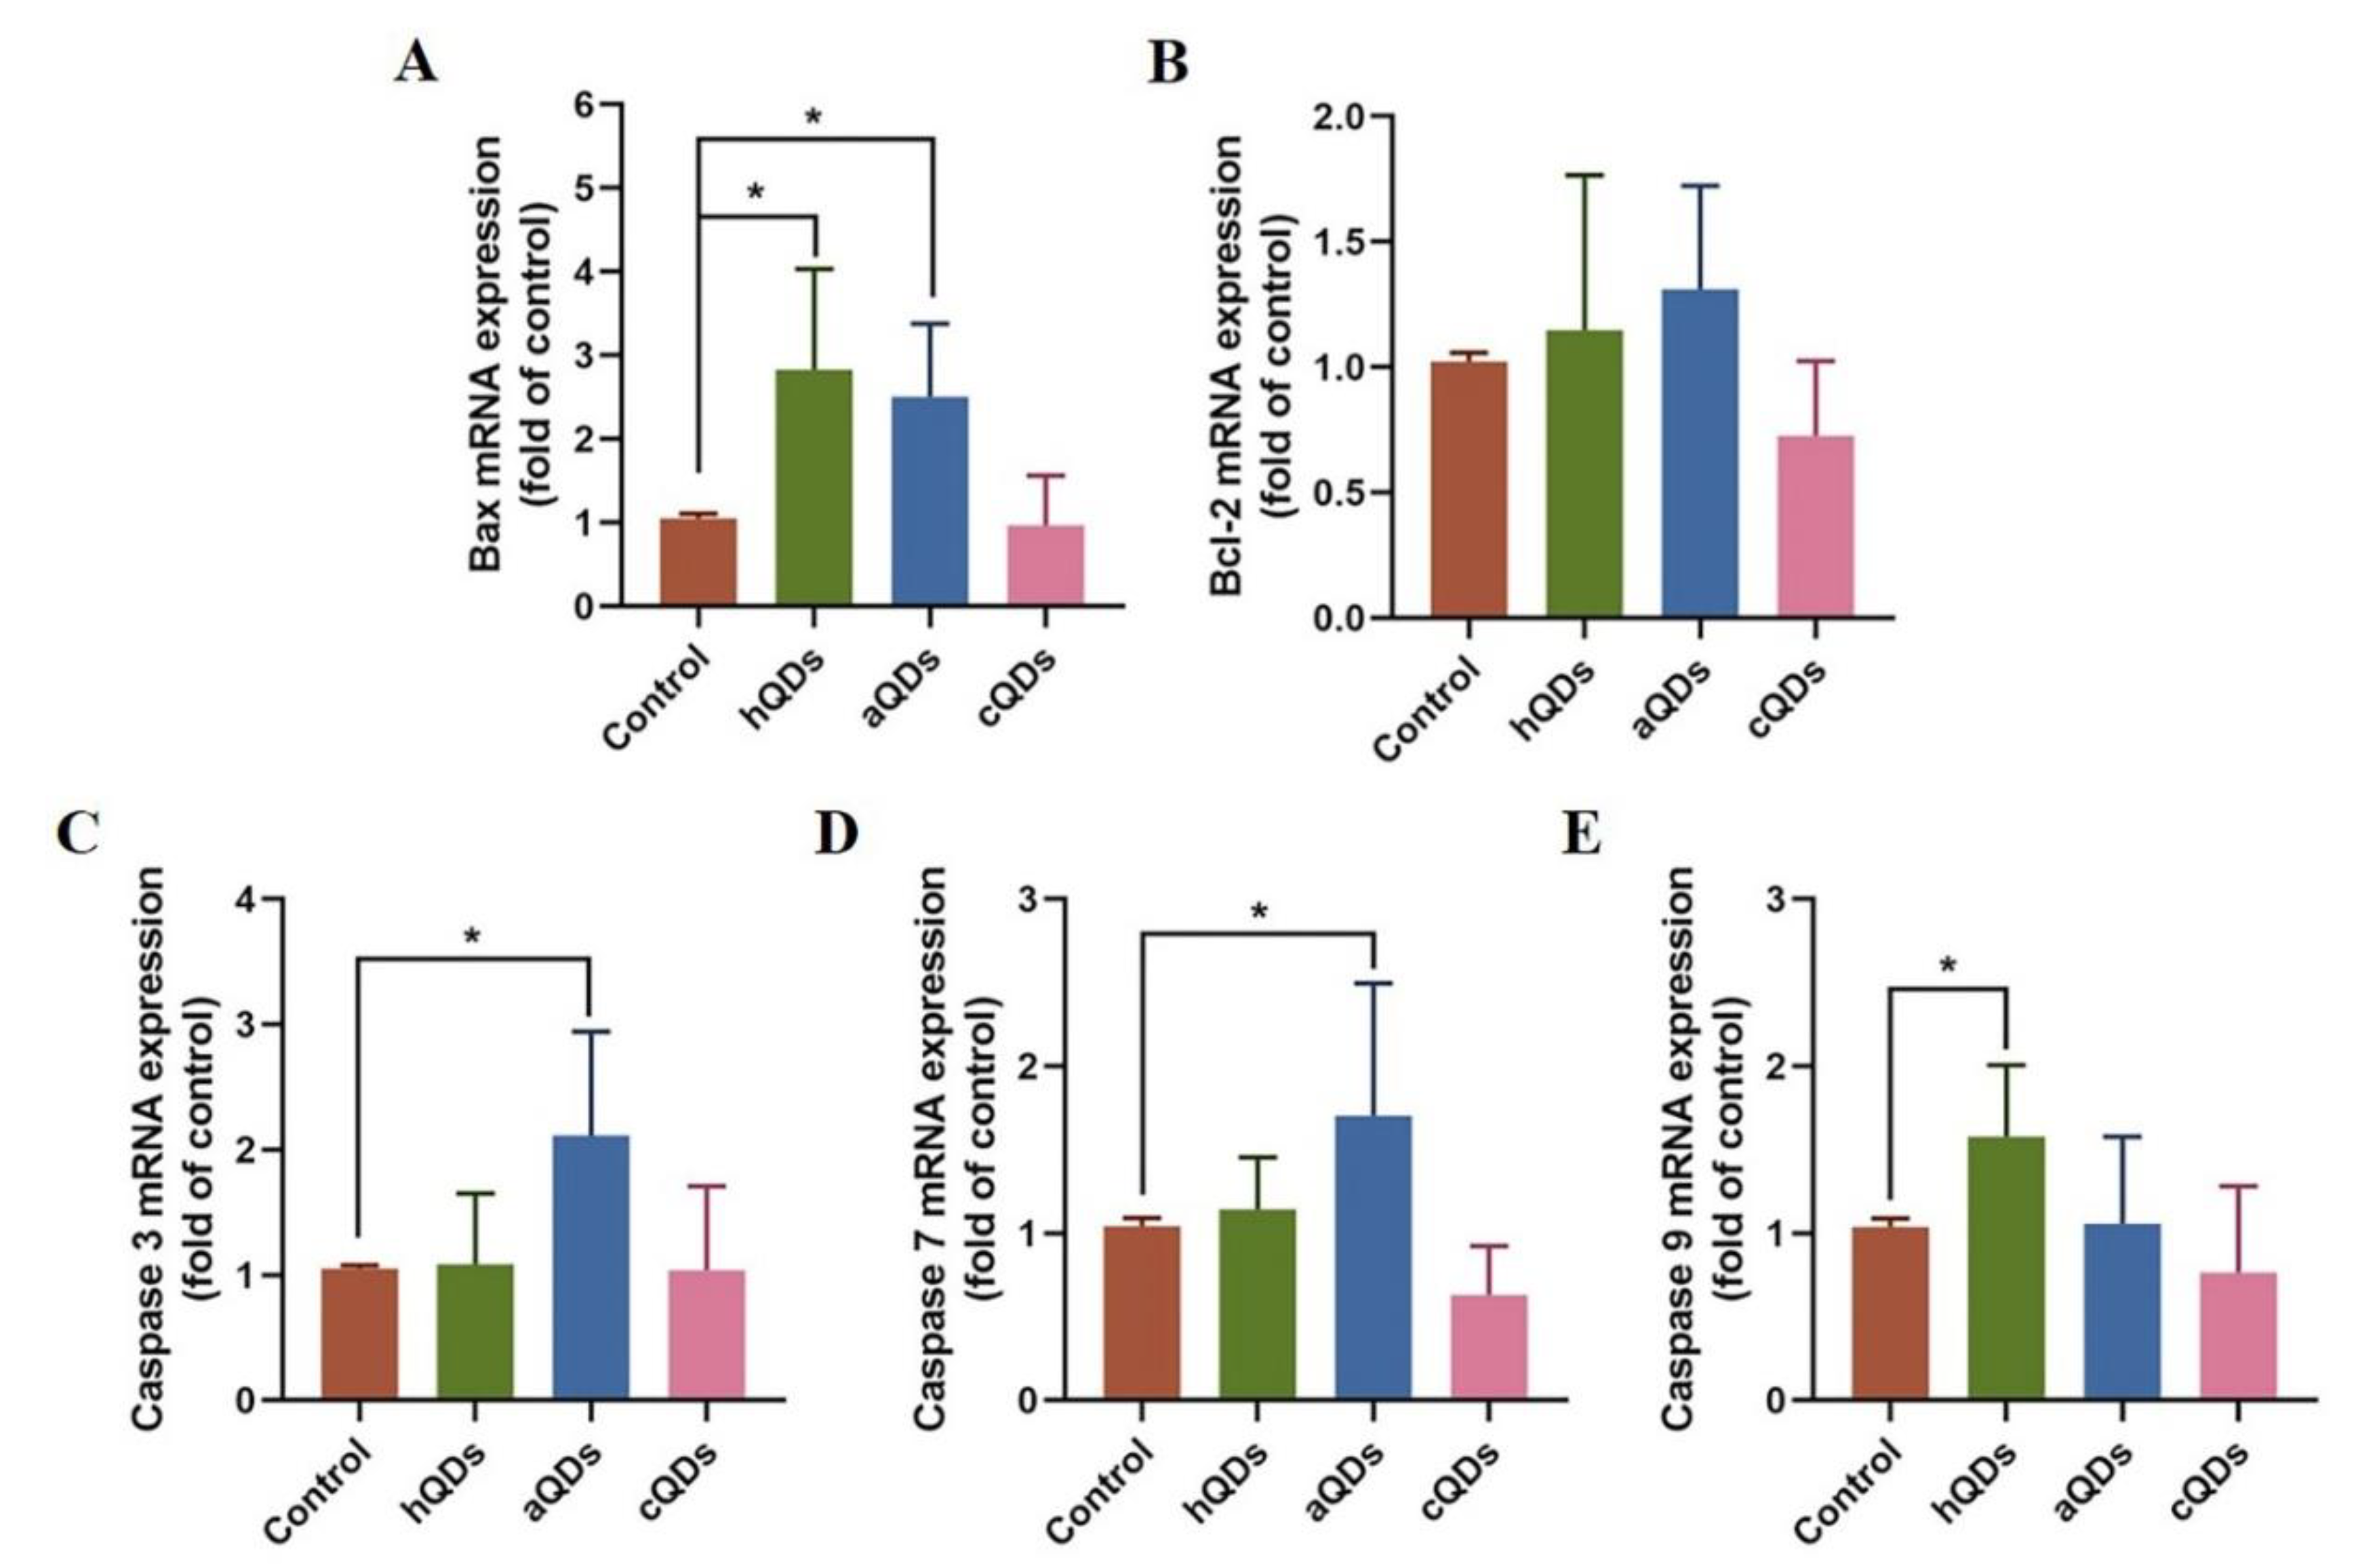
2.8. Apoptosis Pathway Alterations in Kidney Tissues
3. Discussion
4. Materials and Methods
4.1. Characterization of InP/ZnS QDs
4.2. Animals
4.3. Animal Treatment and Sample Collection
4.4. Detection and Determination of QDs Distribution in Kidney
4.5. Serum Biochemical Analysis
4.6. Histopathological Examination
4.7. Oxidative Stress Markers Detection
4.8. Quantitative Real-Time PCR
4.9. Statistical Analysis
5. Conclusions
Supplementary Materials
Author Contributions
Funding
Acknowledgments
Conflicts of Interest
Abbreviations
| QDs | quantum dots |
| hQDs | InP/ZnS-OH QDs |
| aQDs | InP/ZnS-NH2 QDs |
| cQDs | InP/ZnS-COOH QDs |
| InP | indium phosphide |
| NPs | nanoparticles |
| TEM | transmission electron microscopy |
| OCT | optimal cutting temperature compound |
| TP | total protein |
| TG | triglyceride |
| ALB | albumin |
| CREA | creatinine |
| UA | uric acid |
| TC | total cholesterol |
| H&E | hematoxylin and eosin |
| MDA | malondialdehyde |
| T-AOC | total antioxidant capacity |
| CAT | catalase |
| SOD | total superoxide dismutase |
| GPx | glutathione peroxidase |
| GR | glutathione reductase |
References
- Mattoussi, H.; Mauro, J.M.; Goldman, E.R.; Anderson, G.; Sundar, V.C.; Mikulec, F.V.; Bawendi, M.G. Self-Assembly of CdSe−ZnS Quantum Dot Bioconjugates Using an Engineered Recombinant Protein. J. Am. Chem. Soc. 2000, 122, 12142–12150. [Google Scholar] [CrossRef]
- Yong, K.-T.; Law, W.-C.; Hu, R.; Ye, L.; Liu, L.; Swihart, M.T.; Prasad, P. Nanotoxicity assessment of quantum dots: From cellular to primate studies. Chem. Soc. Rev. 2013, 42, 1236–1250. [Google Scholar] [CrossRef] [PubMed]
- Li, L.; Yin, D.; Xu, K.; Liu, Y.; Song, D.; Wang, J.; Zhao, C.; Song, X.; Li, J. A sandwich immunoassay for brucellosis diagnosis based on immune magnetic beads and quantum dots. J. Pharm. Biomed. Anal. 2017, 141, 79–86. [Google Scholar] [CrossRef] [PubMed]
- Saulite, L.; Pleiko, K.; Popena, I.; Dapkute, D.; Rotomskis, R.; Riekstina, U. Nanoparticle delivery to metastatic breast cancer cells by nanoengineered mesenchymal stem cells. Beilstein J. Nanotechnol. 2018, 9, 321–332. [Google Scholar] [CrossRef] [Green Version]
- Liang, X.; Tang, M. Research Advances on Cytotoxicity of Cadmium-Containing Quantum Dots. J. Nanosci. Nanotechnol. 2019, 19, 5375–5387. [Google Scholar] [CrossRef] [PubMed]
- Fan, J.; Sun, Y.; Wang, S.; Li, Y.; Zeng, X.; Cao, Z.; Yang, P.; Song, P.; Wang, Z.; Xian, Z.; et al. Inhibition of autophagy overcomes the nanotoxicity elicited by cadmium-based quantum dots. Biomater 2016, 78, 102–114. [Google Scholar] [CrossRef]
- Huang, P.; Wang, M.; Wang, J.; Sun, H.; Han, S.; Feng, S.; Shi, L.; Meng, P.; Li, J.; Sun, Z. Time-dependent toxicity of cadmium telluride quantum dots on liver and kidneys in mice: Histopathological changes with elevated free cadmium ions and hydroxyl radicals. Int. J. Nanomed. 2016, 11, 2319–2328. [Google Scholar] [CrossRef] [Green Version]
- Chen, M.; Yin, H.; Bai, P.; Miao, P.; Deng, X.; Xu, Y.; Hu, J.; Yin, J. ABC transporters affect the elimination and toxicity of CdTe quantum dots in liver and kidney cells. Toxicol. Appl. Pharmacol. 2016, 303, 11–20. [Google Scholar] [CrossRef]
- Zhao, L.; Zong, W.; Zhang, H.; Liu, R. Kidney Toxicity and Response of Selenium Containing Protein-glutathione Peroxidase (Gpx3) to CdTe QDs on Different Levels. Toxicol. Sci. 2018, 168, 201–208. [Google Scholar] [CrossRef]
- Xu, G.; Zeng, S.; Zhang, B.; Swihart, M.T.; Yong, K.-T.; Prasad, P. New Generation Cadmium-Free Quantum Dots for Biophotonics and Nanomedicine. Chem. Rev. 2016, 116, 12234–12327. [Google Scholar] [CrossRef]
- Reiss, P.; Carrière, M.; Lincheneau, C.; Vaure, L.; Tamang, S. Synthesis of Semiconductor Nanocrystals, Focusing on Nontoxic and Earth-Abundant Materials. Chem. Rev. 2016, 116, 10731–10819. [Google Scholar] [CrossRef] [PubMed]
- Wegner, K.D.; Dussert, F.; Truffier-Boutry, D.; Benayad, A.; Wegner, K.D.; Mattera, L.; Ling, W.L.; Carrière, M.; Reiss, P. Influence of the Core/Shell Structure of Indium Phosphide Based Quantum Dots on Their Photostability and Cytotoxicity. Front. Chem. 2019, 7, 466. [Google Scholar] [CrossRef] [Green Version]
- Brown, R.P.; Gallagher, M.J.; Fairbrother, D.H.; Rosenzweig, Z. Synthesis and Degradation of Cadmium-Free InP and InPZn/ZnS Quantum Dots in Solution. Langmuir 2018, 34, 13924–13934. [Google Scholar] [CrossRef] [PubMed]
- Xie, R.; Battaglia, D.; Peng, X. Colloidal InP Nanocrystals as Efficient Emitters Covering Blue to Near-Infrared. J. Am. Chem. Soc. 2007, 129, 15432–15433. [Google Scholar] [CrossRef] [PubMed]
- Reddy, A.S.; Kim, J. Dopamine-functionalized InP/ZnS quantum dots as fluorescence probes for the detection of adenosine in microfluidic chip. Int. J. Nanomed. 2015, 10, 121–128. [Google Scholar] [CrossRef] [Green Version]
- Levy, M.; Bertram, J.R.; Eller, K.A.; Chatterjee, A.; Nagpal, P. Near-Infrared-Light-Triggered Antimicrobial Indium Phosphide Quantum Dots. Angew. Chem. Int. Ed. 2019, 58, 11414–11418. [Google Scholar] [CrossRef]
- Liu, J.; Hu, R.; Liu, J.; Zhang, B.; Wang, Y.; Liu, X.; Law, W.-C.; Liu, L.; Ye, L.; Yong, K.-T. Cytotoxicity assessment of functionalized CdSe, CdTe and InP quantum dots in two human cancer cell models. Mater. Sci. Eng. C 2015, 57, 222–231. [Google Scholar] [CrossRef]
- Riviere, J.E.; Jaberi-Douraki, M.; Lillich, J.; Azizi, T.; Joo, H.; Choi, K.; Thakkar, R.; Monteiro-Riviere, N.A. Modeling gold nanoparticle biodistribution after arterial infusion into perfused tissue: Effects of surface coating, size and protein corona. Nanotoxicology 2018, 12, 1093–1112. [Google Scholar] [CrossRef]
- Brunetti, V.; Chibli, H.; Fiammengo, R.; Galeone, A.; Malvindi, M.A.; Vecchio, G.; Cingolani, R.; Nadeau, J.L.; Pompa, P.P. InP/ZnS as a safer alternative to CdSe/ZnS core/shell quantum dots: In vitro and in vivo toxicity assessment. Nanoscale 2013, 5, 307–317. [Google Scholar] [CrossRef]
- Allocca, M.; Mattera, L.; Bauduin, A.; Miedziak, B.; Moros, M.; De Trizio, L.; Tino, A.; Reiss, P.; Ambrosone, A.; Tortiglione, C. An Integrated Multilevel Analysis Profiling Biosafety and Toxicity Induced by Indium- and Cadmium-Based Quantum Dots in Vivo. Environ. Sci. Technol. 2019, 53, 3938–3947. [Google Scholar] [CrossRef] [Green Version]
- Huang, S.; Qiu, H.; Liu, Y.; Huang, C.; Sheng, J.; Cui, J.; Su, W.; Xiao, Q. Systematical investigation of in vitro interaction of InP/ZnS quantum dots with human serum albumin by multispectroscopic approach. Colloids Surfaces B 2016, 148, 165–172. [Google Scholar] [CrossRef] [PubMed]
- Choi, C.H.J.; Zuckerman, J.E.; Webster, P.; Davis, M.E. Targeting kidney mesangium by nanoparticles of defined size. Proc. Natl. Acad. Sci. USA 2011, 108, 6656–6661. [Google Scholar] [CrossRef] [Green Version]
- Su, Y.; Peng, F.; Jiang, Z.; Zhong, Y.; Lu, Y.; Jiang, X.; Huang, Q.; Fan, C.; Lee, S.; He, Y. In vivo distribution, pharmacokinetics, and toxicity of aqueous synthesized cadmium-containing quantum dots. Biomaterials 2011, 32, 5855–5862. [Google Scholar] [CrossRef] [PubMed]
- Bayal, M.; Janardhanan, P.; Tom, E.; Chandran, N.; Devadathan, S.; Ranjeet, D.; Unniyampurath, U.; Pilankatta, R.; Nair, S.S.; Unnikrishnan, U.; et al. Cytotoxicity of nanoparticles–Are the size and shape only matters? or the media parameters too?: A study on band engineered ZnS nanoparticles and calculations based on equivolume stress model. Nanotoxicology 2019, 13, 1005–1020. [Google Scholar] [CrossRef] [PubMed]
- Hoshino, A.; Fujioka, K.; Oku, T.; Suga, M.; Sasaki, Y.F.; Ohta, T.; Yasuhara, M.; Suzuki, K.; Yamamoto, K. Physicochemical Properties and Cellular Toxicity of Nanocrystal Quantum Dots Depend on Their Surface Modification. Nano Lett. 2004, 4, 2163–2169. [Google Scholar] [CrossRef]
- Chen, T.; Li, L.; Xu, G.; Wang, X.; Wang, J.; Chen, Y.; Jiang, W.; Yang, Z.; Lin, G. Cytotoxicity of InP/ZnS Quantum Dots With Different Surface Functional Groups Toward Two Lung-Derived Cell Lines. Front. Pharmacol. 2018, 9, 763. [Google Scholar] [CrossRef] [Green Version]
- Liang, X.; Wang, H.; Zhu, Y.; Zhang, R.; Cogger, V.C.; Liu, X.; Xu, Z.P.; Grice, J.E.; Roberts, M.S. Short- and Long-Term Tracking of Anionic Ultrasmall Nanoparticles in Kidney. ACS Nano 2016, 10, 387–395. [Google Scholar] [CrossRef]
- Ma, N.; Marshall, A.F.; Gambhir, S.S.; Rao, J. Facile Synthesis, Silanization, and Biodistribution of Biocompatible Quantum Dots. Small 2010, 6, 1520–1528. [Google Scholar] [CrossRef]
- Yaghini, E.; Turner, H.; Pilling, A.; Naasani, I.; MacRobert, A.J. In vivo biodistribution and toxicology studies of cadmium-free indium-based quantum dot nanoparticles in a rat model. Nanomedicine 2018, 14, 2644–2655. [Google Scholar] [CrossRef]
- Lin, G.; Ouyang, Q.; Hu, R.; Ding, Z.; Tian, J.; Yin, F.; Xu, G.; Chen, Q.; Wang, X.; Yong, K.-T. In vivo toxicity assessment of non-cadmium quantum dots in BALB/c mice. Nanomedicine 2015, 11, 341–350. [Google Scholar] [CrossRef]
- Yang, K.; Wang, Y.-W.; Tang, H.; Chen, D.; Bai, Y.-L. Toxicity assessment of repeated intravenous injections of arginine–glycine–aspartic acid peptide conjugated CdSeTe/ZnS quantum dots in mice. Int. J. Nanomed. 2014, 9, 4809–4817. [Google Scholar] [CrossRef] [PubMed] [Green Version]
- Tang, Y.; Han, S.; Liu, H.; Chen, X.; Huang, L.; Li, X.; Zhang, J. The role of surface chemistry in determining in vivo biodistribution and toxicity of CdSe/ZnS core–shell quantum dots. Biomaterials 2013, 34, 8741–8755. [Google Scholar] [CrossRef] [PubMed]
- Zhao, X.; Chen, X.; Zhang, Y.; George, J.; Cobbs, A.; Wang, G.; Li, L.; Emmett, N. Kidney Injury Molecule-1 Is Upregulated in Renal Lipotoxicity and Mediates Palmitate-Induced Tubular Cell Injury and Inflammatory Response. Int. J. Mol. Sci. 2019, 20, 3406. [Google Scholar] [CrossRef] [PubMed] [Green Version]
- Ji, P.-Y.; Li, Z.-Y.; Wang, H.; Dong, J.-T.; Li, X.-J.; Yi, H.-L. Arsenic and sulfur dioxide co-exposure induce renal injury via activation of the NF-κB and caspase signaling pathway. Chemosphere 2019, 224, 280–288. [Google Scholar] [CrossRef]
- Wang, J.; Sun, H.; Meng, P.; Wang, M.; Tian, M.; Xiong, Y.; Zhang, X.; Huang, P. Dose and time effect of CdTe quantum dots on antioxidant capacities of the liver and kidneys in mice. Int. J. Nanomed. 2017, 12, 6425–6435. [Google Scholar] [CrossRef] [Green Version]
- Rimessi, A.; Previati, M.; Nigro, F.; Wieckowski, M.R.; Pinton, P. Mitochondrial reactive oxygen species and inflammation: Molecular mechanisms, diseases and promising therapies. Int. J. Biochem. Cell Boil. 2016, 81, 281–293. [Google Scholar] [CrossRef]


| Genes | Forward primers (5′-3′) | Reverse primers (5′-3′) |
|---|---|---|
| Kim-1 | ACATATCGTGGAATCACAACGAC | ACAAGCAGAAGATGGGCATTG |
| IL-1β | GCAACTGTTCCTGAACTCAACT | ATCTTTTGGGGTCCGTCAACT |
| IL-6 | TAGTCCTTCCTACCCCAATTTCC | TTGGTCCTTAGCCACTCCTTC |
| TNF-α | CCCTCACACTCAGATCATCTTCT | GCTACGACGTGGGCTACAG |
| Caspase 3 | ATGGAGAACAACAAAACCTCAGT | TTGCTCCCATGTATGGTCTTTAC |
| Caspase 7 | AAGACGGAGTTGACGCCAAG | CCGCAGAGGCATTTCTCTTC |
| Caspase 9 | TCCTGGTACATCGAGACCTTG | AAGTCCCTTTCGCAGAAACAG |
| Bax | TGAAGACAGGGGCCTTTTTG | AATTCGCCGGAGACACTCG |
| Bcl-2 | ATGCCTTTGTGGAACTATATGGC | GGTATGCACCCAGAGTGATGC |
| GAPDH | AGGTCGGTGTGAACGGATTTG | TGTAGACCATGTAGTTGAGGTCA |
© 2020 by the authors. Licensee MDPI, Basel, Switzerland. This article is an open access article distributed under the terms and conditions of the Creative Commons Attribution (CC BY) license (http://creativecommons.org/licenses/by/4.0/).
Share and Cite
Li, L.; Chen, T.; Yang, Z.; Chen, Y.; Liu, D.; Xiao, H.; Liu, M.; Liu, K.; Xu, J.; Liu, S.; et al. Nephrotoxicity Evaluation of Indium Phosphide Quantum Dots with Different Surface Modifications in BALB/c Mice. Int. J. Mol. Sci. 2020, 21, 7137. https://doi.org/10.3390/ijms21197137
Li L, Chen T, Yang Z, Chen Y, Liu D, Xiao H, Liu M, Liu K, Xu J, Liu S, et al. Nephrotoxicity Evaluation of Indium Phosphide Quantum Dots with Different Surface Modifications in BALB/c Mice. International Journal of Molecular Sciences. 2020; 21(19):7137. https://doi.org/10.3390/ijms21197137
Chicago/Turabian StyleLi, Li, Tingting Chen, Zhiwen Yang, Yajing Chen, Dongmeng Liu, Huiyu Xiao, Maixian Liu, Kan Liu, Jiangyao Xu, Shikang Liu, and et al. 2020. "Nephrotoxicity Evaluation of Indium Phosphide Quantum Dots with Different Surface Modifications in BALB/c Mice" International Journal of Molecular Sciences 21, no. 19: 7137. https://doi.org/10.3390/ijms21197137
APA StyleLi, L., Chen, T., Yang, Z., Chen, Y., Liu, D., Xiao, H., Liu, M., Liu, K., Xu, J., Liu, S., Wang, X., Lin, G., & Xu, G. (2020). Nephrotoxicity Evaluation of Indium Phosphide Quantum Dots with Different Surface Modifications in BALB/c Mice. International Journal of Molecular Sciences, 21(19), 7137. https://doi.org/10.3390/ijms21197137