Article

Metabolic Inhibition Induces Transient Increase of L-type Ca2+ Current in Human and Rat Cardiac Myocytes

by
Rimantas Treinys
1,
Giedrius Kanaporis
1,
Rodolphe Fischmeister
2 and
Jonas Jurevičius
1,*
1
Institute of Cardiology, Lithuanian University of Health Sciences, Kaunas LT-50162, Lithuania
2
INSERM UMR-S 1180, Univ Paris-Sud, Université Paris-Saclay, Châtenay-Malabry F-92296, France
*
Author to whom correspondence should be addressed.
Int. J. Mol. Sci. 2019, 20(6), 1501; https://doi.org/10.3390/ijms20061501
Submission received: 19 February 2019 / Revised: 15 March 2019 / Accepted: 23 March 2019 / Published: 26 March 2019
(This article belongs to the Special Issue Calcium-Binding Proteins and Cell Signaling)

Abstract

:
Metabolic inhibition is a common condition observed during ischemic heart disease and heart failure. It is usually accompanied by a reduction in L-type Ca2+ channel (LTCC) activity. In this study, however, we show that metabolic inhibition results in a biphasic effect on LTCC current (ICaL) in human and rat cardiac myocytes: an initial increase of ICaL is observed in the early phase of metabolic inhibition which is followed by the more classical and strong inhibition. We studied the mechanism of the initial increase of ICaL in cardiac myocytes during β-adrenergic stimulation by isoprenaline, a non-selective agonist of β-adrenergic receptors. The whole-cell patch–clamp technique was used to record the ICaL in single cardiac myocytes. The initial increase of ICaL was induced by a wide range of metabolic inhibitors (FCCP, 2,4-DNP, rotenone, antimycin A). In rat cardiomyocytes, the initial increase of ICaL was eliminated when the cells were pre-treated with thapsigargin leading to the depletion of Ca2+ from the sarcoplasmic reticulum (SR). Similar results were obtained when Ca2+ release from the SR was blocked with ryanodine. These data suggest that the increase of ICaL in the early phase of metabolic inhibition is due to a reduced calcium dependent inactivation (CDI) of LTCCs. This was further confirmed in human atrial myocytes where FCCP failed to induce the initial stimulation of ICaL when Ca2+ was replaced by Ba2+, eliminating CDI of LTCCs. We conclude that the initial increase in ICaL observed during the metabolic inhibition in human and rat cardiomyocytes is a consequence of an acute reduction of Ca2+ release from SR resulting in reduced CDI of LTCCs.

Graphical Abstract

1. Introduction

The L-type Ca2+ channels (LTCCs) provide Ca2+ for the initiation and regulation of cell contraction and thus play a main role in cardiac muscle contraction. During normal cardiac excitation–contraction coupling, a relatively small amount of Ca2+ enters the cell via the L-type current (ICaL) and this triggers the release of a larger amount of Ca2+ from the sarcoplasmic reticulum (SR) via ryanodine receptors (RyRs) in a process called Ca2+-induced Ca2+ release [1]. The increase of intracellular Ca2+ concentration in the vicinity of closely associated Ca2+ channels and RyRs leads to calcium dependent inactivation (CDI) of LTCCs [2] and reduction of ICaL [3]. Hence, the SR participates in regulation of the activity of plasmalemmal L-type Ca2+ channels [4]. The close functional interaction between plasmalemma and SR means that LTCCs and RyRs can change the activity of each other and alter the balance of cellular Ca2+, which directly activates the contraction of myofilaments. The mechanisms of Ca2+ regulation in diseased cardiac cells may be disordered. Malfunction of LTTCs and RyRs interaction may affect the contractility of myocardium and, as a consequence, the main function of the heart, to pump blood, may be altered.
Metabolic inhibition is commonly observed during ischemic heart disease and heart failure and is associated with biphasic changes in action potential (AP) duration in heart cells and whole heart [5,6]. Numerous studies show a reduction in cardiac LTCC activity and ICaL during metabolic inhibition, however the mechanisms involved are not clear [7,8,9,10,11]. In ischemic heart failure, the cardiac β-adrenergic receptors are downregulated, partly because of the decreased number of the receptors and partly because of internalization and desensitization of the receptors, however also because the sympathetic system is activated and the level of catecholamines is increased [12,13]. Thus, we decided to investigate the effect of metabolic inhibition on ICaL during β-adrenergic stimulation in human atrial and ventricular myocytes and rat ventricular myocytes. Surprisingly, we found that metabolic inhibition causes an acute transient increase of ICaL amplitude followed by a rapid reduction. This is consistent with the most recent study demonstrating AP prolongation during metabolic inhibition in the rabbit heart [6], however is in contrast with what we reported recently in frog cardiomyocytes, where metabolic inhibition only suppresses ICaL without the initial increase [11]. We explored the mechanisms responsible for the initial increase in ICaL during metabolic inhibition. Our results point to a modulation of the Ca2+-dependent inactivation of LTCCs by the RyRs mediated Ca2+ release.

2. Results

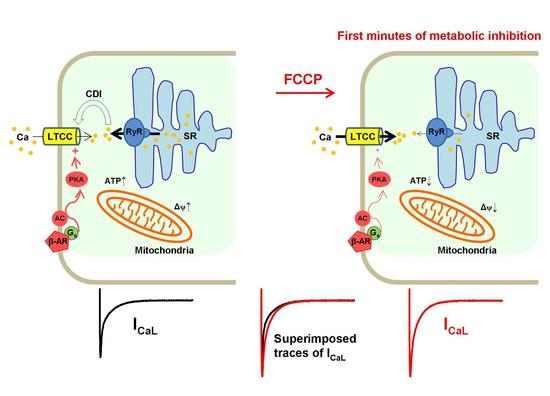
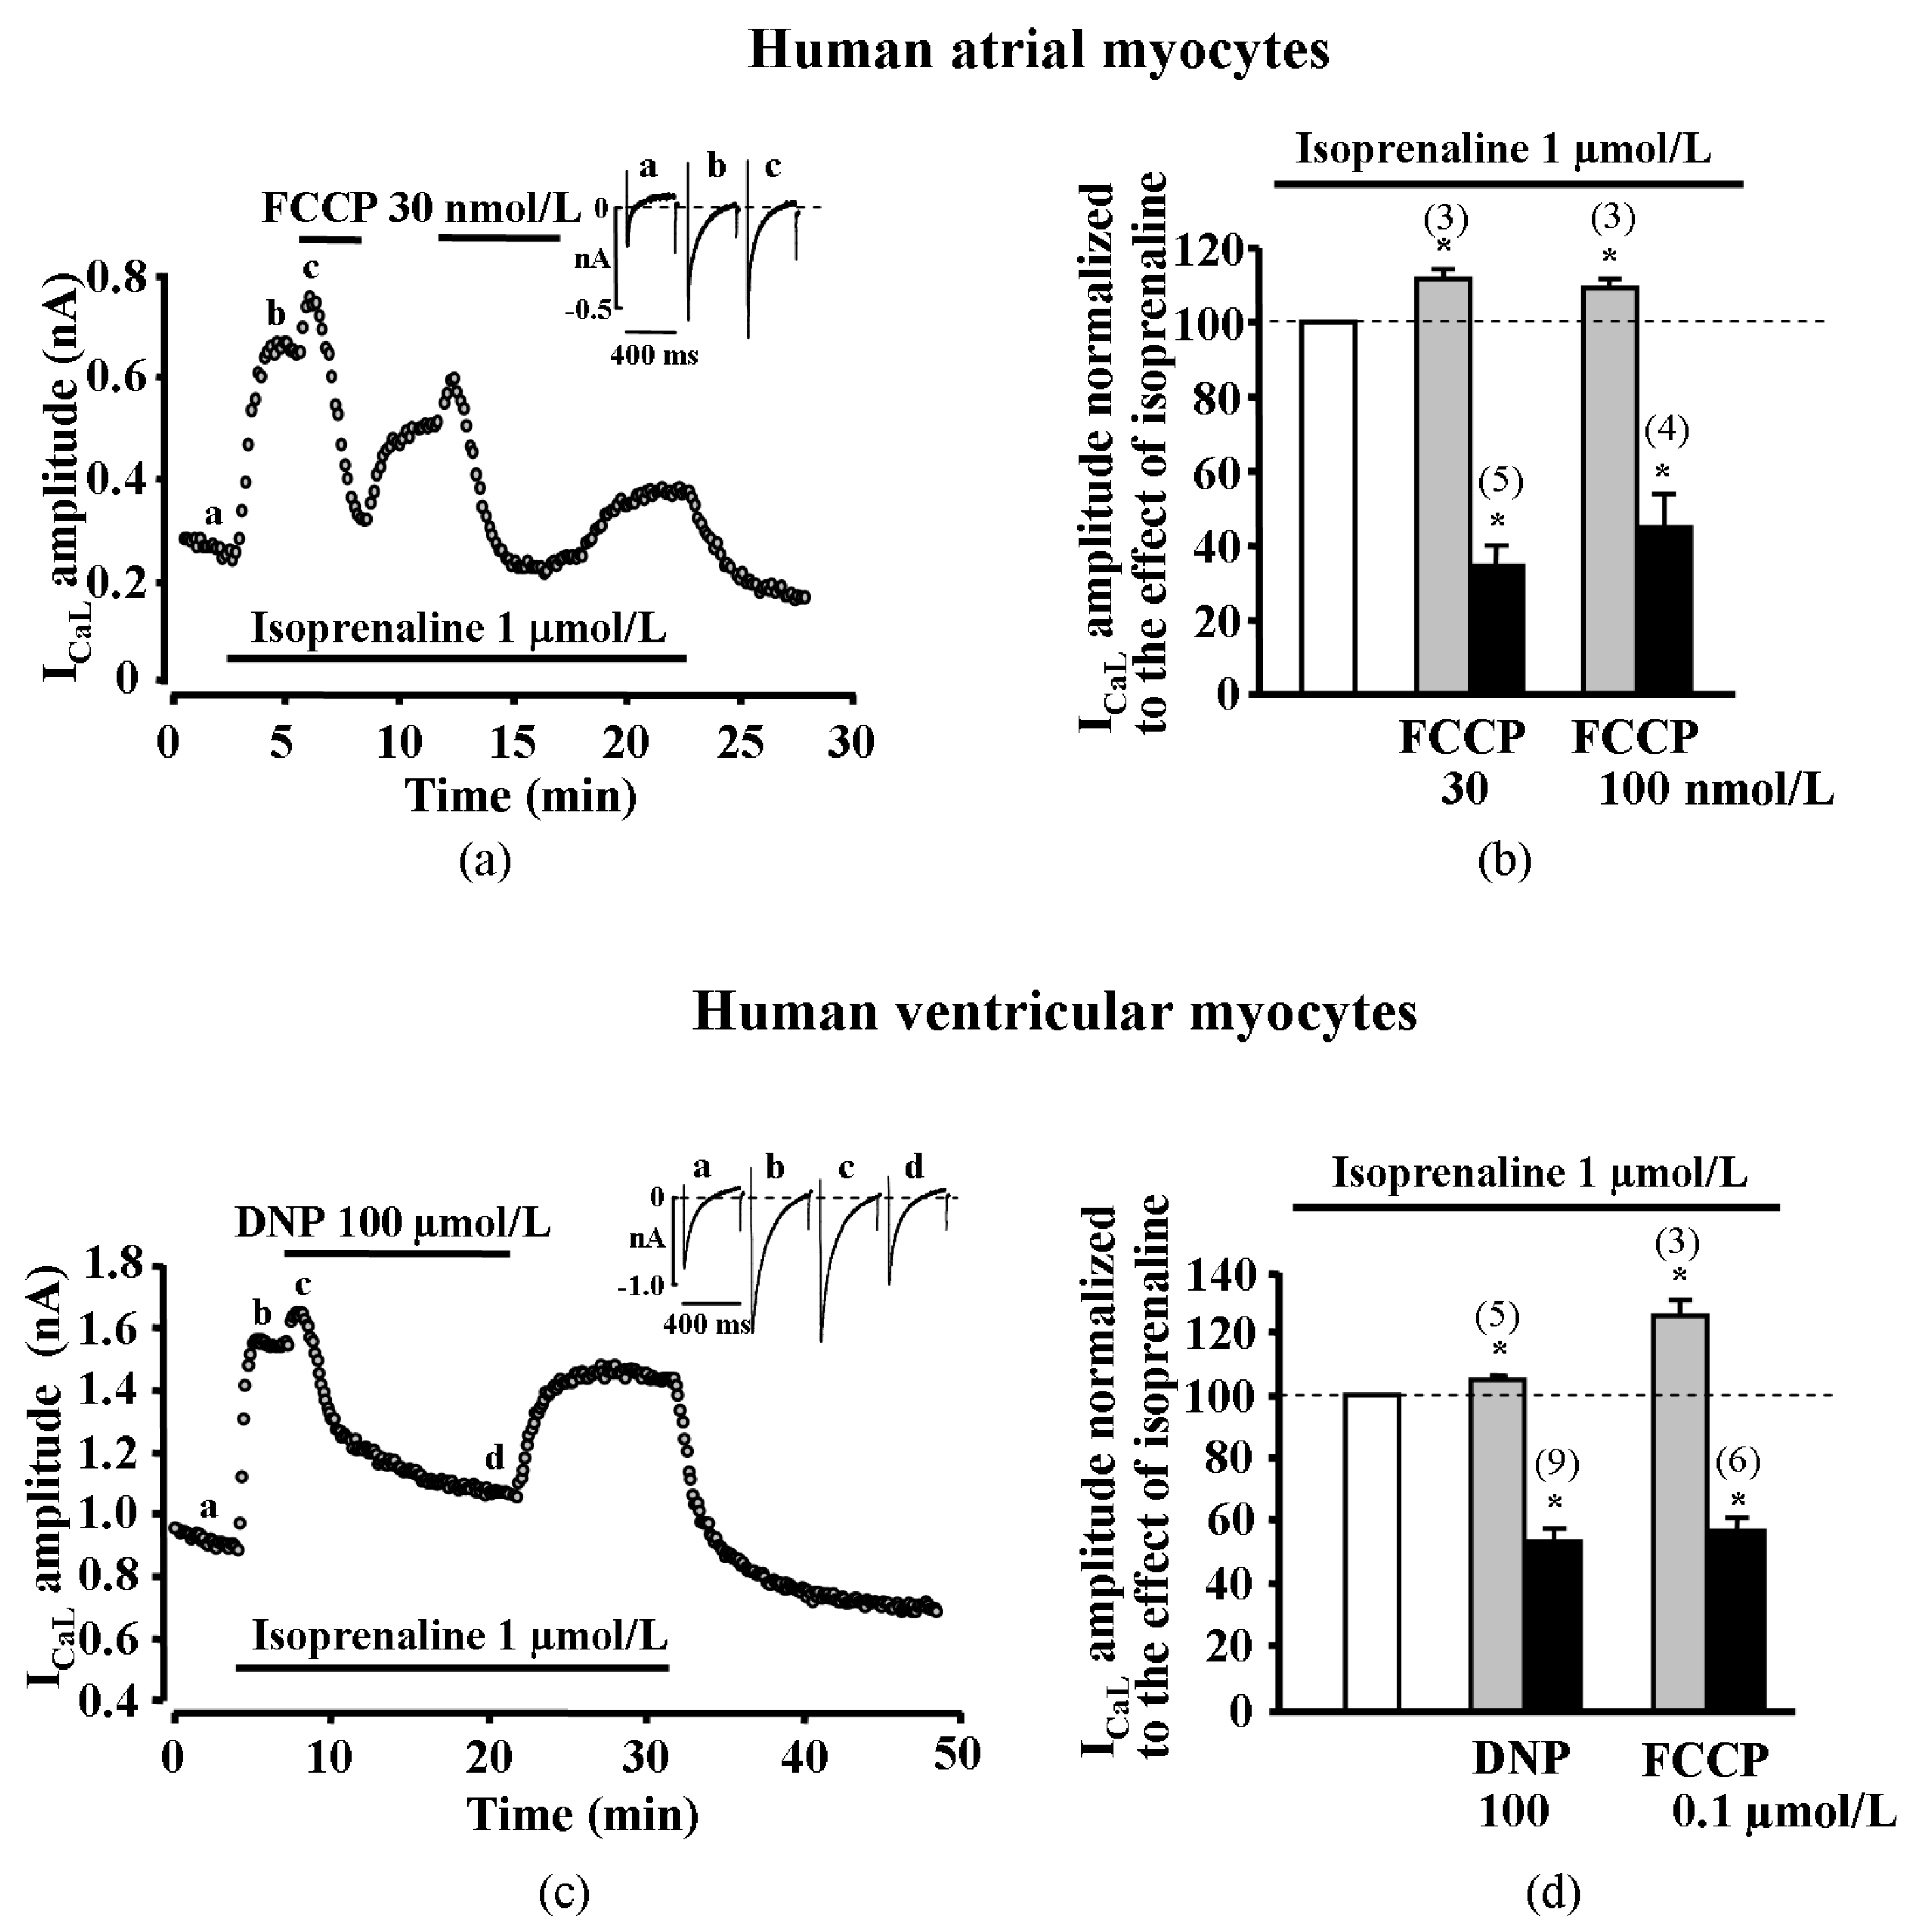
2.1. Effect of Metabolic Inhibition on ICaL in Human Atrial Myocytes

The first series of experiments were set to determine the effect of metabolic inhibition on ICaL in human atrial myocytes. The cardiac myocytes for the first series of experiments were derived from five patients. Metabolic inhibition was induced by the application of mitochondrial uncoupler carbonyl cyanide-p-trifluoromethoxyphenylhydrazone (FCCP) to isoprenaline (a non-selective agonist of β-adrenergic receptors, ISO) stimulated human atrial cells and changes of ICaL were monitored. Surprisingly, in most of the tested human atrial cells, FCCP induced a biphasic effect on ICaL, i.e., a rapid initial stimulation of ICaL that was followed by a strong inhibition of ICaL.
The initial stimulation of ICaL induced by FCCP was recorded in six out of nine (~67%) tested human atrial myocytes. In these cells, the application of 30 or 100 nmol/L of FCCP resulted in a transient increase of ISO-stimulated ICaL by 11.4 ± 2.5% (n = 3, p < 0.05, 2 patients) and 9.0 ± 2.8% (n = 3, p < 0.05, 2 patients), respectively. In all human atrial myocytes tested, metabolic inhibition led to a final suppression of ICaL by 65.5 ± 5.6% (n = 5, p < 0.05, 2 patients) and 55.8 ± 9.8% (n = 4, p < 0.05, 3 patients) with 30 and 100 nmol/L FCCP, respectively (Figure 1a,b).

2.2. Effect of Metabolic Inhibition on ICaL in Human Ventricular Myocytes

The next series of experiments were set to determine the effect of metabolic inhibition on ICaL in human ventricular myocytes. The ventricular myocytes for these series of experiments were derived from eight patients. We performed experiments in human ventricle myocytes, applying metabolic inhibitors FCCP and 2,4-Dinitrophenol (DNP) on ISO (1 μmol/L) stimulated cells. We found that FCCP induced a rapid initial stimulation of ICaL in three out of six ventricular myocytes (five patients). Further, 100 nmol/L of FCCP increased ISO-stimulated ICaL by 24.8 ± 5.3% (n = 3, p < 0.05). The reduction of ICaL induced by FCCP was registered in all tested cells, i.e., ICaL was reduced by 42.5 ± 3.5% (n = 6, p < 0.05). Another uncoupler, DNP, also evoked a transient increase of ISO-stimulated ICaL in five ventricular myocytes from nine (three patients). Further, 100 µmol/L of DNP increased ISO-stimulated ICaL by 5.0 ± 0.9% (n = 5, p < 0.05). The reduction of ICaL by 44.8 ± 4.4% induced by DNP was registered in all (n = 9, p < 0.05) human ventricular myocytes (Figure 1c,d). The initial stimulation of ICaL induced by uncouplers FCCP and DNP was recorded in eight out of 15 (~53%) tested human ventricular myocytes.

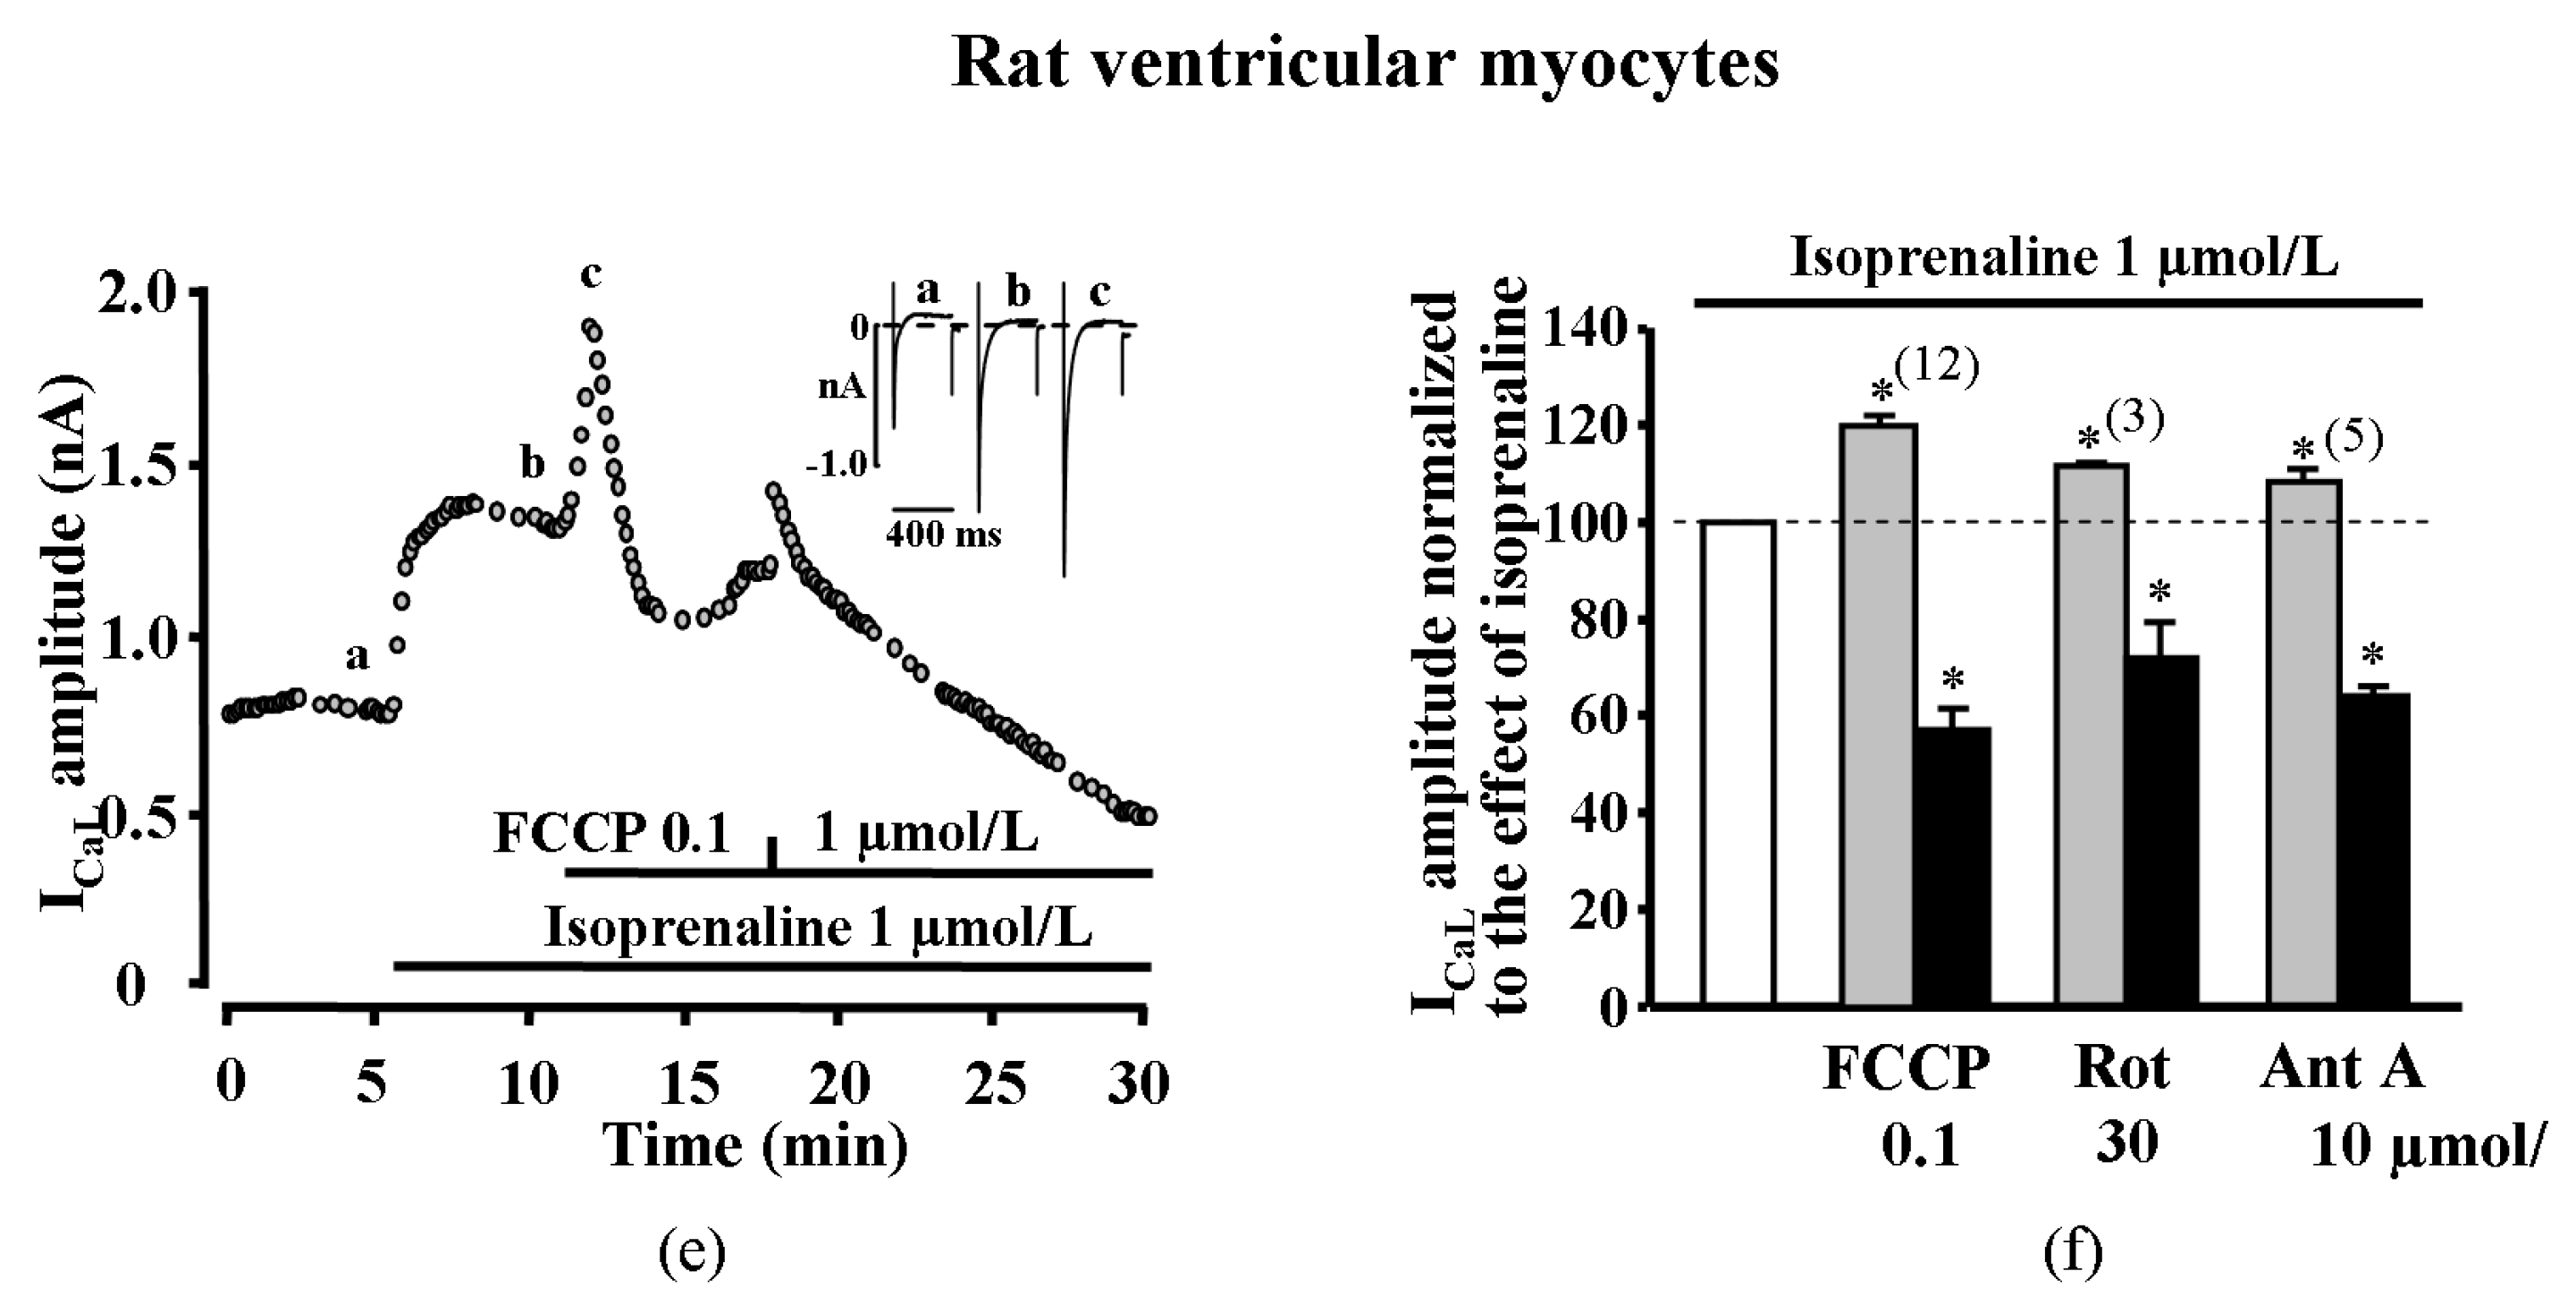
2.3. Transient Increase of ICaL is Also Elicited in Rat Cardiac Myocytes

While ICaL suppression during metabolic inhibition was previously demonstrated by numerous studies [7,8,9,10], the transient increase in ICaL amplitude during metabolic inhibition in cardiac myocytes has not previously been reported. To determine if this phenomenon is specific to human cardiomyocytes, we reproduced the same type of experiments in rat ventricular myocytes. Application of FCCP (100 nmol/L) in ISO-stimulated cells induced a transient increase in ICaL by 20.2 ± 2.7% (n = 12, p < 0.05, four animals) that was followed by ICaL reduction by 42.4 ± 4.6% (n = 12, p < 0.05) (Figure 1e,f). Higher concentrations of FCCP like 300 nmol/L (not shown) and 1 μmol/L (Figure 1e) also induced a biphasic effect in rat ventricular myocytes.
To confirm that the effects of uncouplers on ICaL were due to metabolic inhibition, effects of other metabolic inhibitors were also tested. Rotenone (30 µmol/L), an inhibitor of the complex I of the mitochondrial respiratory chain, also caused an initial increase of ISO-stimulated ICaL by 11.4 ± 0.2% (n = 3, p < 0.05, 2 animals) and later reduced ICaL by 28.2 ± 7.6% (n = 3, p < 0.05). Antimycin A (10 µmol/L), an inhibitor of the complex III of the mitochondrial respiratory chain, initially increased ISO stimulated ICaL by 8.3 ± 2.3% (n = 5, p < 0.05) and decreased by 35.5 ± 1.9% (n = 5, p < 0.05, 3 animals, Figure 1f, Supplementary Figure S1). The initial transient stimulation of ICaL was recorded in all tested rat cardiomyocytes during the early phase of metabolic inhibition regardless of the metabolic inhibitor used. The effects of metabolic inhibitors in cardiac cells are summarized in Supplementary Table S1.

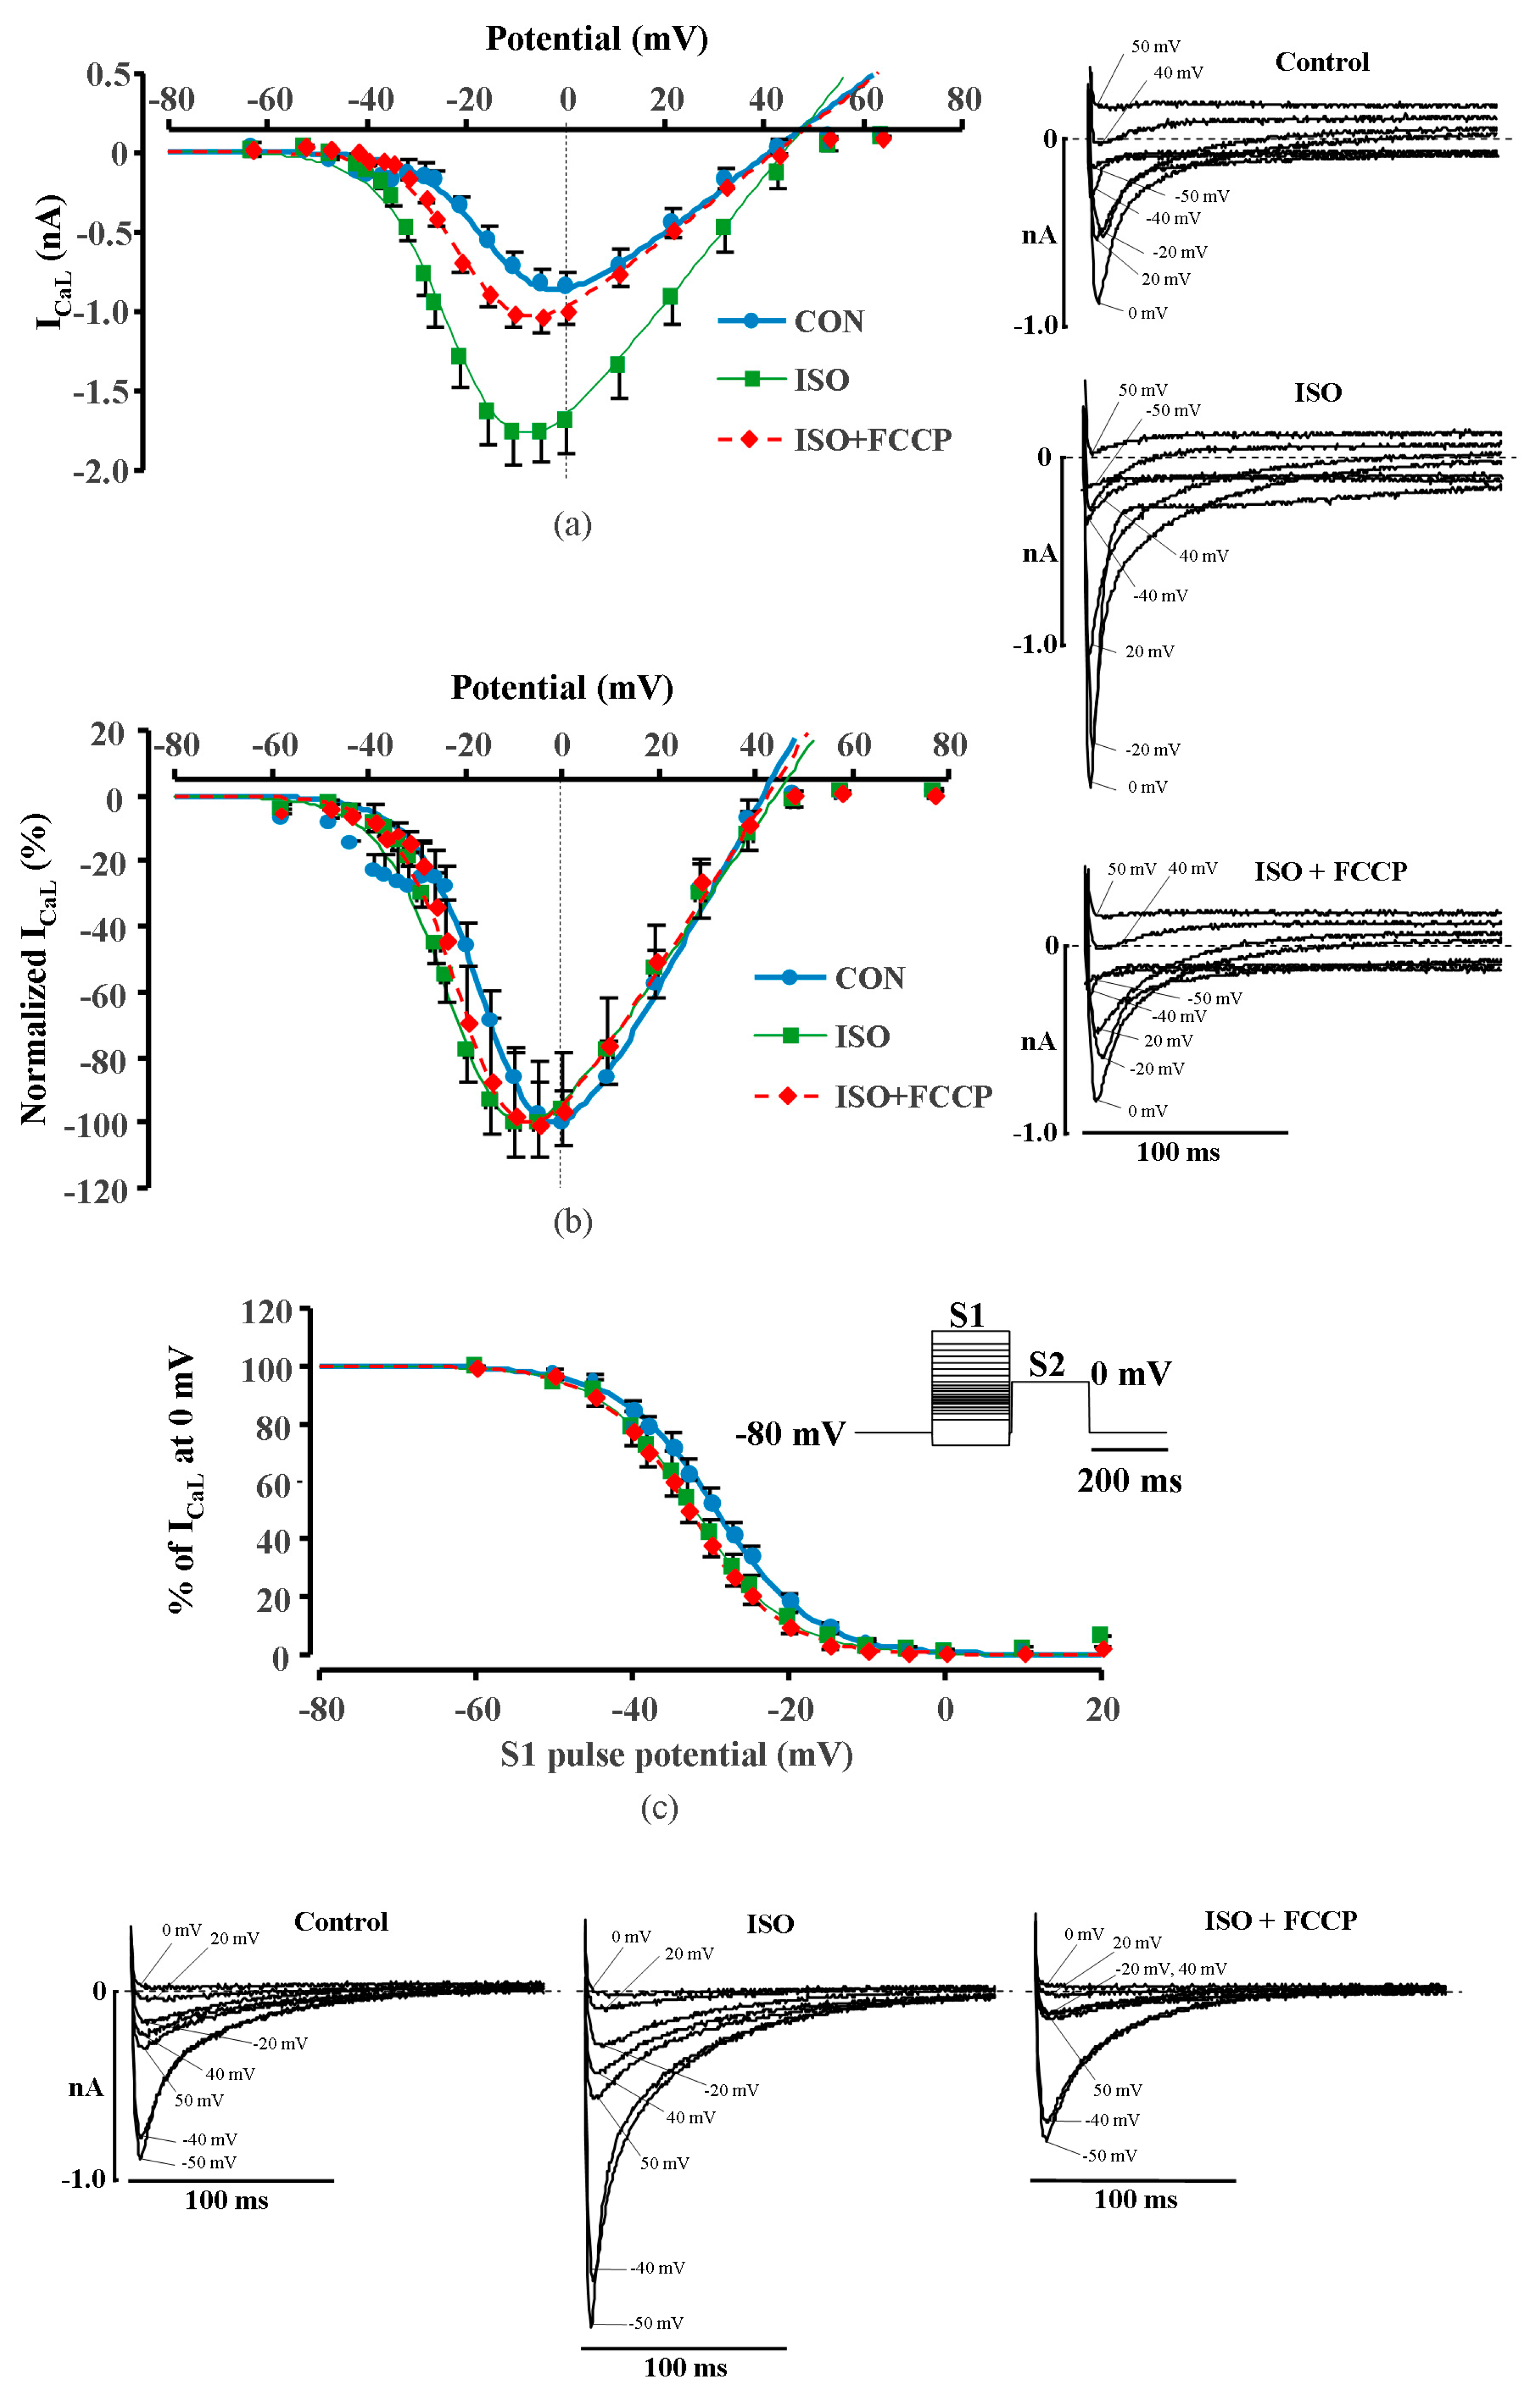
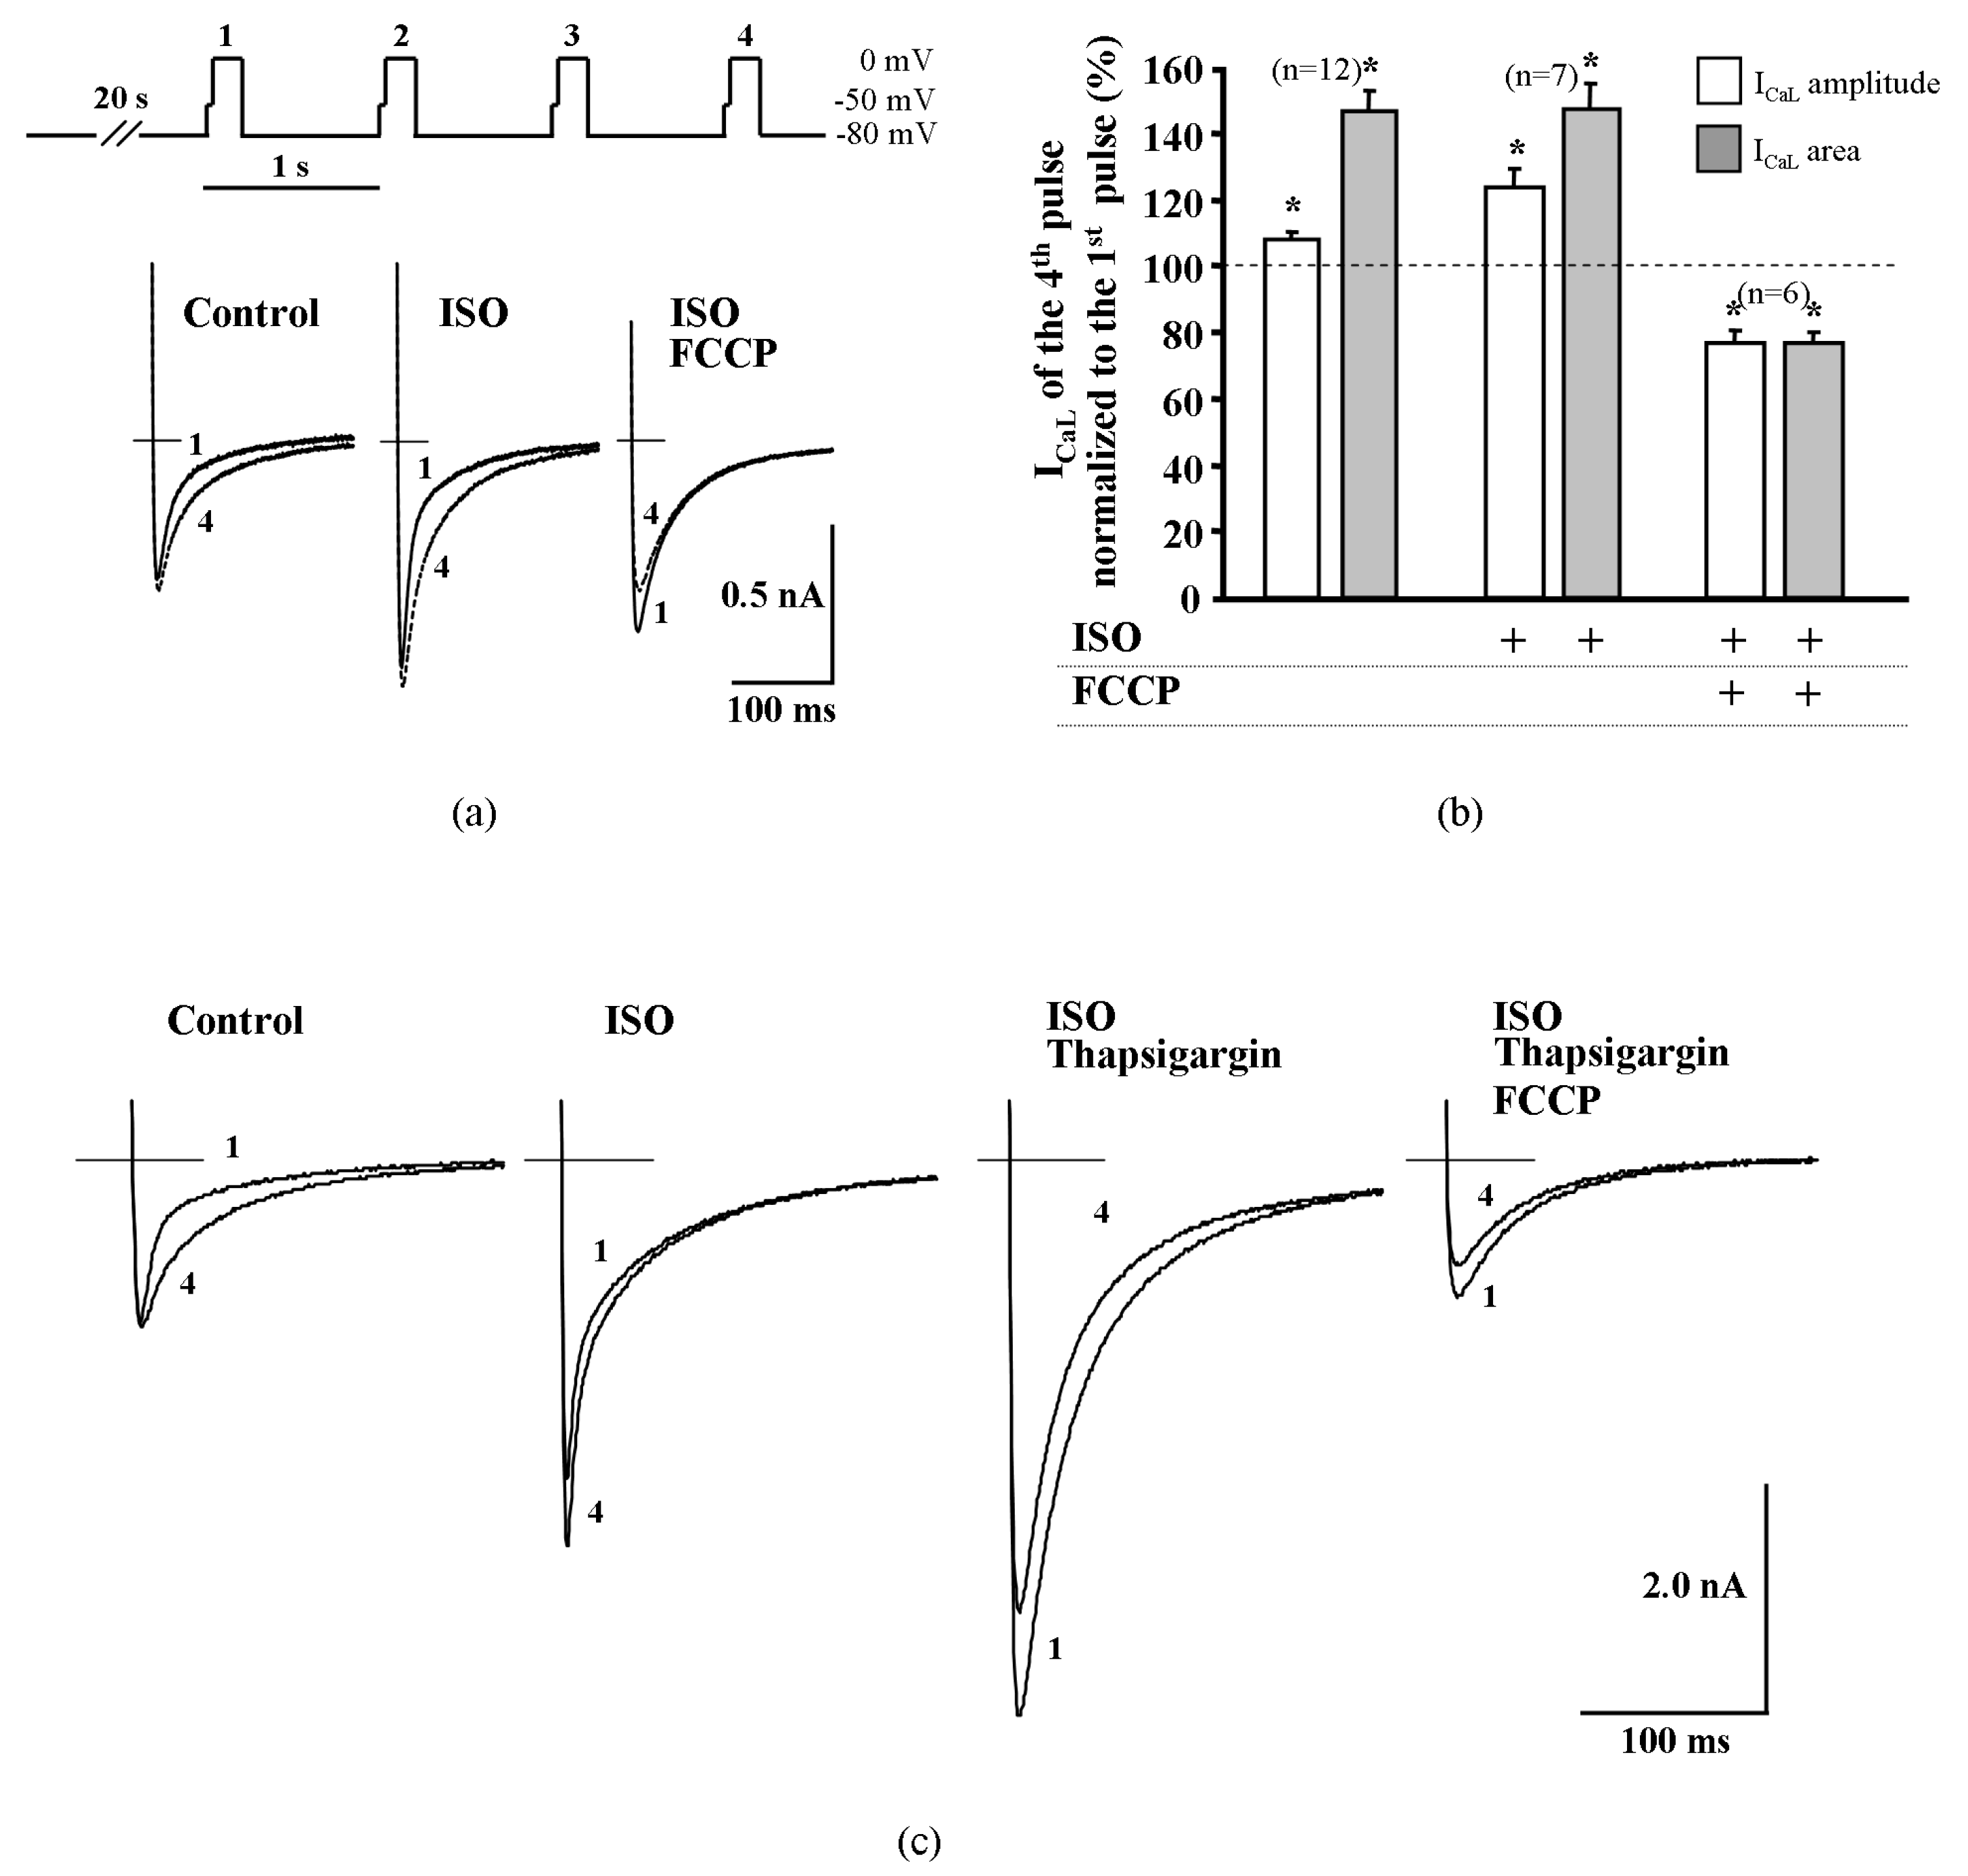
2.4. Effect of Metabolic Inhibition on ICaL Kinetics

To get an insight on the possible mechanisms of ICaL increase, we analyzed the effect of metabolic inhibition on time dependent inactivation of ICaL in ISO stimulated cells. The time dependent inactivation of ICaL in isolated adult rat ventricular myocytes was determined by bi-exponential fitting to the decay of current (see Methods) and by characterizing two kinetically distinct fast (ICaL,1) and slow (ICaL,2) current components [14]. Double exponential fit to the decay phases of ICaL revealed that during the transient increase of ICaL with FCCP (100 nmol/L) in ISO stimulated cells, the time constant of the fast component τ1 increased from 5.3 ± 0.3 ms to 7.9 ± 1.1 ms (n = 12, p < 0.05), while the time constant of the slow component τ2 decreased from 48.7 ± 2.9 ms to 42.6 ± 2.5 ms (n = 12, p < 0.05). The changes in the amplitude of fast and slow components of ICaL were relatively small. During the inhibitory phase when the effect of FCCP reached steady-state, τ1 and τ2 were 13.8 ± 2.1 ms (n = 12, p < 0.05) and 42.7 ± 3.6 ms (n = 12), respectively, meanwhile the amplitude of both components of ICaL were reduced. The ICaL curves are presented in Supplementary Figure S2. These data show that in the presence of FCCP, there is a significant increase in τ1, suggesting a diminished calcium dependent inactivation (CDI) of the channels.
We also measured the current–voltage relationship (I–V) and the steady–state inactivation of ICaL in rat ventricular cells (Figure 2). Averaged data of ICaL I–V curves (Figure 2a and normalized data in Figure 2b) and inactivation (Figure 2c) in control conditions, in the presence of ISO and in the presence of ISO + FCCP, are shown. The points in the figure represent experimental recorded data and the I–V curves were fitted to the Boltzmann equation (see Methods). Derived values for V1/2 in control, ISO and FCCP were −13.26 ± 0.87 mV, −20.71 ± 0.81 mV and −18.80 ± 0.99 mV and k was 6.9 ± 0.4, 7.1 ± 0.6 and 6.5 ± 0.2 (n = 3), respectively. As expected, ISO significantly shifted I–V curve to the left [15] by > 7 mV (p < 0.05) while FCCP had no significant effect on the ICaL I–V relationship. The fit of the steady–state inactivation curves for control, ISO and FCCP led to V1/2 values of −29.20 ± 1.15 mV, −32.05 ± 1.60 mV and −32.75 ± 1.42 mV, respectively, and k was 6.2 ± 0.1, 5.9 ± 0.3 and 5.7 ± 0.1 (n = 3), respectively. Again, ISO significantly shifted the inactivation of ICaL to the left by ≈3 mV (p < 0.05), however the effect of FCCP was negligible. The changes of curve steepness k under the influence of ISO or FCCP were insignificant both for I–V and for steady–state inactivation curves.

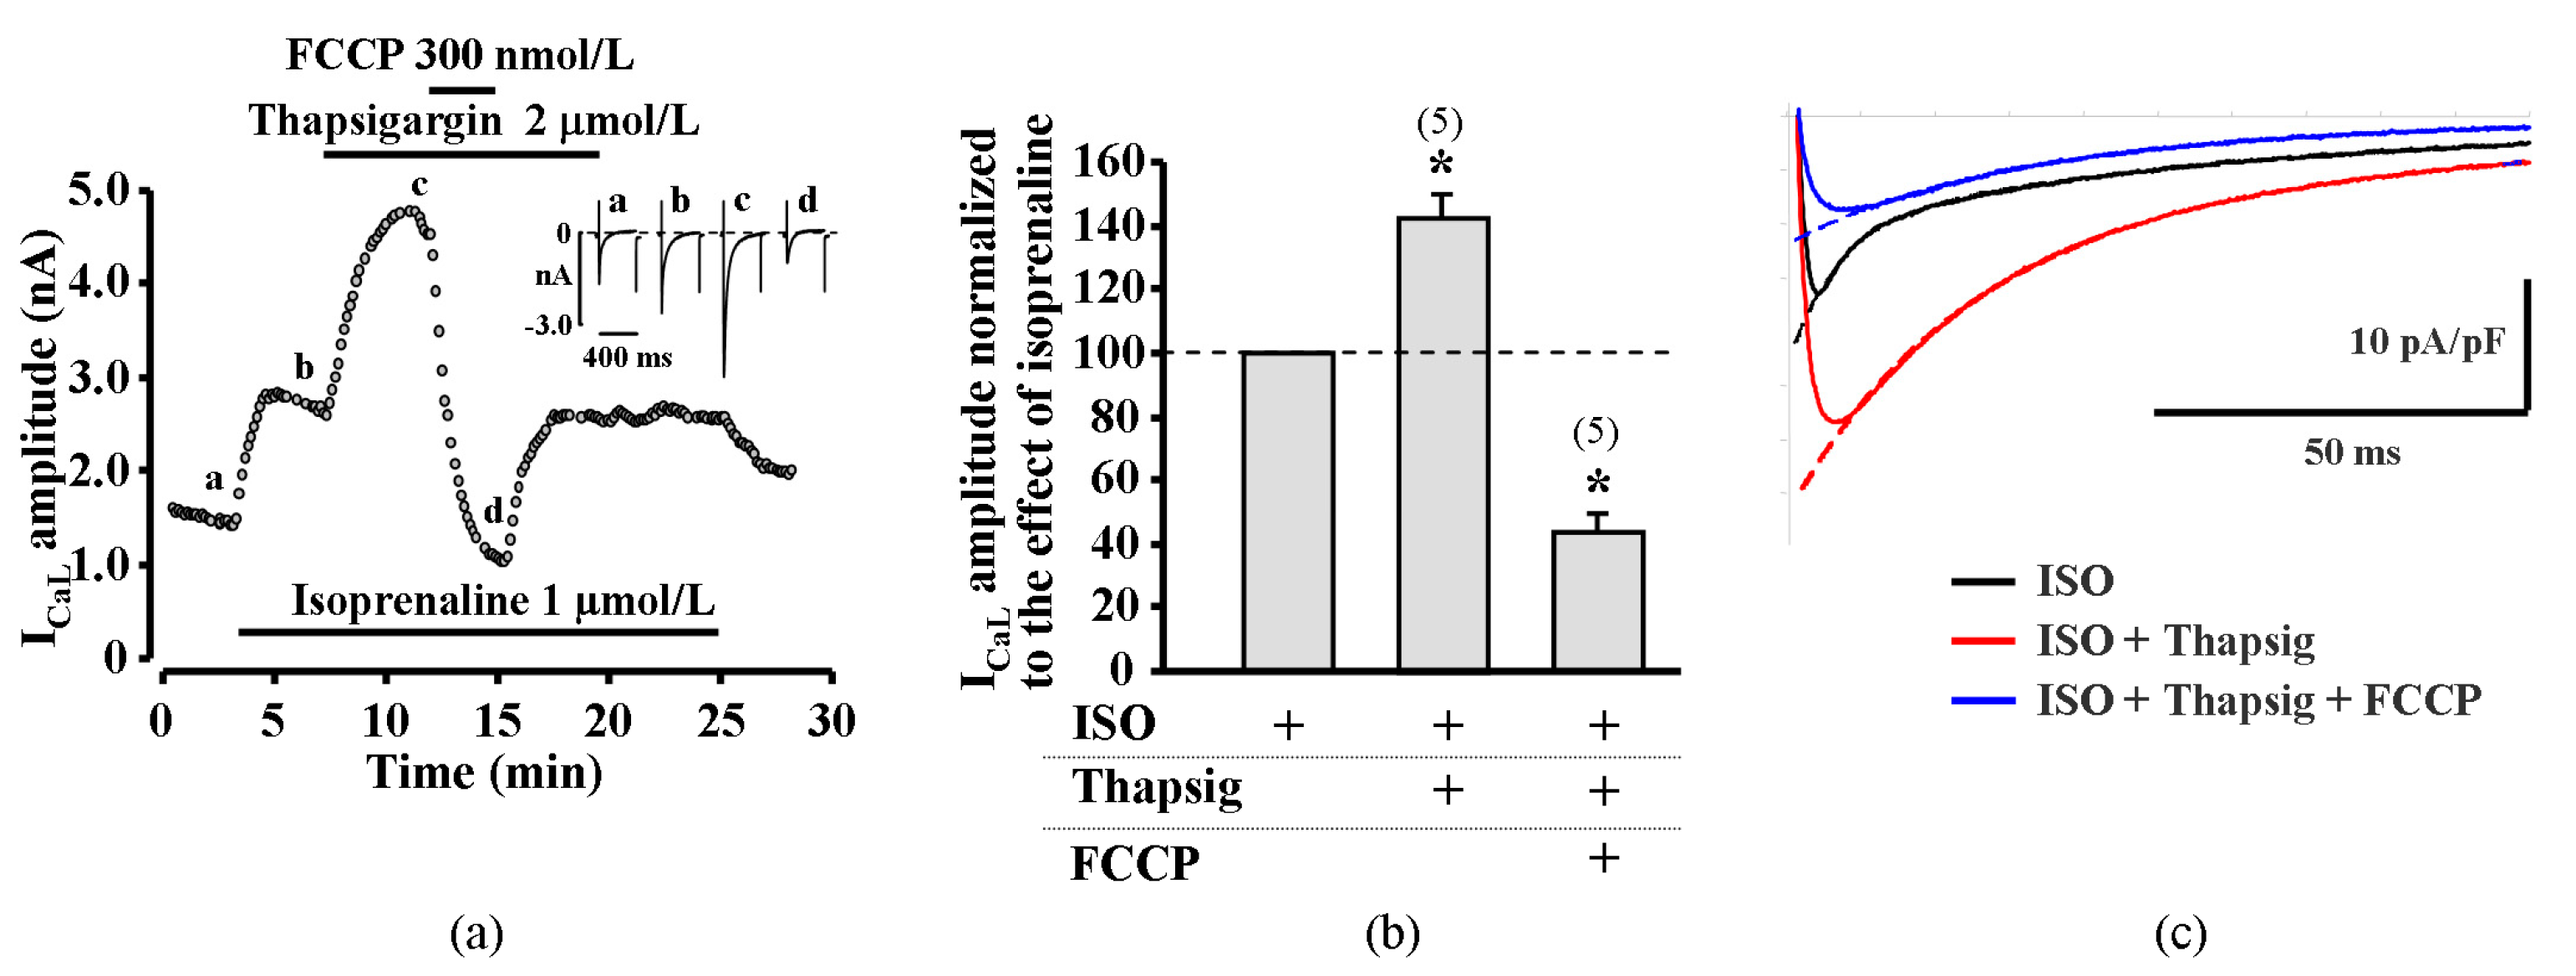
2.5. Suppression of Cytosolic Ca2+ Release Abolish Transient Increase of ICaL

The above results showed that in human and rat cardiac cells, metabolic inhibition induced initial transient increase of ICaL. In our previous study, we found no such stimulation during metabolic inhibition in frog cardiomyocytes [11] where SR is scarce and lacks ryanodine channels [16] and, in contrast to mammalian cells, LTCCs do not have such a strong functional relationship with RyRs. Consequently, we hypothesized that the observed increase of ICaL in mammalian cells may involve metabolic sensitivity of SR and RyRs in regulation of calcium dependent inactivation (CDI) of LTCCs. To test this hypothesis, additional experiments were performed in rat cardiomyocytes in which Ca2+ release from SR was suppressed prior to metabolic inhibition.
First, metabolic inhibition was induced after the pretreatment of myocytes with thapsigargin (2 μmol/L). Thapsigargin inhibits SR Ca2+ ATPase (SERCA) and impairs Ca2+ uptake by the SR and thus leads to the depletion of Ca2+ in the SR [17]. As expected, thapsigargin diminished CDI of LTCCs which led to the increase in ISO-stimulated ICaL in rat ventricular myocytes to 142.1 ± 8.3%, i.e., from 17.7 ± 0.5 pA/pF to 25.1 ± 0.9 pA/pF (n = 5, p < 0.05). In the presence of thapsigargin, the initial ICaL increase was completely eliminated and only an inhibitory effect of FCCP on ISO stimulated ICaL was observed (n = 5, p < 0.05) (Figure 3a,b). Double exponential fit of the decay of ICaL revealed that application of thapsigargin on ISO stimulated rat cardiac cells resulted in an increase of all ICaL parameters. The time constants τ1 and τ2 increased from 5.5 ± 0.5 ms to 26.2 ± 2.6 ms and from 70.3 ± 4.2 ms to 88.2 ± 3.0 ms (n = 4, p < 0.05), respectively. In the presence of thapsigargin, the effect of FCCP on τ1 was abolished. The time constant τ1 in such conditions remained similar to thapsigargin treated cells and was 26.4 ± 0.5 ms, while τ2 was similar to ISO stimulated ICaL and was 69.1 ± 3.7 ms (n = 4). The representative ICaL traces and their fits are shown in Figure 3c. Additionally, we used an alternative approach to eliminate the CDI of LTCCs prior the metabolic inhibition by blocking RyR channels with ryanodine (10 μmol/L) in rat ventricular cells. Similar to experiments with thapsigargin, ryanodine increased ISO stimulated ICaL and the application of FCCP failed to induce the initial ICaL increase and, thus, only an inhibition of ISO stimulated ICaL was observed (Supplementary Figure S3).
The results obtained with thapsigargin and ryanodine in rat ventricular cells point to a possible role of CDI in the ICaL increase during the early phase of metabolic inhibition. To further confirm this hypothesis, we measured the changes of ICaL facilitation in rat cardiac cells in the absence and presence of FCCP. Increased frequency (to 1 Hz) of depolarization after a 20 s pause was used in these series of experiments. The peak amplitude of ICaL and the ICaL area were compared at the time of the first and fourth depolarizing pulse. In control conditions, increased stimulation frequency enhanced ICaL amplitude by 8.3 ± 2.1% and the area by 46.9 ± 6.3% (n = 12, p < 0.05) during the fourth depolarizing pulse. In ISO stimulated rat cardiac cells, increasing stimulation frequency to 1 Hz also induced ICaL facilitation and increased ICaL peak amplitude and area by 22.2 ± 5.3% and 42.0 ± 8.6% (n = 7, p < 0.05), respectively (Figure 4a,b). Double exponential fits of ICaL decay during the first and fourth depolarizing pulses revealed that the time constant of the fast component τ1 increased from 5.8 ± 0.5 ms to 7.3 ± 0.7 ms (n = 8, p < 0.01), while the time constant of the slow component τ2 decreased from 62.1 ± 4.8 ms to 51.3 ± 2.6 ms (n = 8, p < 0.01). The ICaL curves are presented in Supplementary Figure S4. After treatment of rat ventricular myocytes with FCCP, ICaL facilitation was no longer observed and ICaL amplitude and area were reduced by 23.6 ± 4.1% and 23.1 ± 3.3% (n = 6, p < 0.05, Figure 4a,b) during the fourth depolarizing pulse, respectively.
These data indicate that pharmacological or frequency-dependent depletion of Ca2+ from the cytosolic Ca2+ store results in an increased τ1 and thus reduced CDI, followed by an increase of Ca2+ influx through LTCCs, a process that is possibly observed during the early phase of metabolic inhibition.
Depletion of Ca2+ from the SR by thapsigargin eliminated ICaL facilitation (Figure 4c) and, during the application of ICaL facilitation protocol, the amplitude and area of ICaL measured during the fourth depolarizing pulse were reduced by 20.0 ± 0.6% and 22.8 ± 2.4%, respectively (n = 4, p < 0.05) when compared with the first depolarizing pulse. After the application of FCCP in ISO-stimulated and thapsigargin treated rat cells, the ICaL frequency-dependent facilitation remained abolished and the amplitude and area of ICaL were reduced during the fourth depolarizing pulse by 22.7 ± 1.8% and 20.0 ± 1.4%, respectively (n = 4, p < 0.05). The observation that the application of FCCP abolishes the facilitation of ICaL in a similar manner as the depletion of Ca2+ from the SR, indicates that FCCP affects CDI of LTCCs.

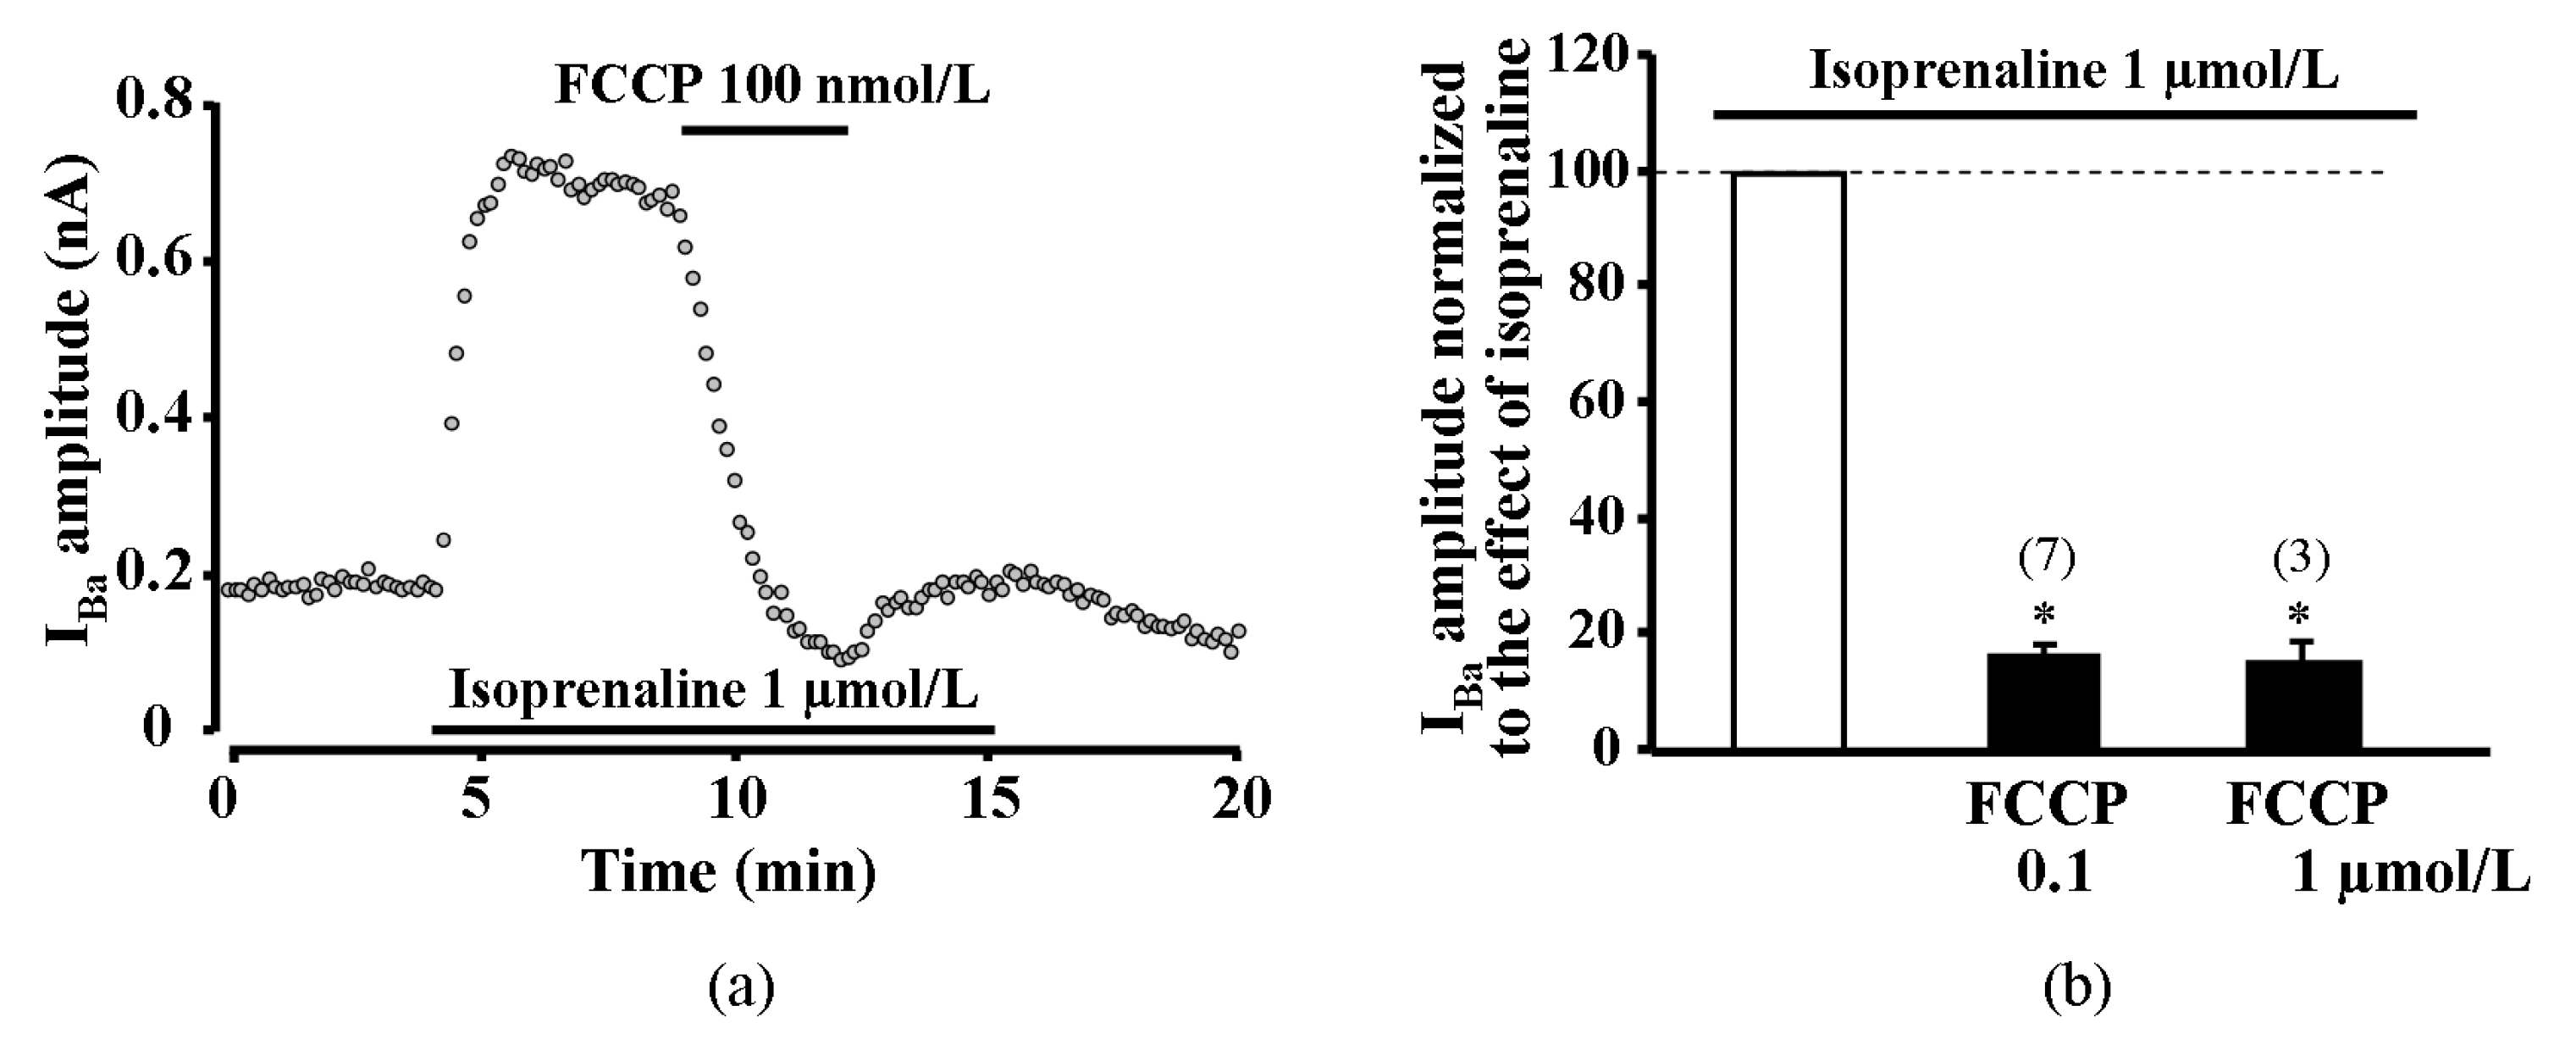
2.6. Effect of Metabolic Inhibition on Ba2+ Current (IBa) through L-Type Calcium Channels

As an alternative approach to test if reduced CDI plays a key role in the transient potentiation of ICaL during metabolic inhibition, we performed experiments in human atrial myocytes in which CaCl2 in the external solution was replaced by the equimolar BaCl2. LTCCs are permeable to Ba2+, however Ba2+ ions do not induce Ca2+ release from the SR and, thus, abolish CDI of LTCCs. As shown in Figure 5, metabolic inhibition induced only the suppression of Ba2+ current (IBa) without the transient increase observed in ICaL. At 100 nmol/L and 1 μmol/L concentrations, FCCP suppressed the ISO-stimulated IBa by 83.3 ± 1.6% (n = 7, p < 0.05, 3 patients) and 84.5 ± 3.5% (n = 3, p < 0.05, 2 patients), respectively (Figure 5b).

3. Discussion

In the present study, we demonstrate that metabolic inhibition has a biphasic effect on ICaL in mammalian cardiac myocytes. In most human atrial and ventricular myocytes and in all the tested rat ventricular myocytes that were stimulated by isoprenaline metabolic inhibition, this induced an initial transient increase of ICaL which was followed by a strong inhibition of ICaL. The transient increase in ISO stimulated ICaL was induced by various metabolic inhibitors (FCCP, DNP, rotenone, antimycin A), demonstrating that the observed effect is not dependent on the method used to induce metabolic inhibition. In the control experiments without metabolic inhibition, we observed only run-down of the ICaL and no spontaneous increase in ICaL was detected (Supplementary Figure S5). We propose that the transient ICaL increase during the initial phase of metabolic inhibition is due to impaired intracellular calcium cycling and suggest that this increase in ICaL is mediated by weak CDI due to metabolic failure of Ca2+ release from SR via RyRs. Presumably, during metabolic inhibition, the stimulation of ICaL and suppression of ICaL happen at the same or almost at the same time and therefore it is difficult to discriminate between these two processes. The suppression becomes dominant during exposure to the metabolic inhibitors and therefore makes evaluation of dose-response difficult and not reliable. In this study, we seek to reveal the mechanism of the transient increase of ICa,L during metabolic inhibition and did not conduct concentration–dependence experiments.
To our knowledge, ICaL stimulation by metabolic inhibitors has not been previously reported in cardiac cells. McHugh and Beech (1996) [18] found a similar effect in single smooth muscle cells isolated from the basilar artery of the guinea pig where the mitochondrial uncoupler 2,4-dinitrophenol induced an initial stimulation of ICaL in some of the cells, which was followed by a pronounced current inhibition. The authors have attributed this effect to a leftward shift of the Ca2+ channel activation curve. In our experiments, the leftward shift in the ICaL I–V relationship was induced only by application of ISO which is consistent with β-adrenergic stimulation [15]. However, there was no additional shift in the ICaL I–V curve during the application of FCCP (Figure 2). Therefore, the transient increase in ICaL during metabolic inhibition in cardiac myocytes can not be attributed to the changes in LTCCs voltage-dependent activation.
Our recent study [11] has revealed that metabolic inhibition only exerts a strong inhibitory effect on ICaL in amphibian heart cells without the initial transient increase observed here. In frog cardiomyocytes, SR is scarce and lacks ryanodine channels [16]. Thus, LTCCs are the primary source of Ca2+ for contraction in amphibian cardiomyocytes and Ca2+ release from the SR plays only a minor role, while in mammalian hearts, the SR serves as the main Ca2+ store and plays an important role in the regulation of the activity of LTCCs [4,19]. Therefore, we have hypothesized that impairment of Ca2+ induced Ca2+ release (CICR) leading to diminished Ca2+ dependent inactivation (CDI) of LTCCs might underlie the transient increase in ICaL amplitude. It has previously been demonstrated that metabolic inhibition affects properties of intracellular Ca2+ release and decreases frequency of spontaneous Ca2+ waves [10,20]. The reports on the changes in SR Ca2+ load during metabolic inhibition are rather inconsistent as some studies have reported no change or a decrease in SR Ca2+ content [8,21], while others demonstrated an increase in SR Ca2+ load [20]. Such discrepancies in the results can be at least partially explained by the reported biphasic effect of metabolic inhibition on intracellular Ca2+ signaling, consisting of an initial inhibition followed by stimulation of SR Ca2+ release [10]. The effect of metabolic inhibition on SR may arise due to the changes in high-energy phosphate compounds and/or the increase in intracellular acidosis. Recently, we have shown that acidosis may play a key role in the suppression of LTCCs activity during metabolic inhibition [11]. The intracellular acidification may also inhibit the release of Ca2+ from SR as well as the reuptake of Ca2+ to the SR by SR Ca2+ ATP-ase, the activity of which may also be inhibited by deficiency of energy compounds. During metabolic inhibition, both Ca2+ release (RyRs) and reuptake (Ca2+ ATP-ase) mechanisms are inhibited to a different extent [20]. Recently, it was demonstrated that during metabolic inhibition, calcium transients (CaTs) are decreased and AP is prolonged [6]. This reduction of CaT can result in the slowdown of LTCCs inactivation and may be involved in the prolongation of AP in rabbit hearts [6]. The transient increase of ICaL during ischemia may lead to early afterdepolarisation and long QT which can be followed by arrhythmias. In our study, double exponential fit to ICaL curves showed a significant increase of the fast component τ1 during the transient increase of ICaL in the presence of FCCP. It is known that the fast component of ICaL inactivation is dependent on the magnitude of Ca2+ release from SR [2]. Thus, this also points to the possible connection between the transient increase of ICaL and intracellular Ca2+ release during metabolic inhibition. In order to test the hypothesis that the changes of Ca2+ release from SR result in the potentiation of ICaL, we have performed a series of experiments where, prior to the application of metabolic inhibitors, SR Ca2+ release was suppressed. Suppression of SR Ca2+ release in cardiac cells reduces CICR and therefore leads to decreased CDI of LTCCs. Consequently, a significant augmentation of ICaL was observed in the presence of thapsigargin or ryanodine (Figure 3 and Supplementary Figure S3). This is consistent with observations that the elimination of the CICR-dependent CDI using thapsigargin or ryanodine, significantly prolongs AP duration in rat ventricular myocytes [22,23]. When thapsigargin and ryanodine treated rat ventricular myocytes were exposed to FCCP, the initial increase of ICaL was completely abolished and only pronounced suppression of ICaL was observed. In addition, in the presence of thapsigargin, the effect of FCCP on the ICaL inactivation fast time constant τ1 (a parameter that is greatly affected by CDI) was eliminated. We suggest that under these conditions, CDI of ICaL is abolished and, therefore, an increase in ICaL is not observed. For the same reason, there is a lack of ICaL facilitation in thapsigargin treated rat cardiac cells where the decay characteristics of fast and slow components of ICaL were significantly augmented and subsequent metabolic inhibition resulted only in a rapid decrease of ICaL without any initial ICaL increase. The finding that CDI plays a crucial role in the initial potentiation of ICaL during metabolic inhibition was also supported by the experiments where CDI was eliminated by equimolar substitution of extracellular Ca2+ for Ba2+ (Figure 5). There are also evidences that mitochondria can control the local Ca2+ level in the micro-domain near SR ryanodine receptors and play an important role in the regulation of intracellular Ca2+ waves and arrhythmogenesis.
The double exponential fits and analysis of ISO stimulated ICaL decay traces showed that transient ICaL increase during metabolic inhibition mimics what is observed during rapid pacing induced facilitation of ICaL, which is well known to be related to CDI [4]. Increased frequency of stimulation resulted in a significant augmentation of the time constant of the fast component τ1, while τ2 was significantly diminished. Exactly the same changes in ICaL kinetics were revealed at the stimulation phase of ICaL during metabolic inhibition. These results are consistent with Tiaho et al. (1994), where they describe the decay phases of ICaL at the stimulation frequency of 1 Hz.
The increase in ICaL amplitude was registered not in all human cardiac myocytes and this may point to possible impairment in cells derived from pathological cardiac specimens. However, we were not able to find a relation between the transient increase in ICaL (or its absence) and any pathology of the human heart. Moreover, we found that even myocytes derived from the same patient showed a different response to metabolic inhibition, i.e., in some cardiomyocytes, the transient increase of ICaL was registered, while in others it was not. We suggest that the observation that transient ICaL increase is induced just in some of human atrial and ventricular myocytes while all rat ventricular myocytes exhibit an increase in ICaL during metabolic inhibition, can be attributed to the pathophysiological state of the particular cell as well as to differences between species. The pathophysiological state of the cell and thus the different response to metabolic inhibition may be related with attenuation or downregulation of β-adrenergic signaling in human heart cells [12,13]. Rat ventricular myocytes were isolated from the healthy animals, while human cardiomyocytes were obtained from patients of different ages and various cardiac pathologies (Supplementary Table S2). Disorganization and degradation of T-tubule network during pathophysiological remodeling of the heart is known to disrupt LTCC and RyR coupling [24] and to contribute to the variability of response in myocytes isolated from the patients. In addition, it was demonstrated that even in the healthy hearts, there are substantial differences between small rodents and large mammals in T-tubule organization and RyR distribution, with the T-tubule network being much denser and Ca2+ release from SR more homogeneous in rodents’ ventricular myocytes [25]. There is also evidence that mitochondria are involved in the control of the local Ca2+ level in the micro-domain near SR RyRs and that they play an important role in the regulation of intracellular Ca2+ waves and arrhythmogenesis [26]. The initial increase of ICaL shows the abnormalities of Ca2+ cycling in heart cells during ischemia (metabolic inhibition) which may lead to the arrhythmogenic processes of the heart.

4. Materials and Methods

4.1. Isolation of Cardiomyocytes

4.1.1. Human Atrial and Ventricular Myocytes

This study was carried out in accordance with the recommendations of the principles outlined in the Declaration of Helsinki, Kaunas Regional Bioethics Committee (Lithuania) with written informed consent from all subjects. All subjects gave written informed consent in accordance with the Declaration of Helsinki. The protocol was approved by the Kaunas Regional Bioethics Committee (16 November 2015 No. BE-2-40). Specimens of human heart were obtained from 16 patients undergoing heart surgery for coronary artery diseases at the Hospital of Lithuanian University of Health Sciences (Kaunas, Lithuania). Most of the patients had received a pharmacological treatment (including Ca2+-channel blockers, digitalis, β-AR antagonists, diuretics, ACE inhibitors, NO-donors and/or antiarrhythmic drugs) that was stopped 24 h before surgery. In addition, before and during surgery, all patients received sedatives, anesthesia and antibiotics. Information on patient group and specimens is provided in Supplementary Table S2. Dissociation of the cells was performed as described previously [27]. Briefly, the specimens of the atrial or ventricular tissue were washed in an oxygenated Ca2+ free Tyrode solution (in mmol/L): 136 NaCl, 5.4 KCl, 1.1 MgCl2, 10 HEPES, 20 taurine, 5 sodium pyruvate, 10 d-glucose, 0.3 NaH2PO4, pH 7.3 adjusted with NaOH at room temperature. Later, the tissue was cut into pieces of ~1 mm3 in Tyrode solution with 30 mmol/L 2,3-butanedionemonoxime added to the solution. Subsequently, a 30–40 min incubation with collagenase (type V, 200 U/mL) and protease (type XXIV, 5 U/mL) in 10 mL Ca2+ free BSA (5 mg/mL) containing Tyrode solution was performed at 37 °C. The solution was then replaced by 10 mL of fresh solution containing collagenase (400 U/mL) and digestion was repeated for 20–30 min. Every five minutes, a small sample of solution was examined under a microscope to evaluate the stage of cell dissociation.

4.1.2. Rat Ventricular Myocytes

This study was carried out in accordance with the European Community guiding principles and recommendations of the Guide for the Care and Use of Laboratory Animals of the National Institutes of Health and UK regulations on animal experimentation [28]. The protocol was approved by the State Food and Veterinary Service of the Republic of Lithuania (24 September 2015 No. G2-34). Adult rat ventricular myocytes were obtained by retrograde perfusion from hearts of male Wistar rats (160–180 g) as described previously [29]. Briefly, rats were anesthetized with intraperitoneal injection of Pentothal and hearts were excised quickly. The hearts were retrogradely perfused at 37 °C with an oxygenated Ca2+ free Ringer solution (in mmol/L): 117 NaCl, 5.8 KCl, 4.4 NaHCO3, 1.5 KH2PO4, 1.7 MgCl2, 11.7 d-glucose, 10 sodium phosphocreatine, 20 taurine, 21 HEPES, pH 7.1 adjusted with NaOH at room temperature. For heart myocyte, dissociation collagenase type A (1 mg/mL, Boehringer Mannheim, Germany) was added to the Ca2+ free Ringer solution and the heart was perfused for 1 h. The ventricles were then separated from atria, cut to small pieces and agitated gently to dissociate the single cells.

4.1.3. Electrophysiology

For electrophysiological experiments, a few drops of cells suspension were placed in a perfusion chamber mounted on an inverted microscope stage. After cells had settled to the bottom, the chamber was superfused with K+ free control external solution containing (in mmol/L): 127 NaCl; 10 HEPES; 20 CsCl; 4 NaHCO3; 0.8 NaH2PO4; 1.8 MgCl2; 1.8 CaCl2; 5 d-glucose; 5 sodium pyruvate; pH 7.4 adjusted with NaOH. Patch pipettes were made from glass capillaries (Drummond, Broomall, PA, USA) and had resistances of 0.9–1.2 MΩ when filled with control internal solution. The myocytes were dialysed with control internal solution composed of (in mmol/L): 140 CsCl, 5 EGTA, 4 MgCl2, 0.062 CaCl2, 5 creatine phosphate disodium salt, 3.1 Na2ATP, 0.42 Na2GTP and 10 HEPES; pH to 7.3 was adjusted with CsOH. The whole-cell patch–clamp technique was used to record the ICaL in human and rat cardiac myocytes as described previously [30]. Ionic currents through LTCCs were registered every 8 s. ICaL facilitation was generated after 20 s of rest applying four depolarizing pulses from −80 mV holding potential to 0 mV for 200 ms (frequency 1 Hz). Tetrodotoxin (30 μmol/L, Latoxan, Rosans, France) and a 50 ms prepulse to −50 mV before every depolarizing pulse were used to eliminate sodium currents. Inward peak currents were measured as the difference between the maximal inward current amplitude and the current at the end of the test pulse [27].
Equilibrium for steady-state frequency-dependent facilitation of ICaL is reached after four stimulations [31], therefore ICaL facilitation was assessed comparing the first ICaL trace with the fourth trace at 1 Hz. The peak of ICaL and the ICaL area, an integral of ICaL for 200 ms (pA x ms), were registered at the time of the first and fourth depolarizing pulse. The time integral of ICaL was registered in part of the experiments to elucidate the origin of ICaL increase during metabolic inhibition and to compare the initial effect of FCCP with frequency-dependent facilitation and reduced CDI.
To determine the current–voltage (I–V) relationship and inactivation of ICaL, a double pulse voltage-clamp protocol was applied every 4 s (see insert in Figure 2c). During the first pulse S1, the membrane potential was set at membrane potentials ranging from −100 to +100 mV for 200 ms. S1 pulse was followed by a 3 ms repolarization to the −80 mV holding potential and then a depolarizing pulse S2 to 0 mV was applied for 200 ms.
All experiments were performed at room temperature (18–24 °C) and the temperature did not change by more than 1°C during an experiment.

4.1.4. Chemicals and Stock Solutions

All drugs and chemicals were from Sigma-Aldrich (Schnelldorf, Germany) if not specified otherwise. All drugs tested in patch-clamp experiments were solubilized in experimental solutions just before application onto the cell studied, i.e., only fresh solutions were tested. To block oxidative phosphorylation stock solutions of carbonyl cyanide-p-trifluoromethoxyphenylhydrazone (FCCP, 100 μmol/L), 2,4-Dinitrophenol (DNP, 100 mmol/L) in ethanol, rotenone (100 mmol/L) and antimycin A (100 mmol/L) in DMSO were used. The stock solution of the SR Ca2+ ATP-ase inhibitor thapsigargin (10 mmol/L) was prepared in ethanol. A stock solution of ryanodine (10 mmol/L) for blocking of RyR channels was prepared in distilled water. An aqueous stock solution of the isoprenaline (ISO, 1 mmol/L) was freshly prepared every day prior to the experiments. When the stock solutions in DMSO or ethanol were used, the corresponding amount of solvent was also added to the external control solution.

4.1.5. Data Analysis

Inactivation of ICaL traces were best fitted by the sum of two sequential exponentials using the expression:
I(t) = ICaL,1 × exp(−t/τ1) + ICaL,2 × exp(−t/τ2),
where I is the current at time t; ICaL,1 and ICaL,2 are the amplitudes and τ1 and τ2 are the time constants of the fast and slow components of ICaL, respectively. The fitting of ICaL inactivation traces was performed using the modified protocol described by [32] in rat ventricular myocytes.
The fitting time was set from ~1 ms after the peak of inward calcium current until the end of 400 ms pulse. The steady-state current was calculated at the end of 400 ms pulse and this helped to avoid residual leak current influence to the inactivation of ICaL. The quality of the fits were evaluated by correlation coefficients (r) and in all of the experiments, the correlation coefficient was ≥0.985.
Steady-state inactivation curves (B1) and I–V traces (B2) were fitted with Boltzmann equations:
B1(V) = 1/(1 + exp((V1/2 − V)/k);
B2(V) = g(V − Vrev)/(1 + exp((V1/2 − V)/k),
where V1/2 is 0.5 of the maximal value of steady-state activation and inactivation, Vrev is the reversal potential of Ca2+, g is the conductance of LTCC and k is the steepness parameter.
Data is expressed as the means ± standard errors of the mean (SEM). The significance of differences was evaluated using one-way analysis of variance (ANOVA). The significance level was set at p < 0.05. In the text, the “basal ICaL” refers to the Ca2+ current which was not stimulated by β-adrenergic agonist.

5. Conclusions

In conclusion, our data demonstrate that metabolic inhibition in mammalian cardiomyocytes causes an initial stimulation of ICaL which is due to a reduction in SR function and an alleviation of the Ca2+-dependent inactivation of the L-type Ca2+ channels. These mechanisms may contribute to the formation of arrhythmias in the ischemic heart and may be targets for new treatment methods of heart pathologies in the future.

Supplementary Materials

Supplementary materials can be found at https://www.mdpi.com/1422-0067/20/6/1501/s1.

Author Contributions

Conceptualization, R.F. and J.J.; formal analysis, R.T., G.K. and J.J.; investigation, R.T., G.K. and J.J.; writing—original draft preparation, R.T., G.K., R.F. and J.J.; visualization, R.T. and J.J.

Funding

This research was funded by a grant (No. MIP-058/2015) from the Research Council of Lithuania.

Conflicts of Interest

The authors declare no conflict of interest. The funders had no role in the design of the study; in the collection, analyses, or interpretation of data; in the writing of the manuscript, or in the decision to publish the results.

Abbreviations

LTCCL-type Ca2+ channel
SRSarcoplasmic reticulum
CDICalcium dependent inactivation
RyRsRyanodine receptors
ISOIsoprenaline
FCCPCarbonyl cyanide-p-trifluoromethoxyphenylhydrazone

References

  1. Bers, D.M. Altered cardiac myocyte Ca regulation in heart failure. Physiology (Bethesda) 2006, 21, 380–387. [Google Scholar] [CrossRef]
  2. Sham, J.S. Ca2+ release-induced inactivation of Ca2+ current in rat ventricular myocytes: Evidence for local Ca2+ signalling. J. Physiol. 1997, 500 Pt 2, 285–295. [Google Scholar] [CrossRef]
  3. Bers, D.M. Cardiac excitation-contraction coupling. Nature 2002, 415, 198–205. [Google Scholar] [CrossRef] [PubMed]
  4. Richard, S.; Perrier, E.; Fauconnier, J.; Perrier, R.; Pereira, L.; Gomez, A.M.; Benitah, J.P. ‘Ca(2+)-induced Ca(2+) entry’ or how the L-type Ca(2+) channel remodels its own signalling pathway in cardiac cells. Prog. Biophys. Mol. Biol. 2006, 90, 118–135. [Google Scholar] [CrossRef]
  5. Verkerk, A.O.; Veldkamp, M.W.; van Ginneken, A.C.; Bouman, L.N. Biphasic response of action potential duration to metabolic inhibition in rabbit and human ventricular myocytes: Role of transient outward current and ATP-regulated potassium current. J. Mol. Cell. Cardiol. 1996, 28, 2443–2456. [Google Scholar] [CrossRef] [PubMed]
  6. Mačianskienė, R.; Martišienė, I.; Navalinskas, A.; Treinys, R.; Jurevičius, J. Mechanism of action potential prolongation during metabolic inhibition in the whole rabbit heart. Front. Physiol. 2018, 9, 1077. [Google Scholar] [CrossRef]
  7. Chantawansri, C.; Huynh, N.; Yamanaka, J.; Garfinkel, A.; Lamp, S.T.; Inoue, M.; Bridge, J.H.; Goldhaber, J.I. Effect of metabolic inhibition on couplon behavior in rabbit ventricular myocytes. Biophys. J. 2008, 94, 1656–1666. [Google Scholar] [CrossRef]
  8. Fukumoto, G.H.; Lamp, S.T.; Motter, C.; Bridge, J.H.; Garfinkel, A.; Goldhaber, J.I. Metabolic inhibition alters subcellular calcium release patterns in rat ventricular myocytes: Implications for defective excitation-contraction coupling during cardiac ischemia and failure. Circ. Res. 2005, 96, 551–557. [Google Scholar] [CrossRef] [PubMed]
  9. Louch, W.E.; Ferrier, G.R.; Howlett, S.E. Changes in excitation-contraction coupling in an isolated ventricular myocyte model of cardiac stunning. Am. J. Physiol. Heart Circ. Physiol. 2002, 283, H800–H810. [Google Scholar] [CrossRef] [PubMed]
  10. Zima, A.V.; Pabbidi, M.R.; Lipsius, S.L.; Blatter, L.A. Effects of mitochondrial uncoupling on Ca(2+) signaling during excitation-contraction coupling in atrial myocytes. Am. J. Physiol. Heart Circ. Physiol. 2013, 304, H983–H993. [Google Scholar] [CrossRef]
  11. Kanaporis, G.; Treinys, R.; Fischmeister, R.; Jurevicius, J. Metabolic inhibition reduces cardiac L-type Ca2+ channel current due to acidification caused by ATP hydrolysis. PLoS ONE 2017, 12, e0184246. [Google Scholar] [CrossRef]
  12. Lohse, M.J.; Engelhardt, S.; Eschenhagen, T. What is the role of beta-adrenergic signaling in heart failure? Circ. Res. 2003, 93, 896–906. [Google Scholar] [CrossRef] [PubMed]
  13. Marian, A.J. Beta-adrenergic receptors signaling and heart failure in mice, rabbits and humans. J. Mol. Cell. Cardiol. 2006, 41, 11–13. [Google Scholar] [CrossRef] [PubMed]
  14. Tiaho, F.; Piot, C.; Nargeot, J.; Richard, S. Regulation of the frequency-dependent facilitation of L-type Ca2+ currents in rat ventricular myocytes. J. Physiol. 1994, 477 Pt 2, 237–251. [Google Scholar] [CrossRef]
  15. Tiaho, F.; Nargeot, J.; Richard, S. Voltage-dependent regulation of L-type cardiac Ca channels by isoproterenol. Pflugers Arch. 1991, 419, 596–602. [Google Scholar] [CrossRef] [PubMed]
  16. Tijskens, P.; Meissner, G.; Franzini-Armstrong, C. Location of ryanodine and dihydropyridine receptors in frog myocardium. Biophys. J. 2003, 84, 1079–1092. [Google Scholar] [CrossRef]
  17. Janczewski, A.M.; Lakatta, E.G. Thapsigargin inhibits Ca2+ uptake, and Ca2+ depletes sarcoplasmic reticulum in intact cardiac myocytes. Am. J. Physiol. 1993, 265, H517–H522. [Google Scholar] [CrossRef]
  18. McHugh, D.; Beech, D.J. Modulation of Ca2+ channel activity by ATP metabolism and internal Mg2+ in guinea-pig basilar artery smooth muscle cells. J. Physiol. 1996, 492 Pt 2, 359–376. [Google Scholar] [CrossRef]
  19. Cens, T.; Rousset, M.; Leyris, J.P.; Fesquet, P.; Charnet, P. Voltage- and calcium-dependent inactivation in high voltage-gated Ca(2+) channels. Prog. Biophys. Mol. Biol. 2006, 90, 104–117. [Google Scholar] [CrossRef]
  20. Overend, C.L.; Eisner, D.A.; O’Neill, S.C. Altered cardiac sarcoplasmic reticulum function of intact myocytes of rat ventricle during metabolic inhibition. Circ. Res. 2001, 88, 181–187. [Google Scholar] [CrossRef]
  21. Hanninen, S.L.; Ronkainen, J.J.; Leskinen, H.; Tavi, P. Mitochondrial uncoupling downregulates calsequestrin expression and reduces SR Ca2+ stores in cardiomyocytes. Cardiovasc. Res. 2010, 88, 75–82. [Google Scholar] [CrossRef] [Green Version]
  22. Fauconnier, J.; Bedut, S.; Le Guennec, J.Y.; Babuty, D.; Richard, S. Ca2+ current-mediated regulation of action potential by pacing rate in rat ventricular myocytes. Cardiovasc. Res. 2003, 57, 670–680. [Google Scholar] [CrossRef]
  23. Takamatsu, H.; Nagao, T.; Ichijo, H.; Adachi-Akahane, S. L-type Ca2+ channels serve as a sensor of the SR Ca2+ for tuning the efficacy of Ca2+-induced Ca2+ release in rat ventricular myocytes. J. Physiol. 2003, 552 Pt 2, 415–424. [Google Scholar] [CrossRef]
  24. Zhang, H.B.; Li, R.C.; Xu, M.; Xu, S.M.; Lai, Y.S.; Wu, H.D.; Xie, X.J.; Gao, W.; Ye, H.; Zhang, Y.Y.; et al. Ultrastructural uncoupling between T-tubules and sarcoplasmic reticulum in human heart failure. Cardiovasc. Res. 2013, 98, 269–276. [Google Scholar] [CrossRef] [Green Version]
  25. Heinzel, F.R.; Bito, V.; Volders, P.G.; Antoons, G.; Mubagwa, K.; Sipido, K.R. Spatial and temporal inhomogeneities during Ca2+ release from the sarcoplasmic reticulum in pig ventricular myocytes. Circ. Res. 2002, 91, 1023–1030. [Google Scholar] [CrossRef]
  26. Zhao, Z.; Gordan, R.; Wen, H.; Fefelova, N.; Zang, W.J.; Xie, L.H. Modulation of intracellular calcium waves and triggered activities by mitochondrial ca flux in mouse cardiomyocytes. PLoS ONE 2013, 8, e80574. [Google Scholar] [CrossRef]
  27. Kirstein, M.; Rivet-Bastide, M.; Hatem, S.; Benardeau, A.; Mercadier, J.J.; Fischmeister, R. Nitric oxide regulates the calcium current in isolated human atrial myocytes. J. Clin. Investig. 1995, 95, 794–802. [Google Scholar] [CrossRef]
  28. Grundy, D. Principles and standards for reporting animal experiments in The Journal of Physiology and Experimental Physiology. J. Physiol. 2015, 593, 2547–2549. [Google Scholar] [CrossRef] [Green Version]
  29. Verde, I.; Vandecasteele, G.; Lezoualc’h, F.; Fischmeister, R. Characterization of the cyclic nucleotide phosphodiesterase subtypes involved in the regulation of the L-type Ca2+ current in rat ventricular myocytes. Br. J. Pharmacol. 1999, 127, 65–74. [Google Scholar] [CrossRef]
  30. Treinys, R.; Bogdelis, A.; Rimkute, L.; Jurevicius, J.; Skeberdis, V.A. Differences in the control of basal L-type Ca(2+) current by the cyclic AMP signaling cascade in frog, rat, and human cardiac myocytes. J. Physiol. Sci. 2016, 66, 327–336. [Google Scholar] [CrossRef]
  31. Mangoni, M.E.; Fontanaud, P.; Noble, P.J.; Noble, D.; Benkemoun, H.; Nargeot, J.; Richard, S. Facilitation of the L-type calcium current in rabbit sino-atrial cells: Effect on cardiac automaticity. Cardiovasc. Res. 2000, 48, 375–392. [Google Scholar] [CrossRef]
  32. Richard, S.; Charnet, P.; Nerbonne, J.M. Interconversion between distinct gating pathways of the high threshold calcium channel in rat ventricular myocytes. J. Physiol. 1993, 462, 197–228. [Google Scholar] [CrossRef]
Figure 1. Effect of metabolic inhibition on isoprenaline stimulated ICaL in human and rat cardiomyocytes. (a) Effect of FCCP on isoprenaline (ISO)-stimulated ICaL in human atrial cell. Traces of ICaL shown in the panel were recorded at the times indicated by the corresponding letters on the main graph. (b) Peak amplitude of ICaL during exposure of ISO-stimulated human atrial cells to FCCP. (c) Effect of 2,4-Dinitrophenol (DNP) on ISO-stimulated ICaL in human ventricular cell. Traces of ICaL shown in the panel were recorded at the times indicated by the corresponding letters on the main graph. (d) Peak amplitude of ICaL during exposure of ISO-stimulated human ventricular cells to DNP and FCCP. (e) Effect of FCCP on ISO-stimulated ICaL in rat ventricular cells. Traces of ICaL shown in the panel were recorded at the times indicated by the corresponding letters on the main graph. (f) Peak amplitude of ISO-stimulated ICaL during exposure of rat ventricular cells to various inhibitors of oxidative phosphorylation. White bars in panels (b), (d) and (f) represent 100% of ISO stimulation, grey bars represent transient stimulation of ICaL and black bars represent suppression of ICaL during metabolic inhibition. Values are presented as means ± SEM for the number of cells indicated in parentheses. * p < 0.05 versus ISO alone. DNP—2,4-Dinitrophenol, Rot—rotenone, Ant A—antimycin A.
Ijms 20 01501 g001aIjms 20 01501 g001b
Figure 2. Current–voltage relationship and inactivation of ICaL in rat ventricular cells. (a) Current–voltage (I–V) relationship, (b) normalized I–V relationship. Insets on the right: I–V measurements (representative of traces of ICaL registered during S1 in control, in ISO stimulated cell and in the presence of FCCP). (c) Inactivation curves of ICaL under basal conditions, during ISO (1 μmol/L) stimulation and during exposure to FCCP (100 nmol/L) in the presence of ISO in rat ventricular cells. Inset: Double-pulse protocol used for the inactivation curves (see Methods for details). ICaL peak amplitude during S2 pulse is expressed as a percentage of ICaL measured at 0 mV without conditioning pulse S1 and plotted as a function of S1 pulse potential. Points represent experimentally measured values; lines represent values calculated with Boltzmann equation. Insets below: Inactivation of ICaL (representative traces of ICaL registered during S2 in control, in ISO stimulated cell and in the presence of FCCP).
Ijms 20 01501 g002
Figure 3. Effect of FCCP on isoprenaline stimulated ICaL in rat cardiomyocytes after the suppression of cytosolic Ca2+ release. (a) A typical experiment representing the effect of FCCP on ICaL in ISO-stimulated cells during exposure to thapsigargin. Traces of ICaL shown in the panel were recorded at the times indicated by the corresponding letters on the main graph. (b) Peak amplitude of ICaL during exposure of ISO-stimulated rat ventricular cells to FCCP in the presence of thapsigargin. Values are presented as means ± SEM for the number of cells indicated in parentheses. * p < 0.05 versus ISO alone. (c) The time dependent inactivation of LTCCs currents. Traces of ICaL in isoprenaline (ISO, 1 µmol/L) stimulated (black line) rat cell during application of thapsigargin (Thapsig, 2 µmol/L) (red line) and metabolic inhibition by FCCP (0.1 µmol/L) (blue line). Dashed lines represent double exponential fits of ICaLs decay.
Ijms 20 01501 g003
Figure 4. Fast facilitation of ICaL in rat ventricular cells is abolished by metabolic inhibition and by the suppression of cytosolic Ca2+ release. (a) Depolarization protocol for the induction of fast facilitation of ICaL shown on top. In ISO-stimulated rat ventricular cells and in control conditions, increased frequency (to 1 Hz) depolarization induced an increase of ICaL amplitude and delayed the inactivation; FCCP abolished this effect in ISO-stimulated cells. (b) Peak amplitude and area (time integral) of ICaL during the fourth depolarizing pulse in control conditions, in ISO stimulated cells and during exposure of 0.1 μmol/L of FCCP. Values are presented as means ± SEM for the number of cells indicated in parentheses. * p < 0.05 versus ICaL of the first pulse. (c) Suppression of cytosolic Ca2+ release by thapsigargin abolished the increase of ICaL amplitude itself during increased frequency depolarization and FCCP additionally reduced ICaL amplitude.
Ijms 20 01501 g004
Figure 5. Effect of FCCP on isoprenaline stimulated Ba2+ current through L-type calcium channels in human atrial myocytes. Only suppression of Ca2+ channel current was registered during metabolic inhibition after equimolar substitution of extracellular Ca2+ for Ba2+. (a) A typical experiment representing the effect of FCCP on IBa in ISO-stimulated cells. (b) Peak amplitude of IBa during exposure of ISO-stimulated human atrial cells to FCCP. Values are presented as means ± SEM for the number of cells indicated in parentheses. * p < 0.05 versus ISO alone.
Ijms 20 01501 g005

