Article

Control of Silver Coating on Raman Label Incorporated Gold Nanoparticles Assembled Silica Nanoparticles

1
Department of Bioscience and Biotechnology, Konkuk University, Seoul 143-701, Korea
2
Department of Chemistry Education and Center for Educational Research, Seoul National University, Seoul 151-742, Korea
*
Author to whom correspondence should be addressed.
Int. J. Mol. Sci. 2019, 20(6), 1258; https://doi.org/10.3390/ijms20061258
Submission received: 28 January 2019 / Revised: 6 March 2019 / Accepted: 9 March 2019 / Published: 13 March 2019
(This article belongs to the Special Issue Silver Nano/microparticles: Modification and Applications)

Abstract

:
Signal reproducibility in surface-enhanced Raman scattering (SERS) remains a challenge, limiting the scope of the quantitative applications of SERS. This drawback in quantitative SERS sensing can be overcome by incorporating internal standard chemicals between the core and shell structures of metal nanoparticles (NPs). Herein, we prepared a SERS-active core Raman labeling compound (RLC) shell material, based on Au–Ag NPs and assembled silica NPs (SiO2@Au@RLC@Ag NPs). Three types of RLCs were used as candidates for internal standards, including 4-mercaptobenzoic acid (4-MBA), 4-aminothiophenol (4-ATP) and 4-methylbenzenethiol (4-MBT), and their effects on the deposition of a silver shell were investigated. The formation of the Ag shell was strongly dependent on the concentration of the silver ion. The negative charge of SiO2@Au@RLCs facilitated the formation of an Ag shell. In various pH solutions, the size of the Ag NPs was larger at a low pH and smaller at a higher pH, due to a decrease in the reduction rate. The results provide a deeper understanding of features in silver deposition, to guide further research and development of a strong and reliable SERS probe based on SiO2@Au@RLC@Ag NPs.

Graphical Abstract

1. Introduction

Surface-enhanced Raman scattering (SERS) has been widely used for various applications due to its excellent ultrasensitive molecular fingerprinting, and its non-destructive and photostable properties [1,2,3,4,5]. Much effort has been focused on the use of different nanoparticles (NPs) as a substrate for SERS detection, such as silver NPs [6,7], gold NPs [8,9,10,11], and metal-embedded graphene oxide [12,13]. Although these nanostructures can enhance the SERS signal, difficulty in controlling the density of hot spots on the surface of a SERS substrate makes them unsuitable for accurate quantitative SERS assays [14].
Internal standards have been used to correct variations in SERS intensity in quantitative SERS assays [14,15,16,17]. Internal standard-based quantitative SERS methods can be classified into three categories [14]: (i) internal standard addition detection mode [18,19]; (ii) internal standard tagging detection mode [20,21,22]; (iii) and ratiometric SERS indicator-based detection mode [14,23]. However, the concurrent presence of target molecules and internal standard compounds on the surface of a SERS-enhancing substrate can lead to the issue of competitive adsorption between the internal standard and the target analytes in both the addition and tagging detection modes. On the other hand, the ratiometric SERS indicator-based detection mode may avoid competition between the internal standard and target molecules, as the target molecules cannot adsorb onto the surface of the SERS substrate. However, difficulties in finding or synthesizing an appropriate SERS probe for a specified target have been a limiting factor in the general application of the ratiometric SERS indicator-based detection mode [14].
Core-shell nanomaterials have attracted attention and have been employed for various applications, such as solar cells [24,25,26], photocatalysis [27,28,29,30], sensors [31,32], biomedical diagnosis [33,34,35], and imaging [36,37]. This is due to their outstanding features [38], including versatility [39], economy [40], tunability [41,42], stability, dispersibility [43], biocompatibility [44], and controllability [45]. Since their localized surface plasmon resonance (LSPR) can become tunable by controlling the bimetallic component or structure, core-shell nanomaterials have been extensively used as a substrate to enhance Raman signals of probe molecules with exquisite sensitivity. The dynamic exchange between the target molecules and internal standard is bypassed, as the internal standard is embedded between the core and shell layers. However, the unstable sol form of “core-shell” substrates can cause faster agglomeration than solid substrates [46,47]. To overcome this problem, SERS-active core-Raman labeling chemical (RLC)-shell NPs (CRLCS NPs) have been used in SERS application, especially to avoid the competitive adsorption between the internal standard and target molecules, by embedding the internal standard in core-shell NPs as enhancing substrates [15,17,48,49]. Although the presence of RLC between the Au core and the Ag shell enables a strong and reliable SERS probe, to our knowledge the effect of RLC property on the growth of an Ag shell—which can be a critical factor in fabricating the homogeneous structure of core-shell materials—has not been investigated.
Recently, our group reported Au–Raman Labeling Chemical–Ag NP assembled silica NPs (SiO2@Au@RLC@Ag NPs) as strong and reliable SERS probes with an internal standard. SiO2@Au@RLC@Ag NPs were synthesized using an Au seed-mediated Ag growth method on the surface of a silica template, followed by incorporating RLC on their surfaces [50,51,52]. Herein, we investigated the effect of experimental conditions and RLC properties on the growth of an Ag shell on the surface of SiO2@Au. Three kinds of RLCs with a positive charge (4-aminothiphenol: 4-ATP), a negative charge (4-mercaptobenzoic acid: 4-MBA), and a neutral charge (4-methylbenzenthiol: 4-MBT) were used to investigate the effect of the charge properties of RLC on the growth of the Au shell. In addition, the influence of pH on the formation of the Ag shell was investigated.

2. Results and Discussion

To prepare SiO2@Au@RLC@Ag NPs, silica NPs (ca. 150 nm in diameter) were synthesized using the Stöber method [53] and used as a template for embedding the Au NPs. The surface of silica NPs was first functionalized with amine groups by (3-Aminopropyl) triethoxysilane (APTS) to prepare the aminated silica NPs, as shown in Figure 1. Simultaneously, colloidal Au NPs (7 nm) were prepared by NaBH4, according to the method reported by Martin et al., although with slight modifications [54,55]. Then, the Au NPs were incubated with the aminated silica NPs by gentle shaking to prepare an Au NPs embedded SiO2 (SiO2@Au NPs), since an amine functional group plays a crucial role in attaching the Au NPs through strong electrostatic attraction. Subsequently, three types of RLC with a positive charge (4-aminothiphenol: 4-ATP), a negative charge (4-mercaptobenzoic acid: 4-MBA) and a neutral charge (4-methylbenzenthiol: 4-MBT) were introduced on the surface of SiO2@Au NPs through the strong affinity between thiol groups and Au, to investigate the effect of charge properties of RLCs on the growth of the Au shell. Finally, the Ag shell was deposited on the SiO2@Au@RLC, to enhance the Raman signal of RLCs by reducing a silver precursor (AgNO3) in the presence of ascorbic acid and polyvinyl pyrrolidine (PVP) as a stabilizer and structure-directing agent under mild reducing conditions [51]. In addition, the presence of the Ag shell can prevent the leakage of RLC from the Au surface, and also provide a better chance of generating numerous hot spots on the silica surface to detect target molecules.
As expected, the Au NPs exhibited a typical UV peak at ~520 nm, as shown in Figure S1a. After the Au NPs were coated on the surface of SiO2, the maximum peak of SiO2@Au was red-shifted to 530 nm. The zeta potential was used to confirm the result, and the SiO2 NPs had a zeta potential value of −44.6 ± 0.1 mV. When the surface of the SiO2 NP was incubated with APTS, the zeta potential value of SiO2@NH2 was increased to −27.7 ± 0.6 mV, due to the positive property of NH2 groups. Throughout the entire NH2 groups, the Au NPs were immobilized on the surface of SiO2@NH2 due to electrostatic attraction. Since the surface of the Au NPs was stabilized by BH4-, the zeta potential of SiO2@Au was decreased to −55.4 ± 6.1 mV (Figure S1b).

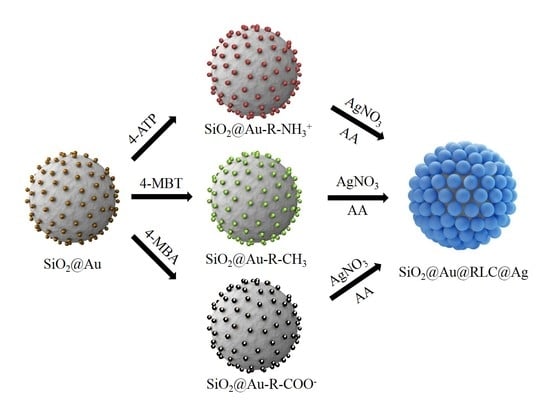
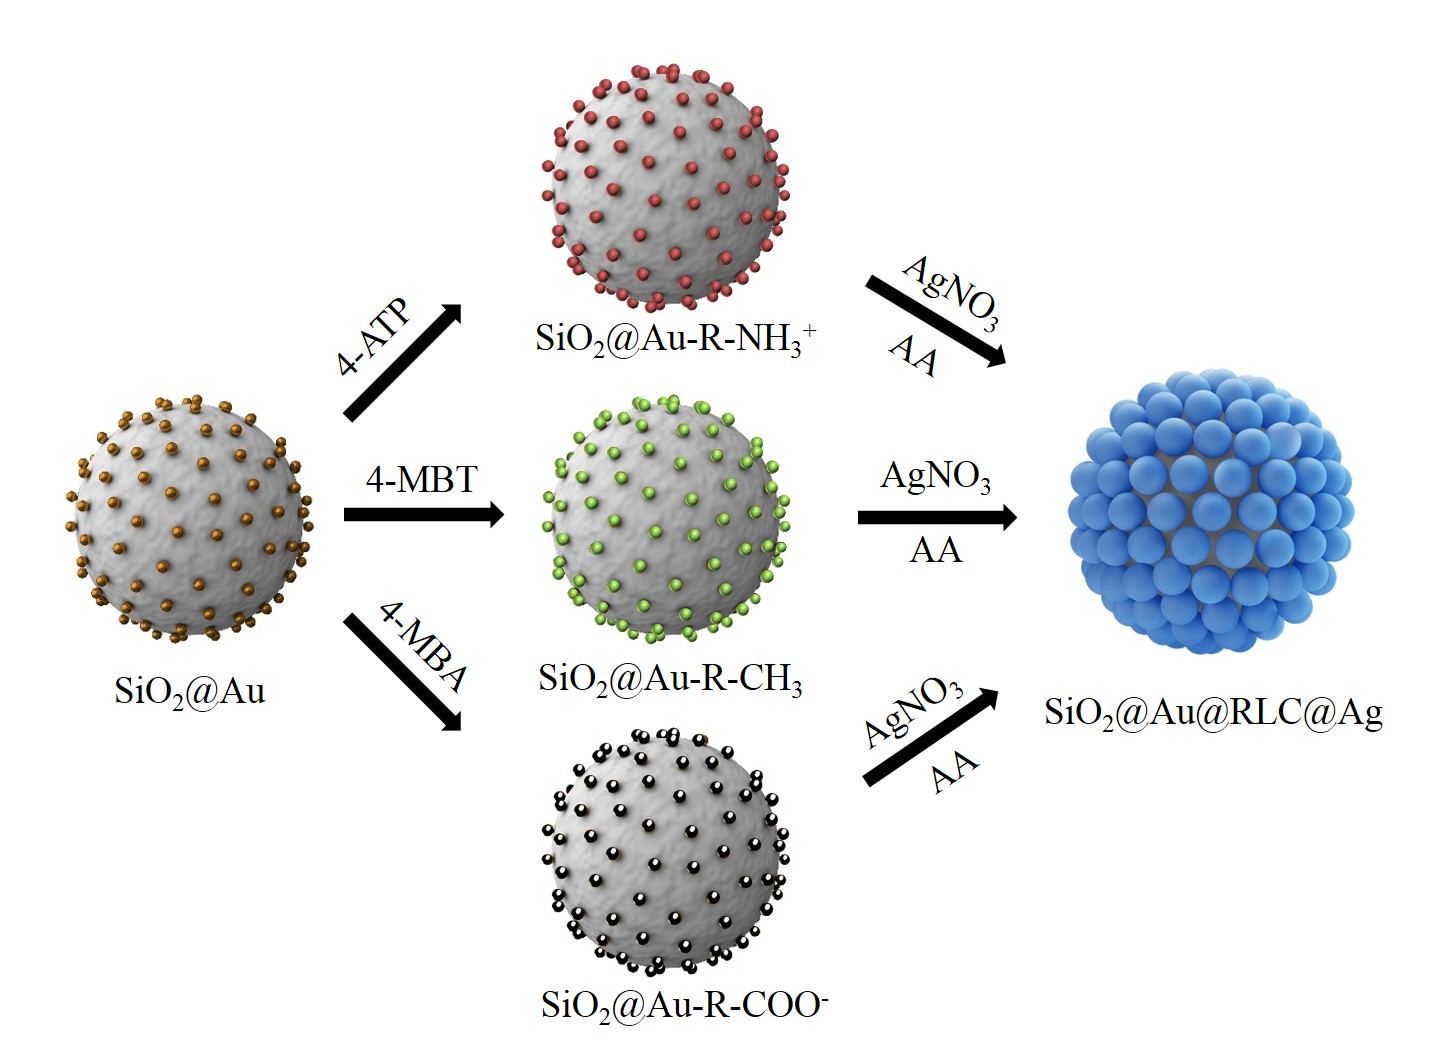
2.1. Preparation of SiO2@Au@RLC@Ag

Three types of SiO2@Au@RLC@Ag nanomaterials with three different RLCs were successfully prepared in our study. The RLCs included 4-aminothiophenol (4-ATP) with a positive -NH3+ group; 4-MBA with a negative -COO group; and 4-methylbenzenethiol (4-MBT) with a neutral -CH3 group. The presence of -SH groups on their structures ensured that the RLCs bound to the surface of SiO2@Au, and exhibited their functional groups of -NH3+, -COO, or -CH3 in the solution. As can be seen in Figure 2a, the structure of SiO2@Au@RLC@Ag was confirmed by the TEM analysis to show that the Ag shell was well coated on the surface of all RLCs-modified SiO2@Au.
The UV-Vis spectra of SiO2@Au@RLC@Ag were consistent with the TEM images (Figure 2b). In general, all solutions of SiO2@Au@RLC@Ag NPs showed a broad band from 320 to 800 nm, indicating the generation of bumpy structures on the Ag shell and the creation of hot-spot structures on the surface of SiO2@Au@RLC@Ag NPs [56]. At 300 µm AgNO3, a typical peak of SiO2@Au@RLCs was around 450 nm, due to the increase in the particle size of Au@RLC@Ag. However, the differences in the size of Au@Ag alloys and the distance of the nanogap between these alloys greatly affected their plasmon properties in the range of 700–800 nm, producing a continuous spectrum of resonant multimode [50,52,56,57,58,59]. The zeta potential of SiO2@Au@RLCs was measured (Figure S2) to explain the formation of the Ag shell on the surface of SiO2@Au@RLCs. As mentioned previously, the zeta potential of SiO2@Au was −55.4 ± 6.1 mV. When RLCs were modified on the surface of SiO2@Au, the zeta potential of all structures increased significantly. RLCs possess the -SH groups, which have a stronger affinity to Au NPs than NH2 groups on the surface of SiO2. Thus, RLCs may absorb on the surface of Au NPs, and some of the Au-RLC complex can migrate from the surface of SiO2@Au NPs, leading the zeta potential of RLCs-modified SiO2@Au NPs to be less negative. Yet, since the difference exists in functional groups of RLCs, SiO2@Au@RLC still possess a difference in surface charge of −35.2 ± 0.5 mV (4-ATP), −33.4 ± 1.3 mV (4-MBT) and −44.4 ± 6.9 mV (4-MBA), respectively. Nevertheless, the presence of negative charges on the surface of SiO2@Au@RLC facilitated the attraction of Ag+ ions to their surface and reduced them to Ag NPs.
Raman signals of three SiO2@Au@RLC@Ag nanomaterials were also measured (Figure 2c). The Raman intensity of SiO2@Au@4-MBA@Ag at 1075 cm−1 was the strongest compared to that of SiO2@Au@4-ATP@Ag and SiO2@Au@4-MBT@Ag. Raman signals of SiO2@Au@4-ATP@Ag and SiO2@Au@4-MBT@Ag were equal to those of the 68.3% and 7.9% of SiO2@Au@4-ATP@Ag, respectively.

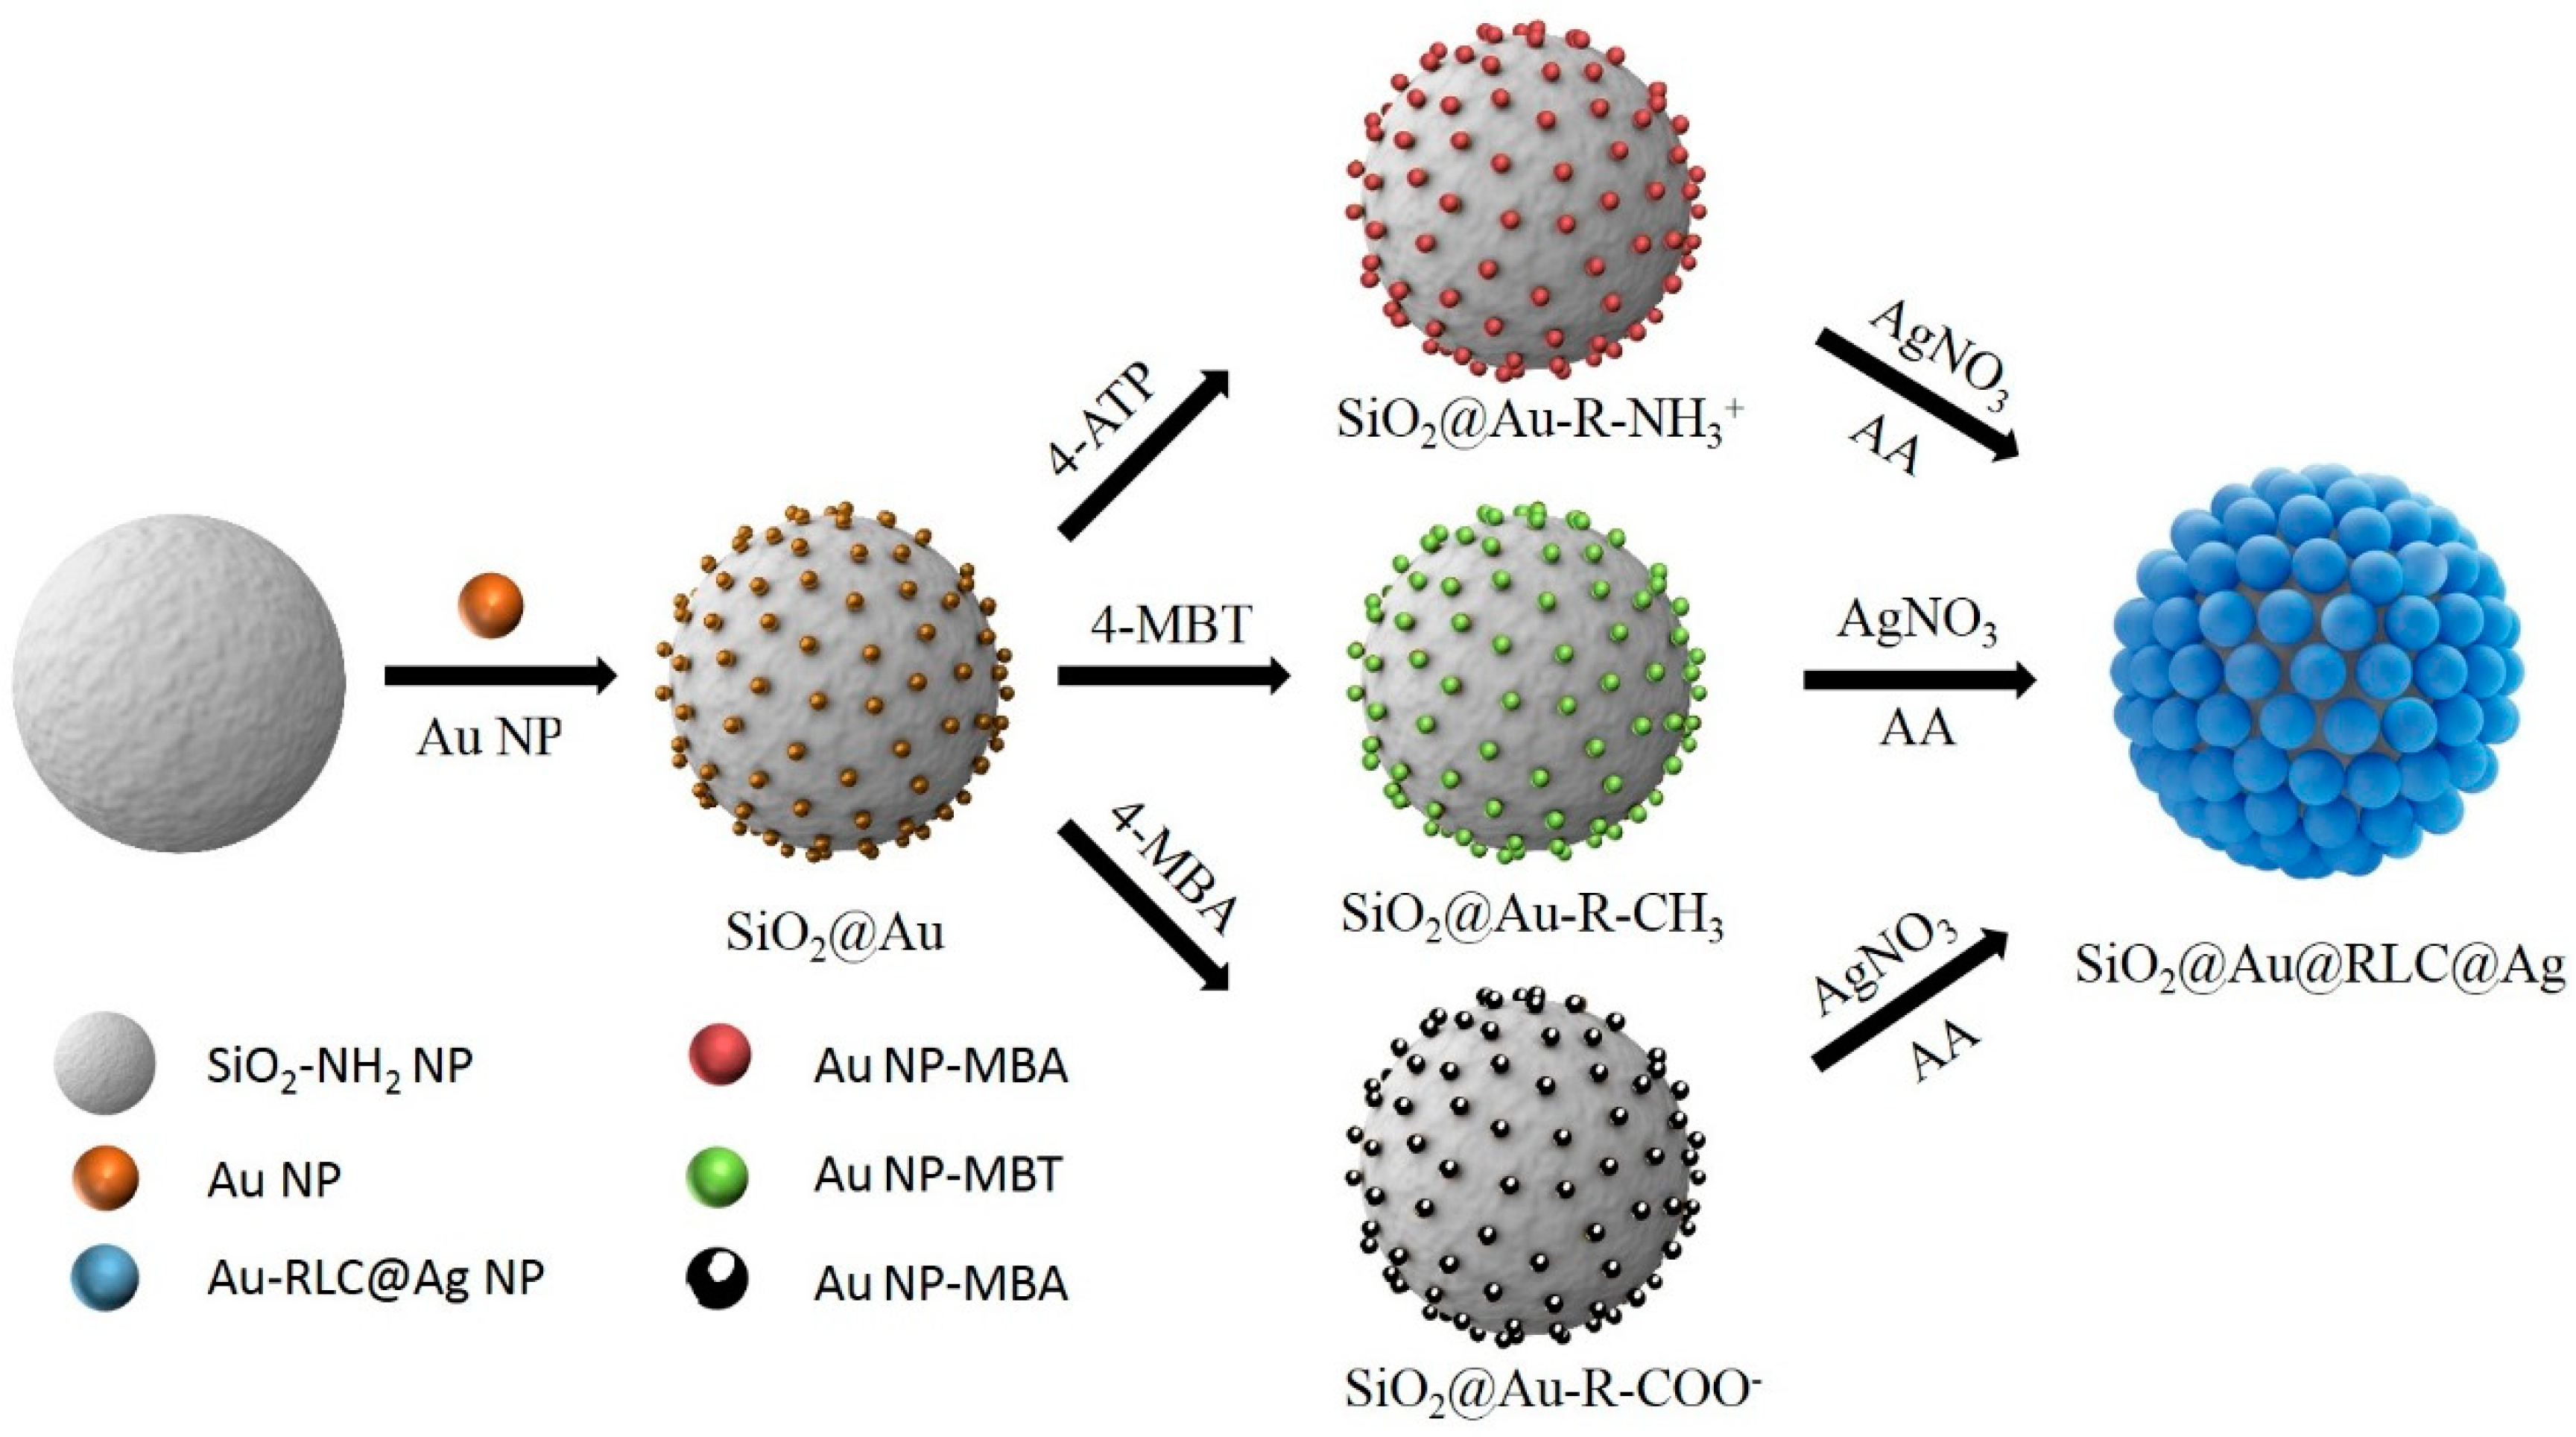
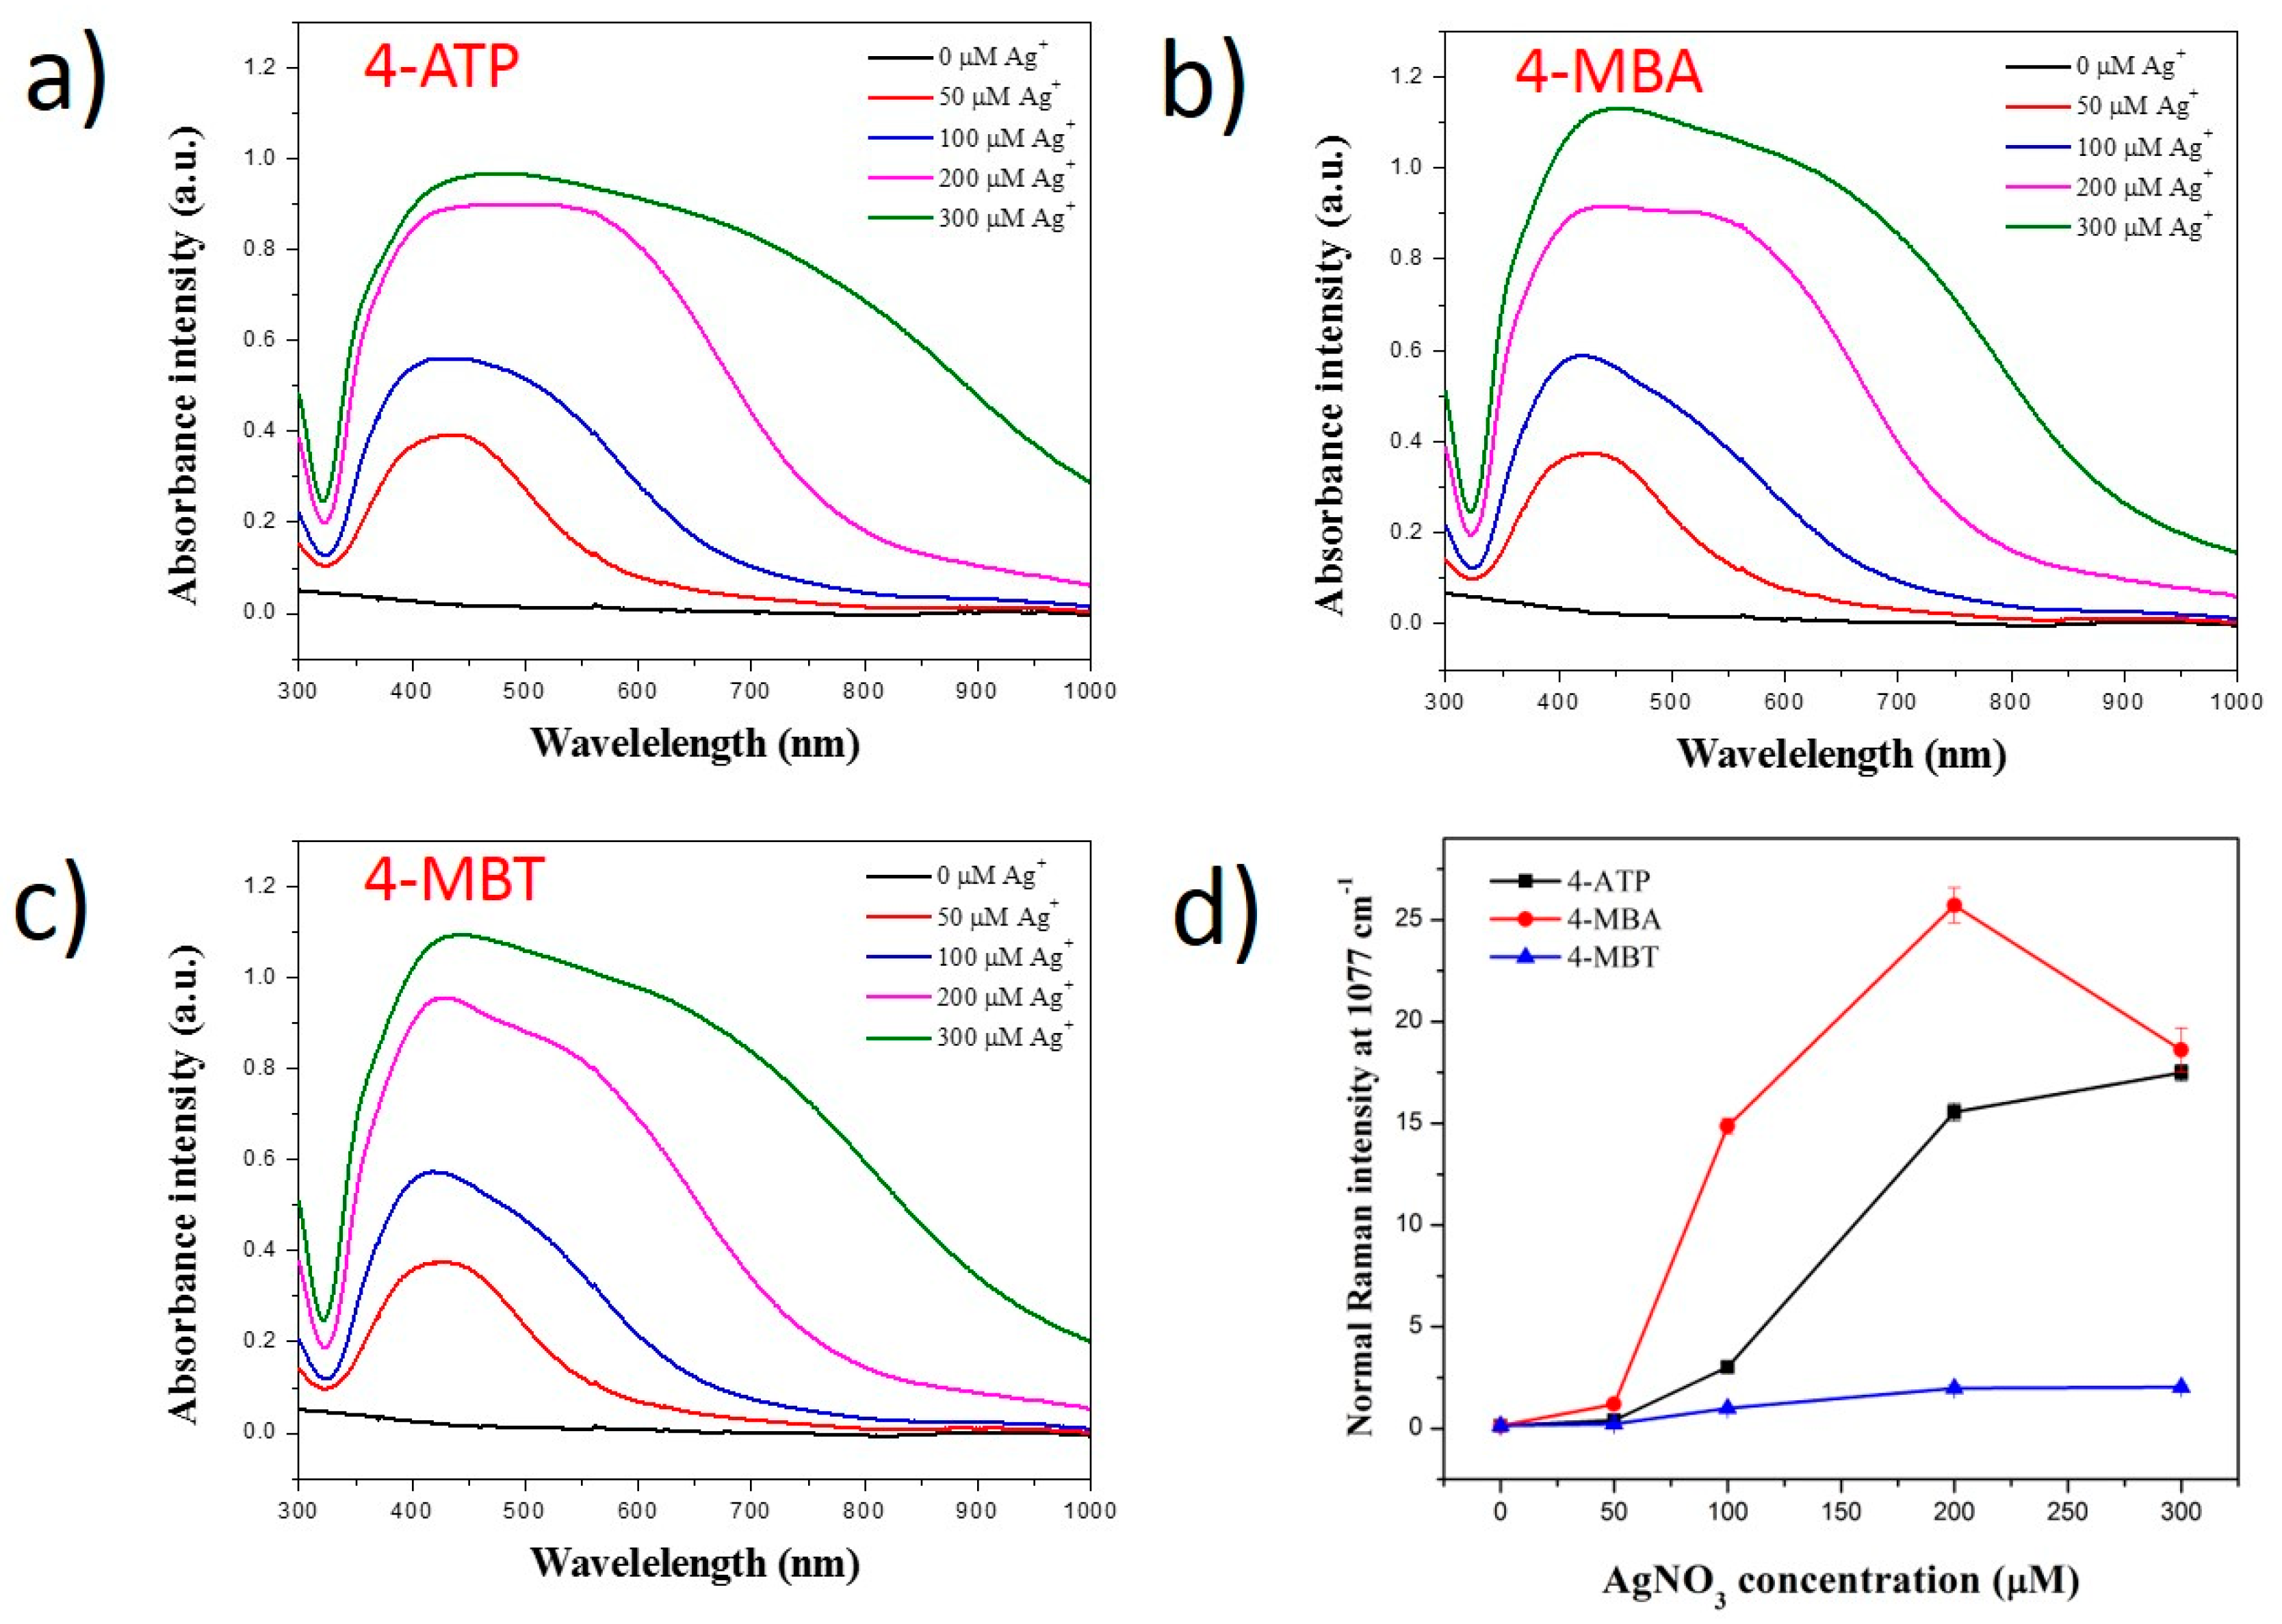
2.2. Effect of Silver Ion Concentration on Ag Shell Coating on SiO2@Au@RLCs

To examine the effect of silver ion concentration on a silver shell coating of SiO2@Au@RLC, 4-MBA, 4-ATP, and 4-MBT were first introduced on the surface SiO2@Au NPs. The Ag shell was then deposited onto SiO2@Au@RLCs by the reduction of AgNO3, using ascorbic acid. The TEM analysis was performed to confirm the structure of SiO2@Au@RLC@Ag, as shown in Figures S3–S5. When the AgNO3 concentration was increased from 50 to 300 µM, the size of Au@RLC@Ag alloy NPs became greater. However, Ag NPs (ca. 50–100 nm) appeared separately at higher concentrations of AgNO3 (>300 µM). This is possibly due to the formation of extra Ag NPs, made by nucleation in the solution during the reduction of high the AgNO3 concentration.
UV-Vis spectroscopies of the solution of SiO2@Au@RLC@Ag nanomaterials were recorded (Figure 3). The absorbance band of the SiO2@Au@RLC@Ag prepared with 4-ATP, 4-MBA, and 4-MBT appeared at 430–450 nm at low concentrations of AgNO3 (50 µM). The bands extended from 430 nm to 1000 nm when the AgNO3 concentration was increased to 700 µM. At the same time, their absorbance intensities were increased with a higher AgNO3 concentration. The results indicated that the silver shell was well coated on the surface of SiO2@Au@RLC in deionized water. Indeed, the Raman intensities of the SiO2@Au@RLC@Ag prepared with 4-ATP, 4-MBA, and 4-MBT became greater with an increase in the thickness of the Ag shell when AgNO3 increased from 50 µM to 200 µM. The Raman intensity plateaued when AgNO3 increased up to 300 µM. To compare the exact effects of Ag coating on the Raman signal of SiO2@Au@RLC@Ag without considering the differences in the intrinsic Raman properties of RLCs, we calculated the slopes of SiO2@Au@RLC@Ag in the range of 50 to 200 µM. The slopes of the normalized Raman signal were 0.105, 0.156, and 0.012 unit/µM, which correspond to 4-ATP, 4-MBA, and 4-MBT, respectively. The results indicate that the Ag shell coating significantly affected the Raman signals of these three SiO2@Au@RLC@Ag.

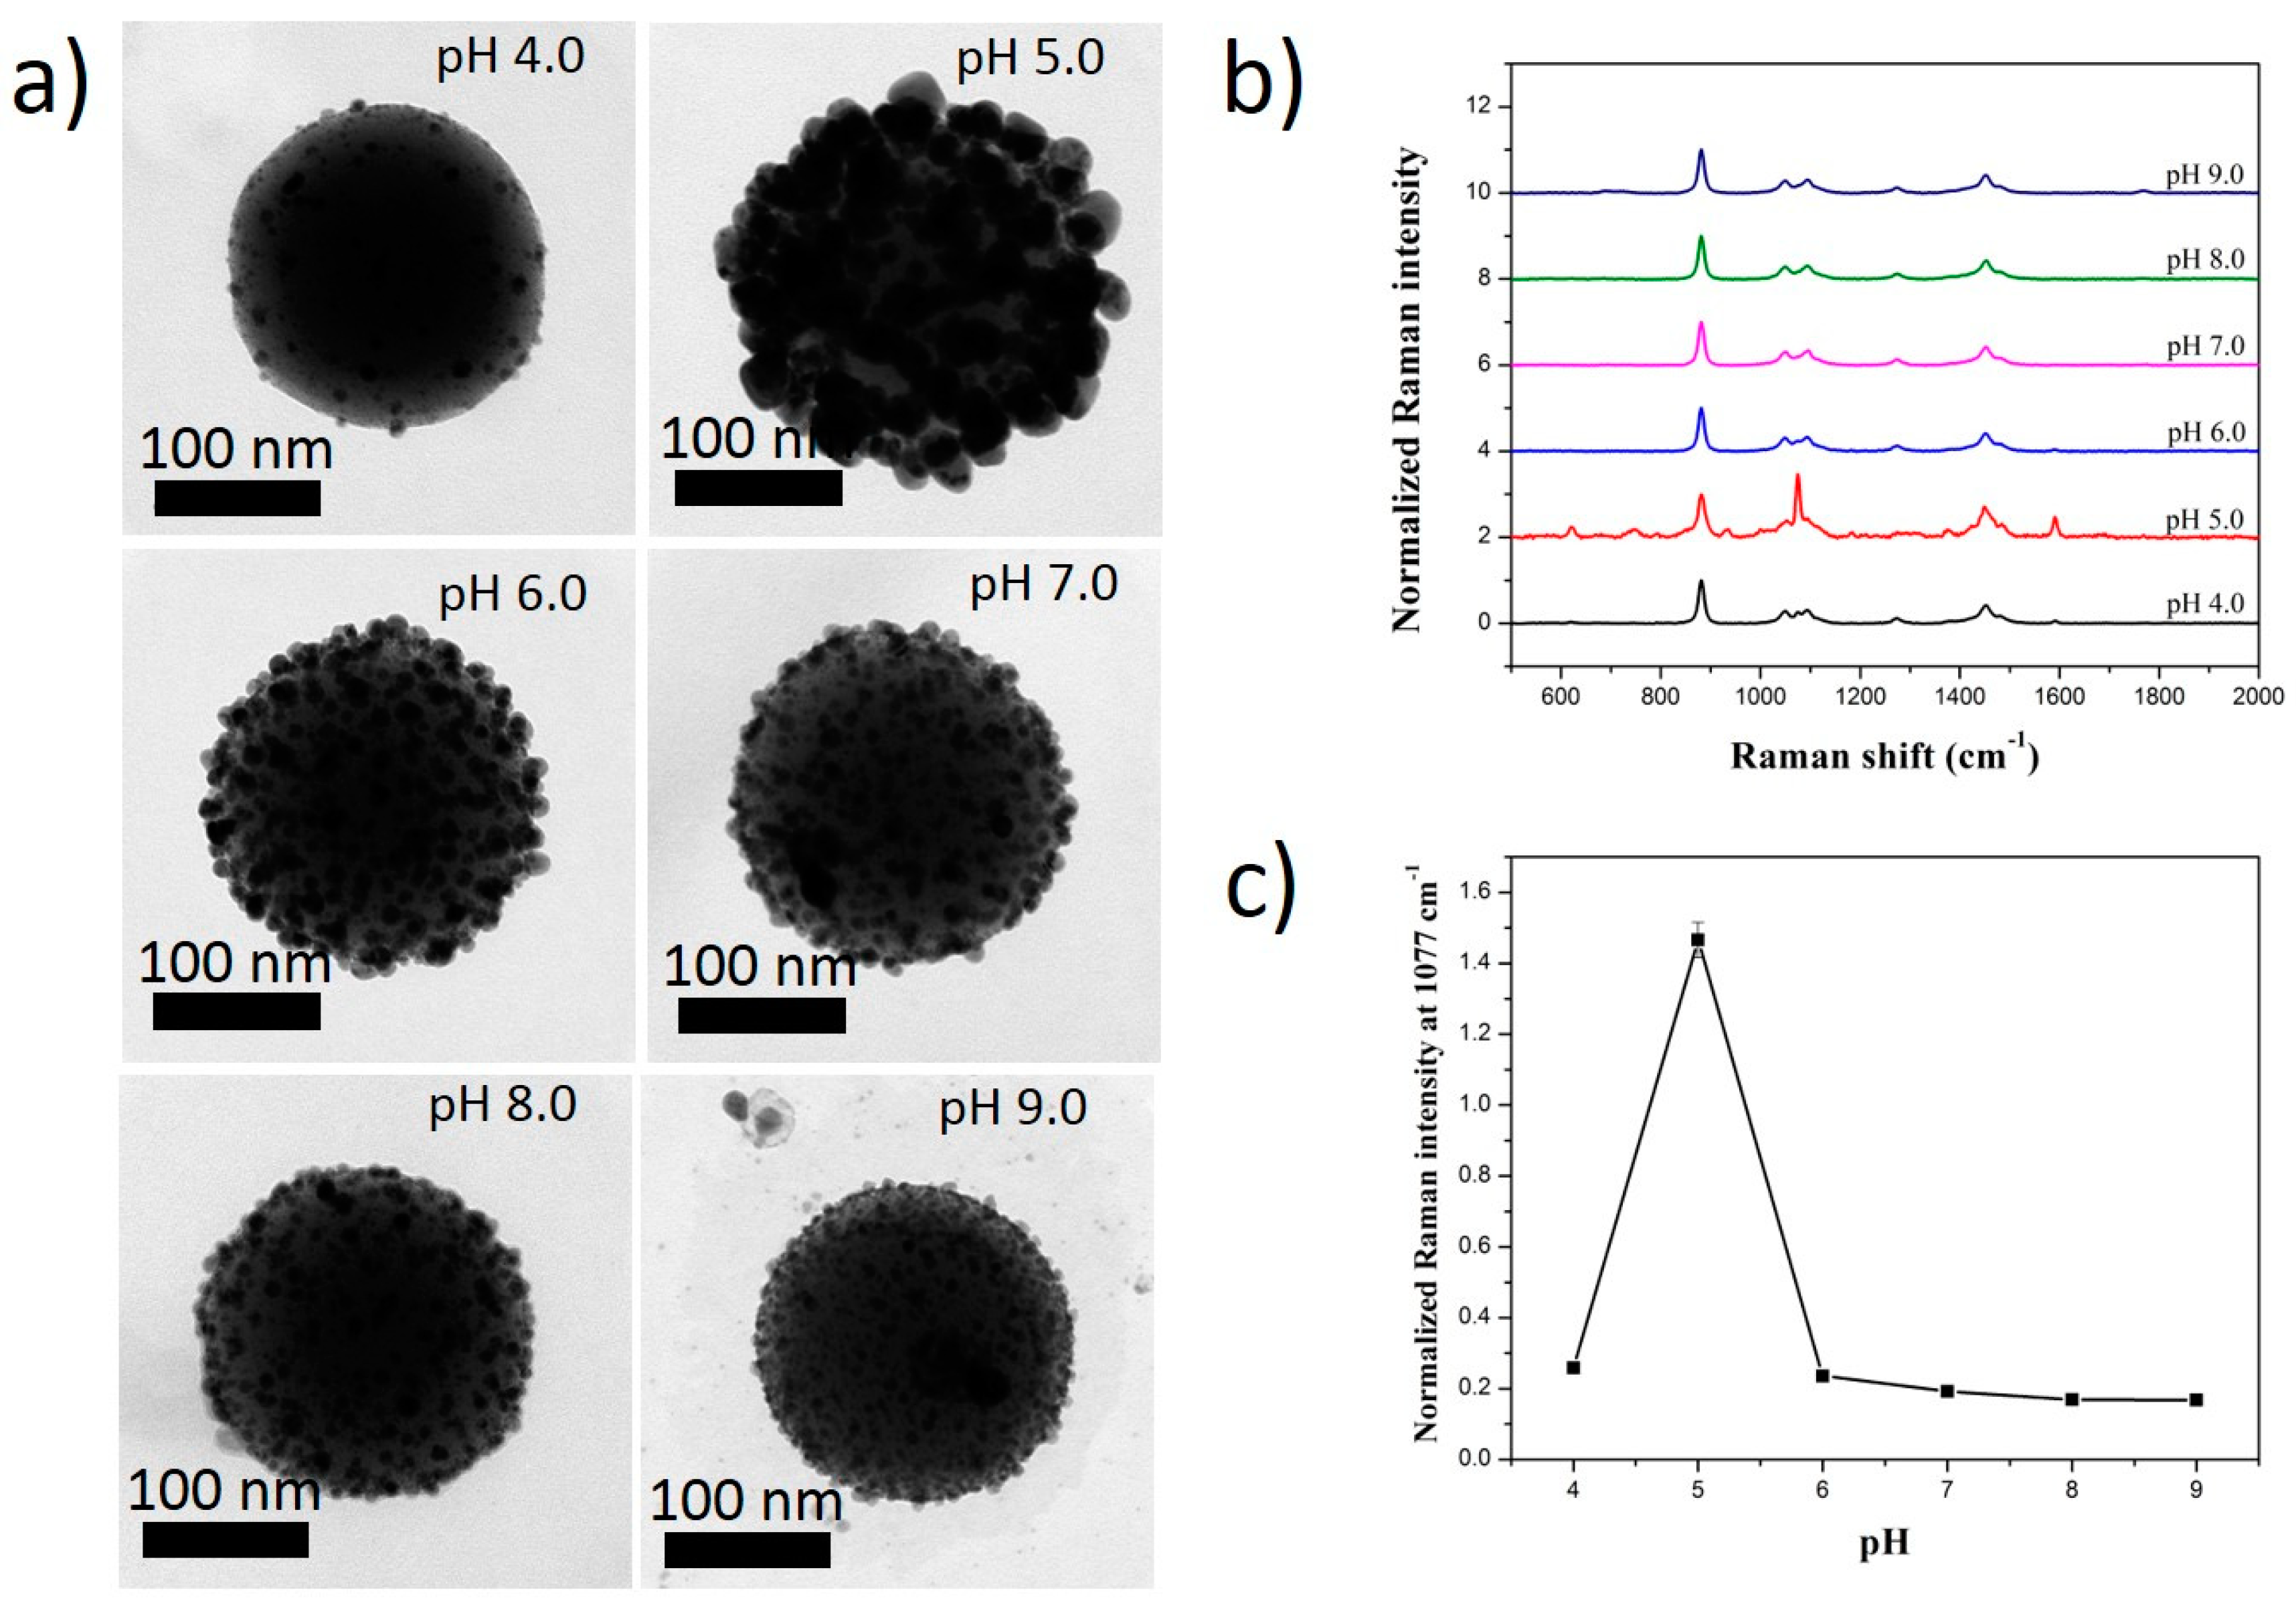
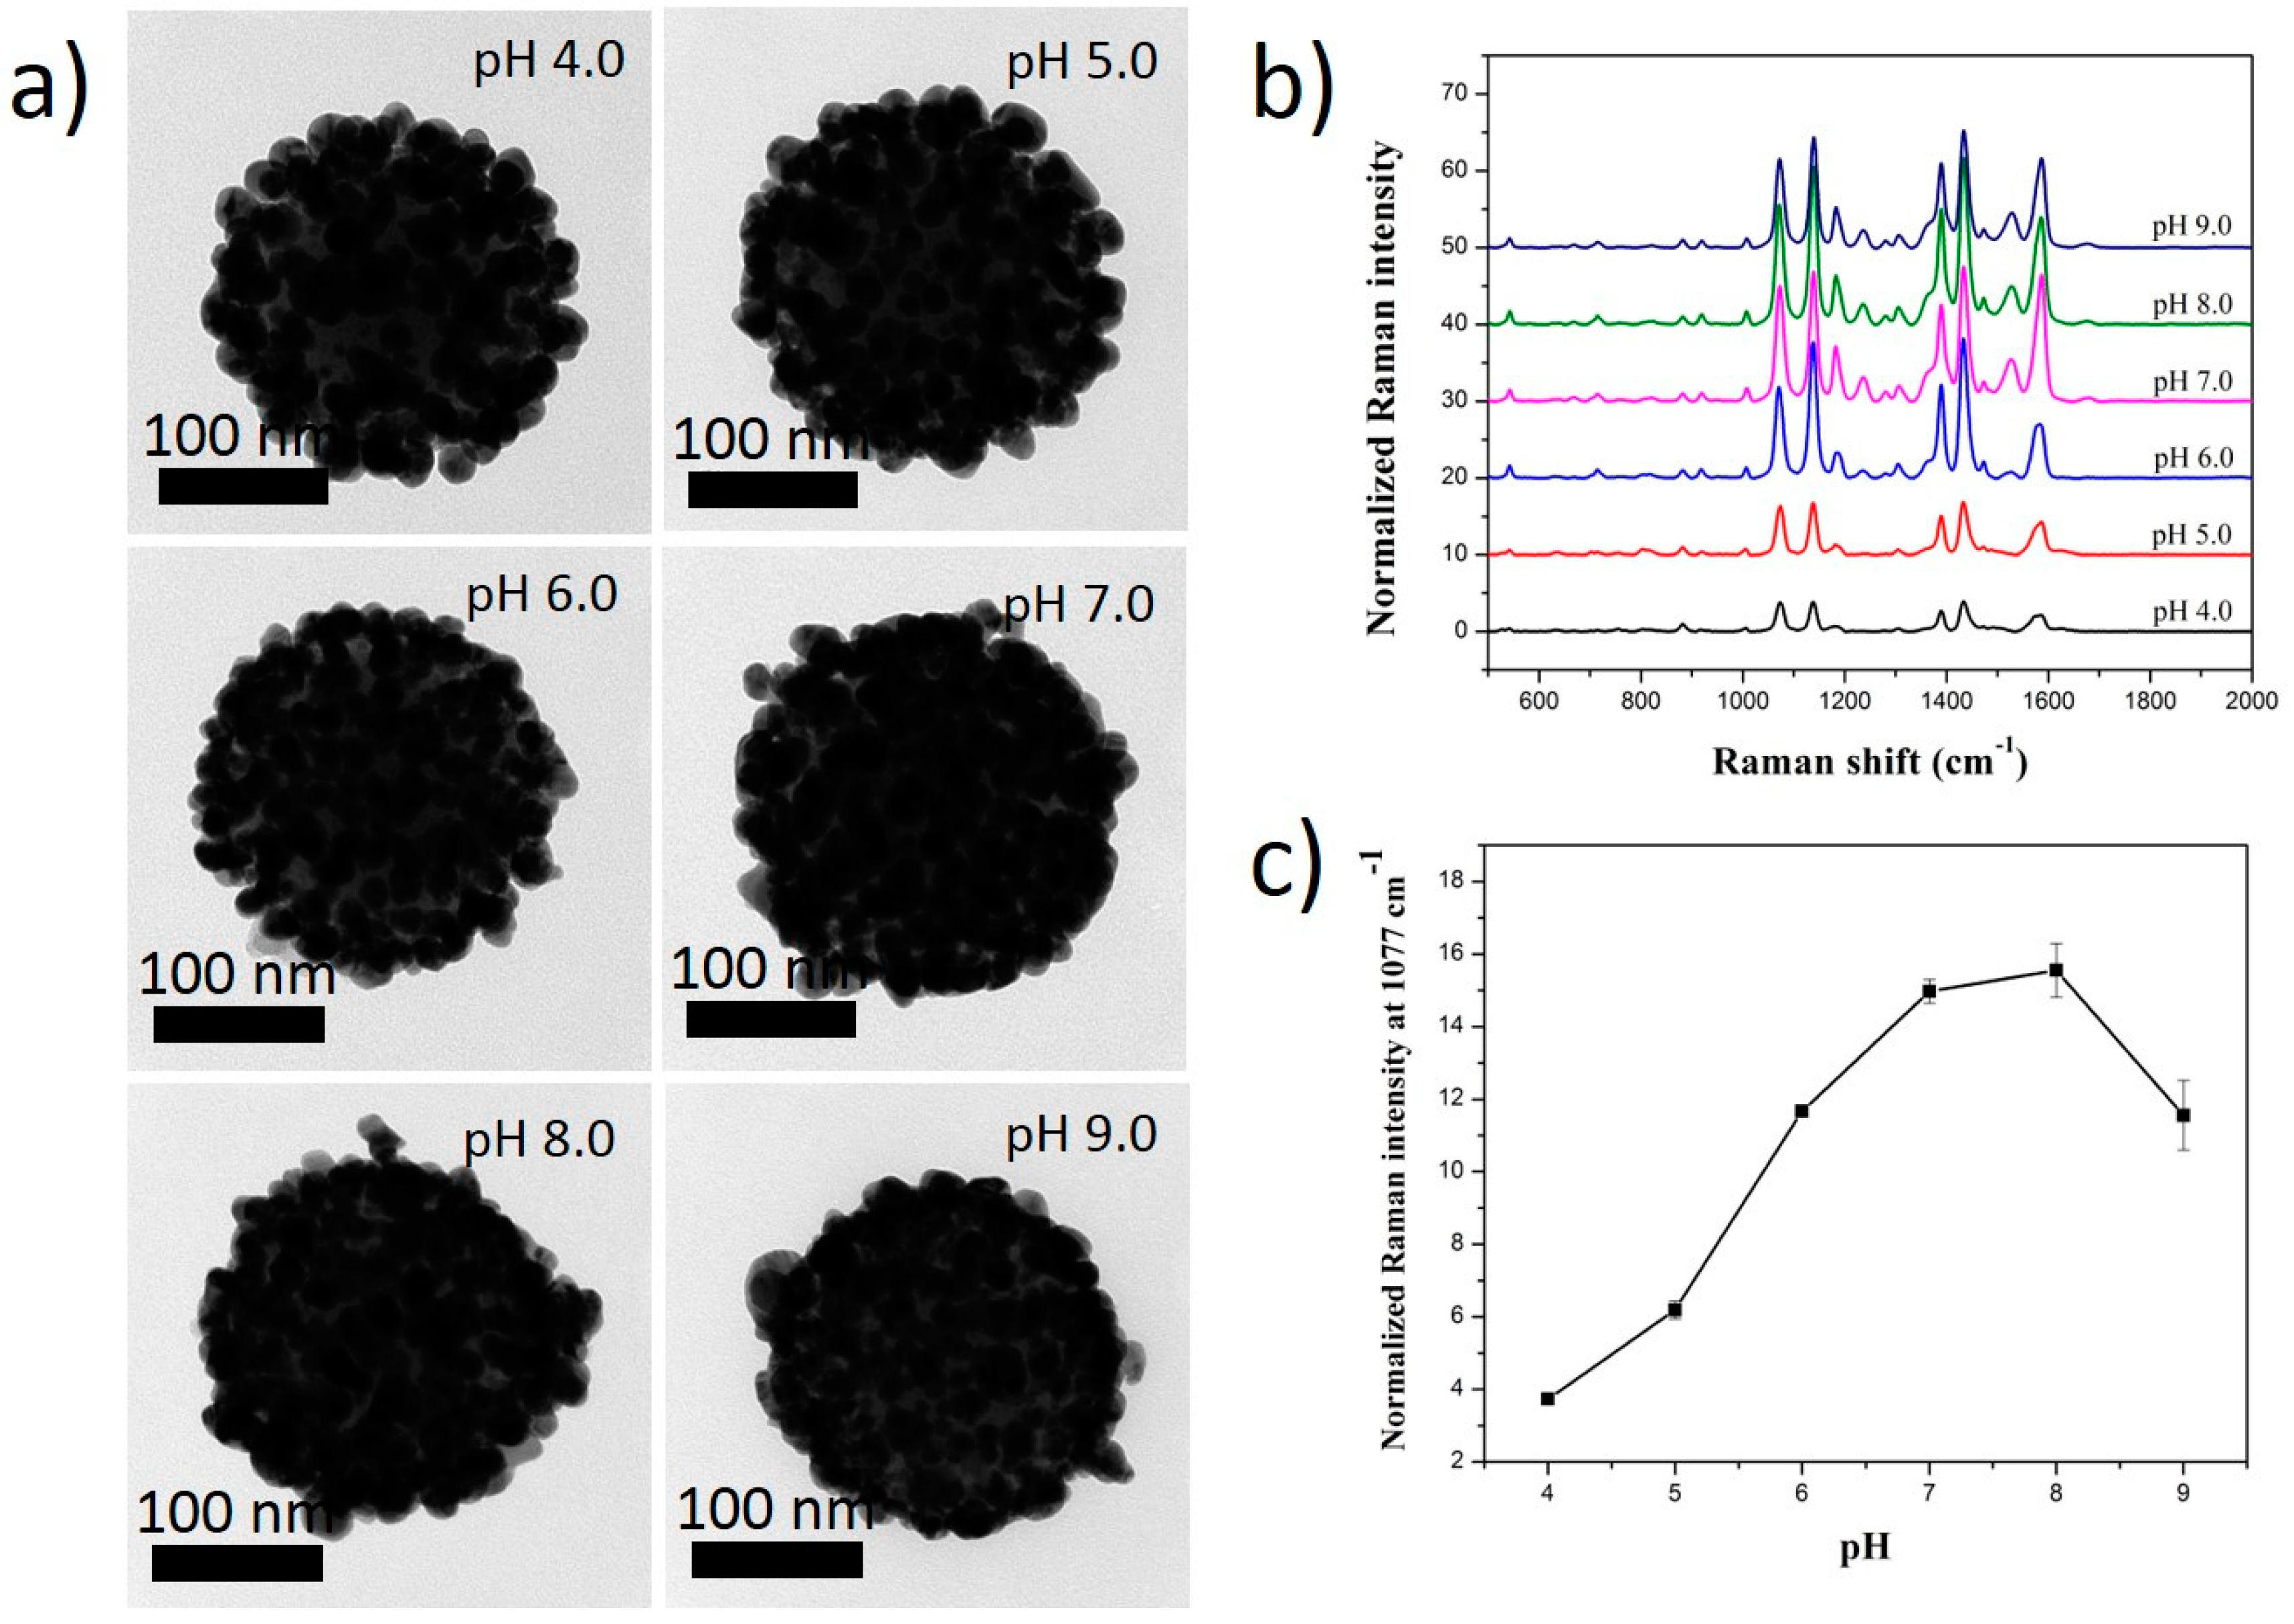
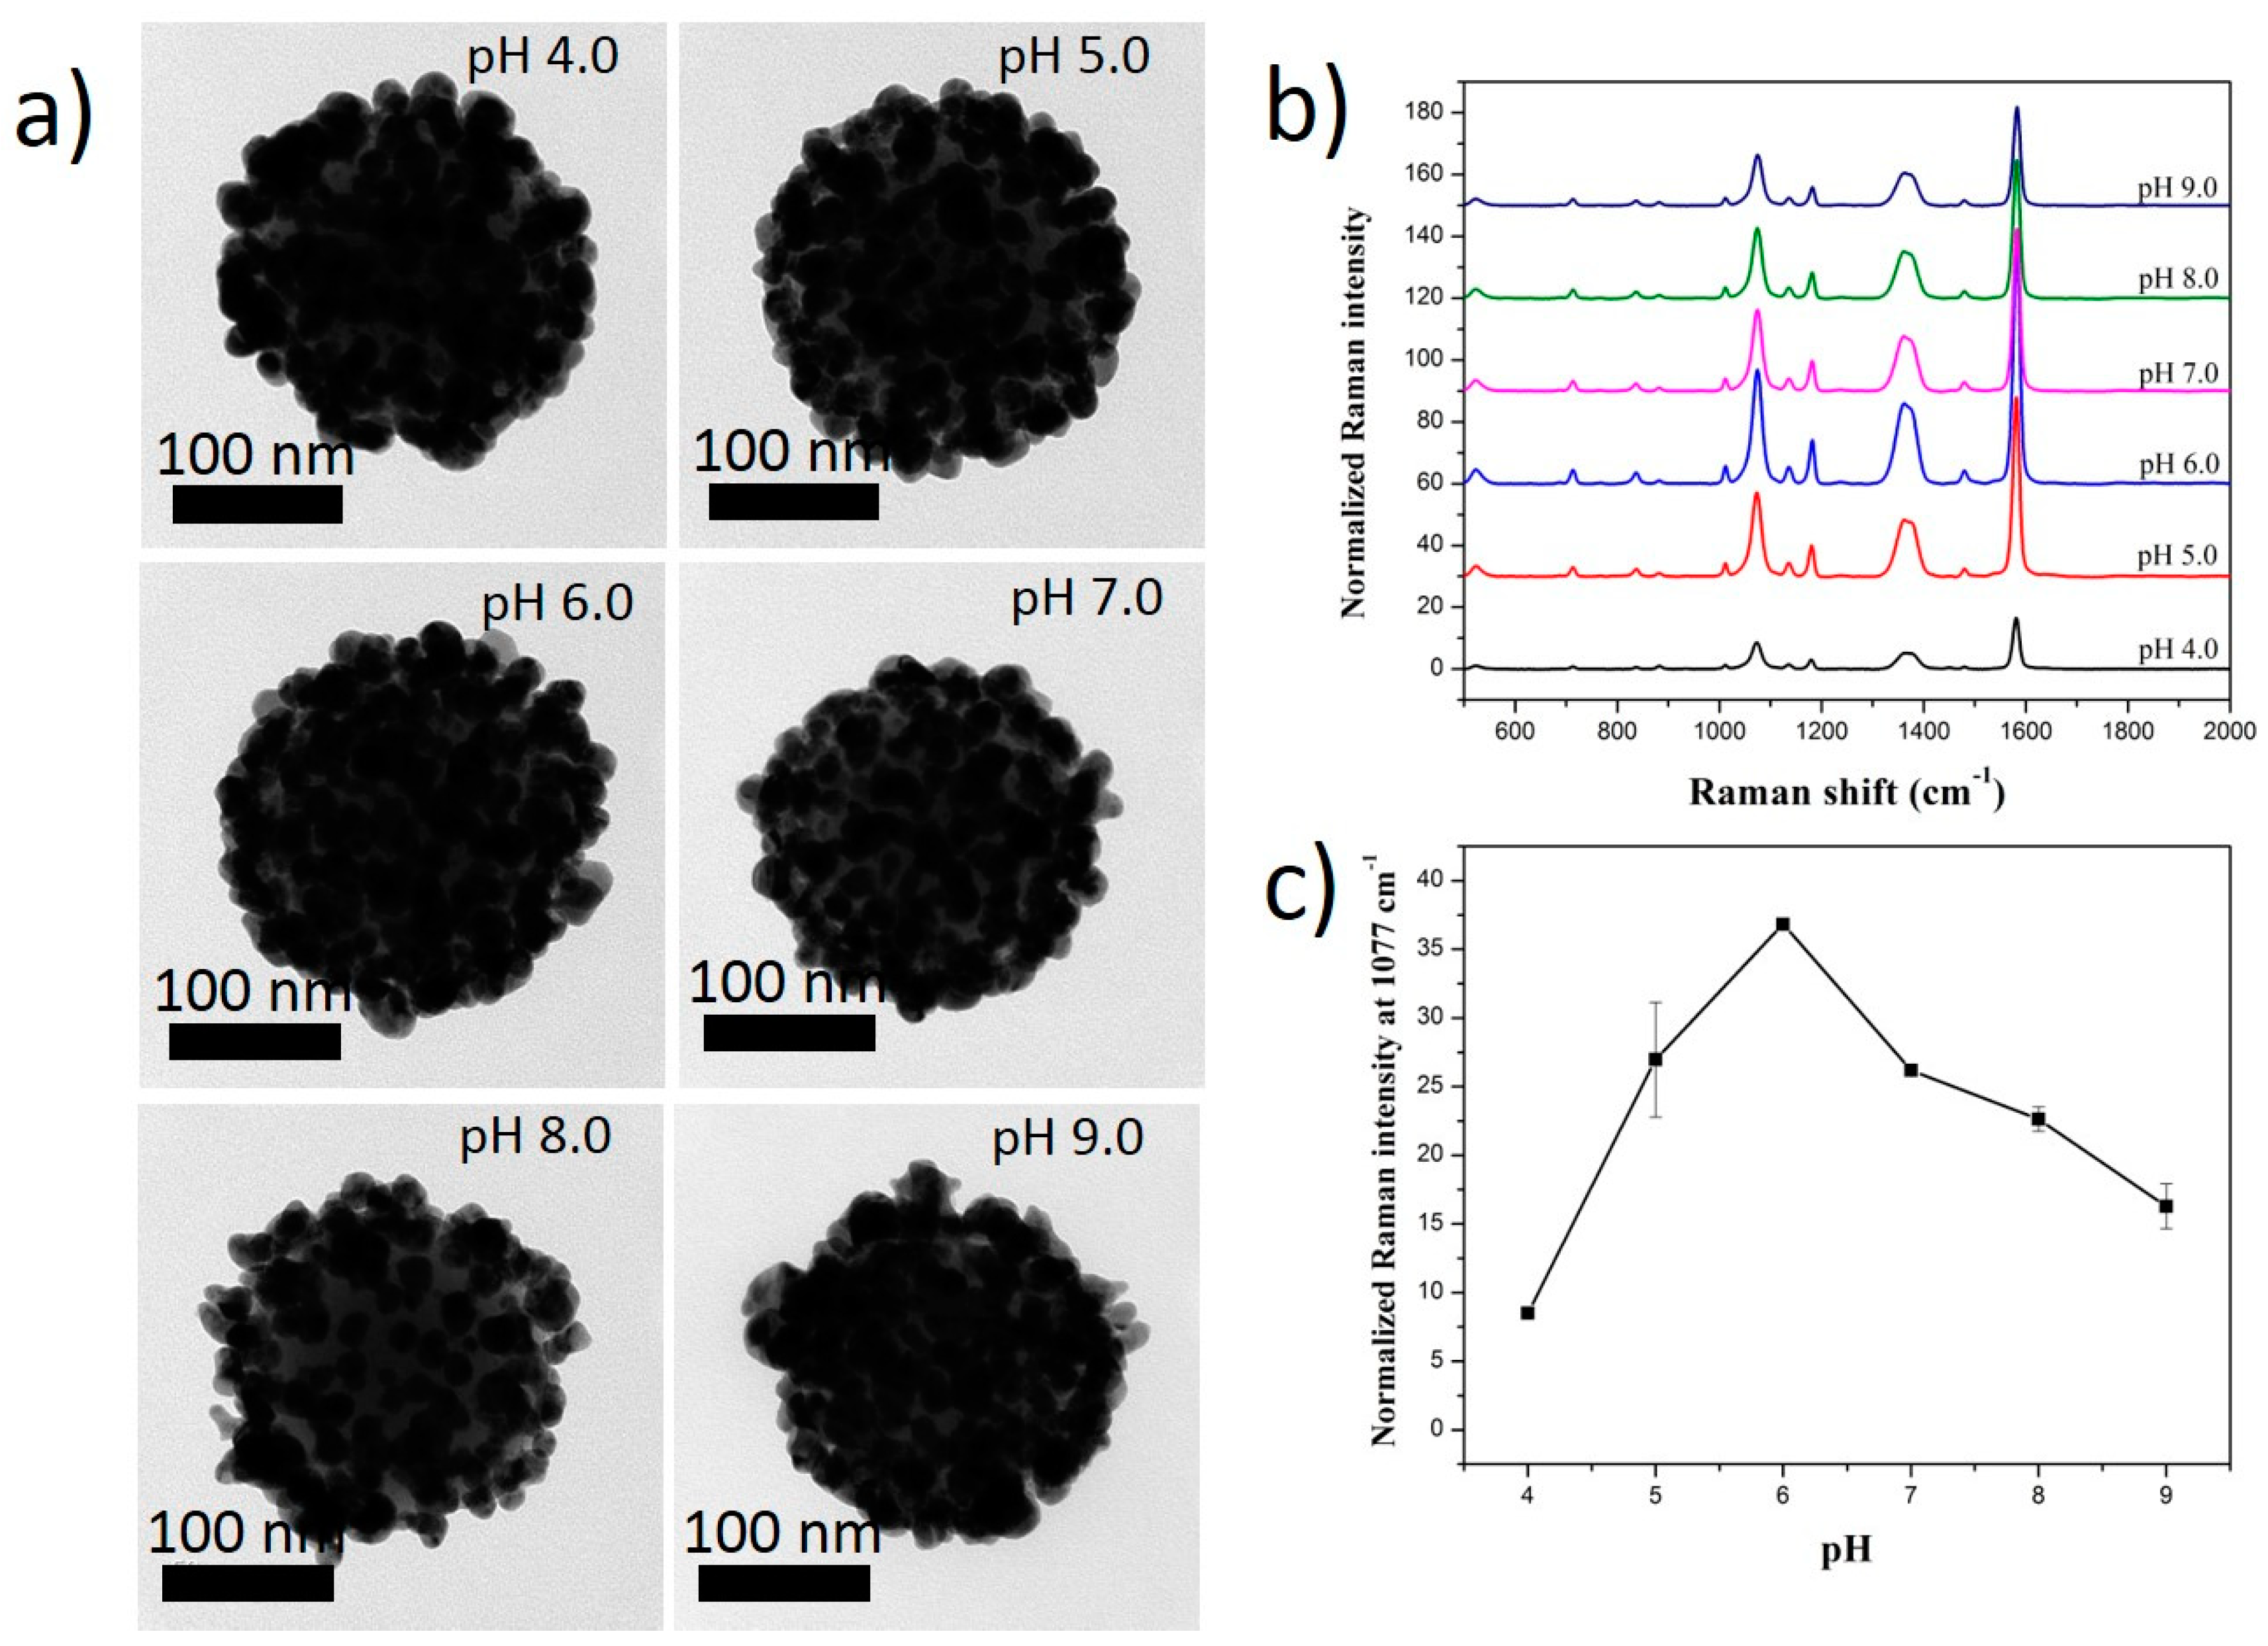
2.3. Effect of pH Solution on the Ag Shell Coating of SiO2@Au@RLC@Ag NPs

To confirm the effect of both pH and RLCs characteristics on the Ag shell coating of SiO2@Au@RLCs, we adjusted the pH of the solution during the reduction of Ag+. The coating of the Ag shell on the surface of SiO2@Au@RLCs was strongly dependent on the pH of the solution (Figure 4, Figure 5 and Figure 6). At a high pH, smaller sized silver nanoparticles were obtained, compared to those obtained at a low pH, due to the low reduction rate of AgNO3 precursors [60]. The coating of the Ag shell on the surface of SiO2@Au@4-MBT was rapid and worked well at a pH of 5.0, but became sluggish and difficult in acidic or basic pH values (Figure 4a and Figure S6). The Raman signals of SiO2@Au@4-MBT@Ag nanomaterials were measured (Figure 4b,c). The Raman signals of SiO2@Au@4-MBT@Ag were too weak and unclear because of small Au@4-MBT@Ag alloys with thin Ag shells. This result was consistent with the TEM images we observed in Figure 4a.
When 4-ATP was used as an RLC, the size of SiO2@Au@4-ATP@Ag became smaller when the pH was increased from 4.0 to 9.0 (Figure 5 and Figure S7). The coating of the Ag shell on the surface of SiO2@Au@4-ATP was rapid and worked well from an acidic to a basic pH solution. As a result, the Raman signals of SiO2@Au@4-ATP@Ag were observed clearly (Figure 5b,c). According to previous reports, pKa values of 4-ATP on a gold surface range from 5.3 to 5.9 [61,62]. At a low pH (pH < 5), NH2 groups of 4-ATP on the surface of Au NPs exist in a protonated form (NH3+), and have a stronger affinity with Ag NPs generated in a bulk solution during the reduction of AgNO3 than with those generated during the deposition of the Ag shell on the surface of the SiO2@Au@4-ATP [63]. This may lead to the formation of large Ag NPs on the surface of SiO2@Au@4-ATP, as can be seen in TEM images (Figure S7), but did not significantly increase the Raman signal of 4-ATP (Figure 5). At a high pH (pH > 6), the deposition of the Ag shell on SiO2@Au@4-ATP dominated more, leading to a greater intensity of Raman signal in 4-ATP (Figure 5a).
Similarly, when 4-MBA was used as an RLC, the size of SiO2@Au@4-MBA@Ag became smaller when the pH was increased from 4.0 to 9.0 (Figure 6 and Figure S8). The coating of the Ag shell on the surface of SiO2@Au@4-MBA was also well obtained from an acidic to a basic pH solution. The carboxyl groups of 4-MBA existed in a protonated form (-COOH) at a low pH, lower than their pKa (pKa ≈ 5) [64,65,66]. The presence of -COOH inhibited the coating of the Ag shell on the surface of the SiO2@Au@4-MBA (Figure 6) and caused a low signal in 4-MBA (Figure 6). Similarly, the deprotonated form of the carboxylate groups (-COO) became dominated on the surface of the SiO2@Au@4-MBA when the pH of the solution was raised and reached a value higher than the pKa value of 4-MBA. They also led to an increase of the Raman signal of 4-MBA in the pH range of 5.0 to 6.0. It is known that, as the pH of solution increases continuously, silver oxide or silver chloride is formed [67], which can inhibit the coating of the Ag shell on the surface of SiO2@Au@4-MBA (Figure S8), with an obvious decrease in the Raman signal of 4-MBA from a pH of 7.0 to 9.0.

3. Experiment

3.1. Materials

Tetraethylorthosilicate (TEOS), 3-aminopropyltriethoxysilane (APTS), silver nitrate (AgNO3), chloroauric acid (HAuCl4), 4-mercaptobenzoic acid (4-MBA), ascorbic acid (AA), polyvinylpyrrolidone (PVP), sodium borohydride (NaBH4), and thiram were purchased from Sigma-Aldrich (St. Louis, MO, USA) and used without further purification. Ethyl alcohol (EtOH) and aqueous ammonium hydroxide (NH4OH, 27%) were purchased from Daejung (Siheung, Korea).

3.2. Preparation of SiO2@Au NP Templates

Silica NPs (~150 nm) were prepared using the Stöber method [53]. The silica NPs (50 mg mL−1, 4 mL) were dispersed in 4 mL of absolute EtOH, and 250 μL of APTS and 40 μL of NH4OH were added to the colloidal solution to aminate the silica NPs. The mixture was stirred vigorously for 6 h at 25 °C, followed by stirring for 1 h at 70 °C. The aminated silica NPs were obtained after centrifugation at 8500 rpm for 15 min, and then washed several times with EtOH to remove excess reagent.
The colloidal Au NPs were prepared by reducing HAuCl4, using NaBH4 as a reducing agent. The reduction of HAuCl4 created small Au NPs (~7 nm) with a net negative surface charge. In order to embed Au NPs into the silica NP surface, the Au NPs (1 mM, 10 mL) and aminated SiO2 solution (1 mg·mL−1, 1 mL) were mixed and sonicated for 30 min and incubated in a shaker overnight [50]. Then, Au NP-embedded silica NPs (SiO2@Au NPs) were obtained by centrifugation at 8500 rpm for 15 min, and washed several times with EtOH to remove unbound Au NPs. The SiO2@Au NPs were re-dispersed in absolute EtOH to obtain a SiO2@Au NP suspension of 1 mg·mL−1.

3.3. Incorporating RLC into SiO2@Au

RLC solution (1 mL, 10 mM in EtOH) was added to the SiO2@Au (1.0 mg), and the suspension was stirred vigorously for 2 h at 25°C. The colloids were centrifuged and washed several times with EtOH. The NPs were re-dispersed in 1.0 mL of absolute EtOH to obtain 1 mg·mL−1 SiO2@Au NPs modified with RLC (SiO2@Au@RLC).

3.4. Preparation of SiO2@Au@RLC@Ag NPs

Au-Ag core-shell NPs were prepared in an aqueous medium by the reduction and deposition of Ag with ascorbic acid onto the Au NPs in a polyvinylpyrrolidone (PVP) environment. Briefly, 0.2 mg of SiO2@Au@RLC was dispersed in 9.8 mL of water containing 10 mg PVP, and kept still for 30 min. Twenty microliters of 10 mM silver nitrate was added to the solution, followed by the addition of 20 µL of 10 mM ascorbic acid. This solution was incubated for 15 min to reduce the Ag+ ion to Ag. The reduction steps were repeated to obtain the desired AgNO3 concentration. SiO2@Au@4-MBA@Ag NPs were obtained by centrifugation of the solution at 8500 rpm for 15 min, and the NPs were washed several times with EtOH to remove excess reagent. SiO2@Au@4-MBA@Ag NPs were re-dispersed in 0.2 mL of absolute EtOH to obtain 1 mg·mL−1 SiO2@Au@4-MBA@Ag NP suspension.

3.5. SERS Measurement of the SiO2@Au@RLC@Ag NPs

SiO2@Au@RLC@Ag NPs were measured in a capillary tube, and SERS signals were measured using a confocal micro-Raman system (LabRam 300, JY-Horiba, Tokyo, Japan) equipped with an optical microscope (BX41, Olympus, Tokyo, Japan). The SERS signals were collected in a back-scattering geometry using a ×10 objective lens (0.90 NA, Olympus) and a spectrometer equipped with a thermoelectric cooled Charge-Coupled Device (CCD) detector. A 532 nm diode-pumped solid-state laser (CL532-100-S; Crystalaser, US) was used as a photo-excitation source, exerting 10 mW laser power at the sample. The strong Rayleigh scattered light was rejected using a long-pass filter. Selected sites were measured at random, and all SERS spectra were integrated for 5 s. The size of the laser beam spot was about 2 μm.

3.6. Transmission Electron Microscopy (TEM) Measurements

Our material was dispersed in EtOH to obtain a final concentration of 1 mg mL−1, and 10 µL of the dispersed solution was dropped onto a 400 mesh Cu grid (Pelco, Fresno, CA, USA) and dried in air. Field energy transmission electron microscopy (Libra 120, Carl Zeiss, Germany) was used to analyze our materials. The acceleration voltage was 120 kV.

4. Conclusions

In summary, we have prepared three types of SiO2@Au@RLC@Ag materials with three different RLCs, including 4-MBA, 4-ATP, and 4-MBT. The effect of RLCs on the deposition of the silver shell was also investigated. The formation of the Ag shell was strongly dependent on the negative charge of SiO2@Au@RLCs, the concentration of the silver ion, and the pH solution. In general, the size of Ag NPs was greater at a lower pH and became smaller at a higher pH due to the decrease in reduction rate. Especially, the pH of the solution played an important role in the formation of the Ag shell on the surface of SiO2@Au@RLCs, by affecting the local surface charge of the RLCs. For the neutral group of -CH3, the Ag shell was coated with difficulty on RLC-modified SiO2@Au, whereas the presence of the positive charge of -NH3+ on the surface of SiO2@Au facilitated the coating of the Ag shell, leading to a greater intensity of Raman signal in 4-ATP. The negative charge of -COO led to a well coated Ag shell, and increased the Raman signal of 4-MBA in the pH range of 5.0 to 6.0. However, it inhibited the coating of the Ag shell on the surface of SiO2@Au@4-MBA, with an obvious decrease in the Raman signal of 4-MBA from a pH of 7.0 to 9.0 due to the formation of silver oxide or silver chloride. This study provides a thorough understanding of silver deposition, to support further research and the development of strong and reliable SERS probes based on SiO2@Au@RLC@Ag NPs.

Supplementary Materials

Supplementary materials can be found at https://www.mdpi.com/1422-0067/20/6/1258/s1.

Author Contributions

Conceptualization, X.-H.P. and B.-H.J.; Data curation, X.-H.P., E.H., E.K., B.S.S., Y.H. and H.-M.K.; Formal analysis, X.-H.P.; Investigation, X.-H.P.; Methodology, E.H.; Supervision, D.H.J. and B.-H.J.; Writing–original draft, X.-H.P.; Writing–review & editing, D.H.J. and B.-H.J.

Funding

This work was supported by the KU Research Professor Program of Konkuk University and funded by basic Science Research Program through the NRF funded by the Ministry of Education (NRF-2018R1D1A1B07045708) and Science, ICT & Future Planning (NRF 2016M3A9B6918892) and funded by the Korean Health Technology R&D Project, Ministry of Health & Welfare (HI17C1264).

Conflicts of Interest

The authors declare no conflict of interest.

References

  1. Schlücker, S. Surface-enhanced raman spectroscopy: Concepts and chemical applications. Angew. Chem. Int. Ed. 2014, 53, 4756–4795. [Google Scholar] [CrossRef] [PubMed]
  2. Wang, Y.; Yan, B.; Chen, L. Sers tags: Novel optical nanoprobes for bioanalysis. Chem. Rev. 2013, 113, 1391–1428. [Google Scholar] [CrossRef] [PubMed]
  3. Culha, M.; Cullum, B.; Lavrik, N.; Klutse, C.K. Surface-enhanced raman scattering as an emerging characterization and detection technique. J. Nanotechnol. 2012, 2012, 15. [Google Scholar] [CrossRef]
  4. Jun, B.-H.; Kim, G.; Jeong, S.; Noh, M.S.; Pham, X.-H.; Kang, H.; Cho, M.-H.; Kim, J.-H.; Lee, Y.-S.; Jeong, D.H. Silica core-based surface-enhanced raman scattering (sers) tag: Advances in multifunctional sers nanoprobes for bioimaging and targeting of biomarkers#. Bull. Korean Chem. Soc. 2015, 36, 963–978. [Google Scholar]
  5. Goodacre, R.; Graham, D.; Faulds, K. Recent developments in quantitative sers: Moving towards absolute quantification. TrAC Trends Anal. Chem. 2018, 102, 359–368. [Google Scholar] [CrossRef]
  6. Zhao, J.; Zhang, Z.; Yang, S.; Zheng, H.; Li, Y. Facile synthesis of mos2 nanosheet-silver nanoparticles composite for surface enhanced raman scattering and electrochemical activity. J. Alloys Compd. 2013, 559, 87–91. [Google Scholar] [CrossRef]
  7. Zhu, C.; Meng, G.; Zheng, P.; Huang, Q.; Li, Z.; Hu, X.; Wang, X.; Huang, Z.; Li, F.; Wu, N. A hierarchically ordered array of silver-nanorod bundles for surface-enhanced raman scattering detection of phenolic pollutants. Adv. Mater. 2016, 28, 4871–4876. [Google Scholar] [CrossRef]
  8. Du, Y.; Wei, W.; Zhang, X.; Li, Y. Tuning metamaterials nanostructure of janus gold nanoparticle film for surface-enhanced raman scattering. J. Phys. Chem. C 2018, 122, 7997–8002. [Google Scholar] [CrossRef]
  9. Kasera, S.; Biedermann, F.; Baumberg, J.J.; Scherman, O.A.; Mahajan, S. Quantitative sers using the sequestration of small molecules inside precise plasmonic nanoconstructs. Nano Lett. 2012, 12, 5924–5928. [Google Scholar] [CrossRef]
  10. Lim, D.-K.; Jeon, K.-S.; Hwang, J.-H.; Kim, H.; Kwon, S.; Suh, Y.D.; Nam, J.-M. Highly uniform and reproducible surface-enhanced raman scattering from DNA-tailorable nanoparticles with 1-nm interior gap. Nat. Nano 2011, 6, 452–460. [Google Scholar] [CrossRef]
  11. Li, C.; Wang, L.; Luo, Y.; Liang, A.; Wen, G.; Jiang, Z. A sensitive gold nanoplasmonic sers quantitative analysis method for sulfate in serum using fullerene as catalyst. Nanomaterials 2018, 8, 277. [Google Scholar] [CrossRef] [PubMed]
  12. Liang, A.; Li, X.; Zhang, X.; Wen, G.; Jiang, Z. A sensitive sers quantitative analysis method for ni2+ by the dimethylglyoxime reaction regulating a graphene oxide nanoribbon catalytic gold nanoreaction. Luminescence 2018, 33, 1033–1039. [Google Scholar] [CrossRef]
  13. Liang, A.; Wang, H.; Yao, D.; Jiang, Z. A simple and sensitive sers quantitative analysis method for urea using the dimethylglyoxime product as molecular probes in nanosilver sol substrate. Food Chem. 2019, 271, 39–46. [Google Scholar] [CrossRef] [PubMed]
  14. Zhang, X.-Q.; Li, S.-X.; Chen, Z.-P.; Chen, Y.; Yu, R.-Q. Quantitative sers analysis based on multiple-internal-standard embedded core-shell nanoparticles and spectral shape deformation quantitative theory. Chemometr. Intell. Lab. Syst. 2018, 177, 47–54. [Google Scholar] [CrossRef]
  15. Shen, W.; Lin, X.; Jiang, C.; Li, C.; Lin, H.; Huang, J.; Wang, S.; Liu, G.; Yan, X.; Zhong, Q.; et al. Reliable quantitative sers analysis facilitated by core–shell nanoparticles with embedded internal standards. Angew. Chem. Int. Ed. 2015, 54, 7308–7312. [Google Scholar] [CrossRef]
  16. Kammer, E.; Olschewski, K.; Bocklitz, T.; Rosch, P.; Weber, K.; Cialla, D.; Popp, J. A new calibration concept for a reproducible quantitative detection based on sers measurements in a microfluidic device demonstrated on the model analyte adenine. Phys. Chem. Chem. Phys. 2014, 16, 9056–9063. [Google Scholar] [CrossRef]
  17. Zhou, Y.; Ding, R.; Joshi, P.; Zhang, P. Quantitative surface-enhanced raman measurements with embedded internal reference. Anal. Chim. Acta 2015, 874, 49–53. [Google Scholar] [CrossRef]
  18. Zhang, L.; Li, Q.; Tao, W.; Yu, B.; Du, Y. Quantitative analysis of thymine with surface-enhanced raman spectroscopy and partial least squares (pls) regression. Anal. Bioanal. Chem. 2010, 398, 1827–1832. [Google Scholar] [CrossRef]
  19. Chen, Y.; Chen, Z.-P.; Zuo, Q.; Shi, C.-X.; Yu, R.-Q. Surface-enhanced raman spectroscopy based on conical holed enhancing substrates. Anal. Chim. Acta 2015, 887, 45–50. [Google Scholar] [CrossRef]
  20. Lorén, A.; Engelbrektsson, J.; Eliasson, C.; Josefson, M.; Abrahamsson, J.; Johansson, M.; Abrahamsson, K. Internal standard in surface-enhanced raman spectroscopy. Anal. Chem. 2004, 76, 7391–7395. [Google Scholar] [CrossRef]
  21. Chen, Y.; Chen, Z.-P.; Jin, J.-W.; Yu, R.-Q. Quantitative determination of ametryn in river water using surface-enhanced raman spectroscopy coupled with an advanced chemometric model. Chemometr. Intell. Lab. Syst. 2015, 142, 166–171. [Google Scholar] [CrossRef]
  22. Xia, T.-H.; Chen, Z.-P.; Chen, Y.; Jin, J.-W.; Yu, R.-Q. Improving the quantitative accuracy of surface-enhanced raman spectroscopy by the combination of microfluidics with a multiplicative effects model. Anal. Methods 2014, 6, 2363–2370. [Google Scholar] [CrossRef]
  23. Chen, Y.; Chen, Z.-P.; Long, S.-Y.; Yu, R.-Q. Generalized ratiometric indicator based surface-enhanced raman spectroscopy for the detection of cd2+ in environmental water samples. Anal. Chem. 2014, 86, 12236–12242. [Google Scholar] [CrossRef]
  24. Hammond, P.T. Form and function in multilayer assembly: New applications at the nanoscale. Adv. Mater. 2004, 16, 1271–1293. [Google Scholar] [CrossRef]
  25. Wang, F.; Deng, R.; Wang, J.; Wang, Q.; Han, Y.; Zhu, H.; Chen, X.; Liu, X. Tuning upconversion through energy migration in core–shell nanoparticles. Nat. Mater. 2011, 10, 968. [Google Scholar] [CrossRef]
  26. Huang, X.; Han, S.; Huang, W.; Liu, X. Enhancing solar cell efficiency: The search for luminescent materials as spectral converters. Chem. Soc. Rev. 2013, 42, 173–201. [Google Scholar] [CrossRef]
  27. Maeda, K.; Domen, K. Photocatalytic water splitting: Recent progress and future challenges. J. Phys. Chem. Lett. 2010, 1, 2655–2661. [Google Scholar] [CrossRef]
  28. Zhang, N.; Liu, S.; Fu, X.; Xu, Y.-J. Synthesis of m@tio2 (m = au, pd, pt) core–shell nanocomposites with tunable photoreactivity. J. Phys. Chem. C 2011, 115, 9136–9145. [Google Scholar] [CrossRef]
  29. Zhang, N.; Liu, S.; Xu, Y.-J. Recent progress on metal core@semiconductor shell nanocomposites as a promising type of photocatalyst. Nanoscale 2012, 4, 2227–2238. [Google Scholar] [CrossRef]
  30. Pelaez, M.; Nolan, N.T.; Pillai, S.C.; Seery, M.K.; Falaras, P.; Kontos, A.G.; Dunlop, P.S.M.; Hamilton, J.W.J.; Byrne, J.A.; O’Shea, K.; et al. A review on the visible light active titanium dioxide photocatalysts for environmental applications. Appl. Catal. B Environ. 2012, 125, 331–349. [Google Scholar] [CrossRef] [Green Version]
  31. Strobbia, P.; Languirand, E.R.; Cullum, B.M. Recent Advances in Plasmonic Nanostructures for Sensing: A Review. Opt. Eng. 2015, 54, 100902. [Google Scholar] [CrossRef]
  32. Loo, C.; Lin, A.; Hirsch, L.; Lee, M.-H.; Barton, J.; Halas, N.; West, J.; Drezek, R. Nanoshell-enabled photonics-based imaging and therapy of cancer. Technol. Cancer Res. Treat. 2004, 3, 33–40. [Google Scholar] [CrossRef]
  33. Janib, S.M.; Moses, A.S.; MacKay, J.A. Imaging and drug delivery using theranostic nanoparticles. Adv. Drug Deliv. Rev. 2010, 62, 1052–1063. [Google Scholar] [CrossRef] [PubMed] [Green Version]
  34. Chen, G.; Roy, I.; Yang, C.; Prasad, P.N. Nanochemistry and nanomedicine for nanoparticle-based diagnostics and therapy. Chem. Rev. 2016, 116, 2826–2885. [Google Scholar] [CrossRef] [PubMed]
  35. Jain, P.K.; El-Sayed, I.H.; El-Sayed, M.A. Au nanoparticles target cancer. Nano Today 2007, 2, 18–29. [Google Scholar] [CrossRef]
  36. Gobin, A.M.; Lee, M.H.; Halas, N.J.; James, W.D.; Drezek, R.A.; West, J.L. Near-infrared resonant nanoshells for combined optical imaging and photothermal cancer therapy. Nano Lett. 2007, 7, 1929–1934. [Google Scholar] [CrossRef]
  37. Loo, C.; Lowery, A.; Halas, N.; West, J.; Drezek, R. Immunotargeted nanoshells for integrated cancer imaging and therapy. Nano Lett. 2005, 5, 709–711. [Google Scholar] [CrossRef]
  38. Ghosh Chaudhuri, R.; Paria, S. Core/shell nanoparticles: Classes, properties, synthesis mechanisms, characterization, and applications. Chem. Rev. 2012, 112, 2373–2433. [Google Scholar] [CrossRef]
  39. Pandikumar, A.; Lim, S.-P.; Jayabal, S.; Huang, N.M.; Lim, H.N.; Ramaraj, R. Titania@gold plasmonic nanoarchitectures: An ideal photoanode for dye-sensitized solar cells. Renew. Sustain. Energy Rev. 2016, 60, 408–420. [Google Scholar] [CrossRef]
  40. Jiang, H.-L.; Akita, T.; Xu, Q. A one-pot protocol for synthesis of non-noble metal-based core–shell nanoparticles under ambient conditions: Toward highly active and cost-effective catalysts for hydrolytic dehydrogenation of nh3bh3. Chem. Commun. 2011, 47, 10999–11001. [Google Scholar] [CrossRef]
  41. Caruso, F.; Spasova, M.; Salgueiriño-Maceira, V.; Liz-Marzán, L.M. Multilayer assemblies of silica-encapsulated gold nanoparticles on decomposable colloid templates. Adv. Mater. 2001, 13, 1090–1094. [Google Scholar] [CrossRef]
  42. Oldenburg, S.J.; Averitt, R.D.; Westcott, S.L.; Halas, N.J. Nanoengineering of optical resonances. Chem. Phys. Lett. 1998, 288, 243–247. [Google Scholar] [CrossRef]
  43. Li, J.-F.; Zhang, Y.-J.; Ding, S.-Y.; Panneerselvam, R.; Tian, Z.-Q. Core–shell nanoparticle-enhanced raman spectroscopy. Chem. Rev. 2017, 117, 5002–5069. [Google Scholar] [CrossRef]
  44. Anker, J.N.; Hall, W.P.; Lyandres, O.; Shah, N.C.; Zhao, J.; Van Duyne, R.P. Biosensing with plasmonic nanosensors. Nat. Mater. 2008, 7, 442. [Google Scholar] [CrossRef]
  45. Raemdonck, K.; Demeester, J.; De Smedt, S. Advanced nanogel engineering for drug delivery. Soft Matter 2009, 5, 707–715. [Google Scholar] [CrossRef]
  46. Gao, J.; Zhao, C.; Zhang, Z.; Li, G. An intrinsic internal standard substrate of au@ps-b-p4vp for rapid quantification by surface enhanced raman scattering. Analyst 2017, 142, 2936–2944. [Google Scholar] [CrossRef]
  47. Hahm, E.; Cha, M.G.; Kang, E.J.; Pham, X.-H.; Lee, S.H.; Kim, H.-M.; Kim, D.-E.; Lee, Y.-S.; Jeong, D.H.; Jun, B.-H. Multi-layer ag-embedded silica nanostructure as sers-based chemical sensor with dual-function internal standards. ACS Appl. Mater. Interfaces 2018, 10, 40748–40755. [Google Scholar] [CrossRef]
  48. Feng, Y.; Wang, Y.; Wang, H.; Chen, T.; Tay, Y.Y.; Yao, L.; Yan, Q.; Li, S.; Chen, H. Engineering “hot” nanoparticles for surface-enhanced raman scattering by embedding reporter molecules in metal layers. Small 2012, 8, 246–251. [Google Scholar] [CrossRef]
  49. Gandra, N.; Singamaneni, S. Bilayered raman-intense gold nanostructures with hidden tags (brights) for high-resolution bioimaging. Adv. Mater. 2013, 25, 1022–1027. [Google Scholar] [CrossRef]
  50. Pham, X.-H.; Lee, M.; Shim, S.; Jeong, S.; Kim, H.-M.; Hahm, E.; Lee, S.H.; Lee, Y.-S.; Jeong, D.H.; Jun, B.-H. Highly sensitive and reliable sers probes based on nanogap control of a au-ag alloy on silica nanoparticles. RSC Adv. 2017, 7, 7015–7021. [Google Scholar] [CrossRef]
  51. Shim, S.; Pham, X.-H.; Cha, M.G.; Lee, Y.-S.; Jeong, D.H.; Jun, B.-H. Size effect of gold on ag-coated au nanoparticle-embedded silica nanospheres. RSC Adv. 2016, 6, 48644–48650. [Google Scholar] [CrossRef]
  52. Pham, X.-H.; Hahm, E.; Kang, E.; Ha, Y.N.; Lee, S.H.; Rho, W.-Y.; Lee, Y.-S.; Jeong, D.H.; Jun, B.-H. Gold-silver bimetallic nanoparticles with a raman labeling chemical assembled on silica nanoparticles as an internal-standard-containing nanoprobe. J. Alloys Compd. 2019, 779, 360–366. [Google Scholar] [CrossRef]
  53. Stöber, W.; Fink, A.; Bohn, E. Controlled growth of monodisperse silica spheres in the micron size range. J. Colloid Interface Sci. 1968, 26, 62–69. [Google Scholar] [CrossRef]
  54. Martin, M.N.; Basham, J.I.; Chando, P.; Eah, S.-K. Charged gold nanoparticles in non-polar solvents: 10-min synthesis and 2d self-assembly. Langmuir 2010, 26, 7410–7417. [Google Scholar] [CrossRef]
  55. Martin, M.N.; Li, D.; Dass, A.; Eah, S.-K. Ultrafast, 2 min synthesis of monolayer-protected gold nanoclusters (d < 2 nm). Nanoscale 2012, 4, 4091–4094. [Google Scholar]
  56. Bastús, N.G.; Merkoçi, F.; Piella, J.; Puntes, V. Synthesis of highly monodisperse citrate-stabilized silver nanoparticles of up to 200 nm: Kinetic control and catalytic properties. Chem. Mater. 2014, 26, 2836–2846. [Google Scholar] [CrossRef]
  57. Genov, D.A.; Sarychev, A.K.; Shalaev, V.M. Metal-dielectric composite filters with controlled spectral windows of transparency. J. Nonlinear Opt. Phys. Mater. 2003, 12, 419–440. [Google Scholar] [CrossRef]
  58. Biswas, A.; Eilers, H.; Hidden, F.; Aktas, O.C.; Kiran, C.V.S. Large broadband visible to infrared plasmonic absorption from ag nanoparticles with a fractal structure embedded in a teflon af® matrix. Appl. Phys. Lett. 2006, 88, 013103. [Google Scholar] [CrossRef]
  59. Yang, J.-K.; Kang, H.; Lee, H.; Jo, A.; Jeong, S.; Jeon, S.-J.; Kim, H.-I.; Lee, H.-Y.; Jeong, D.H.; Kim, J.-H.; et al. Single-step and rapid growth of silver nanoshells as sers-active nanostructures for label-free detection of pesticides. ACS Appl. Mater. Interfaces 2014, 6, 12541–12549. [Google Scholar] [CrossRef] [PubMed]
  60. Alqadi, M.K.; Abo Noqtah, O.A.; Alzoubi, F.Y.; Alzouby, J.; Aljarrah, K. Ph effect on the aggregation of silver nanoparticles synthesized by chemical reduction. Mater. Sci. Poland 2014, 32, 107–111. [Google Scholar] [CrossRef]
  61. Bryant, M.A.; Crooks, R.M. Determination of surface pka values of surface-confined molecules derivatized with ph-sensitive pendant groups. Langmuir 1993, 9, 385–387. [Google Scholar] [CrossRef]
  62. Zhang, H.; He, H.-X.; Mu, T.; Liu, Z.-F. Force titration of amino group-terminated self-assembled monolayers of 4-aminothiophenol on gold using chemical force microscopy. Thin Solid Films 1998, 327–329, 778–780. [Google Scholar] [CrossRef]
  63. Bayram, S.; Zahr, O.K.; Blum, A.S. Short ligands offer long-term water stability and plasmon tunability for silver nanoparticles. RSC Adv. 2015, 5, 6553–6559. [Google Scholar] [CrossRef]
  64. Koivisto, J.; Chen, X.; Donnini, S.; Lahtinen, T.; Häkkinen, H.; Groenhof, G.; Pettersson, M. Acid–base properties and surface charge distribution of the water-soluble au102(pmba)44 nanocluster. J. Phys. Chem. C 2016, 120, 10041–10050. [Google Scholar] [CrossRef]
  65. Clark, R.A.; Trout, C.J.; Ritchey, L.E.; Marciniak, A.N.; Weinzierl, M.; Schirra, C.N.; Christopher Kurtz, D. Electrochemical titration of carboxylic acid terminated sams on evaporated gold: Understanding the ferricyanide electrochemistry at the electrode surface. J. Electroanal. Chem. 2013, 689, 284–290. [Google Scholar] [CrossRef]
  66. Zhang, H.; Zhang, H.-L.; He, H.-X.; Zhu, T.; Liu, Z.-F. Study on the surface dissociation properties of 6-(10-mercaptodecaoxyl)quinoline self-assembled monolayer on gold by chemical force titration. Mate. Sci. Eng. C 1999, 8, 191–194. [Google Scholar] [CrossRef]
  67. Ma, Y.; Li, W.; Cho, E.C.; Li, Z.; Yu, T.; Zeng, J.; Xie, Z.; Xia, Y. Au@ag core−shell nanocubes with finely tuned and well-controlled sizes, shell thicknesses, and optical properties. ACS Nano 2010, 4, 6725–6734. [Google Scholar] [CrossRef] [PubMed]
Figure 1. Illustration of a typical preparation of Au@Raman Labeling Compound@Ag embedded silica nanoparticles for a surface-enhanced Raman scattering (SERS) probe. Au NPs embedded silica nanoparticles were incubated with three different Raman labeling compounds, including 4-ATP, 4-MBA, and 4-MBT, and coated with an Ag shell by the reduction of silver nitrate in the presence of ascorbic acid and polyvinyl pyrrolidone.
Ijms 20 01258 g001
Figure 2. (a) Transmission electron microscopy (TEM) images, (b) UV-Vis absorption spectra of (i) SiO2@Au@4-ATP@Ag, (ii) SiO2@Au@4-MBA@Ag and (iii) SiO2@Au@4-MBT@Ag synthesized in water, and (c) their normalized Raman intensity at 1077 cm−1. All SiO2@Au was fixed at 200 µg. Concentration of Raman Labeling Chemical was 1 mM and that of AgNO3 was 300 µM.
Ijms 20 01258 g002
Figure 3. UV-Vis absorption spectra of (a) SiO2@Au@4-ATP@Ag, (b) SiO2@Au@4-MBA@Ag, (c) SiO2@Au@4-MBT@Ag nanoparticles, and (d) the normalized Raman spectra of the particles coated with different concentrations of AgNO3 in water. All SiO2@Au was fixed at 200 µg. Concentration of RLCs was 1 mM.
Ijms 20 01258 g003
Figure 4. (a) TEM images and (b,c) Raman spectra of SiO2@Au@4-MBT@Ag synthesized at different pH solutions. All SiO2@Au was fixed at 200 µg. Concentration of RLCs was 1 mM and that of AgNO3 was 300 µM.
Ijms 20 01258 g004
Figure 5. (a) TEM images and (b,c) Raman spectra of SiO2@Au@4-ATP@Ag synthesized at different pH solutions. All SiO2@Au was fixed at 200 µg. Concentration of RLCs was 1 mM and that of AgNO3 was 300 µM.
Ijms 20 01258 g005
Figure 6. (a) TEM images and (b,c) Raman spectra of SiO2@Au@4-MBA@Ag synthesized at different pH solutions. All SiO2@Au was fixed at 200 µg. Concentration of RLCs was 1 mM and that of AgNO3 was 300 µM.
Ijms 20 01258 g006

