Article

Physiological and Transcriptome Analyses of Early Leaf Senescence for ospls1 Mutant Rice (Oryza sativa L.) during the Grain-Filling Stage

1
College of Life Sciences, Fujian Agriculture and Forestry University, Fuzhou 350002, China
2
Fujian Provincial Key Laboratory of Agroecological Processing and Safety Monitoring, Fujian Agriculture and Forestry University, Fuzhou 350002, China
3
College of Crop Science, Fujian Agriculture and Forestry University, Fuzhou 350002, China
*
Author to whom correspondence should be addressed.
Int. J. Mol. Sci. 2019, 20(5), 1098; https://doi.org/10.3390/ijms20051098
Submission received: 5 December 2018 / Revised: 21 February 2019 / Accepted: 28 February 2019 / Published: 4 March 2019
(This article belongs to the Special Issue Transcriptional and Post-transcriptional Gene Regulation in Plants)

Abstract

:
Early leaf senescence is an important agronomic trait that affects crop yield and quality. To understand the molecular mechanism of early leaf senescence, Oryza sativa premature leaf senescence 1 (ospls1) mutant rice with a deletion of OsVHA-A and its wild type were employed in this study. The genotype-dependent differences in photosynthetic indexes, senescence-related physiological parameters, and yield characters were investigated during the grain-filling stage. Moreover, RNA sequencing (RNA-seq) was performed to determine the genotype differences in transcriptome during the grain-filling stage. Results showed that the ospls1 mutant underwent significant decreases in the maximal quantum yield of photosystem II (PSII) photochemistry (Fv/Fm), net photosynthesis rate (Pn), and soluble sugar and protein, followed by the decreases in OsVHA-A transcript and vacuolar H+-ATPase activity. Finally, yield traits were severely suppressed in the ospls1 mutant. RNA-seq results showed that 4827 differentially expressed genes (DEGs) were identified in ospls1 mutant between 0 day and 14 days, and the pathways of biosynthesis of secondary metabolites, carbon fixation in photosynthetic organisms, and photosynthesis were downregulated in the senescing leaves of ospls1 mutant during the grain-filling stage. In addition, 81 differentially expressed TFs were identified to be involved in leaf senescence. Eleven DEGs related to hormone signaling pathways were significantly enriched in auxin, cytokinins, brassinosteroids, and abscisic acid pathways, indicating that hormone signaling pathways participated in leaf senescence. Some antioxidative and carbohydrate metabolism-related genes were detected to be differentially expressed in the senescing leaves of ospls1 mutant, suggesting that these genes probably play response and regulatory roles in leaf senescence.

1. Introduction

Senescence is the final stage of leaf development and corresponds to the programmed degradation of cells, tissues, organs, and the entire organism [1]. Leaf senescence is not a passive and confused deterioration process. The senescing leaves undergo dramatically coordinated changes at the physiological, biochemical, and molecular levels during the senescence period [2]. For example, the expression of senescence-associated genes (SAGs), chlorophyll breakdown, photosynthesis termination, membrane deterioration, malondialdehyde (MDA) accumulation, and macromolecule hydrolysis comprise the senescence physiological processes, which cause the disassembly of cell structure and cell death [1,3]. While leaf senescence is a deleterious process, it has a special role in recruiting nutrients from senescing tissues to still living parts of the plant. In the senescing leaves of annual plants, the hydrolysates of macromolecules, such as starch, proteins, lipids, and nucleic acids, are trans-located to developing seeds and fruits and contribute to the final yields. Thus, reasonable leaf senescence is essential to maximize viability during the plant’s life cycle [4]. However, early leaf senescence often occurs when plants encounter various stresses. Early leaf senescence will shorten the growth phase of crops and result in losses of yield and quality, which are extremely harmful to agronomic production. Until now, early leaf senescence has become an increasing concern in pace with global climate changes in recent decades [5].
Rice (Oryza sativa L.) is one of the most important cereal crops and serves as a staple food that feeds more than a half of the world’s population, mainly in Asia [6]. In rice, grain yield is greatly dependent on photosynthetic substances of functional leaves during the grain-filling stage, and extending leaf green and photosynthesis duration is crucial to obtaining superior yield. However, leaf senescence often occurs too early under severe environmental stresses, and an early occurrence of leaf senescence caused by adverse environmental stresses leads to a drop in photosynthesis and precocious cell death [7,8]. Early leaf senescence during the grain-filling stage retards the translocation of nutrients from source leaves to developing grains, resulting in incomplete grain setting and reduced final yield [9]. Over the past few decades, many advances have been achieved in understanding the yield effects, onset and progression, and genetic control of early leaf senescence at the physiological and molecular levels [8,10,11]. The most distinguishing characteristics of early leaf senescence in rice are chloroplast degeneration and chlorophyll degradation, followed by the accumulation of reactive oxygen species (ROS) such as superoxide anion radicals (O2), hydroxyl radicals (OH∙), singlet oxygen (1O2), and hydrogen peroxide (H2O2). ROS, as signaling molecules, affect the expression of SAGs, thereby resulting in oxidative stress and damage to cellular organelles [12,13]. Meanwhile, a large number of SAGs have been experimentally identified in rice, including numerous transcription factors (TFs), such as WRKY, NAC, MYB, and bZIP family members; transporters; defense-related genes; signal transduction-related proteins [8]; kinases and receptor-like kinases; and regulators of metabolism [11]. Moreover, leaf senescence of rice is accelerated by abscisic acid (ABA), brassinosteroids (BRs), ethylene (ET), and methyl jasmonate [14]. Exogenously applied ABA and salinity induce the expressions of several SAGs to accelerate leaf senescence, indicating the substantive mechanisms of connection between leaf senescence, ABA, and stress signaling [15,16]. Early leaf senescence in rice is an integrated metabolic response to various stimulations, dominated by extremely complex transcriptional regulatory networks.
Vacuolar H+-ATPase (V-H+-ATPase) is a large multi-heteromeric protein complex making up 6.5%–35% of the total tonoplast protein mass and is of prime importance for plant development and stress adaptation [17,18]. This protein complex is mainly located in vacuolar membranes, plasma membranes, and other endomembrane systems. It pumps protons into membrane-surrounded intracellular compartments at the expense of hydrolysis energy of ATP and is required to activate secondary transport processes across tonoplast and vesicle dynamics [19,20]. In plants, V-H+-ATPase has been proved to be indispensable in several cellular processes and physiological responses, including membrane trafficking, male gametophyte development [21], lateral root development, stomatal density and opening [22], environmental stress tolerance [23], leaf senescence, and seed dormancy [24]. Biochemical experiments on the subunit composition of V-H+-ATPase have showed that V-H+-ATPase is built from up to 14 subunits, among which the V-H+-ATPase subunit A (VHA-A) is an indispensable catalytic subunit protruding into the cytoplasm [20]. In Arabidopsis, the deficiency of VHA-A transcripts damages complete male and partial female gametophytes, owing to abnormal morphological changes in Golgi stacks and Golgi-derived vesicles [21]. In rice, RNAi-mediated inhibition of OsVHA-A transcriptions increases stomatal density and aperture, thereby increasing the susceptibility to drought and salt stress [22]. Yang et al. [24] revealed that a decrease in OsVHA-A transcription for Oryza sativa premature leaf senescence 1 (ospls1) mutant rice gave rise to ROS accumulation and salicylic acid (SA) increase, resulting in a phenotype of early leaf senescence. In a word, these studies support the crucial role of OsVHA-A in rice plant growth, development, and senescence. However, until now, the molecular mechanism and global transcriptional control on the involvement of OsVHA-A in early leaf senescence in rice remain poorly understood.
In this study, a premature senescence rice mutant, named ospls1, and its corresponding wild type were employed to compare the genotype-dependent differences in agronomic characteristics, photosynthetic ability, and senescence-related physiological parameters of leaves during the grain-filling stage. Meanwhile, the expression of the mutant gene, OsVHA-A, which caused the phenotype of premature leaf senescence, was detected for two rice genotypes by quantitative real-time polymerase chain reaction (qRT-PCR). Based on the revolutionary technological superiority in understanding complex eukaryote transcriptome, RNA sequencing (RNA-seq) was used to investigate the transcriptome differences in flag leaves of ospls1 mutant rice and its wild type during the grain-filling stage. According to extensive data analyses, many differentially expressed genes (DEGs) and metabolic pathways were identified and characterized, which were involved in early leaf senescence in terms of OsVHA-A mutation in ospls1 mutant rice during the grain-filling stage.

2. Results

2.1. Characterization of Phenotype, Major Agronomic Traits, and Biochemical Changes of ospls1 Mutant during the Grain-Filling Stage

At the heading stage, the lower leaves of ospls1 mutant plant showed visible early senescence symptoms, and flag leaves retained normal green appearance (Figure 1A). After heading, the flag leaves of ospls1 mutant appeared to exhibit early senescence symptoms and became obviously visible on the 14th day of grain filling, followed by reddish brown lesions extending to the leaf blade (Figure 1B). The ospls1 mutant presented a shorter panicle than the wild type (Figure 1C). In addition, the ospls1 mutant also displayed significant differences from wild type in terms of plant height, available panicle number, seed-setting rate, 1000-grain weight, yield per plant, and harvest index (Table 1). Under field condition, the plant height of ospls1 mutant was 92.4 cm (2015), which was significantly shorter than that of the wild type, 109.3 cm (p < 0.05, 2015). Available panicle numbers of the ospls1 mutant and wild type were 6.3 and 11.7, respectively. The seed-setting rate and 1000-grain weight of the ospls1 mutant were 42.8% and 17.62 g, respectively, which were significantly less than those of the wild type, 84.5% and 23.27 g (p < 0.05, 2015). In comparison with the wild type, the ospls1 mutant exhibited remarkable early leaf senescence and decreases in yield and harvest index.
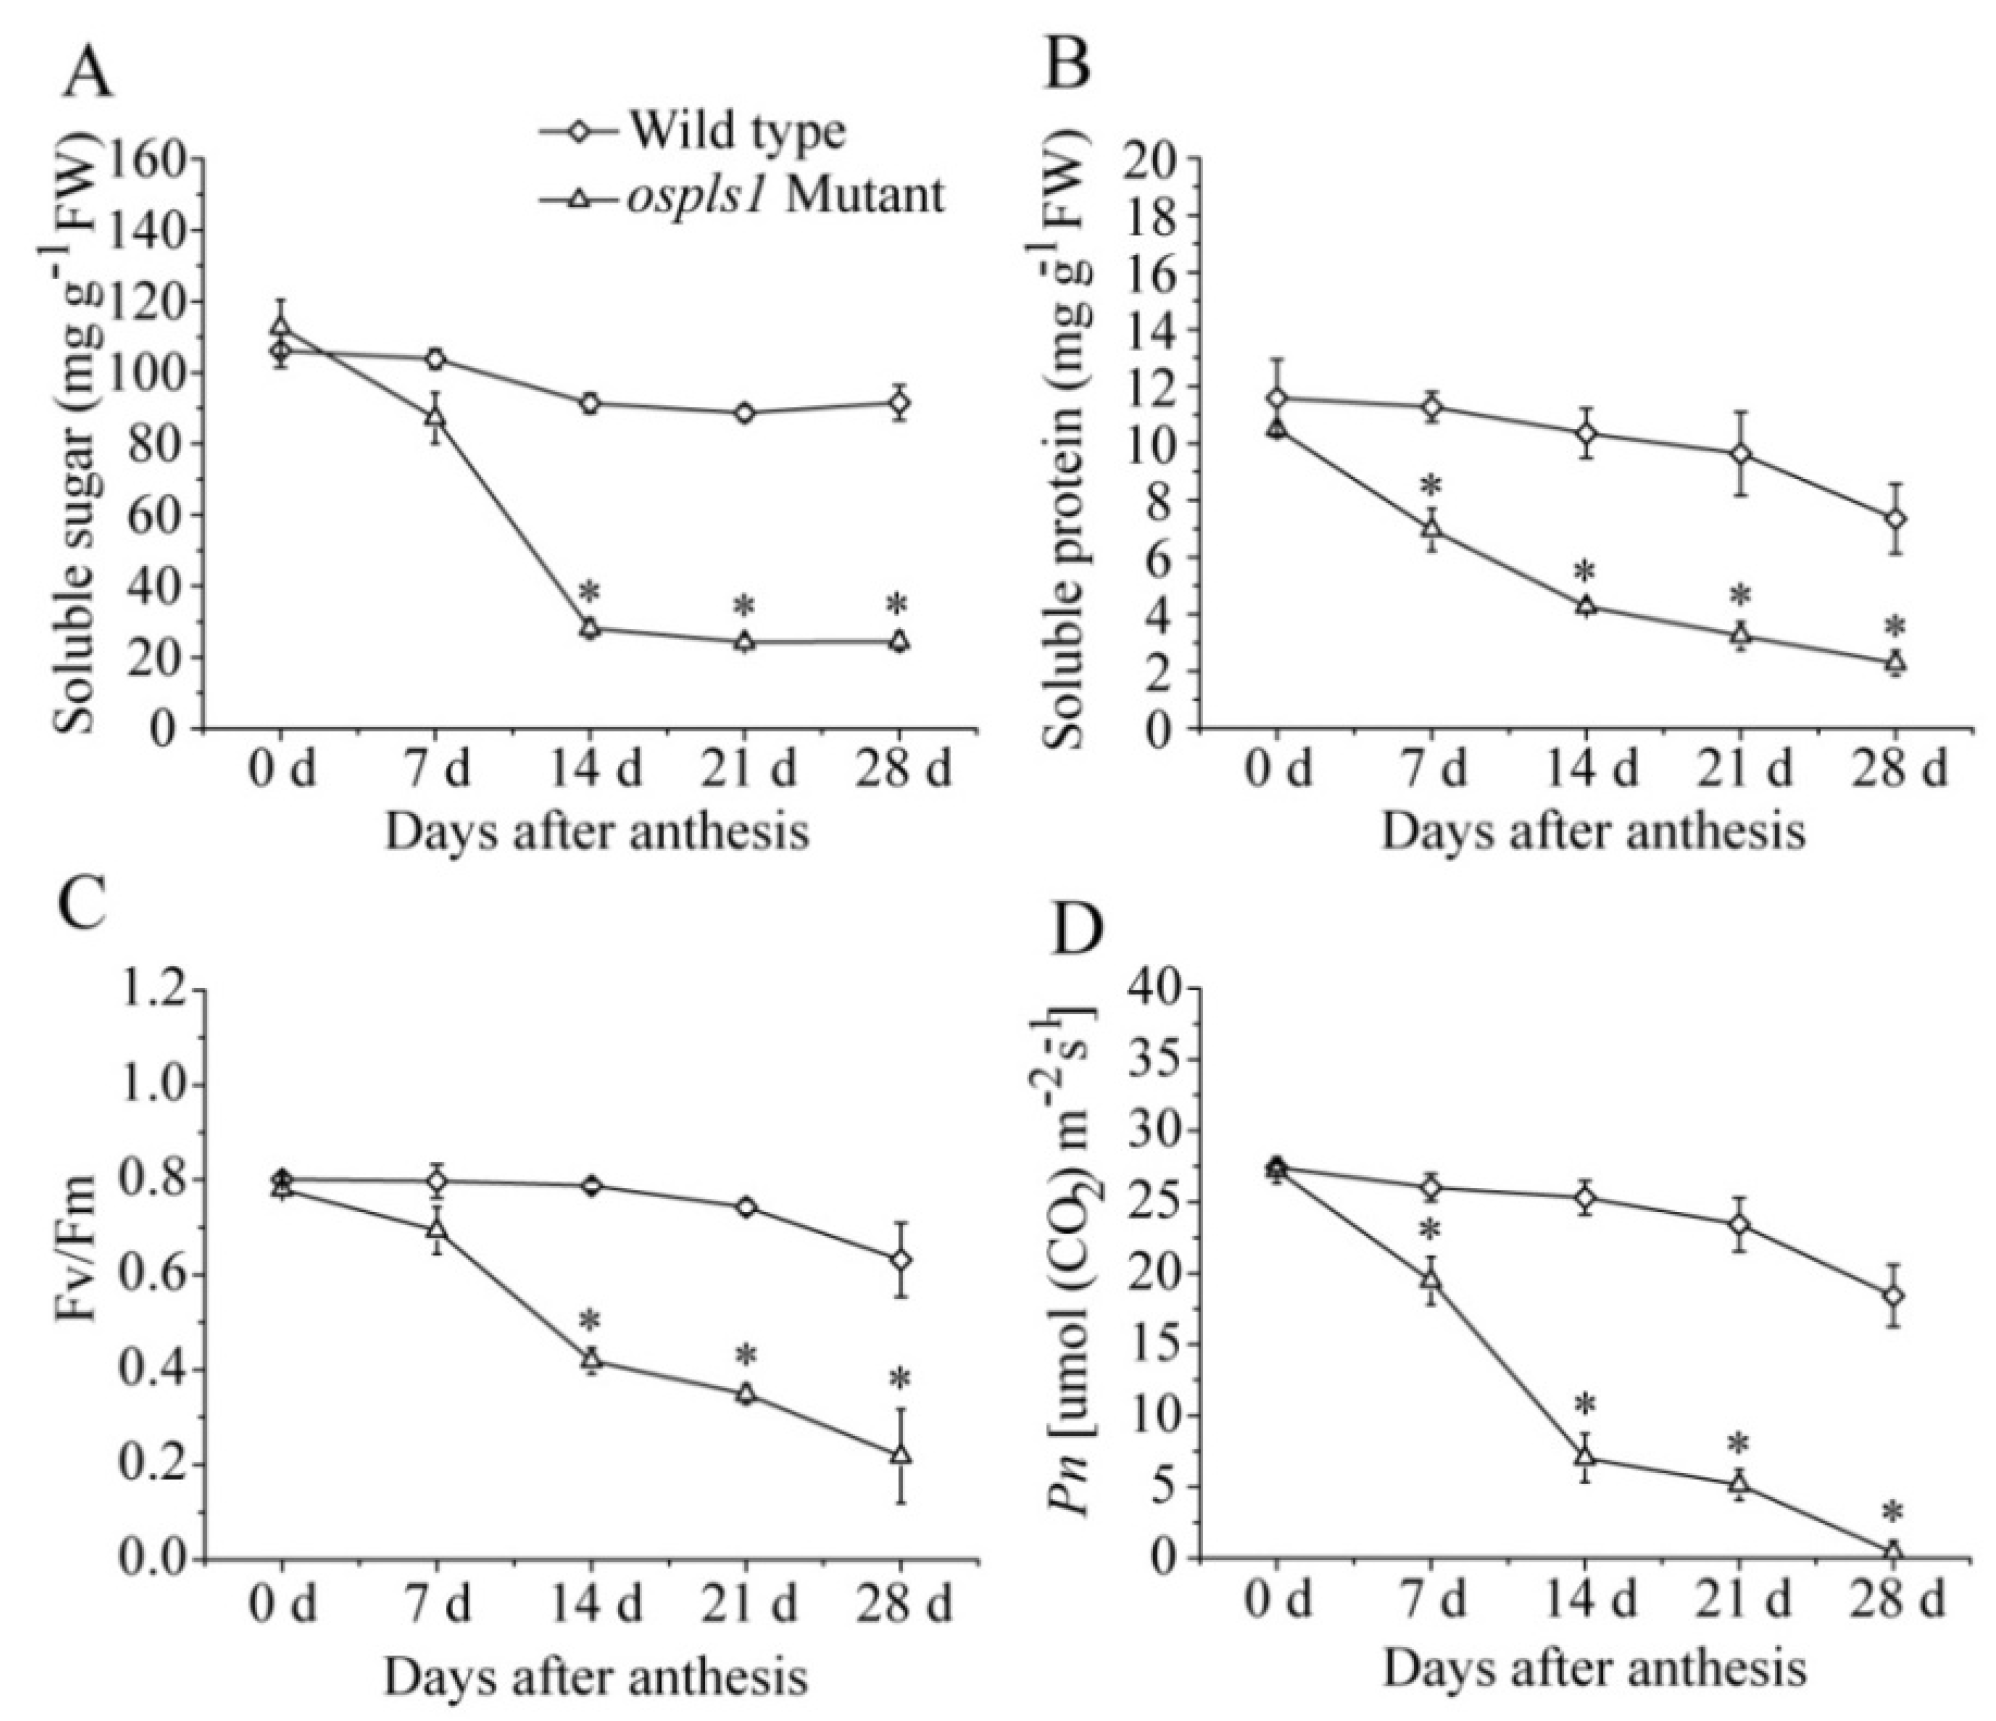
In this study, soluble sugar, soluble protein, maximal quantum yield of PSII photochemistry (Fv/Fm), and net photosynthesis rate (Pn) were determined to compare the senescence-associated changes in the flag leaves of the two rice genotypes during the grain-filling stage. As shown in Figure 2, the ospls1 mutant showed a rapid decrease in the soluble sugar and protein at the initial stage of grain filling and reached minimum levels on day 14 of grain filling. This phenomenon was not observed in the wild type, which presented relatively stable soluble sugar levels and a slight decrease in soluble protein during the grain-filling stage (Figure 2A,B). In addition, Fv/Fm and Pn in the leaves of ospls1 mutant also sharply decreased and were significantly lower than those in the wild type over the entire grain-filling stage (Figure 2C,D), suggesting a weak light-harvesting and photosynthetic ability for ospls1 mutant rice.

2.2. Differential Expressions of OsVHA-A and V-H+-ATPase Activities in ospls1 Mutant and Wild Type

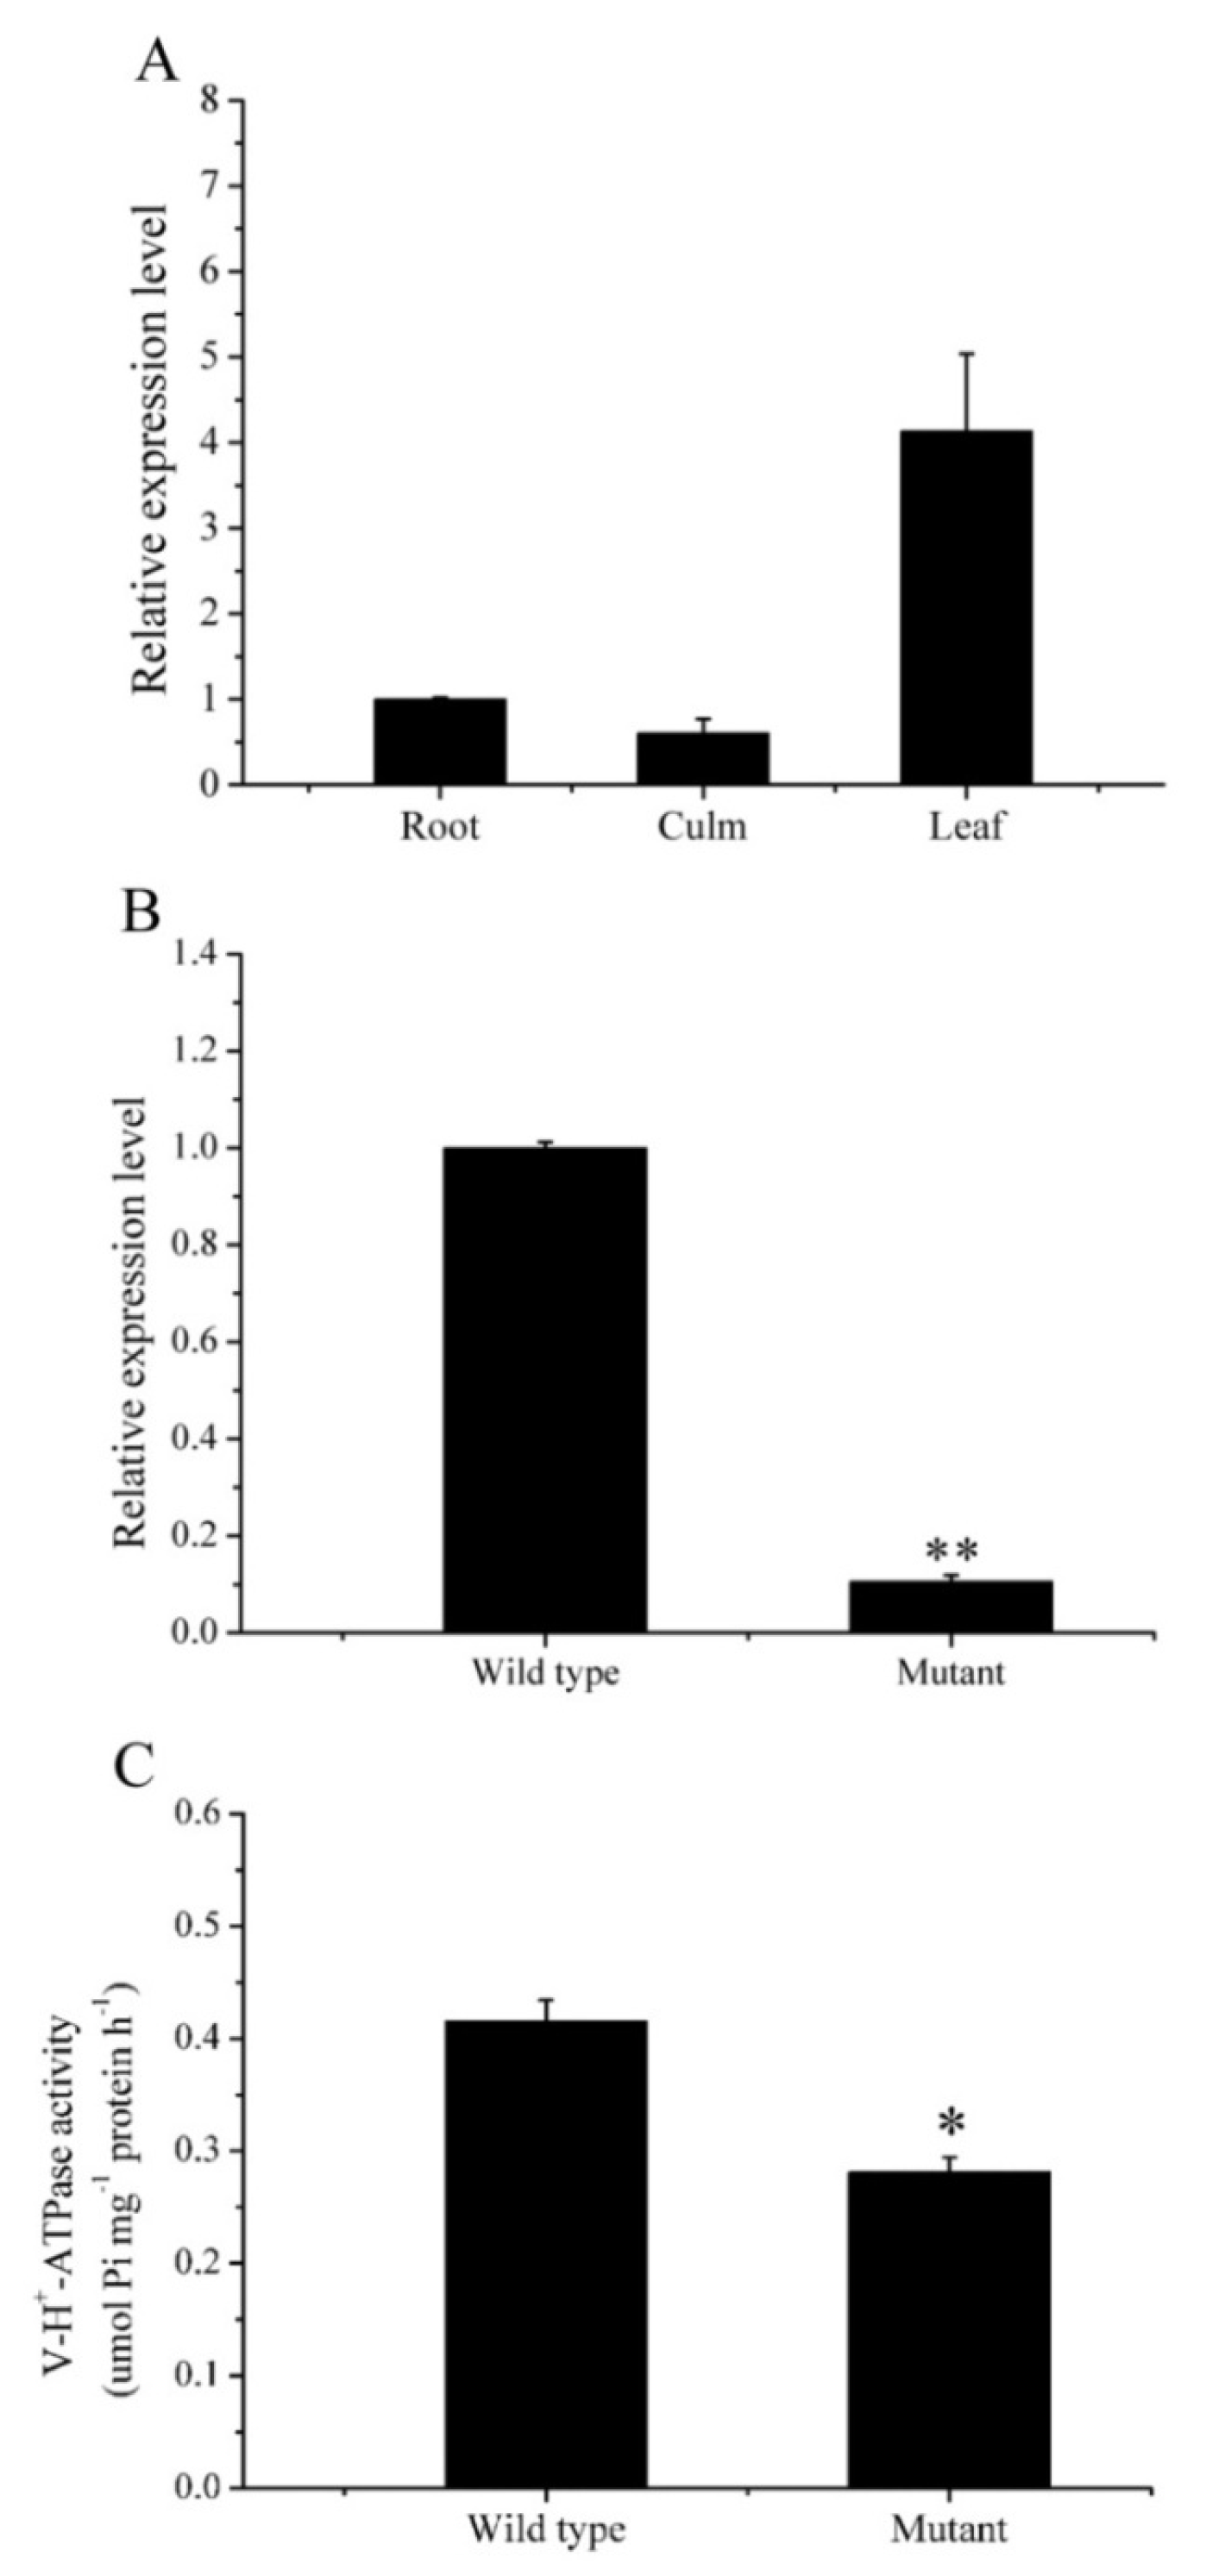
As shown in Figure 3, the expression patterns of OsVHA-A were remarkably dependent on tissues and genotypes. OsVHA-A was expressed in the leaf blade of rice, rather than the root or culm (Figure 3A). By contrast, the ospls1 mutant showed extremely low expression levels of OsVHA-A in flag leaves than the wild type, which held a large number of OsVHA-A transcripts in the same tissue (Figure 3B). As expected, V-H+-ATPase activity in flag leaves of ospls1 mutant was significantly lower than that in wild type (Figure 3C). These results suggested the deficiency in OsVHA-A transcript and decrease in V-H+-ATPase activity for ospls1 mutant rice.

2.3. Evaluation of RNA-Seq Reads and Mapping Results

To obtain an overview of the differences in transcriptome between ospls1 mutant and wild type, RNA was extracted individually from 12 flag leaf samples, and double-stranded cDNA was synthesized. After ligating adapter sequences, 12 ds-cDNA libraries were constructed by PCR reaction. The cDNA libraries of flag leaves were sequenced with three biological replicates using the Illumina deep-sequencing technique. A total of 45–62 million raw reads were generated from each cDNA library. Clean reads were obtained after filtering out low-quantity sequences. Approximately 80% of clean reads were mapped to the reference genome, among which nearly 77% were mapped to unique locations (Table 2). Meanwhile, 89,988 genes were aligned for the tested samples, thus providing massive data for further analyses on expression profiling and metabolism pathways.

2.4. Identification of Differentially Expressed Genes (DEGs) and Confirmation of Tag-Mapped Genes by Quantitative Real-Time Polymerase Chain Reaction (qRT-PCR)

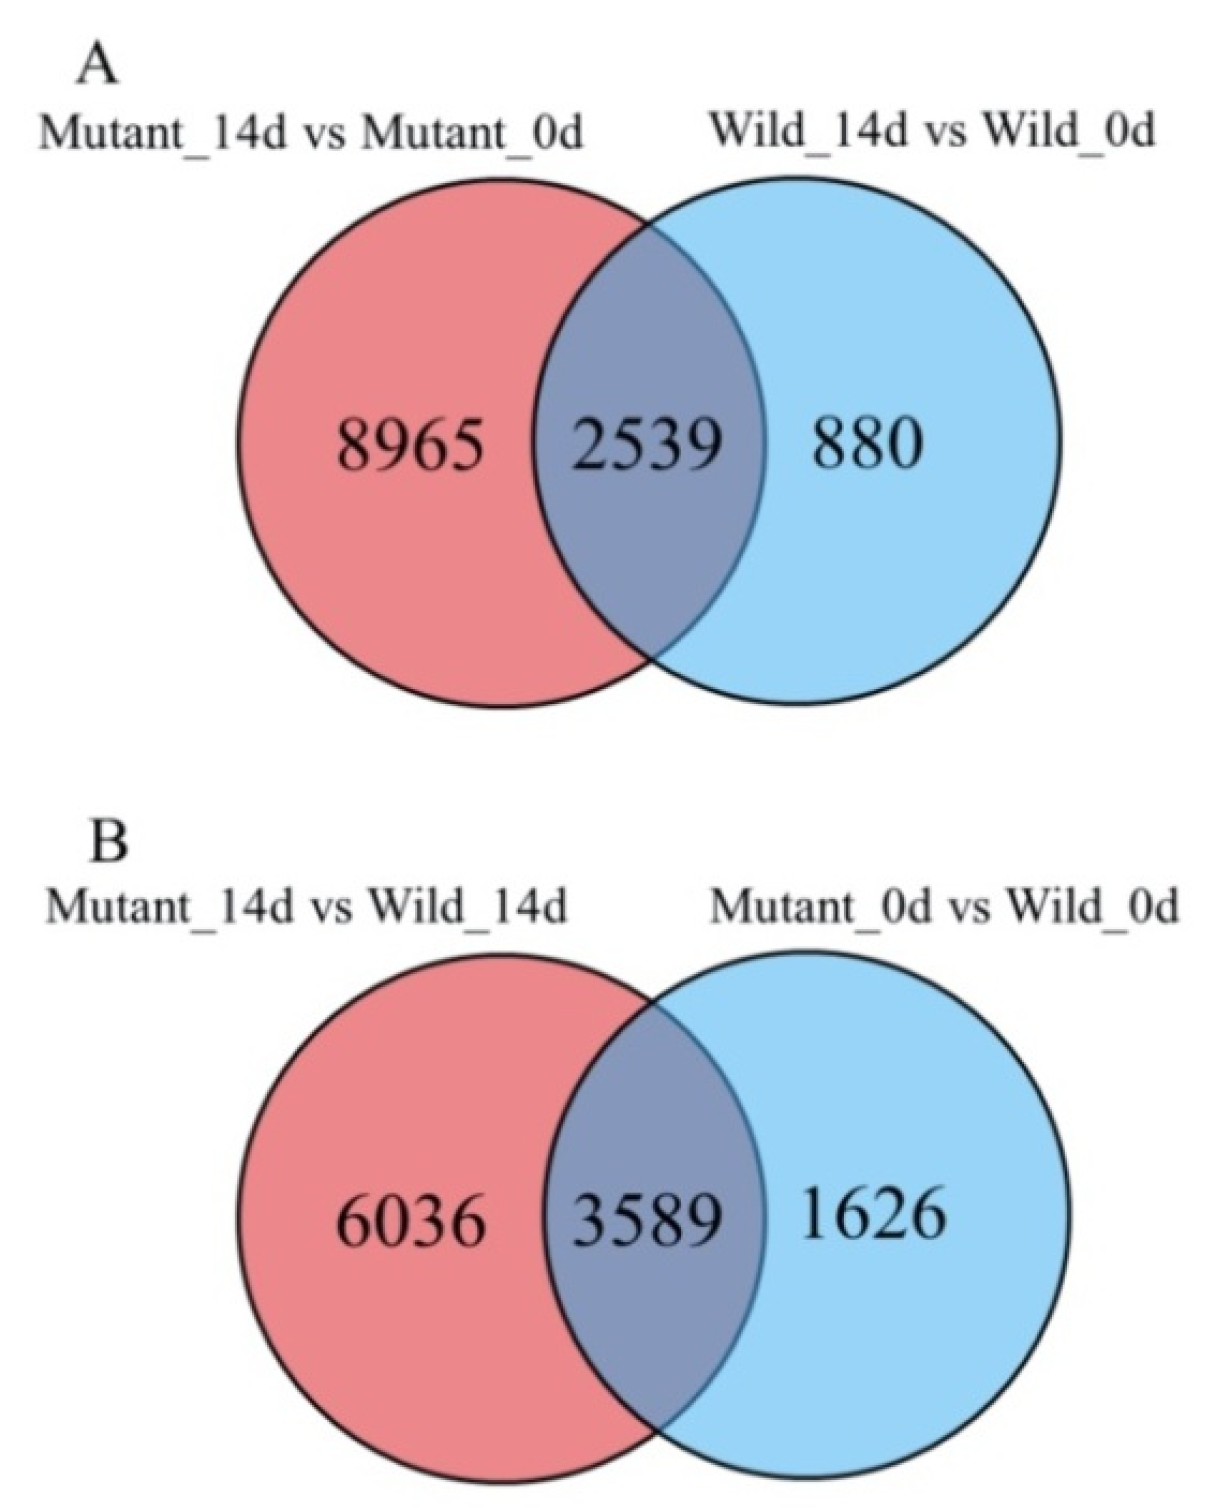
The fragments per kilobase of transcript sequence per million base pairs sequenced (FPKM) method was employed to normalize gene expression counts for the sequence. The DEGs were identified using the DESeq software package, according to padj < 0.05. As shown in Table 3, 11,504, 3419, 5215, and 9625 DEGs were identified in mutants between 0 day and 14 days, wild type between 0 day and 14 days, wild type and mutant at 0 day, and wild type and mutant at 14 days, respectively. The greatest expression differences were found in mutant between 0 day and 14 days, indicating that the ospls1 mutant held more SAGs during the senescing stage. Among them, 5312 DEGs were found to be upregulated, and 6192 DEGs were downregulated. The smallest expression differences were found in wild type between 0 day and 14 days, and 1636 DEGs were upregulated, whereas 1783 DEGs were downregulated. By contrast, 9845 unique and 2539 common DEGs were identified by comparing the two libraries, including 8965 unique DEGs from mutant between 0 day and 14 days and 880 unique DEGs from wild type between 0 day and 14 days (Figure 4A). In terms of genotypes, a total of 5215 and 9625 DEGs were identified between mutant and wild type at 0 day and 14 days, including 3093 upregulated genes and 2122 downregulated genes in mutant and wild type at 0 day, and nearly equal proportion between up and downregulated genes in two genotypes at 14 days (Table 3). In addition, 1626 and 6036 unique DEGs were identified in mutant and wild type at 0 day and 14 days, whereas 3589 DEGs were overlapped between the two libraries (Figure 4B), suggesting that different subsets of genes underlying different response mechanisms were affected in the flag leaves of ospls1 mutant and wild type during the grain-filling stage.
To validate the results of RNA-seq data, a subset of 15 DEGs was randomly selected for qRT-PCR analysis. The gene ID and description of DEGs are listed in Supplementary Table S1. As shown in Supplementary Figure S1, the expression profiles of qRT-PCR were highly consistent with the results of RNA-Seq analysis, indicating that the DEG-based technique for counting transcripts gave an accurate reflection of transcript abundance and could be employed in gene expression analysis related to the pathways of early leaf senescence in the ospls1 mutant.

2.5. DEGs Significantly Enriched in Metabolic Pathways for the Two Rice Genotypes

All DEGs of the two rice genotypes were analyzed through Kyoto Encyclopedia of Genes and Genomes (KEGG) Orthology Based Annotation System (KOBAS) to identify the metabolic pathways in which they function. For ospls1 mutant, 2349 downregulated and 2478 upregulated genes were mapped to 117 KEGG pathways (Supplementary Table S2). Among them, three metabolic pathways were significantly downregulated (corrected p-value < 0.05), whereas no pathway was significantly upregulated. By contrast, only 623 downregulated genes in the wild type were mapped to 99 KEGG pathways, and 768 upregulated genes were mapped to 96 KEGG pathways (Supplementary Table S3). Three of these pathways were significantly downregulated, and six metabolic pathways were significantly upregulated (corrected p-value < 0.05) during the grain-filling stage (Table 4). These typical senescence symptoms, such as carbon fixation in photosynthetic organisms and photosynthesis, were significantly overrepresented for ospls1 mutant in the downregulated pathways, whereas those were not observed for wild type. For the ospls1 mutant, a total of 278 downregulated genes were significantly enriched in the biosynthesis of secondary metabolites; however, for the wild type, only 82 downregulated and 95 upregulated genes were enriched. In addition, two pathways of nitrogen metabolism and carotenoid biosynthesis were significantly enriched in the downregulated genes for wild type. Moreover, certain protective activity pathways were obviously activated in the wild type, such as plant-pathogen interaction, fatty acid degradation, flavonoid biosynthesis, and alpha-linolenic acid metabolism. Meanwhile, amino sugar and nucleotide sugar metabolism was significantly enriched in the unregulated genes for the wild type. These results indicated that distinguishing pathways were involved in the differential leaf development processes of the two rice genotypes during the grain-filling stage.

2.6. Transcription Factor (TF) Families in the DEGs of the Two Genotypes

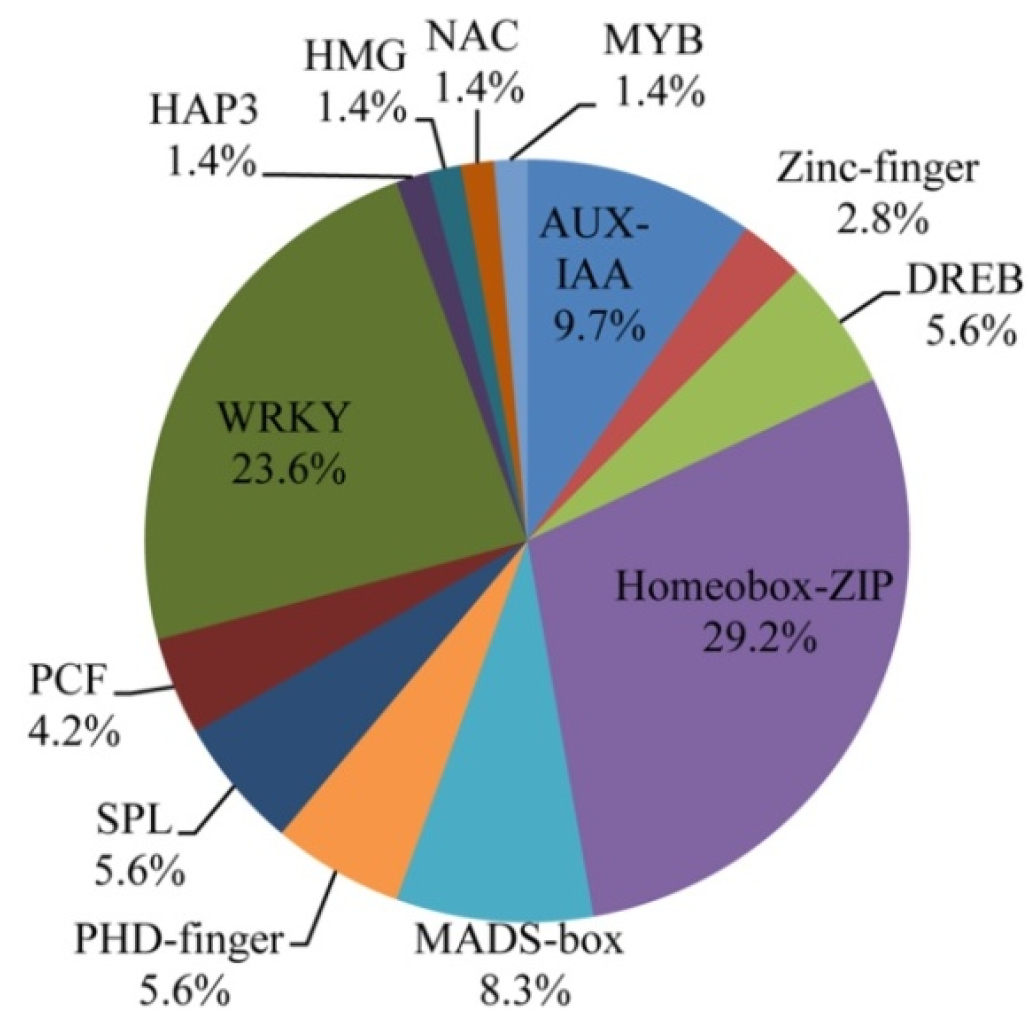
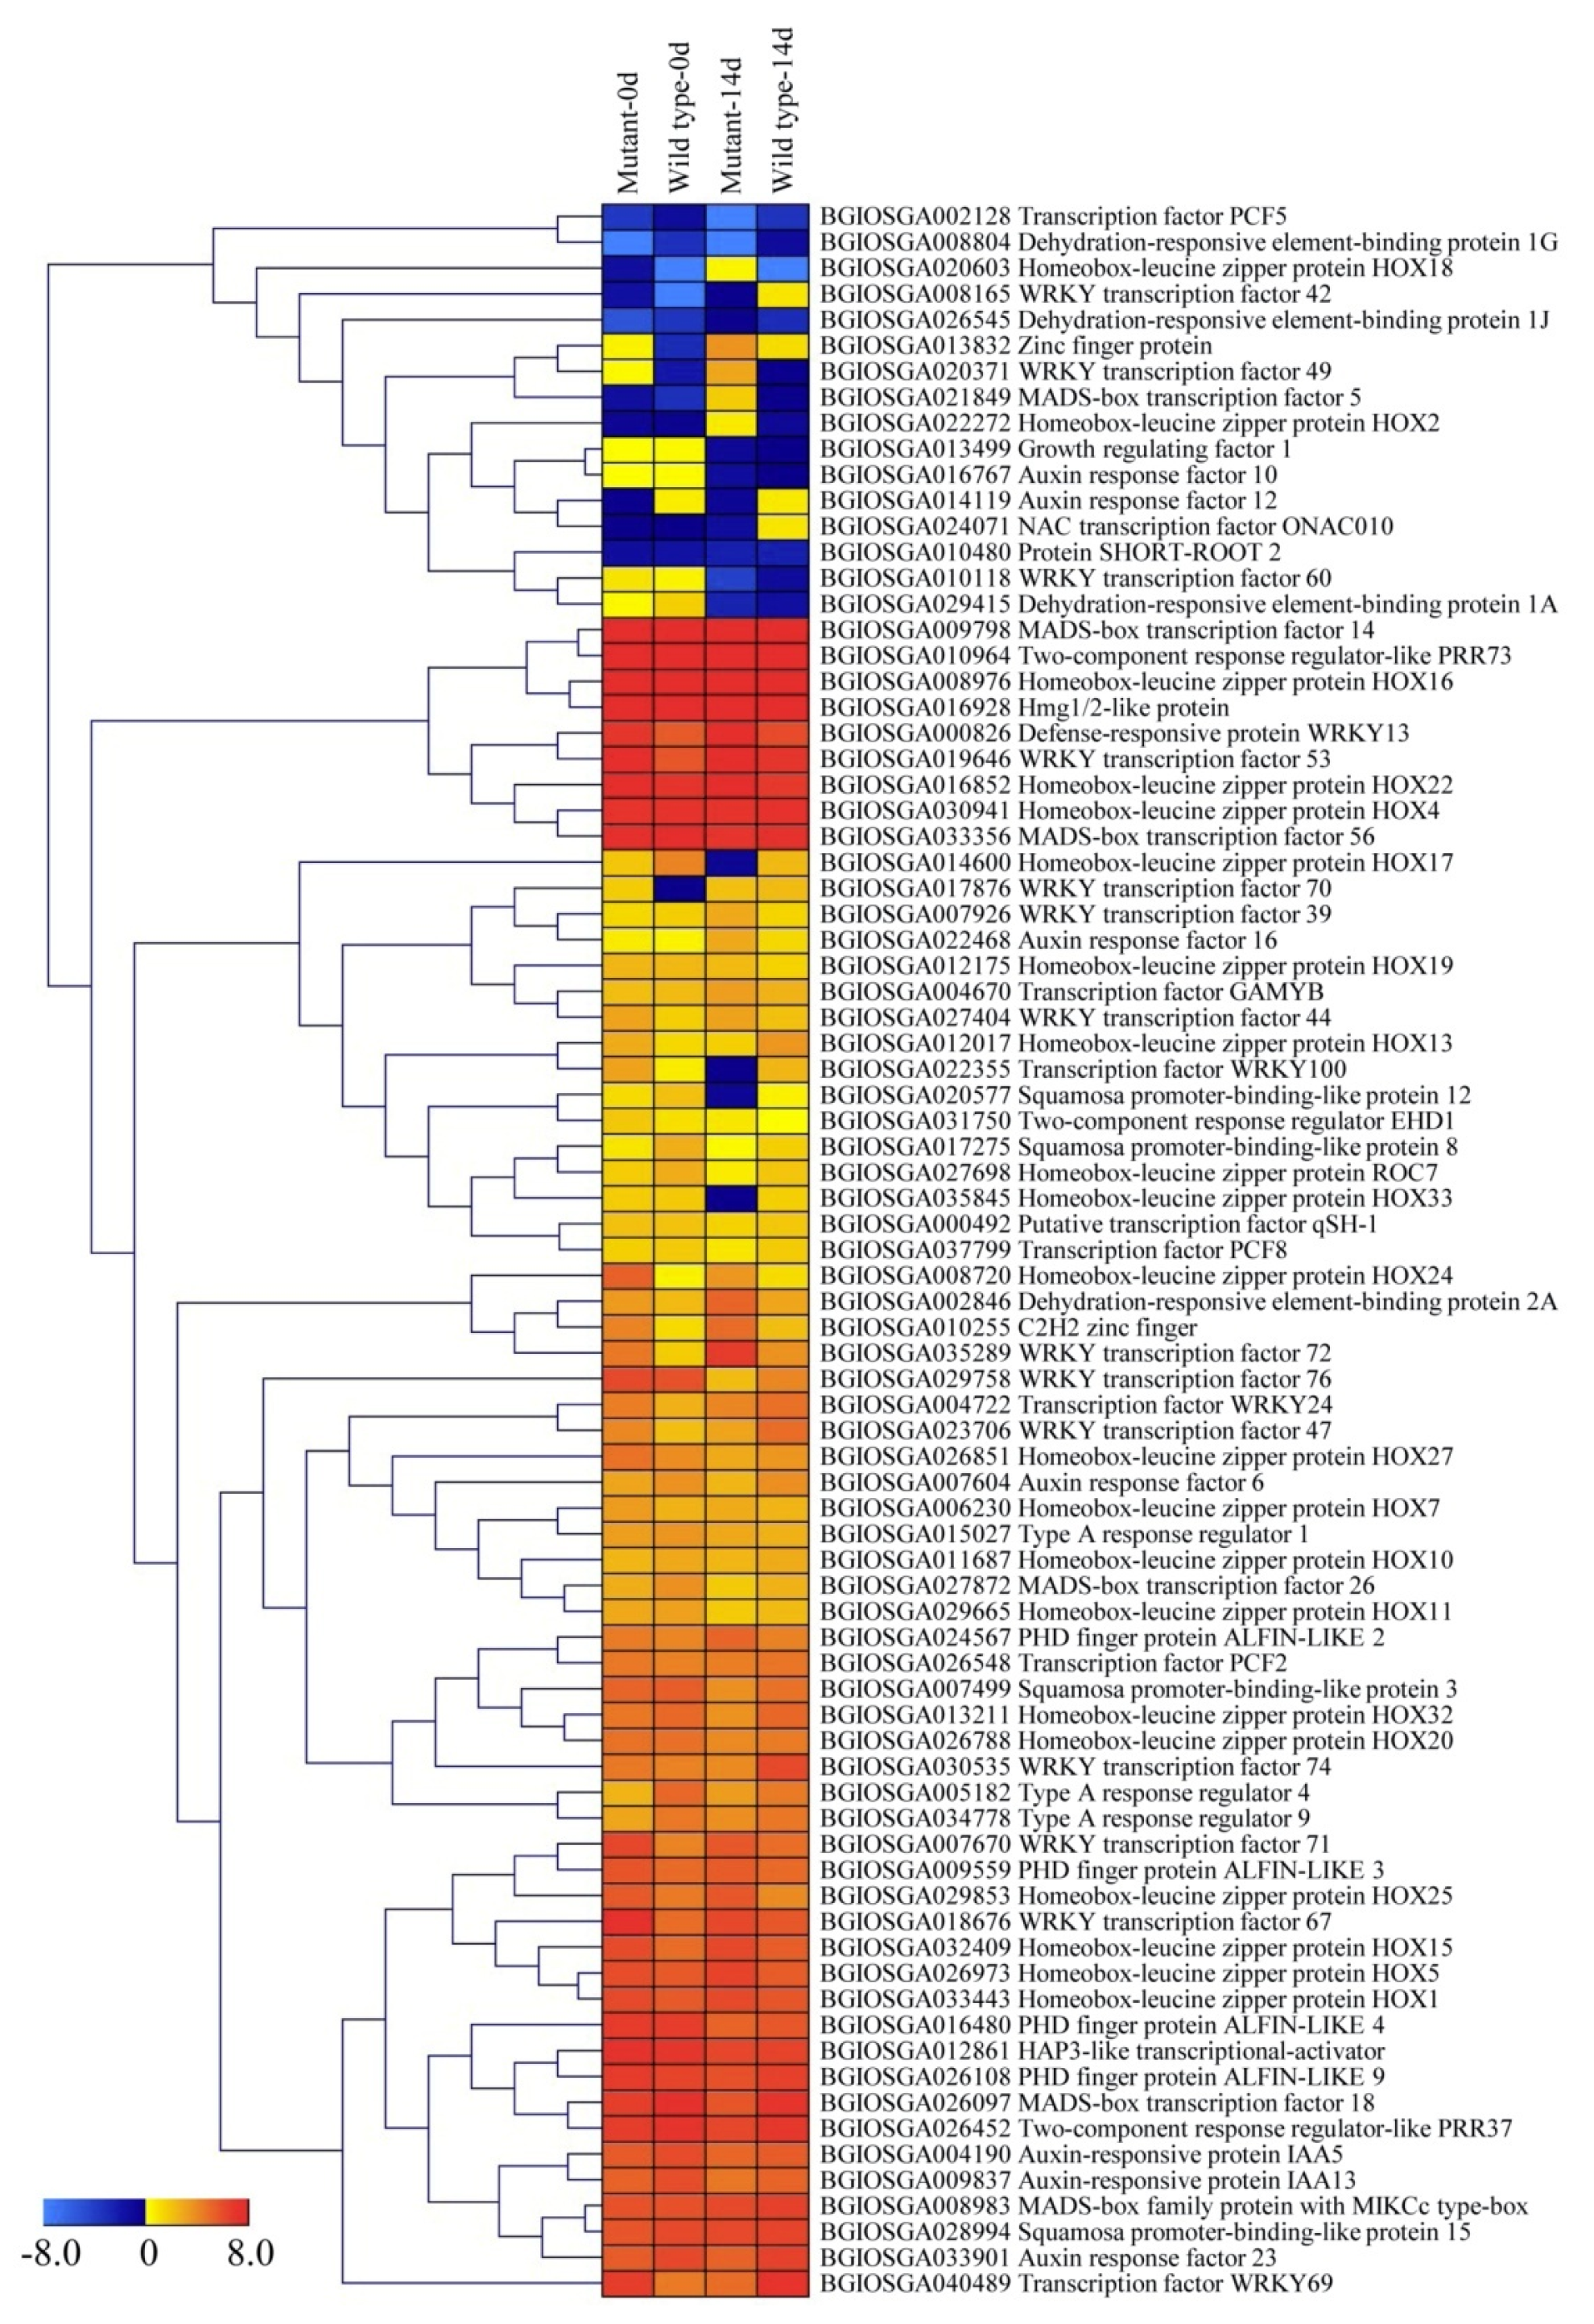
In this study, 81 DEGs between 0 day and 14 days in these two genotypes were identified and characterized as TFs (Supplementary Table S4). They were clustered into 13 gene families: Homeobox-ZIP, WRKY, AUX-IAA, NAC, HMG, HAP3, PCF, SPL, PHD-finger, MADS-box, DREB, Zinc-finger, and MYB (Figure 5). The most highly represented family was Homeobox-ZIP (29.2%). The majority of Homeobox-ZIP genes had significantly high transcript abundance in the leaves of the two genotypes, such as homeobox-leucine zipper protein HOX1, HOX4, HOX5, HOX7, HOX10, HOX11, HOX15, HOX16, HOX20, HOX22, HOX27, and HOX32 (Figure 6). Another significantly represented family was WRKY, around 23.6% of the TFs (Figure 5). The WRKY TFs 24, 39, 44, 53, 67, 70, 71, 72, 74, and 76 showed steadily high transcript abundance in the two genotypes, whereas WRKY TFs 42, 49, and 70 were among those differentially expressed in the ospls1 mutant and wild type (Figure 6). In addition, approximately 9.7% of TFs belonged to the AUX-IAA family (Figure 5). Among them, auxin response factor 10 was found mainly in the leaves of the two genotypes at the initial stage of grain filling, and auxin response factor 12 preferably expressed in the wild type, whereas the transcriptions of other AUX-IAA members showed no dependence on the genotypes (Figure 6). Around 8.3% of the differentially expressed TFs were from the MADS-box family. MADS-box TF 5 was majorly expressed in the mutant_14d sample. However, other MADS-box TFs were significantly expressed in the two genotypes (Figure 6). Moreover, differential transcriptions of some members of the NAC, SPL, and DREB families were detected in the data of the present study. MYB, HMG, PCF, HAP3, Zinc-finger, and PHD-finger TFs were differentially regulated in the leaves of the two rice genotypes during the grain-filling stage.

2.7. DEGs Related to ATPase in the Two Genotypes

In this study, seven DEGs between 0 day and 14 days in the ospls1 mutant were related to ATPase, whereas one DEG between 0 day and 14 days was detected in the wild type (Supplementary Table S5, Table 5). For the ospls1 mutant, three DEGs encoding ATP synthase, ATP synthase subunit b, and putative ATPase decreased their transcripts to 1.2–2.2 times on the 14th day of the grain-filling stage. By contrast, two DEGs encoding ATP synthase subunit beta showed a slight increase in transcripts. In addition, the expression levels of two DEGs controlling V-type proton ATPase subunit F were increased in the ospls1 mutant. However, only one DEG encoding ATP synthase subunit b showed a significant decrease in transcript for the wild type.

2.8. DEGs Associated with Hormone Signaling

Except DEGs encoding uncharacterized proteins, 11 hormone-related DEGs between 0 day and 14 days in the ospls1 mutant were identified, which were involved in the metabolisms of auxin/IAA, cytokinins (CTKs), BRs, and ABA in rice leaves (Supplementary Table S6, Table 6). All DEGs showed varying degrees of decreasing transcription abundance in the ospls1 mutant during leaf senescence, suggesting the weakened hormone signaling pathways in senescing leaves of the ospls1 mutant. Particularly, the expression of brassinazole-resistant 1 homolog 1 (BZR1) decreased to nearly 3.3 times in the ospls1 mutant on the 14th day of the grain-filling stage. However, for the wild type, the DEGs associated with the BR signaling pathway did not show changes in their transcripts. Moreover, two DEGs encoding probable indole-3-acetic acid-amido synthetase GH3.8 and putative ABA-induced protein were also not detected to be differentially expressed in the leaves of the wild type during the grain-filling stage.

2.9. DEGs Are Involved in the Antioxidative Metabolism and Cyanide-Resistant Respiration

Some DEGs related to antioxidative metabolism and cyanide-resistant respiration were identified between 0 day and 14 days in the ospls1 mutant, which were critical for the regulation of eliminating ROS accumulation and alleviating cellular damages during the leaf senescence process. For antioxidative metabolism, eight DEGs showed decreases in the transcripts, whereas five DEGs displayed slight increases in the transcripts for the ospls1 mutant (Supplementary Table S7, Table 7), suggesting the deficiencies of transcripts of genes associated with ROS elimination. However, most of the antioxidative genes in the wild type did not significantly change their expression abundances, and only two genes showed slightly decreased expressions. In the wild type, the transcription of a DEG encoding catalase isozyme A (CatA) increased by nearly 4.17 times. For cyanide-resistant respiration, three DEGs encoding alternative oxidase in the ospls1 mutant displayed significantly differential expressions, indicating their responses to cellular oxidative stress.

2.10. DEGs Associated with the Regulation of Carbohydrate Metabolism in the ospls1 Mutant

Carbohydrates play important roles in plant development of rice during the grain-filling stage because of their major contribution to grain yield. In this study, we investigated the DEGs associated with carbohydrate metabolism in the two genotypes during the grain-filling stage. As shown in Supplementary Table S8 and Table 8, a total of 16 DEGs related to hexose metabolism were differentially expressed between 0 day and 14 days in the ospls1 mutant; 11 of them displayed significantly decreased transcriptions, reducing to nearly 0.61 to 2.55 times, and mainly encoded for fructose-1,6-bisphosphatase, fructose-bisphosphate aldolase, glucose-1-phosphate adenylyltransferase, and glucose-6-phosphate 1-dehydrogenase. Only five DEGs showed slightly increasing transcriptions during the leaf senescence stage. The results suggested that the hexose signaling and transformation between monosaccharides, disaccharides, and polysaccharides gradually decreased in the senescing leaves of the ospls1 mutant. By contrast, eight DEGs between 0 day and 14 days in the ospls1 mutant were involved in sucrose metabolism. Among them, five DEGs encoding trehalose-6-phosphate synthase isoforms and sucrose synthase significantly improved their transcripts to 1.56 to 2.47 times, and three showed slightly reducing expressions in the ospls1 mutant. However, for the wild type, only one DEG encoding sucrose synthase was found to enhance its expression level. For starch metabolism, 10 DEGs between 0 day and 14 days in the ospls1 mutant were found. Among them, seven significantly reduced their expressions on the 14th day of the grain-filling stage, whereas three showed slightly promoted expressions. Notably, the transcriptions of four DEGs encoding UDP-glucose 6-dehydrogenase, soluble starch synthase 1, soluble starch synthase II-2, and phosphorylase decreased by approximately two times as those in the initial stage of grain filling. These results suggested that the physiologic function of starch synthesis for ospls1 mutant was evidently impaired in the senescing leaves during the grain-filing stage.

2.11. DEGs Involved in the Hydrolysis and Autophagy in Senescing Leaves

Autophagy-related protein and proteasome are major responding proteins during plant cell senescence. In this study, four DEGs encoding autophagy-related proteins, including autophagy-related protein 3, 8A, 8B, and 8C, were detected to significantly promote their transcripts in the leaf of the ospls1 mutant during the grain-filling stage. In addition, 11 DEGs dominating proteasome subunits, mainly proteasome subunit alpha and beta, were found to enhance their expression levels in the ospls1 mutant during leaf senescence (Supplementary Table S9, Table 9). These results suggested that autophagy-related proteins and proteasomes probably play indispensable regulatory roles in macromolecular hydrolysis and cell apoptosis during early leaf senescence in the ospls1 mutant. Compared with those in the ospls1 mutant, the DEGs in the wild type corresponding to autophagy-related proteins and proteasome subunits did not display significantly differential expressions during the grain-filling stage.

3. Discussion

3.1. Deficiency of OsVHA-A Expression Led to Early Leaf Senescence in the ospls1 Mutant during the Grain-Filling Stage

V-H+-ATPase belongs to the highly evolutionarily conserved protein complex and is anchored in the intracellular endomembrane system of tissues. The protein encoded by OsVHA-A is considered to be one of the most important components of V-H+-ATPase in plants [21]. Several studies have been performed to determine its diverse functions in the developmental processes and stress response. For example, VHA-A has been found to be involved in pollen fertility of Arabidopsis [21], regulation of stomatal movement in leaf cells of rice under salt stress and osmotic stress conditions [22], and enhanced leaf senescence and seed dormancy in rice [24]. In this study, the ospls1 mutant exhibited significant decreases in OsVHA-A transcripts and V-H+-ATPase activity (Figure 3B,C) and striking decreases in soluble sugar and proteins in flag leaves around the 14th day of the grain-filling stage (Figure 2A,B). In a previous study, we discovered that ospls1 mutant showed a significant decrease in chlorophyll content and apparent increases in MDA level and relative conductivity for flag leaves compared with wild type during the grain-filling stage [25]. Meanwhile, the ospls1 mutant plant showed sharp decreases in Fv/Fm and Pn after the 14th day of grain filling (Figure 2C,D), followed by a rapid increase of lesion mimics and appearance of early leaf senescence during the same period (Figure 1B). The chlorophyll content, membrane ion leakage, and soluble sugar and proteins are used as senescence markers [1]. Therefore, these above results of the ospls1 mutant indicate obvious physiological characteristics of early leaf senescence and suggest a negative correlation between the OsVHA-A expressions and properties of leaf senescence. In other words, less expression of OsVHA-A in the ospls1 mutant inevitably resulted in lower V-H+-ATPase activity in flag leaves compared with that in the wild type, which was probably a principal cause of early leaf senescence in the ospls1 mutant. Yang et al. [24] asserted that numerous transcripts of OsVHA-A or high V-H+-ATPase activity is required for delaying leaf senescence in rice, which provided evidence to support our conclusion in the opposite way. Moreover, the significant decreases in available panicles per plant and seed-setting rate were observed in the ospls1 mutant, which were probably ascribed to the reduced carbohydrate translocation from source leaves owing to early senescence, subsequently leading to marked decreases in 1000-grain weight, yield per plant, and harvest index (Table 1).

3.2. TFs Are Highly Enriched during Leaf Senescence

TFs are proteins that bind to the cis-regulatory DNA elements in the promoter of genes to activate or repress their expressions [26]. Previous studies have proved the crucial role of TFs in plant leaf senescence [27]. In the present study, 81 DEGs between 0 day and 14 days in the two genotypes were found to encode TFs (Supplementary Table S4, Figure 6). Among these TFs, the top two TF families identified were Homeobox-ZIP and WRKY, followed by the AUX-IAA and MADS-box families. Homeobox-ZIP TFs have been found to participate in ET and ABA biosynthesis during senescence by interacting with aminocyclopropane-1-carboxylate oxidase gene [28,29]. WRKY TFs have been shown to be involved in the crosstalk between the SA and jasmonic acid (JA) signaling pathways and play a central role in mediating negative crosstalk between pathogen resistance and leaf senescence by functioning in the defense signaling pathways of mitogen-activated protein kinases [30,31]. MADS-box genes have been identified to play important biological roles in flower and vegetative tissue development, senescence, and seed dormancy, such as SlCMB1 in tomato, which interacts with ripening-related genes (SIMADS-RIN, SIMADS1, SIAP2a, and TAGL1) to regulate ET production and carotenoid accumulation during tissue ripening and senescence [32]. AUX-IAA TFs function as transcriptional activators that dominate gene expression in auxin signaling transduction to mediate auxin homeostasis, subsequently affecting the process of leaf senescence in a precise manner in the downstream of the pathway [33,34]. In the present study, WRKY TFs 42, 49, and 70 and MADS-box TF 5 were detected to be specifically enriched in senescing leaves, thereby suggesting that these TFs are probably involved in the process of leaf senescence. Furthermore, the transcriptions of many WRKY genes were induced by H2O2, supporting the involvement of WRKY TFs in leaf senescence [35]. However, it is also considered a striking functional overlap with the senescence-associated TFs [36], and the present study has provided fundamental clues on TF involvement in the regulation of senescence; further functional studies of senescence-associated TFs are thus imperative.

3.3. Regulation of Antioxidative System during Early Leaf Senescence

ROS and the antioxidative system play important regulatory roles in tissue development, senescence, and stress response in plants. Under normal conditions, the production and elimination of ROS in plant cell compartments are in balance in virtue of the activation of antioxidant enzymes, including superoxide dismutase, catalases, peroxidases, and thioredoxin reductase (TRC). However, abiotic or biotic stresses often cause a serious imbalance in any cell compartment because of increasing ROS generation or decreasing antioxidative capacity [37]. Leaf senescence is accompanied by the accumulation of ROS in deteriorating tissues; meanwhile, a loss in activities of antioxidant enzymes occurs during the progression of senescence [38]. The increasing ROS accumulation in turn results in enhanced leaf senescence [25]. In the present study, 16 DEGs encoding antioxidant enzymes committed to ROS levels were significantly enriched (Table 7). Among them, six DEGs encoded SOD, which catalyze the dismutation of O2 to H2O2. Among these six SOD genes, four DEGs significantly reduced their expression in the ospls1 mutant, and the other two DEGs slightly enhanced their transcriptions, suggesting the weakened elimination capacity for O2 through dismutation reaction in ospls1 mutant, which led to the accumulation of O2 in ospls1 mutant leaves [39]. Moreover, three DEGs encoded catalase isozymes, which convert H2O2 to water and molecular oxygen. The expression levels of DEGs for CatA and CatB were significantly enhanced in the ospls1 mutant. Our previous study revealed that the expression levels of CatA and CatB were promoted by H2O2 in senescing leaves, which were conducive to alleviate oxidative damages to leaf cells in the early stage of senescence [25]. By contrast, four decreased transcripts of DEGs identified in the ospls1 mutant were involved in the thioredoxin (Trx) system, in which TRC is the unique enzyme known to catalyze the reduction of Trx. Together with Trx and NADPH, the Trx system can form reduced disulfide bonds and plays an important role in defense against oxidative damage due to oxygen metabolism in plant cells [40]. Carrillo et al. [41] found that the decrease in ATP synthase activity in Arabidopsis mutants lacking TRC led to a buildup of the proton motive force with subsequent activation of non-photochemical quenching and downregulation of linear electron flow and concluded that TRC provides redox modulation at light stress using the relatively oxidizing substrate NADPH. Therefore, decreased OsVHA-A transcripts and V-H+-ATPase (Figure 3) in the ospls1 mutant were probably involved in the weakened redox modulation through depressing TRC transcription. Meanwhile, the increasing transcriptions of DEGs encoding alternative oxidative (Table 7) in ospls1 mutant probably contributed to an increased respiration rate and consume excessive electron flow, which perhaps exacerbated the intracellular stresses and in turn aggravated leaf senescence. Moreover, the enhanced cyanide-resistant respiration dominated by an alternative oxidative exacerbated macromolecular hydrolysis and organelle apoptosis in the senescing leaf tissues was confirmed by the results of increased expressions of 15 DEGs encoding proteasome subunits and autophagy-related proteins in the present study (Table 9).

3.4. Involvement of Hormone Signals during Early Leaf Senescence

Plant hormones have been thought to play crucial regulatory roles in either delaying or promoting leaf senescence; for instance, auxin and CTKs are approved to delay leaf senescence, whereas ABA, ET, and BRs are thought to accelerate leaf senescence [42,43]. In this study, 11 downregulated DEGs between 0 day and 14 days were enriched in hormone signaling pathways during leaf senescence of the ospls1 mutant, which were involved in the regulation of auxin, CTKs, BRs, and ABA (Table 6). As an important stress hormone, ABA plays versatile functions in the regulation of environmental stresses and tissue development [44]. In plants, ABA levels are the result of a balance between biosynthesis and catabolism [45]. Zeaxanthin epoxidase, which converts zeaxanthin into violaxanthin, has been shown to play an important role in ABA biosynthesis, whereas ABA 8′-hydroxylase is the key enzyme involved in the oxidative degradation of ABA [45,46]. In Arabidopsis, the genes associated with ABA biosynthesis were downregulated during senescence, and many genes involved in ABA catabolism were significantly upregulated [47]. In this study, one DEG encoding zeaxanthin epoxidase decreased its transcript to around 0.63 times in the senescing leaves of the ospls1 mutant (Table 6), indicating the existence of slightly weakened ABA biosynthesis in senescing leaves. By contrast, two DEGs encoding for ABA 8′-hydroxylase 2 and ABA 8′-hydroxylase 3 showed decreasing transcripts by nearly 1.4 and 1.1 times (Table 6), thereby implying the severely impaired catabolism of ABA, which was probably one reason why excess ABA accumulated in the senescing leaves [39]. In addition, a key ABA signal transduction-related DEG encoding ABA-induced protein was enriched in senescing leaves, which suggested that ABA signaling transduction is activated during leaf senescence. Therefore, ABA is regarded as a hormonal trigger or accelerator of leaf senescence by promoting ABA levels and enhancing ABA signaling transduction [36].
BRs are a group of important hormones that play pivotal roles in a variety of plant growth and developmental processes, including leaf senescence. The BR signaling pathway plays a central role in the involvement of BRs on leaf senescence [48]. In this study, two DEGs encoding BR insensitive 1 (BRI1) kinase inhibitor 1 (BKI1) and BZR1 were enriched in the BR signaling pathway, which showed significantly decreasing transcripts by nearly 1.47 and 3.31 times in senescing leaves of ospls1 mutant (Table 6). BKI1 functions as a negative regulator of BRI1. In the presence of BRs, BKI1 phosphorylated by BRI1 delocalizes from the plasma membrane into the cytoplasm. The plasma membrane-dissociated and phosphorylated BKI1 plays positive roles in the BR signaling pathway. BZR1 performs an indispensable function in response to BRs through ATP-dependent phosphorylation or dephosphorylation catalyzed by protein phosphatase [49]. However, the decreasing transcripts associated with ATPase were observed in senescing leaves of the ospls1 mutant (Table 5), which suggested that ATP synthesis catalyzed by ATPase was prevented in the ospls1 mutant, thereby probably resulting in the deficiency of ATP for ATP-dependent phosphorylation or dephosphorylation during leaf senescence. Moreover, previous studies have reported that BR biosynthesis and central transmitters of the BR signaling pathway from the receptors to the target genes did not increase during leaf senescence [36]. Therefore, the depressed expressions of BKI1 and BZR1 in senescing leaves probably severely counteracted the BR signaling pathway in ospls1 mutant because of its low V-H+-ATPase activity in the intracellular membrane of various organelles. However, the relationships between the BR signaling pathway and V-H+-ATPase remain to be investigated.
Auxin and CTKs play critical regulatory roles in delaying leaf senescence [43]. Previous studies have reported that indole acetic acid biosynthetic genes showed significant changes during age-dependent leaf senescence [36]. In this study, one DEG encoding indole-3-acetic acid-amido synthetase GH3.8 displayed a significant decline in transcript abundance during leaf senescence of the ospls1 mutant. The DEG encoding AUX1-like permease, which is one of the auxin efflux carrier components, showed significantly decreasing transcription. Moreover, two DEGs encoding auxin-responsive protein IAA5 and auxin-responsive protein IAA13 were involved in the auxin signal transduction and exhibited decreased expression levels during leaf senescence (Table 6). These results suggested that changes in auxin synthesis, signaling transduction, and transport are probably important in modulating leaf senescence. In addition, a few studies reported that CTKs and the CTK signaling pathway are involved in an earlier event during the senescence stage [50]. However, in our study, only one DEG encoding type A response regulator1 showed a slight decline in the transcript for the two rice genotypes, suggesting that CTKs and the corresponding signaling pathway perhaps are not involved in the regulation of early leaf senescence. This finding is in agreement with the conclusion on leaf senescence in cotton [36].

3.5. Relationship between Carbohydrates Translocation and Leaf Senescence

Rice yield mainly depends on assimilate translocation from source leaves to developing grains during the grain-filling stage [51]. An early occurrence of leaf senescence caused by intrinsic genetic factors or by adverse stresses results in a drop in photosynthesis and curtails the supply of photoassimilates from the leaves [7]. In this study, the decreases in Pn (Figure 2D) and soluble sugar (Figure 2A) were observed in the leaves of the ospls1 mutant, which probably resulted in the appearance of sugar starvation in senescing leaves. There is a large body of evidence to support that sugar starvation enhances the progression of leaf senescence [52]. In this study, many DEGs involved in hexose, sucrose, and starch metabolism were enriched in the mutant during leaf senescence. For hexose metabolism, some DEGs encoding fructose-1,6-bisphosphatase, fructose-bisphosphate aldolase, glucose-1-phosphate adenylyltransferase, and glucose-6-phosphate 1-dehydrogenase showed significant decreases in transcripts for ospls1 mutant (Table 8), suggesting that hexokinase-dependent glucose and sucrose signaling pathways appeared to be inactive in senescing leaves owing to the decreases in OsVHA-A transcript and V-H+-ATPase activity. By contrast, assimilate remobilization is enhanced once the leaf senescence is initiated in cereals [8], and sucrose is a major assimilate translocated from source leaves to developing grains [53]. In the present study, five DEGs encoding trehalose-6-phosphate synthase and sucrose synthase displayed significantly increasing expression levels in the ospls1 mutant, whereas DEGs encoding sucrose-phosphate synthase and beta-fructofuranosidase exhibited slightly decreasing expression levels (Table 8), which indicated that sucrose cleavage catalyzed by trehalose-6-phosphate synthase and sucrose synthase was enhanced and that sucrose synthesis, dominated by sucrose-phosphate synthase and beta-fructofuranosidase, was weakened during leaf senescence. Starch is a major carbohydrate remobilized in source leaves of rice plant during the grain-filling stage. Along with the progression of leaf senescence, starch stored in source leaves before heading is remobilized and translocated to the developing grains during the grain-filling stage, subsequently contributing to the final yield [54]. In this study, the DEGs between 0 day and 14 days involved in starch synthesis showed significant decreases in transcripts for leaves of the ospls1 mutant, and DEGs encoding beta-amylases exhibited increasing expression levels, which clearly proved that starch remobilization was enhanced in senescing leaves. Moreover, sucrose translocation and starch remobilization from source leaves to developing grains also exacerbated the phenomenon of sugar starvation in senescing leaves, which in turn accelerated the progression of leaf senescence.

4. Materials and Methods

4.1. Plant Materials and Growth Conditions

The ospls1 mutant rice with early senescence phenotype was obtained from the mature seeds of gramma-irradiated cultivated rice Fu142 (Oryza sativa L. ssp. indica). Stable phenotype selection was conducted from the M2 to M8 generations through successive self-pollination. The ospls1 mutant plant presented normal phenotypic appearance between the seedling and tillering stages. Until the late tillering stage, brown lesions began to appear on the tips of the lower leaves of the ospls1 mutant rice plant, and gradually became exacerbated and covered the whole leaf blade. However, the topmost two fully expanded leaves and central leaf of rice plant kept their normal green appearance at the same period. After the flowering stage, the topmost flag leaf of the ospls1 mutant plant began to show senescence symptoms, and the brown lesions gradually spread from the tip down to the whole leaf blade during the grain-filling stage. The flag leaf became completely withered about 3 weeks after anthesis. By contrast, the wild type still retained its normal green appearance during the whole same period (Figure 1A). Moreover, a cytosine deletion in the gene encoding V-H+-ATPase subunit A has been identified to underlie the early senescence phenotype in the ospls1 mutant [24].
The field experiment was performed at the experimental field of Fujian Agriculture and Forestry University in Fuzhou, China. Rice seedlings were cultivated in April 15 and then transplanted May 14. The field plots were arranged as a random design, followed by three replications for each genotype. Each replication was set as 10 × 12 rows, and planting distance was performed according to 18 cm × 18 cm with one seedling for each hill. The field experiment was managed according to the local planting practices, and the soil property was the periodically waterlogged paddy soil, with 1.69 g/kg total N, 24.5 mg/kg available P, and 103.7 mg/kg exchangeable K. The samples were collected during the grain-filling stage. Rice plants with uniform anthesis date were randomly selected and tagged at the full heading day. The chlorophyll maximal quantum yield of PSII photochemistry (Fv/Fm) and net photosynthetic rate (Pn) were determined over 7-day intervals during the grain-filling stage. The flag leaves of tagged plants were sampled over 7-day intervals during the grain-filling stage and were used to determinate the physiological parameters. In addition, the whole flag leaf of each genotype was sampled on day 0 and 14 of grain-filling stage and immediately frozen in liquid nitrogen and kept at −80 °C for RNA extraction and RNA-seq. Three independent whole flag leaves of each rice plant were treated as the biological replications for each genotype on day 0 and 14 of grain-filling stage, a total of 12 flag leaf samples were collected in this study. At maturity, 15 tagged plants were harvested from each plot to investigate the agronomic traits and yield characteristics.

4.2. Measurement of Fv/Fv, Pn, Soluble Sugar and Protein, and V-H+-ATPase Activity

Before Fv/Fm measurement, whole rice plant was dark-adapted for 20 min, and chlorophyll Fv/Fm was measured using a steady-state gas-exchange system with an integrated fluorescence chamber head (LI-6400-40, LI-COR, Lincoln, NE, USA). Fv/Fm value was calculated as Fv/Fm = (Fm−F0)/Fm [55]. Pn was determined using the LI-6400 portable photosynthesis system (LI-COR, Lincoln, NE, USA) under a 2000 μmol·m−2·s−1 of photosynthetic photon flux density (PPFD), 370 μmol·mol−1 of CO2 concentration and a 1.3–1.6 kPa leaf-to-air vapor-pressure difference. During measurement, leaf temperatures were maintained at 30 °C. All of the measurements were conducted at 9:00–11:00 a.m. The soluble sugar was determined using the anthrone-H2SO4 colorimetry method [56], and soluble protein in fresh leaves was determined by the method of Bradford [57]. The activity of V-H+-ATPase was evaluated by determining the release of phosphate (Pi) and expressed in μmol Pi·mg−1 protein·h−1. Membrane proteins were extracted from fresh samples, and 10 μg of microsomal membranes was incubated for 40 min at 28 °C. Afterward, 40 mM of citric acid was added to impede the reaction. Meanwhile, 10 μg of bovine serum albumin was used as a reference. The V-H+-ATPase activity was calculated, as described by Zhang et al. [22].

4.3. RNA Extraction and RNA-seq

For RNA-seq, RNA extraction was performed according to the manufacturer’s protocol of the RNAprep Pure Plant kit (TianGen Biotech Co., Ltd., Beijing, China). RNA purity and integrality were checked before cDNA library construction. mRNA was enriched from the total RNA through the magnetic beads with oligo (dT). Afterward, mRNA was randomly broken into fragments. Catalyzed by reverse transcriptase, double-stranded cDNA (ds-cDNA) was synthesized through mRNA by combining with random primers. After purifying ds-cDNA, the adapters and poly(A) tails were ligated at both ends of ds-cDNA. With the adapter sequences, ds-cDNA fragments were amplified by PCR reaction. The cDNA libraries were then ready for sequencing. After accurate ds-cDNA quantification, ds-cDNA library sequencing was conducted using the Illumina HiSeq2000 platform (Illumina, San Diego, CA, USA).

4.4. Bioinformatics Analysis of RNA-seq Data and Identification of DGEs

The raw sequence data were generated through the Illumina data processing pipeline (version 1.8). The clean data were obtained by removing adaptor sequences and low-quality reads (reads with more than 50% of bases having Q value ≤20 or an ambiguous sequence content exceeding 10%). A reference genome-based transcriptome analysis strategy was employed to process the high-quality sequence data. The rice reference genome was downloaded from the Genomics website (ftp://ftp.ensemblgenomes.org/pub/release-23/plants/fasta/oryza_indica/dna/). TopHat was used to align the high-quality reads to the rice reference genome, and then mapping results were built to identify known and novel transcripts.
The expression levels of genes in all samples were evaluated by quantifying the count of mapped reads. The FPKM method was employed to normalize gene expression counts for the sequence. The expression ratios between different sample groups (Mutant_14d vs. Mutant_0d, Wild_14d vs. Wild_04, Mutant_0d vs. Wild_0d, and Mutant_14d vs. Wild_14d) were calculated as fold changes. Significant DEGs were identified by the DESeq software package, according to |log2 (Fold Change)| > 1 and adjusted p-value (padj) < 0.05 [58].

4.5. qRT-PCR Validation

The RNA for RNA-seq was also used for qRT-PCR assays to validate the reliability of RNA-Seq data. Approximately 1 µg of total RNA was treated with RNase-free DNaseI to eliminate genomic DNA pollution, and then cDNA was synthesized in a 50 µL reaction with an oligo (dT) primer by using the ReverTra Ace qPCR RT kit (Toyobo, Osaka, Japan). qRT-PCR was performed on a CFX96 system machine (Bio-Rad, Hercules, CA, USA) according to the protocols, with the 20 µL reaction solution containing 10 µL of SYBR, 1 µL of cDNA, 1.6 µL of 10 mM primer, and 7.4 µL of H2O. The specific primers of genes chosen were designed by Primer-BLAST (http://www.ncbi.nlm.nih.gov/tools/primer-blast/) as listed in Supplementary Table S1. To normalize data, the amplification of ACTIN-1 sequence was performed as an endogenous reference. The relative expressions of genes were calculated by the comparative Ct method [59].

4.6. Functional Annotation, Gene Ontology (GO) Enrichment, and KEGG Analysis of DEGs

DEGs were submitted to GO and KEGG enrichment (http://www.genome.jp/kegg/) analysis to annotate their biological function and significantly metabolic pathways. The submission of DEGs to GO enrichment was performed using GOseq method based on Wallenius non-central hypergeometric distribution [60]. The GO distributions associated with identified DEGs were achieved according to three levels: biological process, molecular function, and cellular component. The KOBAS 2.0 software was then used to identify the significant pathways of DEGs in KEGG enrichment. Pathways with corrected p-value < 0.05 were considered statistically significant.

5. Conclusions

Taken together, our results showed that the ospls1 mutant rice underwent early leaf senescence in comparison with its wild type during the grain-filling stage. Physiological and agronomic analysis showed that the ospls1 mutant displayed significant decreases in soluble sugar and protein, Pn, and yield traits, accompanied by decreases in OsVHA-A transcript and V-H+-ATPase activity. RNA-Seq results suggested that approximately 4827 DEGs between 0 day and 14 days in the ospls1 mutant were identified and analyzed for their potential roles in leaf senescence using GO enrichment and KOBAS analysis. Moreover, 81 differentially expressed TFs between 0 day and 14 days were identified, and some of them are critical for the regulation of plant senescence. Eleven hormones associated with DEGs were enriched in the auxin, CTK, BR, and ABA pathways, indicating that hormone-signaling pathways were involved in leaf senescence for the ospls1 mutant. In addition, many antioxidative and carbohydrate metabolism-related genes were found to be differentially expressed in ospls1 mutant leaves, suggesting that these genes probably play responding and regulatory roles in leaf senescence. Therefore, the present study revealed a large number of candidate genes and pathways that perhaps play important roles in leaf senescence of rice. Meanwhile, the interaction relationships between key candidate genes and OsVHA-A will be feasible in future research, which will be helpful for understanding the molecular mechanisms involved in the early leaf senescence of rice.

Supplementary Materials

Supplementary materials can be found at https://www.mdpi.com/1422-0067/20/5/1098/s1.

Author Contributions

Z.L. and W.L. designed the experiments. Z.L. and X.P. prepared the materials and investigated the agronomic traits. Z.L., X.G. and K.F. determined the physiological parameters. Z.L. and X.P. performed the RNA isolation. X.G. and K.F. performed the qRT-PCR. Z.L. and K.F. analyzed the sequencing data. Z.L. and W.L. wrote and revised this manuscript. All authors participated in the research and approved the final manuscript.

Funding

This research was funded by the National Natural Science Foundation of China, grant number 31701329, the Natural Science Foundation of Fujian Province, grant number 2016J01100, and the Project Funded by China Postdoctoral Science Foundation, grant number 2015M580560.

Conflicts of Interest

The authors declare no conflict of interest.

Abbreviations

ABAAbscisic acid
BKI1Brassinosteroid insensitive 1 kinase inhibitor 1
BRI1Brassinosteroid insensitive 1
BRsBrassinosteroids
BZR1Brassinazole-resistant 1
CatCatalase
CTKsCytokinins
DEGsDifferentially expressed genes
ETEthylene
FPKMFragments per kilobase of transcript sequence per million base pairs sequenced
Fv/FmMaximal quantum yield of PSII photochemistry
GOGene ontology
H2O2Hydrogen peroxide
KEGGKyoto encyclopedia of genes and genomes
KOBASThe KEGG Orthology Based Annotation System
MDAMalondialdehyde
1O2Singlet oxygen
O2Superoxide anion radicals
OH∙Hydroxyl radicals
ospls1Oryza sativa premature leaf senescence 1
PnNet photosynthesis rate
PPFDPhotosynthetic photon flux density
qRT-PCRQuantitative real-time polymerase chain reaction
ROSReactive oxygen species
SASalicylic acid
SAGsSenescence-associated genes
TFsTranscription factors
TRCThioredoxin reductase
TrxThioredoxin
VHA-AV-H+-ATPase subunit A

References

  1. Lim, P.O.; Kim, H.J.; Nam, H.G. Leaf senescence. Annu. Rev. Plant Biol. 2007, 58, 115–136. [Google Scholar] [CrossRef] [PubMed]
  2. Podzimska-Sroka, D.; O’Shea, C.; Gregersen, P.L.; Skriver, K. NAC transcription factors in senescence: From molecular structure to function in crops. Plants 2015, 4, 412–448. [Google Scholar] [CrossRef] [PubMed]
  3. Takahashi, A.; Kawasaki, T.; Wong, H.L.; Suharsono, U.; Hirano, H.; Shimamoto, K. Hyperphosphorylation of a mitochondrial protein, prohibitin, is induced by calyculin A in a rice lesion-mimic mutant cdr1. Plant Physiol. 2003, 132, 1861–1869. [Google Scholar] [CrossRef] [PubMed]
  4. Woo, H.R.; Kim, H.J.; Nam, H.G.; Lim, P.O. Plant leaf senescence and death—Regulation by multiple layers of control and implications for aging in general. J. Cell Sci. 2013, 126, 4823–4833. [Google Scholar] [CrossRef] [PubMed]
  5. Hortensteiner, S.; Feller, U. Nitrogen metabolism and remobilization during senescence. J. Exp. Bot. 2002, 53, 927–937. [Google Scholar] [CrossRef] [PubMed] [Green Version]
  6. Gross, B.L.; Zhao, Z. Archaeological and genetic insights into the origins of domesticated rice. Proc. Natl. Acad. Sci. USA 2014, 111, 6190–6197. [Google Scholar] [CrossRef] [PubMed] [Green Version]
  7. Gregersen, P.L.; Holm, P.B.; Krupinska, K. Leaf senescence and nutrient remobilisation in barley and wheat. Plant Biol. 2008, 10, 37–49. [Google Scholar] [CrossRef] [PubMed] [Green Version]
  8. Wu, X.Y.; Kuai, B.K.; Jia, J.Z.; Jing, H.C. Regulation of leaf senescence and crop genetic improvement. J. Integr. Plant Biol. 2012, 54, 936–952. [Google Scholar] [CrossRef] [PubMed]
  9. Distelfeld, A.; Avni, R.; Fischer, A.M. Senescence, nutrient remobilization, and yield in wheat and barley. J. Exp. Bot. 2014, 65, 3783–3798. [Google Scholar] [CrossRef] [PubMed] [Green Version]
  10. Quirino, B.F.; Noh, Y.S.; Himelblau, E.; Amasino, R.M. Molecular aspects of leaf senescence. Trends Plant Sci. 2000, 5, 278–282. [Google Scholar] [CrossRef]
  11. Leng, Y.; Ye, G.; Zeng, D. Genetic dissection of leaf senescence in rice. Int. J. Mol. Sci. 2017, 18, 2686. [Google Scholar] [CrossRef] [PubMed]
  12. Apel, K.; Hirt, H. Reactive oxygen species: Metabolism, oxidative stress, and signal transduction. Annu. Rev. Plant Biol. 2004, 55, 373–399. [Google Scholar] [CrossRef] [PubMed]
  13. Balazadeh, S.; Jaspert, N.; Arif, M.; Mueller-Roeber, B.; Maurina, V.G. Expression of ROS-responsive genes and transcription factors after metabolic formation of H2O2 in chloroplasts. Front. Plant Sci. 2012, 3, 234. [Google Scholar] [CrossRef] [PubMed]
  14. Jibran, R.; Hunter, A.; Dijkwel, P. Hormonal regulation of leaf senescence through integration of developmental and stress signals. Plant Mol. Biol. 2013, 82, 547–561. [Google Scholar] [CrossRef] [PubMed]
  15. Allu, A.D.; Soja, A.M.; Wu, A.; Szymanski, J.; Balazadeh, S. Salt stress and senescence: Identification of cross-talk regulatory components. J. Exp. Bot. 2014, 65, 3993–4008. [Google Scholar] [CrossRef] [PubMed]
  16. Liang, C.; Wang, Y.; Zhu, Y.; Tang, J.; Hu, B.; Liu, L.; Ou, S.; Wu, H.; Sun, X.; Chu, J.; et al. OsNAP connects abscisic acid and leaf senescence by fine-tuning abscisic acid biosynthesis and directly targeting senescence-associated genes in rice. Proc. Natl. Acad. Sci. USA 2014, 111, 10013–10018. [Google Scholar] [CrossRef] [PubMed] [Green Version]
  17. Kluge, C.; Lahr, J.; Hanitzsch, M.; Bolte, S.; Golldack, D.; Dietz, K.J. New insight into the structure and regulation of the plant vacuolar H+-ATPase. J. Bioenerg. Biomembr. 2003, 35, 377–388. [Google Scholar] [CrossRef] [PubMed]
  18. Schumacher, K.; Krebs, M. The V-ATPase: Small cargo, large effects. Curr. Opin. Plant Biol. 2010, 13, 724–730. [Google Scholar] [CrossRef] [PubMed]
  19. Marty, F. Plant vacuoles. Plant Cell 1999, 11, 587–600. [Google Scholar] [CrossRef] [PubMed]
  20. Kluge, C.; Seidel, T.; Bolte, S.; Sharma, S.S.; Hanitzsch, M.; Satiat-Jeunemaitre, B.; Ross, J.; Sauer, M.; Golldack, D.; Dietz, K.J. Subcellular distribution of the V-ATPase complex in plant cells, and in vivo localisation of the 100 kDa subunit VHA-a within the complex. BMC Cell Biol. 2004, 5, 29. [Google Scholar] [CrossRef] [PubMed]
  21. Dettmer, J.; Cchubert, D.; Calvo-Weimar, O.; Stierhof, Y.D.; Schmidt, R.; Schumacher, K. Essential role of the V-ATPase in male gametophyte development. Plant J. 2005, 41, 117–124. [Google Scholar] [CrossRef] [PubMed]
  22. Zhang, H.; Niu, X.; Liu, J.; Xiao, F.; Cao, S.; Liu, Y. RNAi-directed downregulation of vacuolar H+-ATPase subunit A results in enhanced stomatal aperture and density in rice. PLoS ONE 2013, 8, e69046. [Google Scholar] [CrossRef] [PubMed]
  23. Wang, L.; He, X.L.; Zhao, Y.J.; Shen, Y.Z.; Huang, Z.J. Wheat vacuolar H+-ATPase subunit B cloning and its involvement in salt tolerance. Planta 2011, 234, 1–7. [Google Scholar] [CrossRef] [PubMed]
  24. Yang, X.; Gong, P.; Li, K.; Huang, F.; Cheng, F.; Pan, G. A single cytosine deletion in the OsPLS1 gene encoding vacuolar-type H+-ATPase subunit A1 leads to premature leaf senescence and seed dormancy in rice. J. Exp. Bot. 2016, 67, 2761–2776. [Google Scholar] [CrossRef] [PubMed]
  25. Li, Z.; Wang, F.; Lei, B.; Cao, Z.; Pan, G.; Cheng, F. Genotypic-dependent alteration in transcriptional expression of various CAT isoenzyme genes in esl mutant rice and its relation to H2O2-induced leaf senescence. Plant Growth Regul. 2014, 73, 237–248. [Google Scholar] [CrossRef]
  26. Lee, T.I.; Young, R.A. Transcription of eukaryotic protein-coding genes. Annu. Rev. Genet. 2000, 34, 77–137. [Google Scholar] [CrossRef] [PubMed]
  27. Rushton, P.J.; Somssich, I.E.; Ringler, P.; Shen, Q.J. WRKY transcription factors. Trends Plant Sci. 2010, 15, 247–258. [Google Scholar] [CrossRef] [PubMed]
  28. Lin, Z.; Hong, Y.; Yin, M.; Li, C.; Zhang, C.; Grierson, D. A tomato HD-Zip homeobox protein, LeHB-1, plays an important role in floral organogenesis and ripening. Plant J. 2008, 55, 301–310. [Google Scholar] [CrossRef] [PubMed] [Green Version]
  29. Chang, X.; Donnelly, L.; Sun, D.; Rao, J.; Reid, M.S.; Jiang, C.Z. A petunia homeodomain-leucine zipper protein, PhHD-Zip, plays an important role in flower senescence. PLoS ONE 2014, 9, e88320. [Google Scholar] [CrossRef] [PubMed]
  30. Robatzek, S.; Somssich, I.E. A new member of the Arabidopsis WRKY transcription factor, AtWRKY6, is associated with both senescence- and defence-related processes. Plant J. 2001, 28, 123–133. [Google Scholar] [CrossRef] [PubMed]
  31. Miao, Y.; Zentgraf, U. The antagonist function of Arabidopsis WRKY53 and ESR/ESP in leaf senescence is modulated by the jasmonic and salicylic acid equilibrium. Plant Cell 2007, 19, 819–830. [Google Scholar] [CrossRef] [PubMed]
  32. Zhang, J.; Hu, Z.; Yao, Q.; Guo, X.; Nguyen, V.; Li, F.; Chen, G. A tomato MADS-box protein, SICMB1, regulates ethylene biosynthesis and carotenoid accumulation during fruit ripening. Sci. Rep. 2018, 8, 3413. [Google Scholar] [CrossRef] [PubMed]
  33. Ellis, C.M.; Nagpal, P.; Young, J.C.; Hagen, G.; Guilfoyle, T.J.; Reed, J.W. AUXIN RESPONSE FACTOR1 and AUXIN RESPONSE FACTOR2 regulate senescence and floral organ abscission in Arabidopsis thaliana. Development 2005, 132, 4563–4574. [Google Scholar] [CrossRef] [PubMed]
  34. Luo, J.; Zhou, J.J.; Zhang, J.Z. Aux/IAA gene family in plants: Molecular structure, regulation, and function. Int. J. Mol. Sci. 2018, 19, 259. [Google Scholar] [CrossRef] [PubMed]
  35. Bakshi, M.; Oelmüller, R. WRKY transcription factor: Jack of many trades in plants. Plant Signal. Behav. 2014, 9, e27700. [Google Scholar] [CrossRef] [PubMed]
  36. Lin, M.; Pang, C.; Fan, S.; Song, M.; Wei, H.; Yu, S. Global analysis of the Gossypium hirsutum L. Transcriptome during leaf senescence by RNA-seq. BMC Plant Biol. 2015, 15, 43. [Google Scholar] [CrossRef] [PubMed]
  37. Rogers, H.J. Is there an important role for reactive oxygen species and redox regulation during floral senescence? Plant Cell Environ. 2012, 35, 217–233. [Google Scholar] [CrossRef] [PubMed]
  38. Salleh, F.M.; Mariotti, L.; Spadafora, N.D.; Price, A.M.; Picciarelli, P.; Wagstaff, C.; Lombardi, L.; Rogers, H. Interaction of plant growth regulators and reactive oxygen species to regulate petal senescence in wallflowers (Erysimum linifolium). BMC Plant Biol. 2016, 16, 77. [Google Scholar] [CrossRef] [PubMed]
  39. Li, Z.; Wang, F.; Zhao, Q.; Liu, J.; Cheng, F. Involvement of NADPH oxidase isoforms in the production of O2 manipulated by ABA in the senescing leaves of early-senescence-leaf (esl) mutant rice (Oryza sativa). PLoS ONE 2018, 13, e0190161. [Google Scholar] [CrossRef] [PubMed]
  40. Meyer, Y.; Buchanan, B.B.; Vignols, F.; Reichheld, J.P. Thioredoxins and glutaredoxins: Unifying elements in redox biology. Annu. Rev. Genet. 2009, 43, 335–367. [Google Scholar] [CrossRef] [PubMed]
  41. Carrillo, L.R.; Froehlich, J.E.; Cruz, J.A.; Savage, L.J.; Kramer, D.M. Multi-level regulation of the chloroplast ATP synthase: The chloroplast NADPH thioredoxin reductase C (NTRC) is required for redox modulation specifically under low irradiance. Plant J. 2016, 87, 654–663. [Google Scholar] [CrossRef] [PubMed]
  42. Thomas, H.; Stoddart, J.L. Leaf senescence. Ann. Rev. Plant Physiol. 1980, 31, 83–111. [Google Scholar] [CrossRef]
  43. Sarwat, M.; Naqvi, A.R.; Ahmad, P.; Ashraf, M.; Akram, N.A. Phytohormones and microRNAs as sensors and regulators of leaf senescence: Assigning macro roles to small molecules. Biotechnol. Adv. 2013, 31, 1153–1171. [Google Scholar] [CrossRef] [PubMed]
  44. Ye, N.; Jia, L.; Zhang, J. ABA signal in rice under stress conditions. Rice 2012, 5, 1. [Google Scholar] [CrossRef] [PubMed] [Green Version]
  45. Nambara, E.; Marion-Poll, A. Abscisic acid biosynthesis and catabolism. Annu. Rev. Plant Biol. 2005, 56, 165–185. [Google Scholar] [CrossRef] [PubMed]
  46. Ji, X.; Dong, B.; Shiran, B.; Talbot, M.J.; Edlington, J.E.; Hughes, T.; White, R.G.; Gubler, F.; Dolferus, R. Control of abscisic acid catabolism and abscisic acid homeostasis is important for reproductive stage stress tolerance in cereals. Plant Physiol. 2011, 156, 647–662. [Google Scholar] [CrossRef] [PubMed]
  47. van der Graaff, E.; Schwacke, R.; Schneider, A.; Desimone, M.; Flügge, U.I.; Kunze, R. Transcription analysis of Arabidopsis membrane transporters and hormone pathways during developmental and induced leaf senescence. Plant Physiol. 2006, 141, 776–792. [Google Scholar] [CrossRef] [PubMed]
  48. Clouse, S.D.; Sasse, J.M. BRASSINOSTEROIDS: Essential regulators of plant growth and development. Annu. Rev. Plant Physiol. Plant Mol. Biol. 1998, 49, 427–451. [Google Scholar] [CrossRef] [PubMed]
  49. Tang, W.; Yuan, M.; Wang, R.; Yang, Y.; Wang, C.; Oses-Prieto, J.A.; Kim, T.W.; Zhou, H.W.; Deng, Z.; Gampala, S.S.; et al. PP2A activates brassinosteroid-responsive gene expression and plant growth by dephosphorylating BZR1. Nat. Cell Biol. 2011, 13, 124–131. [Google Scholar] [CrossRef] [PubMed] [Green Version]
  50. Trivellini, A.; Cocetta, G.; Hunter, D.A.; Vernieri, P.; Ferrante, A. Spatial and temporal transcriptome changes occurring during flower opening and senescence of the ephemeral hibiscus flower, Hibiscus rosa-sinensis. J. Exp. Bot. 2016, 67, 5919–5931. [Google Scholar] [CrossRef] [PubMed]
  51. Yang, J.C.; Zhang, J.H. Grain filling of cereals under soil drying. New Phytol. 2006, 169, 223–236. [Google Scholar] [CrossRef] [PubMed]
  52. van Doorn, W.G. Is petal senescence due to sugar starvation? Plant Physiol. 2004, 134, 35–42. [Google Scholar] [CrossRef] [PubMed]
  53. Smith, A.M.; Stitt, M. Coordination of carbon supply and plant growth. Plant Cell Environ. 2007, 30, 1126–1149. [Google Scholar] [CrossRef] [PubMed] [Green Version]
  54. Yang, J.; Zhang, J.; Wang, Z.; Zhu, Q.; Liu, L. Activities of enzymes involved in sucrose-to-starch metabolism in rice grains subjected to water stress during filling. Field Crops Res. 2003, 81, 69–81. [Google Scholar] [CrossRef]
  55. Panda, D.; Sarkar, R.K. Natural leaf senescence: Probed by chlorophyll fluorescence, CO2 photosynthetic rate and antioxidant enzyme activities during grain filling in different rice cultivars. Physiol. Mol. Biol. Plants 2013, 19, 43–51. [Google Scholar] [CrossRef] [PubMed]
  56. Li, Z.; Wang, F.; Lin, W.; Zhao, Q.; Liu, J.; Cheng, F. Carbon reserve and remobilization in leaf sheaths during the grain-filling stage in response to leaf early senescence. Acta Physiol. Plant. 2017, 39, 10. [Google Scholar] [CrossRef]
  57. Bradford, M.M. A rapid and sensitive method for the quantitation of microgram quantities of protein utilizing the principle or protein-dye binding. Anal. Biochem. 1976, 72, 248–254. [Google Scholar] [CrossRef]
  58. Trapnell, C.; Roberts, A.; Goff, L.; Pertea, G.; Kim, D.; Kelley, D.R.; Pimentel, H.; Salzberg, S.L.; Rinn, J.L.; Pachter, L. Differential gene and transcript expression analysis of RNA-seq experiments with TopHat and Cufflinks. Nat. Protoc. 2012, 7, 562–578. [Google Scholar] [CrossRef] [PubMed] [Green Version]
  59. Schmittgen, T.D.; Livak, K.J. Analyzing real-time PCR data by the comparative C(T) method. Nat. Protoc. 2008, 3, 1101–1108. [Google Scholar] [CrossRef] [PubMed]
  60. Young, M.D.; Wakefield, M.J.; Smyth, G.K.; Oshlack, A. Gene ontology analysis for RNA-seq: Accounting for selection bias. Genome Biol. 2010, 11, R14. [Google Scholar] [CrossRef] [PubMed]
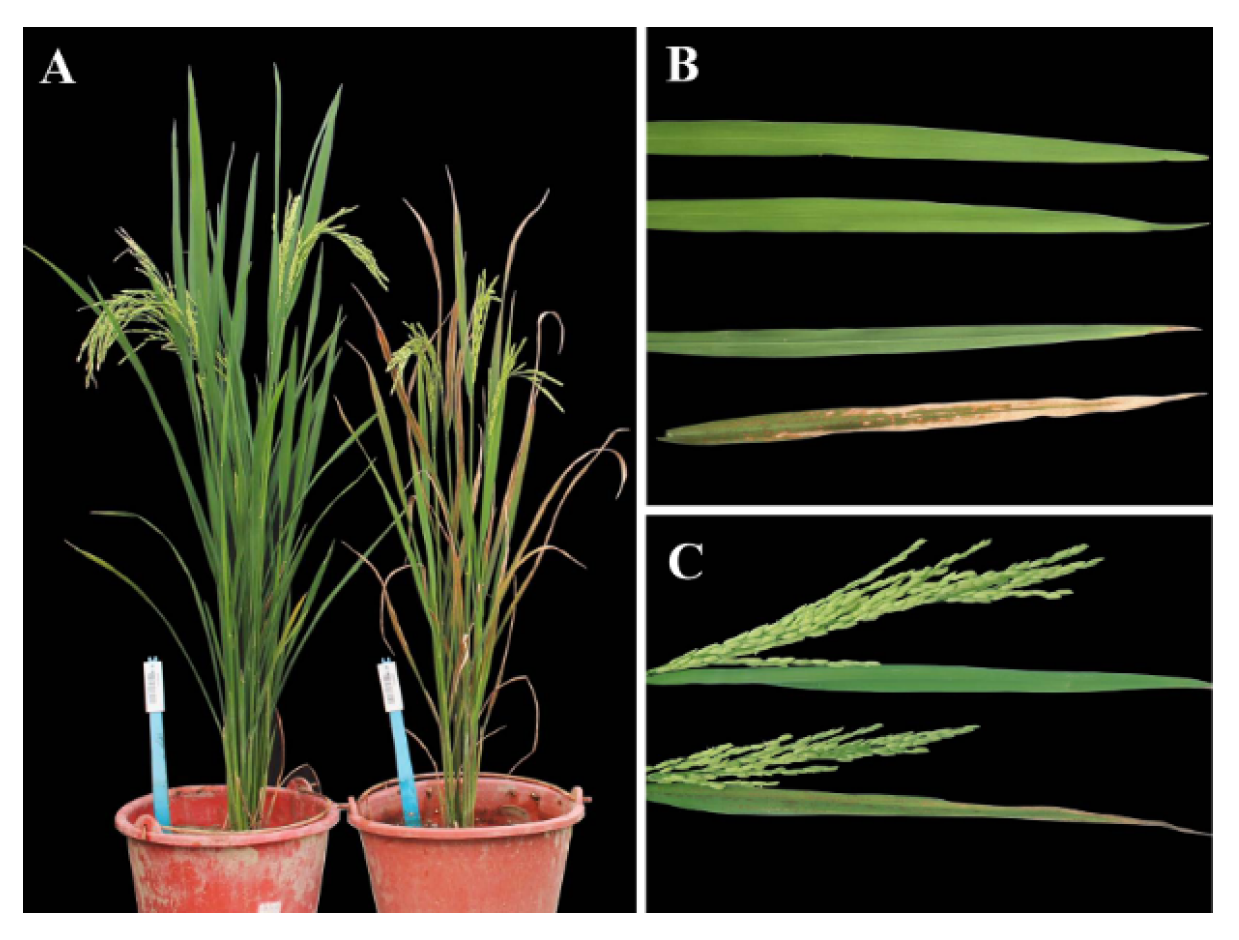
Figure 1. Comparison of phenotypes between the ospls1 mutant and wild type. (A) Plant morphological phenotype during the grain-filling period: left designates the wild type, and right designates the ospls1 mutant; and (B) flag leaves of the two genotypes. The upper two leaves represent the wild type at day 0 and 14 of grain-filling stage; the lower two leaves represent the ospls1 mutant at day 0 and 14 of grain-filling stage; (C) spikes with flag leaves on day 7 of the grain-filling stage; the upper indicates the wild type, and the lower indicates the ospls1 mutant.
Ijms 20 01098 g001
Figure 2. Temporal patterns of soluble sugar (A), soluble protein (B), Fv/Fm (C), and Pn (D) in flag leaves of the two rice genotypes during the grain-filling stage. Vertical bars represent standard errors with three independent biological replications. The asterisks represent significant differences (p < 0.05).
Ijms 20 01098 g002
Figure 3. Analyses of OsVHA-A expression and V-H+-ATPase activity in various tissues and genotypes. (A) Expression levels of OsVHA-A in root, culm, and leaf; and (B) genotype-dependent expression levels of OsVHA-A in the flag leaves at the heading stage. (C) V-H+-ATPase activities in the flag leaves of the two rice genotypes at the heading stage; vertical bars represent standard errors with three independent biological replications. * and ** represent significant differences at 0.05 and 0.01 probability levels, respectively.
Ijms 20 01098 g003
Figure 4. Venn diagrams of DEGs in different comparisons. The numbers indicate unique and common DEGs in different comparisons. (A) Unique and common DEGs between Mutant_14d vs. Mutant_0d and Wild_14d vs. Wild_0d; and (B) unique and common DEGs between Mutant_14d vs. Wild_14d and Mutant_0d vs. Wild_0d.
Ijms 20 01098 g004
Figure 5. TF families identified in the two rice genotypes. Number of transcripts related to each specific family was clustered and shown as the percentage of the total number of TFs.
Ijms 20 01098 g005
Figure 6. Hierarchical cluster analysis of TFs identified in DEGs in the two rice genotypes. Genes were displayed by different colors. Relative levels of expression were shown by a color gradient from low (blue) to high (red).
Ijms 20 01098 g006
Table 1. Variation of important agronomic traits between ospls1 mutant and wild type.
Traits20152016
Wild TypeMutantDifferent SignificanceWild TypeMutantDifferent Significance
Growth duration88.1 ± 2.186.6 ± 2.4ns89.6 ± 3.188.6 ± 2.4ns
Plant height (cm)109.3 ± 3.392.4 ± 2.2*110.8 ± 3.894.3 ± 3.6*
Available panicle number11.7 ± 3.86.3 ± 2.4**11.1 ± 2.45.6 ± 0.8**
Grain shape2.64 ± 0.022.58 ± 0.1ns2.61 ± 0.052.54 ± 0.08ns
Seed-setting rate (%)84.5 ± 3.941.8 ± 6.8**82.2 ± 6.136.6 ±4.3**
1000-grain weight (g)23.37 ± 1.117.62 ± 1.6**23.14 ± 0.618.1 ± 1.3**
Yield per plant (g)53.0 ± 7.44.1 ± 1.8**48.6 ± 9.53.8 ± 0.6**
Harvest index0.44 ± 0.030.15 ± 0.03**0.46 ± 0.020.19 ± 0.03**
Grain shape was determined by the ratio of grain length to width. * and ** represent significant differences at 0.05 and 0.01 probability levels, respectively. Growth duration means the days from sowing to the heading stage, and ns represents no significant difference.
Table 2. Overview of the RNA-sequencing reads generated from each sample.
SampleRaw Reads_countClean Reads_count Total Mapped Reads_countMapped %Uniquely Mapped Reads_countUniquely Mapped %
Mutant_0d150,966,88649,401,11239,881,95080.7338,567,82178.07
Mutant_0d260,634,59858,467,03047,637,81181.4846,087,81178.83
Mutant_0d351,135,35249,444,02239,862,11280.6238,601,16278.07
Wild_0d150,698,13848,773,77039,684,35881.3638,377,54578.68
Wild_0d246,710,30444,703,31636,126,42680.8134,969,39378.23
Wild_0d354,065,59051,885,20242,252,45881.4340,807,05978.65
Mutant_14d150,030,82448,186,29437,512,31677.8536,507,45675.76
Mutant_14d245,736,39843,690,01830,590,12670.0229,775,62368.15
Mutant_14d349,065,91447,170,68236,361,25777.0835,377,48375.00
Wild_14d162,344,68260,065,52448,768,41881.1947,309,39478.76
Wild_14d254,823,37852,520,88242,248,04180.4440,998,60078.06
Wild_14d348,894,00646,946,31238,265,38881.5137,104,07479.04
The replications are defined as 1, 2, and 3, respectively.
Table 3. DEGs identified from four different comparisons. DEGs: differentially expressed genes.
DEG SetDEGsUp-RegulatedDown-Regulated
Mutant_14d vs. Mutant_0d11,50453126192
Wild_14d vs. Wild_0d341916361783
Mutant_0d vs. Wild_0d521530932122
Mutant_14d vs. Wild_14d962548164809
Table 4. Significantly enriched pathways in the OsVHA-A mutant and wild type by Kyoto Encyclopedia of Genes and Genomes (KEGG) Orthology Based Annotation System (KOBAS) during leaf senescence (Corrected p-value < 0.05).
KEEG IDKEEG Pathway (Down-Regulated)MutantWild Type
Gene NumberBackground NumberCorrected p-ValueGene NumberBackground NumberCorrected p-Value
osa01110Biosynthesis of secondary metabolites2787790.0028827790.0222
osa00710Carbon fixation in photosynthetic organisms41770.0285
osa00195Photosynthesis40790.0462
osa00910Nitrogen metabolism 10270.0105
osa00906Carotenoid biosynthesis 8260.0467
KEEG IDKEEG Pathway (Up-Regulated)MutantWild Type
Gene NumberBackground NumberCorrected p-ValueGene NumberBackground NumberCorrected p-Value
osa04626Plant-pathogen interaction 291300.0012
osa00071Fatty acid degradation 15410.0012
osa00941Flavonoid biosynthesis 8190.0305
osa01110Biosynthesis of secondary metabolites 957790.0305
osa00592alpha-Linolenic acid metabolism 10330.0305
osa00520Amino sugar and nucleotide sugar metabolism 201030.0305
Table 5. Genotypic differences in expressions of DEGs associated with ATPase between the initial and 14th day of the grain-filling stage (padj < 0.05).
Gene IDLog2 (Fold Change 14d/0d)Description
MutantWild Type
BGIOSGA009058−1.22 ATP synthase
BGIOSGA031512−2.22−1.03ATP synthase subunit b, chloroplastic
BGIOSGA0042220.32 ATP synthase subunit beta
BGIOSGA0176020.38 ATP synthase subunit beta
Novel01284−1.99 putative ATPase
BGIOSGA0093280.59 V-type proton ATPase subunit F
BGIOSGA0158360.61 V-type proton ATPase subunit F
Table 6. Genotypic differences in expressions of DEGs encoding proteins associated with hormone signaling pathways between the initial and 14th day of the grain-filling stage (padj < 0.05). CTKs: cytokinins; BRs: brassinosteroids; ABA: abscisic acid; and BRI1: Brassinosteroid insensitive 1.
GroupGene IDLog2 (Fold Change 14d/0d)Description
MutantWild Type
Auxin/IAABGIOSGA004190−0.81−0.77Auxin-responsive protein IAA5
BGIOSGA009837−1.07−1.00Auxin-responsive protein IAA13
BGIOSGA023979−1.24 Probable indole-3-acetic acid-amido synthetase GH3.8
BGIOSGA004826−1.22−1.13Putative AUX1-like permease
CTKsBGIOSGA015027−0.76−1.25Type A response regulator 1
BRsBGIOSGA029632−1.47 Probable BRI1 kinase inhibitor 1
Novel00067−3.31 Brassinazole-resistant 1 homolog 1
ABANovel01323−0.78 Putative abscisic acid-induced protein
BGIOSGA026823−1.39−1.04Abscisic acid 8′-hydroxylase 2
BGIOSGA029635−1.13−1.14Abscisic acid 8′-hydroxylase 3
BGIOSGA016502−0.63−0.67Zeaxanthin epoxidase, chloroplastic
Table 7. Genotypic differences in expressions of DEGs encoding proteins involved in antioxidative metabolism and cyanide-resistant respiration between the initial and 14th day of the grain-filling stage (padj < 0.05).
GroupGene IDLog2 (Fold Change 14d/0d)Description
MutantWild Type
Anti-oxidative metabolismBGIOSGA011520−1.37−0.70Catalase
BGIOSGA0072522.414.17Catalase isozyme A
BGIOSGA0236361.64 Catalase isozyme B
BGIOSGA0196250.52 Superoxide dismutase
BGIOSGA022060−0.96 Superoxide dismutase
BGIOSGA022277−0.77 Superoxide dismutase
BGIOSGA029201−0.42 Superoxide dismutase [Cu-Zn]
BGIOSGA025399−0.84 Superoxide dismutase [Cu-Zn]
BGIOSGA0237560.81 Superoxide dismutase [Cu-Zn]
BGIOSGA020152−0.38 Thioredoxin
BGIOSGA0247010.34−0.74Thioredoxin H-type
BGIOSGA021328−0.54−1.01Thioredoxin reductase
BGIOSGA026313−0.61 Thioredoxin reductase
Cyanide-resistant respirationBGIOSGA0144211.281.54Alternative oxidase
BGIOSGA0144221.36 Alternative oxidase
BGIOSGA005788−0.95 Alternative oxidase
Table 8. Genotypic differences in expressions of DEGs associated with carbohydrate metabolism between the initial and 14th day of the grain-filling stage (padj < 0.05).
GroupGene IDLog2 (Fold Change 14d/0d)Description
MutantWild Type
HexoseBGIOSGA000339−0.64−0.68Fructokinase-1
BGIOSGA004865−0.93 Fructose-1,6-bisphosphatase, cytosolic
BGIOSGA027739−1.95 Fructose-bisphosphate aldolase
BGIOSGA034421−1.88 Fructose-bisphosphate aldolase
BGIOSGA0198440.54 Fructose-bisphosphate aldolase
BGIOSGA023247−2.52 Fructose-bisphosphate aldolase
BGIOSGA017490−0.63 Glucose-1-phosphate adenylyltransferase
BGIOSGA027135−0.67 Glucose-1-phosphate adenylyltransferase
BGIOSGA009855−0.75 Glucose-1-phosphate adenylyltransferase
BGIOSGA030039−0.95 Glucose-1-phosphate adenylyltransferase
BGIOSGA0244400.44 Glucose-6-phosphate 1-dehydrogenase
BGIOSGA012859−1.660.76Glucose-6-phosphate 1-dehydrogenase
BGIOSGA0108511.09−1.43Glucose-6-phosphate 1-dehydrogenase
BGIOSGA016632−0.611.29Glucose-6-phosphate 1-dehydrogenase
BGIOSGA0337191.411.42Mannose-6-phosphate isomerase
BGIOSGA0173730.53 Phosphomannomutase
SucroseBGIOSGA000239−0.69 Probable sucrose-phosphate synthase 1
BGIOSGA011194−0.67 Trehalose-6-phosphate synthase 4
BGIOSGA0269762.47 Trehalose-6-phosphate synthase 7
BGIOSGA0287592.15 Trehalose-6-phosphate synthase 8
BGIOSGA030372−0.55 Beta-fructofuranosidase, insoluble isoenzyme 7
BGIOSGA0105702.45 Sucrose synthase
BGIOSGA0217390.40 Sucrose synthase
BGIOSGA0107701.560.87Sucrose synthase
StarchBGIOSGA013592−2.131.83UDP-glucose 6-dehydrogenase
BGIOSGA0373420.75 UDP-glucose 6-dehydrogenase
BGIOSGA031231−0.38 UDP-glucose pyrophosphorylase
BGIOSGA021860−2.08−1.53Soluble starch synthase 1, chloroplastic
BGIOSGA005631−1.96−1.19Soluble starch synthase II-2
BGIOSGA0118291.46 Beta-amylase
BGIOSGA0330920.72 Beta-amylase
BGIOSGA000478−0.46 Phosphorylase
BGIOSGA009780−2.01−1.52Phosphorylase
BGIOSGA0045911.05 Pectinesterase
Table 9. Genotypic differences in expressions of DEGs involved in the hydrolysis and autophagy between the initial and 14th day of the grain-filling stage (padj < 0.05).
GroupGene IDLog2 (Fold Change 14d/0d)Description
MutantWild Type
Regulation of autophagyBGIOSGA0021871.05 Autophagy-related protein 3
BGIOSGA0242351.03 Autophagy-related protein 8A
BGIOSGA0143171.02 Autophagy-related protein 8B
BGIOSGA0281230.71 Autophagy-related protein 8C
ProteolysisBGIOSGA0046660.45 Proteasome subunit alpha type
BGIOSGA0086790.44 Proteasome subunit alpha type
BGIOSGA0113340.45 Proteasome subunit alpha type
BGIOSGA0178160.52 Proteasome subunit alpha type
BGIOSGA0268950.75 Proteasome subunit alpha type-2
BGIOSGA0291240.43 Proteasome subunit alpha type-7-A
BGIOSGA0055340.43 Proteasome subunit beta type
BGIOSGA0219710.36 Proteasome subunit beta type
BGIOSGA0193020.50 Proteasome subunit beta type
BGIOSGA0290401.58 Proteasome subunit beta type
BGIOSGA0294450.39 Proteasome subunit beta type