Abstract
Transglutaminase (TGase) is a regulator of posttranslational modification of protein that provides physiological protection against diverse environmental stresses in plants. Nonetheless, the mechanisms of TGase-mediated salt tolerance remain largely unknown. Here, we found that the transcription of cucumber TGase (CsTGase) was induced in response to light and during leaf development, and the CsTGase protein was expressed in the chloroplast and the cell wall. The overexpression of the CsTGase gene effectively ameliorated salt-induced photoinhibition in tobacco plants, increased the levels of chloroplast polyamines (PAs) and enhanced the abundance of D1 and D2 proteins. TGase also induced the expression of photosynthesis related genes and remodeling of thylakoids under normal conditions. However, salt stress treatment reduced the photosynthesis rate, PSII and PSI related genes expression, D1 and D2 proteins in wild-type (WT) plants, while these effects were alleviated in CsTGase overexpression plants. Taken together, our results indicate that TGase-dependent PA signaling protects the proteins of thylakoids, which plays a critical role in plant response to salt stress. Thus, overexpression of TGase may be an effective strategy for enhancing resistance to salt stress of salt-sensitive crops in agricultural production.
1. Introduction
Photosynthesis is the basic manufacturing process in plants; it can increase carbon gains and improve crop yield and quality [1]. Salinity, along with other environmental stresses such as drought and chilling, induces inhibition of photosynthetic activity by disruption of the chloroplast structure and reduction in CO2 assimilation [2]. The effects of environmental stresses on photosynthesis in cucumber have been extensively studied. We have described several defense systems that protect the photosynthetic apparatus by exogenous polyamines (PAs) application. For example, exogenous spermidine (Spd) delays chlorophyll degradation under heat stress, and the regulation of fatty acids and accumulation of PAs in thylakoid membranes are induced by exogenous putrescine (Put) under salt stress [3,4]. PAs are low molecular weight aliphatic amines; the biochemical properties of PAs are quite simple, but their regulation of processes is strikingly complex and wide processes [5]. The majority of PAs in higher plants are Spd, spermine (Spm), and their precursor Put, which derive from arginine in chloroplasts [6,7]. On the other hand, as the polycationic nature of PAs at physiological pH, PAs could be free molecules conjugated with organic acids or bound to negatively charged macromolecules such as proteins, nucleic acids, and chromatin through transglutaminases (TGases) enzymatic activity, stabilizing their structures [8,9]. These interactions are essential for the effects of PAs on plant cell growth and developmental processes and plant response to various stresses.
Moreover, PAs, as organic cations and permeant buffers, have been reported to protect the photosynthetic apparatus by regulating the size of the antenna proteins of light harvesting chlorophyll a/b protein complexes (LHCII) and the larger subunit of ribulose bisphosphate carboxylase-oxygenase during stresses, such as UV-B radiation and salt stress [10,11]. PAs are also synthesized and oxidized in chloroplasts, while the addition of PAs inhibits the destruction of thylakoids and prevents the loss of pigment during salt stress [12,13]. The levels of endogenous PAs are also related to chlorophyll biosynthesis and the rate of photosynthesis during stresses [14]. PA accumulation in the lumen promotes an increase in ATP and the electric field in vivo and in vitro [15]. In addition, endogenous PAs might be involved in the assembly of photosynthetic membrane complexes such as thylakoid membranes [16].
TGases are crucial factors of the thylakoid system but are often rather ignored. TGases catalyze proteins by establishing ε-(γ-glutamyl) links, then regulate proteins post-translational modification and the covalent binding of PAs to protein substrates [17,18]. TGases are widely distributed in microorganisms, animals, and plants. However, research on these enzymes in plants is more rarely reported than in animal systems, in which was detected for the first time in Arabidopsis thaliana the presence of only one gene, AtPng1p, which encodes a putative N-glycanase containing the Cys-His-Asp triad of the TGase catalytic domain and was expressed ubiquitously [19]. Although TGases are found in several organs in lower and higher plants, they are activated in a Ca2+ dependent manner and are involved in fertilization, abiotic and biotic stresses, senescence, and programmed cell death, under different light environment conditions, including natural habitats, but the function of TGases in chloroplasts has received the most attention [18,20]. The activity of TGases has been shown to be light sensitive, and some proteins of the photosystems (LHCII, CP29, CP26, and CP24) have been shown to be endogenous substrates of TGase in chloroplasts [21]. Meanwhile, TGase not only localized in the chloroplast grana and close to LHCII but also localized in the walls of the bulliform cells of leaves. Its activity was light dependent and its abundance depended on the degree of grana development [22]. Moreover, the expression and activity of TGase was involved in length of light exposure in maize [23].
In earlier works, we described the effects of salt and heat stresses on changes of free PA contents in leaves of cucumber and tomato [24,25]. Specifically, the content of PAs decreased under stress conditions, resulting in severe damage to photosynthetic organs such as chloroplasts, which were severely deformed into irregular shapes, and increased starch granules. TGase was induced by salt stress and involved in the protection of the photosynthetic apparatus [26]. In this article, we reveal that TGase has a positive role in PAs accumulation and induce the transcript of photosynthetic genes in chloroplast, which may play crucial roles in the regulation of photosynthetic organ stability. To our knowledge, this is the first report to show that the TGase positively regulates plant’s photosynthetic through accumulation of PAs to enhance salt tolerance.
2. Results
2.1. Expression Profile Analysis of TGase
To elucidate the molecular function of TGase, we analyzed the gene expression of TGase in cucumber. First, to investigate the effect of light on the expression of TGase in cucumber plants, we monitored the transcriptional levels of TGase in light-treated cucumber seedlings. The transcript level of TGase was gradually induced by light and reached the highest level at 16 h (Figure 1A). These results indicate that light plays a vital role in regulating TGase expression. To further explore the expression of TGase at different developmental stages, we investigated the transcript levels of TGase in leaves ranging from 1 to 8 weeks old by quantitative real-time PCR (qPCR). The expression level of TGase increased with the growth and development of the leaves (Figure 1B). TGase transcript levels in 4 and 8 week-old plants was significantly higher than those in 1-week-old plants (Figure 1B). Furthermore, TGase transcript levels increased during leaf development from young to mature leaves (Figure 1C). Some reports showed that TGase was widely present in plant tissue [17]. We extracted RNA from roots, stems, leaves, flowers, and fruits, and then analyzed the transcript levels of TGase in these tissues via qPCR. Our results also showed that TGase was present in all investigated tissues and was highly expressed in leaves and flowers, but minimally expressed in roots and stems (Figure 1D).
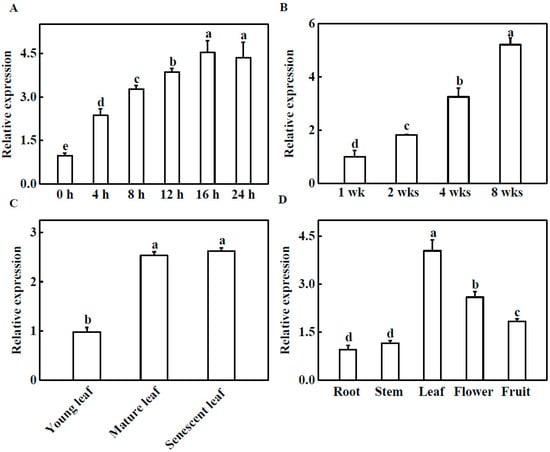
Figure 1.
Expression profiles of TGase. (A) Light-induced TGase expression in cucumber. The cucumber seedlings were exposed to light 0, 4, 8, 12, 16 and 24 h and TGase transcript levels were analyzed by quantitative real-time PCR (qPCR). (B) Transcript levels of TGase in cucumber leaves at 1, 2, 4, 8 weeks of development. (C) Transcript levels of TGase in young, mature and old leaves of cucumber plants. (D) qPCR analysis of TGase transcript in roots, stems, leaves, flowers and fruit of cucumber. Each histogram represents a mean ± SE of four independent experiments (n = 4). Different letters indicate significant differences between treatments (p < 0.05) according to Duncan’s multiple range test.
2.2. Immunolocalization of TGase Protein in Cucumber Leaves
Subcellular immunolocalization in cucumber leaf mesophyll cells provided details on the presence of TGase. The signal was localized in the chloroplasts and near the chloroplast grana (Figure 2A). The presence of TGase spots in the cell wall was detected (Figure 2B). These were not significantly localized to TGase in other cell organelles.
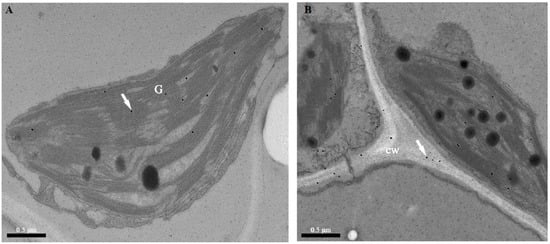
Figure 2.
TEM immunolocalization of TGase in cucumber leaf chloroplasts using the monoclonal antibody (1:1000). (A) Signal in the granary of the chloroplasts. (B) Signal in the cell well. G, grana; cw, cell wall.
2.3. Effects of TGase on the Biomass and Photosynthetic Characteristics of Transgenic Tobacco Lines
To analyze the role of cucumber TGase in salt tolerance, we overexpressed the TGase gene in tobacco plants. As shown in Figure 3A, as compared with WT plants, the biomass was higher in the CsTGase-overexpressing (CsTGaseOE) plants after salt stress. On the other hand, the CsTGaseOE plants had a higher biomass relative to WT plants under normal conditions. As shown in Figure 3B, the proline content in all the plants increased after salt treatment, but this increase was much greater in CsTGaseOE plants than in the WT plants. In WT plants, the chlorophyll a and chlorophyll b contents decreased by 62.0% and 51.3%, respectively, after salt treatment, whereas they maintained higher levels in CsTGaseOE plants compared with those of the WT (Figure 3C,D).
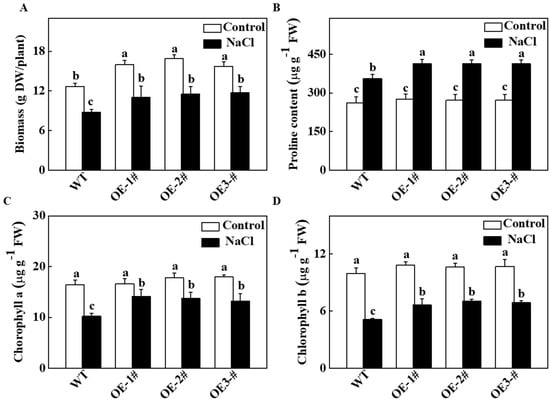
Figure 3.
Effects of salt stress on biomass, proline and chlorophyll content in wild-type (WT) and CsTGaseOE plants. (A) Biomass. (B) Proline content in leaves. (C,D) Chlorophyll a and b content. Each histogram represents a mean ± SE of four independent experiments (n = 4). Different letters indicate significant differences between treatments (p < 0.05) according to Duncan’s multiple range test.
We also evaluated the effects of salt stress on photosynthetic gas exchange parameters. As shown in Figure 4A, under normal conditions, the net photosynthesis rate (Pn) of CsTGaseOE plants was significantly higher than that of the WT plants. Salt stress resulted in a significant decrease in Pn, but this value was still maintained at a higher level in CsTGaseOE plants than in the WT (Figure 4A). Similar results were observed for stomatal conductance (Gs) (Figure 4B) and transpiration rate (Tr) (Figure 4D). However, there were no significant differences in intercellular CO2 concentration (Ci) in WT and CsTGaseOE plants after salt stress (Figure 4C). These results suggest that TGase plays a critical role in the tobacco response to salt stress, especially in maintaining photosynthetic properties.
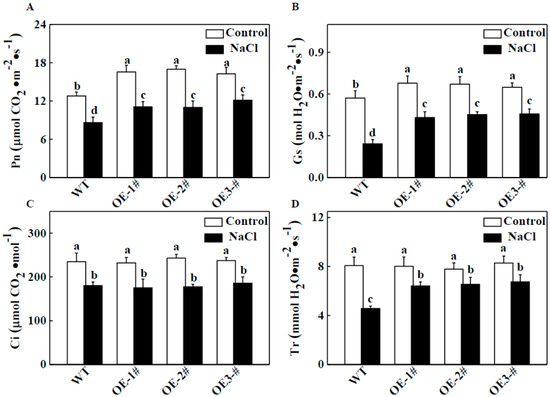
Figure 4.
Photosynthetic parameters of WT and CsTGaseOE plants in response to salt stress. (A) Net photosynthetic rate (Pn). (B) Stomatal conductance (Gs). (C) Intercellular CO2 concentration (Ci). (D) Transpiration rate (Tr). Each histogram represents a mean ± SE of four independent experiments (n = 6). Different letters indicate significant differences between treatments (p < 0.05) according to Duncan’s multiple range test.
2.4. Effects of TGase on Endogenous PA Content in Thylakoid Membranes
To determine whether PAs were involved in TGase-induced salt tolerance by protecting photosynthetic properties, we first measured the endogenous concentration of PAs in thylakoid membranes using a sensitive HPLC method. Under normal conditions, in CsTGaseOE plants, the thylakoid associated PAs (Put, Spd and Spm) showed significantly higher levels compared with those of WT plants. Salt-induced bound Put, Spd, and Spm increased in comparison to the WT (Figure 5A–C). Meanwhile, the PA concentration increased by 161.8%, 155.9%, and 167.4% in the three CsTGaseOE lines, respectively, compared with the WT under normal conditions (Figure 5D). PA accumulation rose by 28.7% in WT plants after salt treatment, but was still lower than in CsTGaseOE plants.
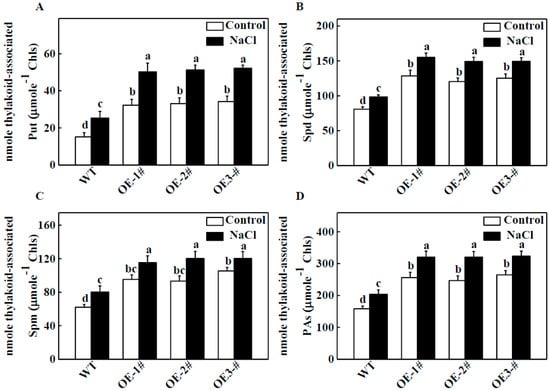
Figure 5.
Effects of salt stress on the contents of endogenous putrescine (Put), spermidine (Spd), spermine (Spm) and total polyamines (PAs) in chloroplast of WT and CsTGaseOE plants. (A) Thylakoid-associated Put content. (B) Thylakoid-associated Spd content. (C) Thylakoid-associated Spm content. (D) Total thylakoid-associated PAs content. Each histogram represents a mean ± SE of three independent experiments (n = 4). Different letters indicate significant differences between treatments (p < 0.05) according to Duncan’s multiple range test.
2.5. Effects of TGase on the Ultrastructure of Thylakoids
PAs are a major positive factor in chloroplast ultrastructure [14]. To determine whether TGase regulates the ultrastructure of chloroplasts, we assayed the architecture of the thylakoid network using transmission electron microscopy (TEM). Under normal conditions, TEM revealed that the chloroplasts of WT plants had well-structured thylakoid membranes composed of grana connected by stroma lamellae (Figure 6A). Interestingly, overexpression of TGase resulted in chloroplasts having more grana and a larger size than those of the WT plants (Figure 6B–D). And in CsTGaseOE plants, chloroplasts grana stacks reached up to 600 nm, whereas in the WT plants, chloroplast grana stacks were a maximum of 200 nm (Figure S1). These results suggest that TGase plays an important role in chloroplast development. Furthermore, under salt stress, chloroplasts were severely deformed into irregular shapes, and starch granules accumulated; moreover, a separation between cell membranes and chloroplasts was observed in WT plants (Figure 6E). However, the disintegration of grana thylakoids was significantly lower in CsTGaseOE plants compared to the salt-treated WT plants (Figure 6E–H).
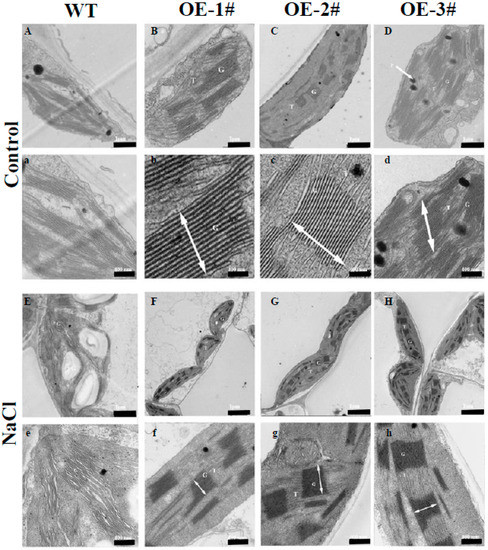
Figure 6.
Electron microscopy in chloroplast of WT and CsTGaseOE plants after salt stress. (B–D, b–d, F–H and f–h) shows an increased grana appression and a reduced stroma thylakoid network with respect to the WT (A,a,E,e) under normal conditions and salt stress. G, grana; T, thylakoid; SG, starch grana, P, plastoglobule. Grana height is indicated by white arrows. Scale bars for chloroplast and thylakoid are indicated. Three biological replicates were performed, and similar results were obtained.
2.6. Effect of TGase on Chl a Fluorescence Transients (OJIP)
A kinetic comparison was made of the raw OJIP transients measured in CsTGaseOE and WT plants after salt stress. No significant difference was observed under the absence of NaCl in any of the plants. However, there were significant differences in CsTGaseOE and WT plants under salt stress (Figure 7). In WT plants, salt stress resulted in a significant decrease in the intensities of fluorescence at J, I, and P levels with no major change in the minimal fluorescence (F0) (Figure 7). Compared to the WT plants, the OJIP fluorescence transient and Fm values were near the normal levels in CsTGaseOE plants after salt stress (Figure 7).
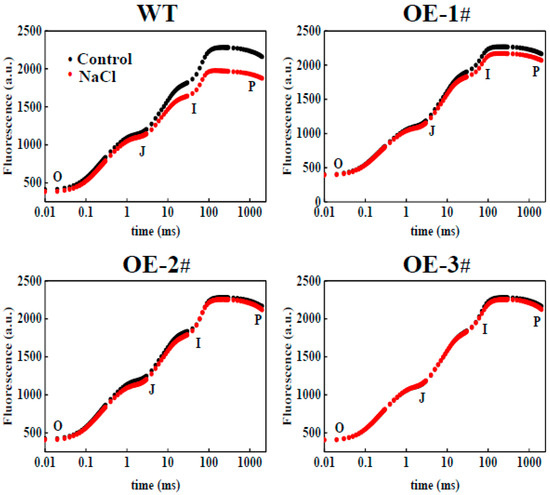
Figure 7.
Change in Chl a fluorescence transient curves (OJIP) (log time scale) in leaves of WT and CsTGaseOE plants under salt stress.
2.7. Effect of TGase on Nonphotochemical Quenching (NPQ) Induction
NPQ induction during light and dark transition periods was monitored. Transformed tobacco illuminated with 1 min light (500 μmol m−2 s−1) and treat with 4 min dark showed NPQ values proximal to ~0.8, whereas there was little activation of photoprotection in the WT, with an NPQ of ~0.4 (Figure 8A). At a light intensity level of 500 μmol m−2 s−1 the NPQ value of the WT was significantly decreased by salt stress compared to that of the CsTGaseOE plants (Figure 8B).
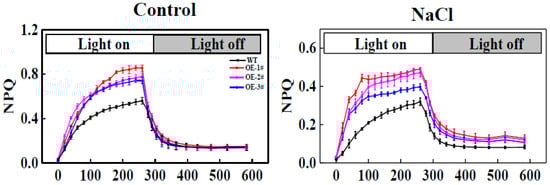
Figure 8.
Nonphotochemical quenching (NPQ) induction and relaxation kinetics of WT and CsTGaseOE plants under salt stress.
2.8. Effect of TGase on Quantum Yield of Energy Conversion in PSII and PSI
The Fv/Fm values were not significantly different in all plants under normal conditions (Figure 9A). However, the Fv/Fm values of the WT plants were significantly lower than those of CsTGaseOE plants under salt stress (Figure 9A), indicating that photoinhibition was more severe in WT plants and the TGase has a positive role in photoprotection. The Y(II) in CsTGaseOE plants was 19.8–24.0% higher than in WT plants, mainly due to an extremely higher photochemical quenching coefficient (qP) under normal conditions. After salt stress, the Y(NO) and Y(NPQ) values of CsTGaseOE plants were lower compared with those of WT plants (Figure 9C–E). In CsTGaseOE plants, the quantum yield of regulated energy dissipation (Y(NPQ)), an important process that consumes excess absorbed light energy and protects the photosynthetic apparatus, was higher than that in WT plants after salt stress (Figure 9G).
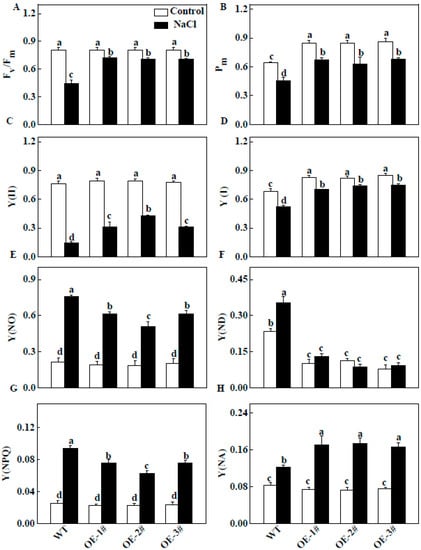
Figure 9.
Changes in PSII and PSI in leaves of WT and CsTGaseOE plants under salt stress. (A) The maximal quantum efficiency of PSII (Fv/Fm). (B) The maximum fluorescence of PSI (Pm). (C) The effective quantum efficiency of PSII (Y(II)). (D) The effective quantum efficiency of PSI (Y(I)). (E) The nonregulated energy dissipation (Y(NO)). (F) The oxidation status of PSI donor side (Y(ND)). (G) The regulated energy dissipation (Y(NPQ)). (H) The reduction status of PSI accept or side (Y(NA)). Each histogram represents a mean ± SE of four independent experiments (n = 4). Different letters indicate significant differences between treatments (p < 0.05) according to Duncan’s multiple range test.
Similar to Fv/Fm and Y(II), Pm and Y(I) increased under normal conditions and were notably higher after salt stress in CsTGaseOE plants compared with WT plants. Y(ND) showed a significant decrease in CsTGaseOE plants compared to that of the WT plants after salt stress (Figure 9F). In addition, Y(NA) showed a significant increase in CsTGaseOE leaves compared with those of the WT plants after salt stress (Figure 9H).
2.9. Effects of TGase on the Regulation of Photosynthesis Related Gene Expression
To analyze whether TGase is involved in affecting photosynthesis-related genes, we first examined the expression of photosynthesis-related genes in the WT and TGaseOE plants, such as PSII-related genes (NtpsbA/B/C/D/E), PSI-related genes (NtpsaA/B), ATP synthesis-related genes (NtatpA/B), Calvin cycle-related genes (NtrbcL/NtrbcS/NtFBPase) and cytochrome-related genes (NtpetA/B/D). As shown in Figure 10, the transcript levels of photosynthesis-related genes were higher in CsTGaseOE plants than the WT plants under normal conditions. We further analyzed the expression patterns of those genes in WT and CsTGaseOE plants after 7 days of salt stress. Except for NtpsbD, the transcript levels of these genes in WT and CsTGaseOE plants were suppressed under salt stress, but its levels in CsTGaseOE plants were still higher than those in the WT (Figure 10).
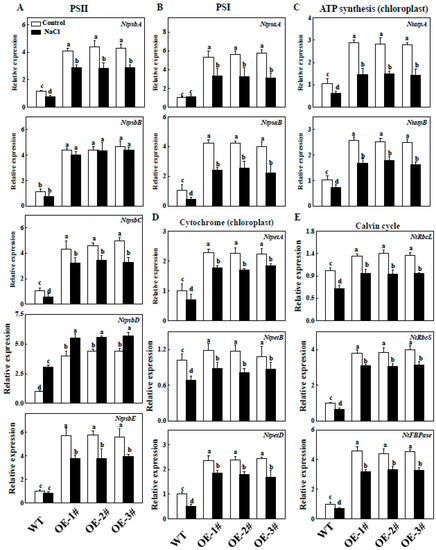
Figure 10.
Expression of PSII (A); PSI (B); Cytochrome (C); ATP synthesis (D); Calvin cycle-related genes (E) in WT and CsTGaseOE plants under salt stress. Each histogram represents a mean ± SE of four independent experiments (n = 4). Different letters indicate significant differences between treatments (p < 0.05) according to Duncan’s multiple range test.
To confirm these results, we monitored the differential changes of some photosynthesis proteins using western blot (WB). As shown in Figure 11, in agreement with the results of gene expression, the levels of D2 proteins in CsTGaseOE plants were significantly higher than that of WT plants under normal conditions. After 7 days of salt stress treatment, a significant reduction of D1, D2, and Cytf proteins was detected in the leaves of WT plants, but higher levels of these proteins were still present in the leaves of CsTGaseOE plants (Figure 11 and Figure S2). In addition, LHCA1, and LHCB1 had showed no significant differences in WT and CsTGaseOE plants before and after salt stress (Figure 11 and Figure S2).
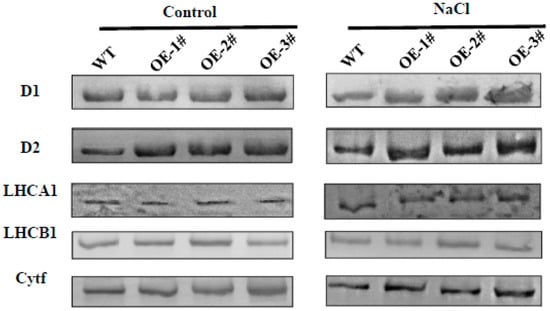
Figure 11.
Analysis of thylakoid membrane protein changes in WT and CsTGaseOE plants under salt stress. Thylakoid membrane proteins were separated by 12% SDS-urea-PAGE, transferred to PVDF membranes and probed with antisera against known thylakoid membrane proteins obtained from Agrisera company.
3. Discussion
CsTGase expression was dependent on light induction (Figure 1A), and CsTGase transcript levels increased with leaf development and aging, especially in mature and senescent leaves (Figure 1B,C), supporting the notion that TGase mainly functions in the senescence process [27]. Furthermore, cucumber TGase (CsTGase) was located not only in the chloroplast grana but also in the cell wall (Figure 2). These results indicate that TGase plays a vital role in early plant development.
Salt stress and other abiotic stresses can decrease photosynthetic capacity. Under salt conditions, plants overexpressing CsTGase showed enhanced salt tolerance displaying vigorous growth and higher Pn and Gs (Figure 3 and Figure 4), suggesting that this gene might be particularly involved in the salt stress response. Additionally, some photosynthesis-related genes such as NtpsbA, NtpsbB, NtpsbC, NtpsbD, NtpsbE, NtpsaA, NtpsaB, NtpetA, NtpetB, NtatpA, and NtatpB, had higher transcript levels in CsTGase overexpressing plants (Figure 10), suggesting that the improved tolerance of transgenic plants over-expressing CsTGase might result from regulation of photosynthetic systems. Further, identification of the regulation of photosynthetic systems and unraveling this regulatory network may shed light on the mechanism underlying CsTGase-dependent tolerance to salt stress.
Many reports have shown that PAs play critical roles in regulating plant responses to abiotic stresses such as salinity, high temperature, and cold stresses, which are related to changes in endogenous PA levels and gene modifications [25,28,29]. CsTGase overexpressing lines had higher PA contents than the WT under normal conditions (Figure 5). Moreover, the overexpression of CsTGase increased endogenous PA levels in chloroplasts compared with those of the WT under salt stress (Figure 5), indicating that TGase may play positive roles in PA-dependent pathways to enhance plant resistance to salt stress.
The salt stress induced serious changes in photochemical efficiency and was often associated with the suppression of PSII and PSI activity [30]. In the present study, salt stress resulted in a significant decline in Fv/Fm and based on the analysis of the OJIP curves, levels at J, I, and P transients were gradually decreased in WT plants under salt stress (Figure 7). This inhibition resulted in strong fluorescence and pronounced suppression of total fluorescence emission, indicating that salt stress reduced PSII and PSI electron transport. However, overexpression of CsTGase interrupted the decrease in the OJIP curves and Fm values (Figure 7). These results are consistent with the fact that TGase plays a critical role in photoprotection [31]. Electron microscopy revealed that CsTGase overexpression resulted in an increase in grana stacking (Figure 6). Moreover, salt stress induced more severe damage to the ultrastructure of chloroplast and thylakoids in WT plants compared with CsTGaseOE plants. Taken together, these results indicated that TGase plays a critical role in the protection of chloroplast under salt stress.
It was demonstrated that chlorophyll-a/b proteins (LHCII, CP29, CP26, and CP24) as substrates of TGase, as well as TGase itself, can catalyze the modification of light harvesting complex II by PAs in a light-dependent pathway [32,33]. However, the regulation of PSI through TGase has not been well studied. In this study, the decrease of Y(I) in the treated WT leaves resulted from the increase in the donor side limitation of PSI, as reflected by Y(ND), whereas the Y(ND) was not increased in the CsTGaseOE plants (Figure 9). This finding indicates that salt stress releases an excessive amount of light energy to PSI in WT plants but not in CsTGaseOE plants. The proportion of reduced electron carriers cannot be oxidized on the acceptor side of PSI by Y(NA) in WT plants, which is often used as an indicator of PSI photoinhibition. Our results showed that TGase could alleviate the salt stress caused the acceptor side limitation of PSI, as reflected by the higher value of Y(NA) in the CsTGaseOE plants under salt stress than in the WT plants. An increase in Y(NA) indicates an increasing acceptor side limitation [34]. This phenomenon indicates that TGase may play a positive role in PSI under salt stress.
Apart from the effect on photosystems, we also found that the Calvin cycle is regulated by CsTGase. Indeed, the upregulation of some Calvin cycle genes, such as NtRbcL and NtRbcS, were observed in CsTGaseOE plants under normal conditions. Furthermore, the expression of the NtFBPase gene was slightly enhanced in the leaves of CsTGaseOE plants (Figure 10). However, the expression of Calvin cycle-related genes was inhibited in WT and CsTGaseOE plants after salt stress, but these genes still maintained a high level in CsTGaseOE plants (Figure 10). Rubisco and FBPase are sensitive to oxidative stress, as salt stress has been shown to induce ROS accumulation [35]. Hence, we hypothesize that TGase may be involved in the downregulation of ROS accumulation by enhancing endogenous PA content, especially in chloroplasts, thereby protecting the photosynthetic organs and the Calvin cycle.
A number of previous studies have established the role of TGase in maintaining the activity of chloroplast-related proteins, which is associated with enhancement of PA conjugation to light harvesting complex II (LHCII) proteins [21]. Proteomic analysis revealed that some proteins of photosystems were substrates of TGase, such as, LHCII, CP29, CP26, and CP24 [36]. In this study, the D1 and D2 proteins were strongly accumulated in CsTGaseOE plants, while their levels were noticeably decreased in WT plants under salt stress. In addition, the LHCA1, LHCB1 and Cytf protein levels were not significantly different in WT and CsTGaseOE plants (Figure 11 and Figure S2). Taken together, these results suggest a critical role for TGase in maintaining protein stability under salt stress.
In summary, this study provides compelling evidence to support our assumption that TGase participates in the enhancement of salt tolerance by modulating photosynthetic proteins; the manipulation of endogenous TGase activity could increase PA levels to alleviate salt-induced photoinhibition in tobacco plants. Meanwhile, TGase increased the levels of chloroplast proteins and protected these proteins under salt stress. Therefore, TGase mediates the processing of PA biosynthesis and the protection of chloroplast proteins to enhance salt tolerance, thereby increasing the survival of plants under salt stress.
4. Materials and Methods
4.1. Cucumber Plant Materials and Treatments for Expression Analysis
The cucumber Cucumis sativus L. cv. 9930 genotype was used in the experiment. Seeds were germinated and grown in 250 cm3 plastic pots filled with peat. The plants were watered daily with Hoagland’s nutrition solution in the chamber. The growing conditions were as follows: 14/10 light/dark cycle, 28/22 °C day/night temperatures and 600 μmol m−2 s−1 photosynthetic photon flux density (PPFD).
To analyze the possible influence of light on gene expression, 30-day-old cucumber plants growing under the normal 16/8 h photoperiod, were incubated to a 24 h illumination period, with or without being previously subjected to 24 h darkness. Leaf samples were taken at 0, 4, 8, 12, and 24 h and during the continuous illumination period.
To analyze the tissue-specific expression of CsTGase, roots, stems, leaves, flowers and fruits were collected. Young, mature, and senescent leaves were collected. We also collected the leaves at 1 week, 2 weeks, 4 weeks, and 8 weeks during plant growth.
4.2. TEM Observations: Immunogold Transmission Electron Microscopy
Cucumber leaf sections were fixed, dehydrated, and embedded in Lowicryl K4M resin (Pelco International, Redding, CA, USA), following the previously described procedures [37]. A monoclonal antibody, anti-plant TGase (produced in rabbit; Univ-bio, Shanghai, China) at 1:1000 dilutions was used. A gold AffiniPure anti rabbit IgG was used as a secondary antibody. For electron microcopy, a Jeol-JEM-1010 transmission electron microscope operating at 80 kV.
4.3. Generation and Selection of Transgenic Plants
To obtain the cucumber TGase overexpression (TGaseOE) construct, the 1836 bp full-length coding DNA sequence (CDS) was amplified with the primer TGaseOE-F (5′-CGAGCTCATGGATGATCGTGAGGCGTTTAAGA-3′) and TGaseOE-R (5′-CGGGGTACCACGTTGCATGCAATTCCCGTAG-3′) using cucumber cDNA as the template. The PCR product was digested with SacI and KpnI and inserted behind the CaMV 35S promoter in the binary vector pCAMBIA1301-GUS. The TGaseOE-GUS plasmid was transformed into Agrobacterium tumefaciens strain EHA105. NC89 tobacco plants were used for transformation, as described by Horsch [38].
4.4. Salt Tolerance Analysis of the Transgenic Plants
Three-week-old plants grown in vermiculite were treated with 200 mM NaCl for 7 days, and leaves were used to measure the biomass, proline content, and chlorophyll content. For biomass measurements, plants were dried for 48 h at 75 °C and then weighed. The proline content was measured according to Bates et al. [39]. The chlorophyll content was measured by UV spectrophotometry as described by Yang et al. [40].
Three-week-old plants grown in vermiculite were treated with 200 mM NaCl for 14 days, and the leaves were used to measure the photosynthetic parameters. The net photosynthetic rate (Pn), intercellular CO2 concentration (Ci), and stomatal conductance (Gs) were measured according to Zhang et al. [41].
To avoid light impact on the TGase activity and PA content, potted plants in the experimental field were exposed to a 14/10 light/dark cycle. Then, we collected the samples and measured photosynthetic parameters at 12 h of illumination.
4.5. Thylakoid Isolation
Thylakoids were isolated as previously described with minor modifications [13]. Intact chloroplasts from the fully expanded leaves were homogenized in 50 mM KCl, 1 mM MgCl2, 1 mM MnCl2, 1 mM EDTA, 0.5 mM KH2PO4, 25 mM HEPES, pH 7.6, 330 mM sorbitol, 10 μM sodium ascorbate, and 0.2% (w/w) bovine serum albumin. The homogenates were filtered through a 300-μm and then 100-μm nylon mesh and debris was removed by centrifugation at 300× g for 1 min, followed by centrifugation at 4000× g for 10 min to collect the thylakoids. The pellet was separated from starch, resuspended and washed in 7 mM MgCl2, 10 mM KCl, and 25 mM HEPES, pH 7.6 to break intact chloroplasts and removed free polyamines. Finally, for the polyamine analysis, thylakoids were resuspended in the medium containing 7 mM MgCl2, 50 mM KCl, 25 mM HEPES, pH 7.6 and 330 mM sorbitol.
4.6. Analysis of Endogenous Polyamines in Thylakoid Membranes
The contents of endogenous PAs in thylakoid membranes were analyzed according to a method described by Zhang et al. [41] with some modifications. Briefly, for polyamine analysis, isolated thylakoids were incubated in 1.6 mL of 5% (w/v) cold perchloric acid (PCA) for 1 h on ice. After centrifugation for 20 min at 12,000× g, the pellet was used to determine bound PAs. PAs were analyzed using a high-performance liquid chromatography with a 1200 series system (Agilent Technologies, Santa Clara, CA, USA), a C18 reversed-phase column (4.6 mm by 250 mm, 5 μm Kromasil) and a two solvent system including a methanol gradient (36%–64%, v/v) at a flow rate of 0.8 mL min−1.
4.7. Observation of the Ultrastructure of the Chloroplast
Tobacco leaves were collected and cut into pieces of approximately 1 mm2 and fixed by vacuum infiltration with 3% glutaraldehyde and 1% formaldehyde in a 0.1 M phosphate buffer (pH 7.4) for 2 h (primary fixation). After washing, the sample were fixed for 2 h in osmium tetroxide at room temperature; then, the samples were dehydrated in acetone and embedding in Durcupan ACM, Ultrathin sections of the leaf pieces (70 nm) were cut, stained with uranium acetate and lead citrate in series and examined using a H7650 transmission electron microscope (Hitachi, Tokyo, Japan) at an accelerating voltage of 80 kV. A minimum of 50 chloroplasts of each type of plant were examined.
4.8. Chl a fluorescence Measurement and OJIP Transient Analyses
The chlorophyll a (Chl a) fluorescence induction kinetics were measured at 12 h of illumination using dual portable fluorescence (Dual-PAM-100, Walz, Germany). Measurements were analyzed using the automated induction program provided by the Dual-PAM software. PSII and PSI activities were quantified by chlorophyll fluorescence and P700+ absorbance changes.
The OJIP curves showed a polyphasic rise. The initial fluorescence (F0) (approx. 50 μs) was set as O, followed by the O to J phase (ends at approx. 2 ms), then the J to I phase (ends at approx. 30 ms) and I to P phase (at the peak of the OJIP curve). The JIP measurement is named after the basic steps in fluorescence transience when plotted on a logarithmic time scale [42]. Leaves were dark adapted for 30 min prior to the measurement or the NPQ measurement leaves were continuously illuminated for 270 s with 500 μmol photons m−2 s−1 using the Handy-PEA (multihit- mode). Every 30 s was given a 3000 μmol photons m−2 s−1 (duration 0.8 s) saturating pulse for maximal fluorescence, Fm′. To calculate the NPQ at the end of the actinic light phase we followed the equation, NPQ = Fm/ Fm′ − 1 [43]. The tests were shown in the middle portion of infiltration on the ventral surface of the leaves. Measurements were taken in 6 replications.
4.9. Quantitative Real-Time PCR
Total RNA was extracted from three biological replicates of leaves using an RNA extraction kit (Tiangen, Beijing, China) according to the manufacturer’s instructions. The first strand cDNA was synthesized from 1 μg of DNase-treated RNA using reverse transcriptase (Takara, Dalian, China) following the manufacturer’s protocol. Quantitative real-time PCR (qPCR) was using gene specific primers (Table S1) in 20 μL reaction system using SYBR Premix Ex Taq II (Takara, Dalian, China). Tobacco β-actin was used as a reference gene for tobacco; cucumber actin was used as a reference gene for cucumber. Relative gene expression was calculated according to Livak and Schmittgen [44].
4.10. Protein Extraction and Western Blotting
For the thylakoid membranes, the intact chloroplasts were reputed in low osmotic buff (50 mM HEPES–KOH (pH 7.6) and 2 mM MgCl2) on the ice, then the thylakoid membranes were collected and the protein content was determined by a BCA Protein Assay Kit (Solarbio, Beijing, China). For immunoblot analysis, thylakoid proteins were solubilized and separated on 12% SDS-urea-PAGE gels. After electrophoresis, the proteins were transferred to polyvinylidene difluoride (PVDF) membranes (Millipore, Billerica, MA, USA) and probed using commercial antibodies specific for the PSII subunits (D1 and D2) (AS05084 and AS06146), light-harvesting antenna proteins (LHCA1 and LHCB1) (AS01005 and AS01004) and Cytb6f subunit (Cytf) (AS14169), at 1:5000 dilutions were used. These antibodies were from Agrisera (Vännäs, Sweden). At least three independent replicates were used for each determination. Accumulation of proteins were quantified using Quantity One software (Bio-Rad, Hercules, California, CA, USA).
4.11. Statistical Analysis
At least 4 independent replicates were used for each determination. Statistical analysis of the bioassays was performed using the SPSS 20 statistical package (SPSS Inc., Chicago, IL, USA). Experimental data were analyzed with a Duncan’s multiple range test at p < 0.05.
Supplementary Materials
Supplementary materials can be found at http://www.mdpi.com/1422-0067/20/4/894/s1. Figure S1: The granum height of TGase in each transgenic line. Figure S2: The relative intensity of thylakoid membrane protein changes in WT and CsTGaseOE plants under salt stress. Table S1: Sequences of primers used for qPCR assays.
Author Contributions
S.G. designed the research and proposed the research proceeding. M.Z. and Y.W. performed the experiments and wrote the main manuscript text. Y.Z. prepared all figures and modified this manuscript until submit. S.S. and J.S. improved the manuscript. All authors reviewed and approved the manuscript.
Funding
This work was supported by the National Natural Science Foundation of China (31672199 and 31801902), the China Earmarked Fund for Modern Agro-industry Technology Research System (CARS-23-B12).
Conflicts of Interest
The authors declare no conflict of interests.
References
- Ioannidis, N.E.; Kotzabasis, K. Polyamines in chemiosmosis in vivo: A cunning mechanism for the regulation of ATP synthesis during growth and stress. Front. Plant Sci. 2014, 5, 71. [Google Scholar] [CrossRef] [PubMed]
- Yang, Y.; Guo, Y. Unraveling salt stress signaling in plants. J. Integr. Plant Biol. 2018, 60, 796–804. [Google Scholar] [CrossRef] [PubMed]
- Zhou, H.; Guo, S.; An, Y.; Shan, X.; Wang, Y.; Shu, S.; Sun, J. Exogenous spermidine delays chlorophyll metabolism in cucumber leaves (Cucumis sativus L.) under high temperature stress. Acta Physiol. Plant. 2016, 38, 224. [Google Scholar] [CrossRef]
- Shu, S.; Yuan, Y.; Chen, J.; Sun, J.; Zhang, W.; Tang, Y.; Zhong, M.; Guo, S. The role of putrescine in the regulation of proteins and fatty acids of thylakoid membranes under salt stress. Sci. Rep. 2015, 5, 14390. [Google Scholar] [CrossRef] [PubMed]
- Sagor, G.H.M.; Zhang, S.; Kojima, S.; Simm, S.; Berberich, T.; Kusano, T. Reducing cytoplasmic polyamine oxidase activity in Arabidopsis increases salt and drought tolerance by reducing reactive oxygen species production and increasing defense gene expression. Front. Plant Sci. 2016, 7, 214. [Google Scholar] [CrossRef] [PubMed]
- Bortolotti, C.; Cordeiro, A.; Alcázar, R.; Borrell, A.; Culiañez-Macià, F.A.; Tiburcio, A.F.; Altabella, T. Localization of arginine decarboxylase in tobacco plants. Physiol. Plant. 2004, 120, 84–92. [Google Scholar] [CrossRef] [PubMed]
- Del Duca, S.; Serafini-Fracassini, D.; Cai, G. Senescence and programmed cell death in plants: Polyamine action mediated by transglutaminase. Front. Plant Sci. 2014, 5, 120. [Google Scholar] [CrossRef] [PubMed]
- Serafini-Fracassini, D.; Del Duca, S.; D’Orazi, D. First evidence for polyamine conjugation mediated by an enzymic activity in plants. Plant Physiol. 1988, 87, 757–761. [Google Scholar] [CrossRef]
- Tiburcio, A.F.; Altabella, T.; Bitrián, M.; Alcázar, R. The roles of polyamines during the lifespan of plants: From development to stress. Planta 2014, 240, 1–18. [Google Scholar] [CrossRef] [PubMed]
- Sfichi, L.; Loannidis, N.; Kotzabasis, K. Thylakoid-associated polyamines adjust the UV-B sensitivity of the photosynthetic apparatus by means of light-harvesting complex II changes. Photochem. Photobiol. 2004, 80, 499–506. [Google Scholar] [CrossRef]
- Demetriou, G.; Neonaki, C.; Navakoudis, E.; Kotzabasis, K. Salt stress impact on the molecular structure and function of the photosynthetic apparatus—The protective role of polyamines. Biochim. Biophys. Acta 2007, 1767, 272–280. [Google Scholar] [CrossRef]
- Dondini, L.; Del Duca, S.; Dall’Agata, L.; Bassi, R.; Gastaldelli, M.; Della Mea, M.; Di Sandro, A.; Claparols, I.; Serafini-Fracassini, D. Suborganellar localisation and effect of light on Helianthus tuberosus chloroplast transglutaminases and their substrates. Planta 2003, 217, 84–95. [Google Scholar] [PubMed]
- Shu, S.; Yuan, L.-Y.; Guo, S.-R.; Sun, J.; Yuan, Y.-H. Effects of exogenous spermine on chlorophyll fluorescence, antioxidant system and ultrastructure of chloroplasts in Cucumis sativus L. under salt stress. Plant Physiol. Biochem. 2013, 63, 209–216. [Google Scholar] [CrossRef] [PubMed]
- Hamdani, S.; Yaakoubi, H.; Carpentier, R. Polyamines interaction with thylakoid proteins during stress. J. Photochem. Photobiol. 2011, 104, 314–319. [Google Scholar] [CrossRef] [PubMed]
- Ioannidis, N.E.; Cruz, J.A.; Kotzabasis, K.; Kramer, D.M. Evidence that putrescine modulates the higher plant photosynthetic proton circuit. PLoS ONE 2012, 7, e29864. [Google Scholar] [CrossRef]
- Ioannidis, N.E.; Ortigosa, S.M.; Veramendi, J.; Pintó-Marijuan, M.; Fleck, I.; Carvajal, P.; Kotzabasis, K.; Santos, M.; Torné, J.M. Remodeling of tobacco thylakoids by over-expression of maize plastidial transglutaminase. Biochim. Biophys. Acta 2009, 1787, 1215–1222. [Google Scholar] [CrossRef] [PubMed]
- Serafini-Fracassini, D.; Del Duca, S. Transglutaminases: Widespread cross-linking enzymes in plants. Ann. Bot. 2008, 102, 145–152. [Google Scholar] [CrossRef]
- Lilley, G.R.; Skill, J.; Griffin, M.; Bonner, P.L. Detection of Ca2+-dependent transglutaminase activity in root and leaf tissue of monocotyledonous and dicotyledonous plants. Plant Physiol. 1998, 117, 1115–1123. [Google Scholar] [CrossRef][Green Version]
- Della Mea, M.; Caparrós-Ruiz, D.; Claparols, I.; Serafini-Fracassini, D.; Rigau, J. AtPng1p. The first plant transglutaminase. Plant Physiol. 2004, 135, 2046–2054. [Google Scholar] [CrossRef]
- Del Duca, S.; Faleri, C.; Iorio, R.A.; Cresti, M.; Serafini-Fracassini, D.; Cai, G. Distribution of transglutaminase in pear pollen tubes in relation to cytoskeleton and membrane dynamics. Plant Physiol. 2013, 161, 1706–1721. [Google Scholar] [CrossRef]
- Del Duca, S.; Tidu, V.; Bassi, R.; Esposito, C.; Serafmi-Fracassini, D. Identification of chlorophyll-a/b proteins as substrates of transglutaminase activity in isolated chloroplasts of Helianthus tuberosus L. Planta 1994, 193, 283–289. [Google Scholar] [CrossRef]
- Campos, N.; Castañón, S.; Urreta, I.; Santos, M.; Torné, J. Rice transglutaminase gene: Identification, protein expression, functionality, light dependence and specific cell location. Plant Sci. 2013, 205, 97–110. [Google Scholar] [CrossRef] [PubMed]
- Villalobos, E.; Santos, M.; Talavera, D.; Rodrıguez-Falcón, M.; Torné, J. Molecular cloning and characterization of a maize transglutaminase complementary DNA. Gene 2004, 336, 93–104. [Google Scholar] [CrossRef] [PubMed]
- Duan, J.; Li, J.; Guo, S.; Kang, Y. Exogenous spermidine affects polyamine metabolism in salinity-stressed Cucumis sativus roots and enhances short-term salinity tolerance. J. Plant Physiol. 2008, 165, 1620–1635. [Google Scholar] [CrossRef] [PubMed]
- Sang, Q.; Shan, X.; An, Y.; Shu, S.; Sun, J.; Guo, S. Proteomic analysis reveals the positive effect of exogenous spermidine in tomato seedlings’ response to high-temperature stress. Front. Plant Sci. 2017, 8, 120. [Google Scholar] [CrossRef] [PubMed]
- Tang, Y.-Y.; Yuan, Y.-H.; Shu, S.; Guo, S.-R. Regulatory mechanism of NaCl stress on photosynthesis and antioxidant capacity mediated by transglutaminase in cucumber (Cucumis sativus L.) seedlings. Sci. Hortic. 2018, 235, 294–306. [Google Scholar] [CrossRef]
- Sobieszczuk-Nowicka, E.; Zmienko, A.; Samelak-Czajka, A.; Łuczak, M.; Pietrowska-Borek, M.; Iorio, R.; Del Duca, S.; Figlerowicz, M.; Legocka, J. Dark-induced senescence of barley leaves involves activation of plastid transglutaminases. Amino Acids 2015, 47, 825–838. [Google Scholar] [CrossRef]
- Yuan, Y.; Zhong, M.; Shu, S.; Du, N.; Sun, J.; Guo, S. Proteomic and physiological analyses reveal putrescine responses in roots of cucumber stressed by NaCl. Front. Plant Sci. 2016, 7, 1035. [Google Scholar] [CrossRef]
- Zhuo, C.; Liang, L.; Zhao, Y.; Guo, Z.; Lu, S. A cold responsive ethylene responsive factor from Medicago falcata confers cold tolerance by up-regulation of polyamine turnover, antioxidant protection, and proline accumulation. Plant Cell Environ. 2018, 41, 2021–2032. [Google Scholar] [CrossRef]
- Oukarroum, A.; Bussotti, F.; Goltsev, V.; Kalaji, H.M. Correlation between reactive oxygen species production and photochemistry of photosystems I and II in Lemna gibba L. plants under salt stress. Environ. Exp. Bot. 2015, 109, 80–88. [Google Scholar] [CrossRef]
- Ioannidis, N.E.; Malliarakis, D.; Torné, J.M.; Santos, M.; Kotzabasis, K. The over-expression of the plastidial transglutaminase from maize in Arabidopsis increases the activation threshold of photoprotection. Front. Plant Sci. 2016, 7, 635. [Google Scholar] [CrossRef] [PubMed]
- Del Duca, S.; Tidu, V.; Bassi, R.; Serafini-Fracassini, D.; Esposito, C. Identification of transglutaminase activity and its substrates in isolated chloroplast of Helianthus tuberosus. Planta 1994, 193, 283–289. [Google Scholar] [CrossRef]
- Sobieszczuk-Nowicka, E.; Krzesłowska, M.; Legocka, J. Transglutaminases and their substrates in kinetin-stimulated etioplast-to-chloroplast transformation in cucumber cotyledons. Protoplasma 2008, 233, 187. [Google Scholar] [CrossRef] [PubMed]
- Huang, W.; Yang, S.-J.; Zhang, S.-B.; Zhang, J.-L.; Cao, K.-F. Cyclic electron flow plays an important role in photoprotection for the resurrection plant Paraboearufescens under drought stress. Planta 2012, 235, 819–828. [Google Scholar] [CrossRef] [PubMed]
- Miller, G.; Suzuki, N.; Ciftci-Yilmaz, S.; Mittler, R. Reactive oxygen species homeostasis and signalling during drought and salinity stresses. Plant Cell Environ. 2010, 33, 453–467. [Google Scholar] [CrossRef] [PubMed]
- Campos, A.; Carvajal-Vallejos, P.; Villalobos, E.; Franco, C.; Almeida, A.; Coelho, A.; Torné, J.; Santos, M. Characterisation of Zea mays L. plastidial transglutaminase: Interactions with thylakoid membrane proteins. Plant Biol. 2010, 12, 708–716. [Google Scholar] [CrossRef] [PubMed]
- Campos, N.; Villalobos, E.; Fontanet, P.; Torné, J.M.; Santos, M. A peptide of 17 aminoacids from the N-terminal region of maize plastidial transglutaminase is essential for chloroplast targeting. Am. J. Mol. Biol. 2012, 2, 245–257. [Google Scholar] [CrossRef]
- Horsch, R.B.; Fry, J.E.; Hoffmann, N.L.; Eichholtz, D.; Rogers, S.G.; Fraley, R.T. A simple and general-method for transferring genes into plants. Science 1985, 227, 1229–1231. [Google Scholar]
- Bates, L.; Waldren, R.; Teare, I. Rapid determination of free proline for water-stress studies. Plant Soil 1973, 39, 205–207. [Google Scholar] [CrossRef]
- Yang, Q.; Chen, Z.-Z.; Zhou, X.-F.; Yin, H.-B.; Li, X.; Xin, X.-F.; Hong, X.-H.; Zhu, J.-K.; Gong, Z. Overexpression of SOS (Salt Overly Sensitive) genes increases salt tolerance in transgenic Arabidopsis. Mol. Plant 2009, 2, 22–31. [Google Scholar] [CrossRef]
- Zhang, R.H.; Li, J.; Guo, S.R.; Tezuka, T. Effects of exogenous putrescine on gas-exchange characteristics and chlorophyll fluorescence of NaCl-stressed cucumber seedlings. Photosynth. Res. 2009, 100, 155–162. [Google Scholar] [CrossRef] [PubMed]
- Force, L.; Critchley, C.; van Rensen, J.J. New fluorescence parameters for monitoring photosynthesis in plants. Photosynth. Res. 2003, 78, 17. [Google Scholar] [CrossRef] [PubMed]
- Bilger, W.; Björkman, O. Relationships among violaxanthin deepoxidation, thylakoid membrane conformation, and nonphotochemical chlorophyll fluorescence quenching in leaves of cotton (Gossypium hirsutum L.). Planta 1994, 193, 238–246. [Google Scholar] [CrossRef]
- Livak, K.J.; Schmittgen, T.D. Analysis of relative gene expression data using real-time quantitative PCR and the 2−ΔΔCT method. Methods 2001, 25, 402–408. [Google Scholar] [CrossRef] [PubMed]
© 2019 by the authors. Licensee MDPI, Basel, Switzerland. This article is an open access article distributed under the terms and conditions of the Creative Commons Attribution (CC BY) license (http://creativecommons.org/licenses/by/4.0/).