The Impact of p53 on Aristolochic Acid I-Induced Gene Expression In Vivo


Abstract
1. Introduction
2. Results
2.1. Gene Expression Analysis
- Which genes and pathways are modulated by AAI treatment in kidneys of Trp53(+/+), Trp53(+/-), and Trp53(-/-) mice?
- Which genes and pathways are commonly and differentially altered between AAI-exposed Trp53(+/+), Trp53(+/-), and Trp53(-/-) kidneys?
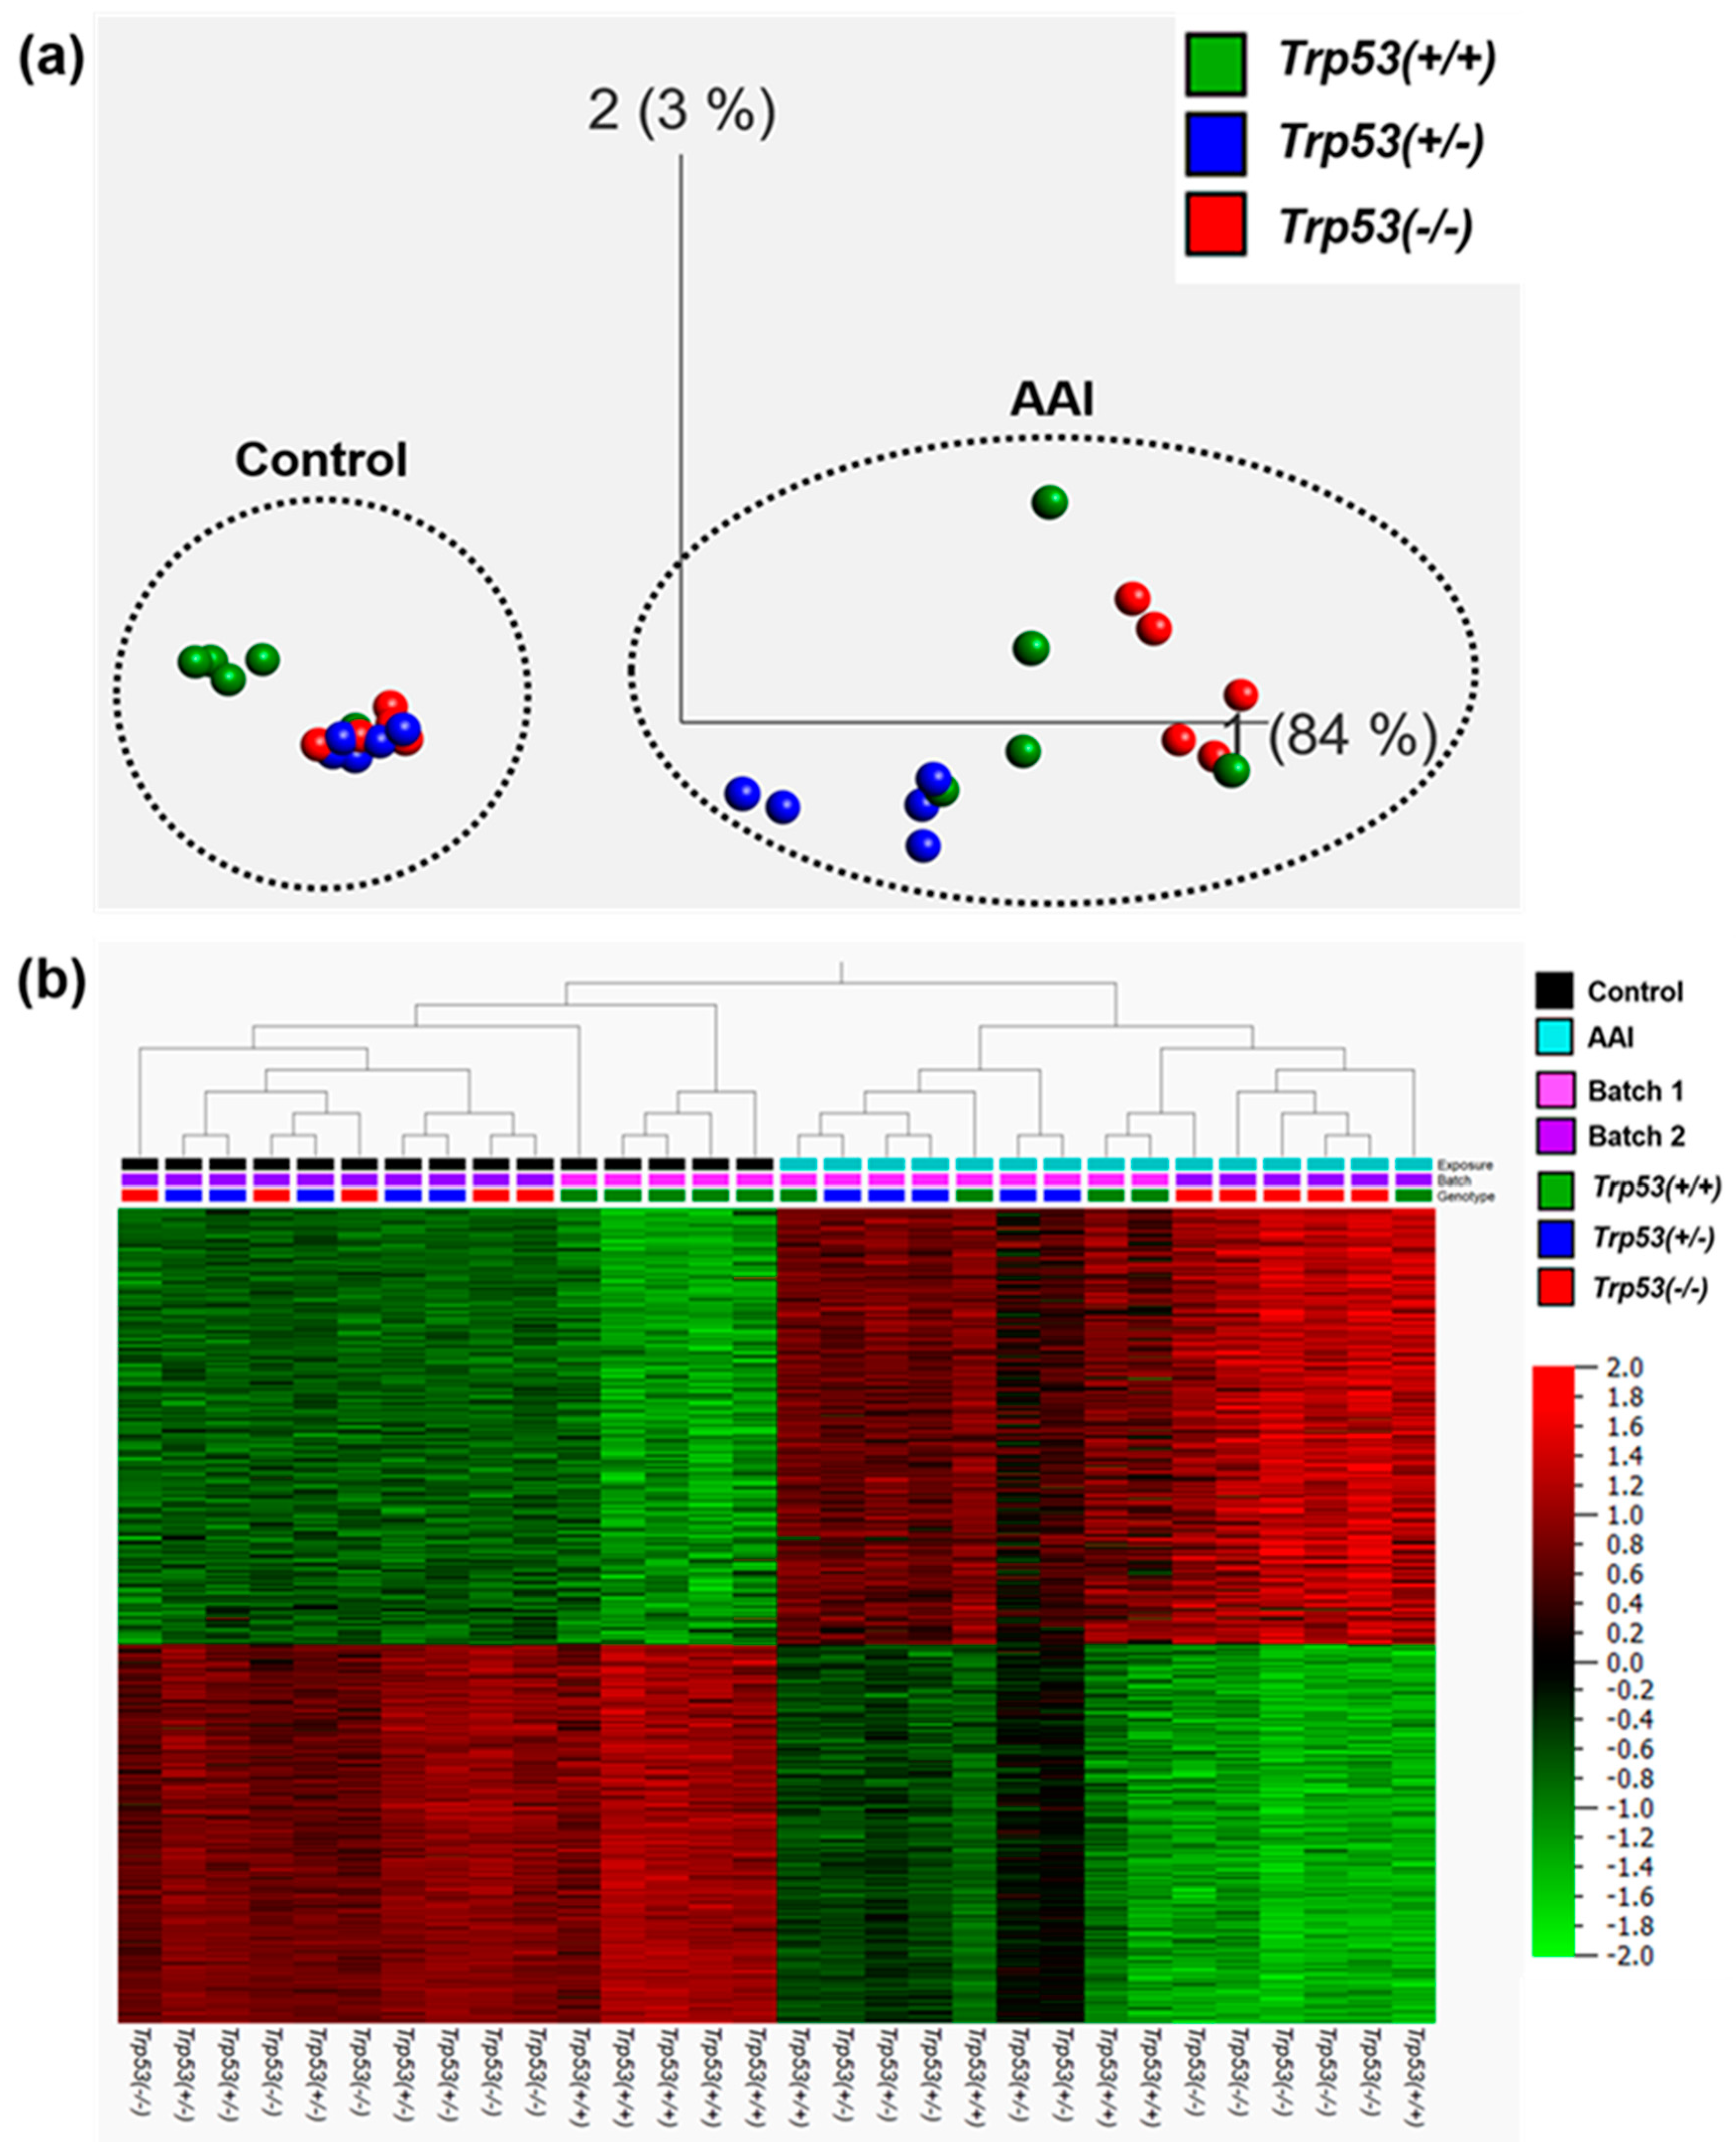
2.2. The Impact of Trp53 Genotype on AAI-Induced Gene Expression In Vivo
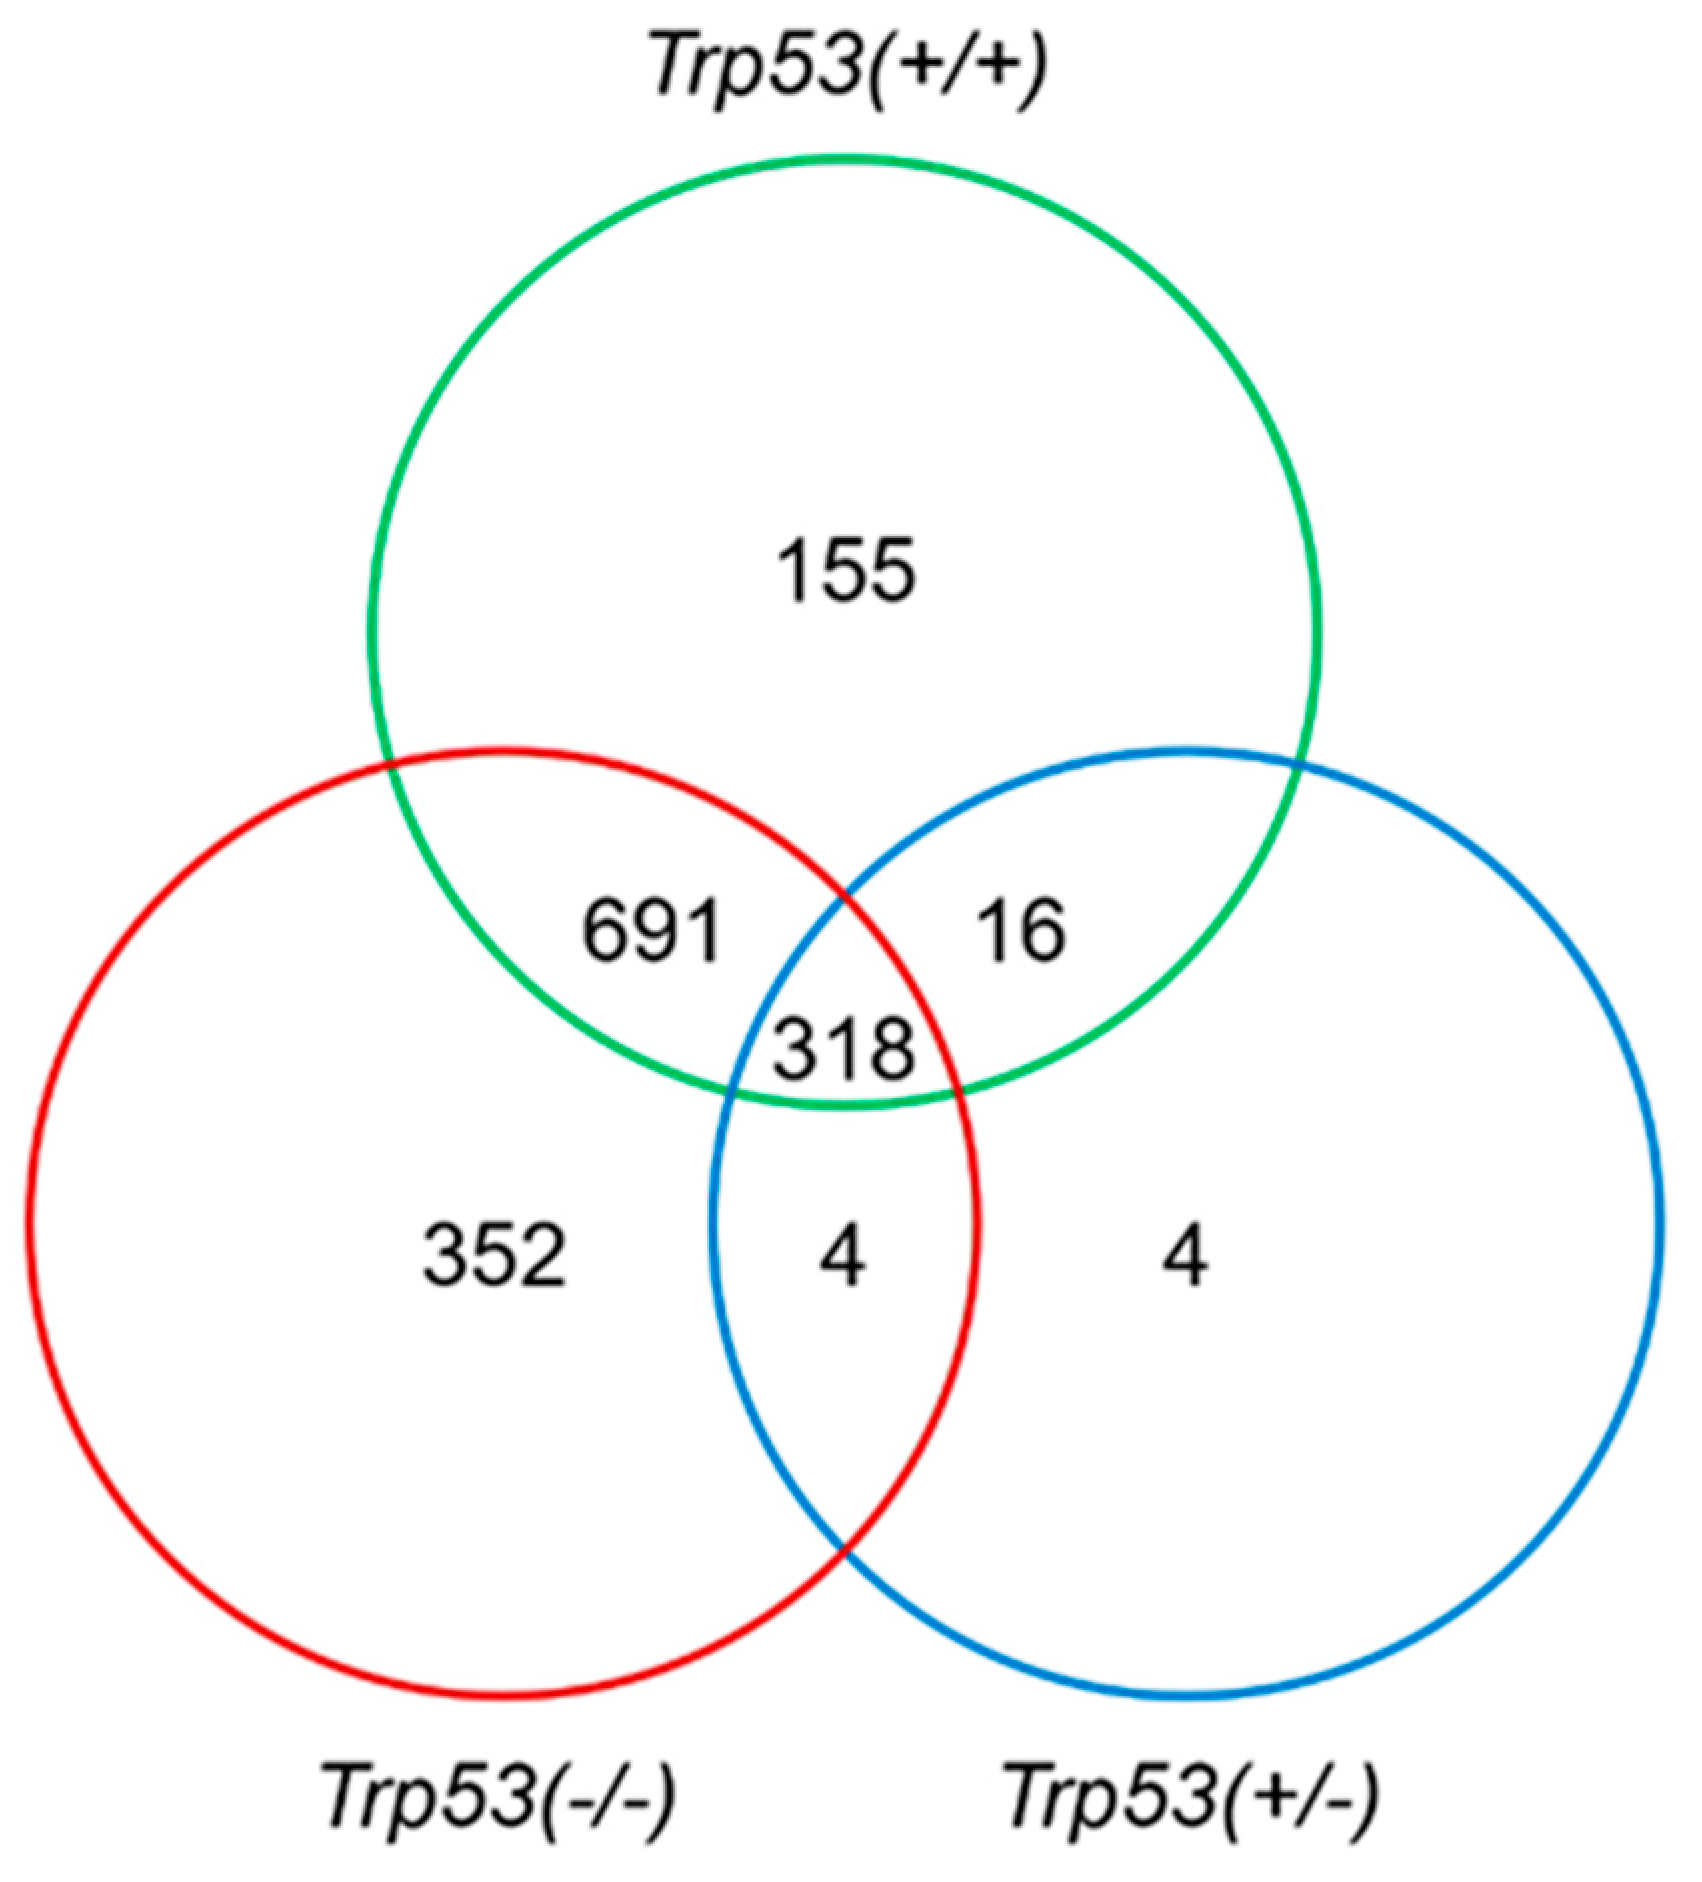
2.3. Genes Modulated by AAI Treatment in Trp53(+/+), Trp53(+/-), and Trp53(-/-) Kidneys
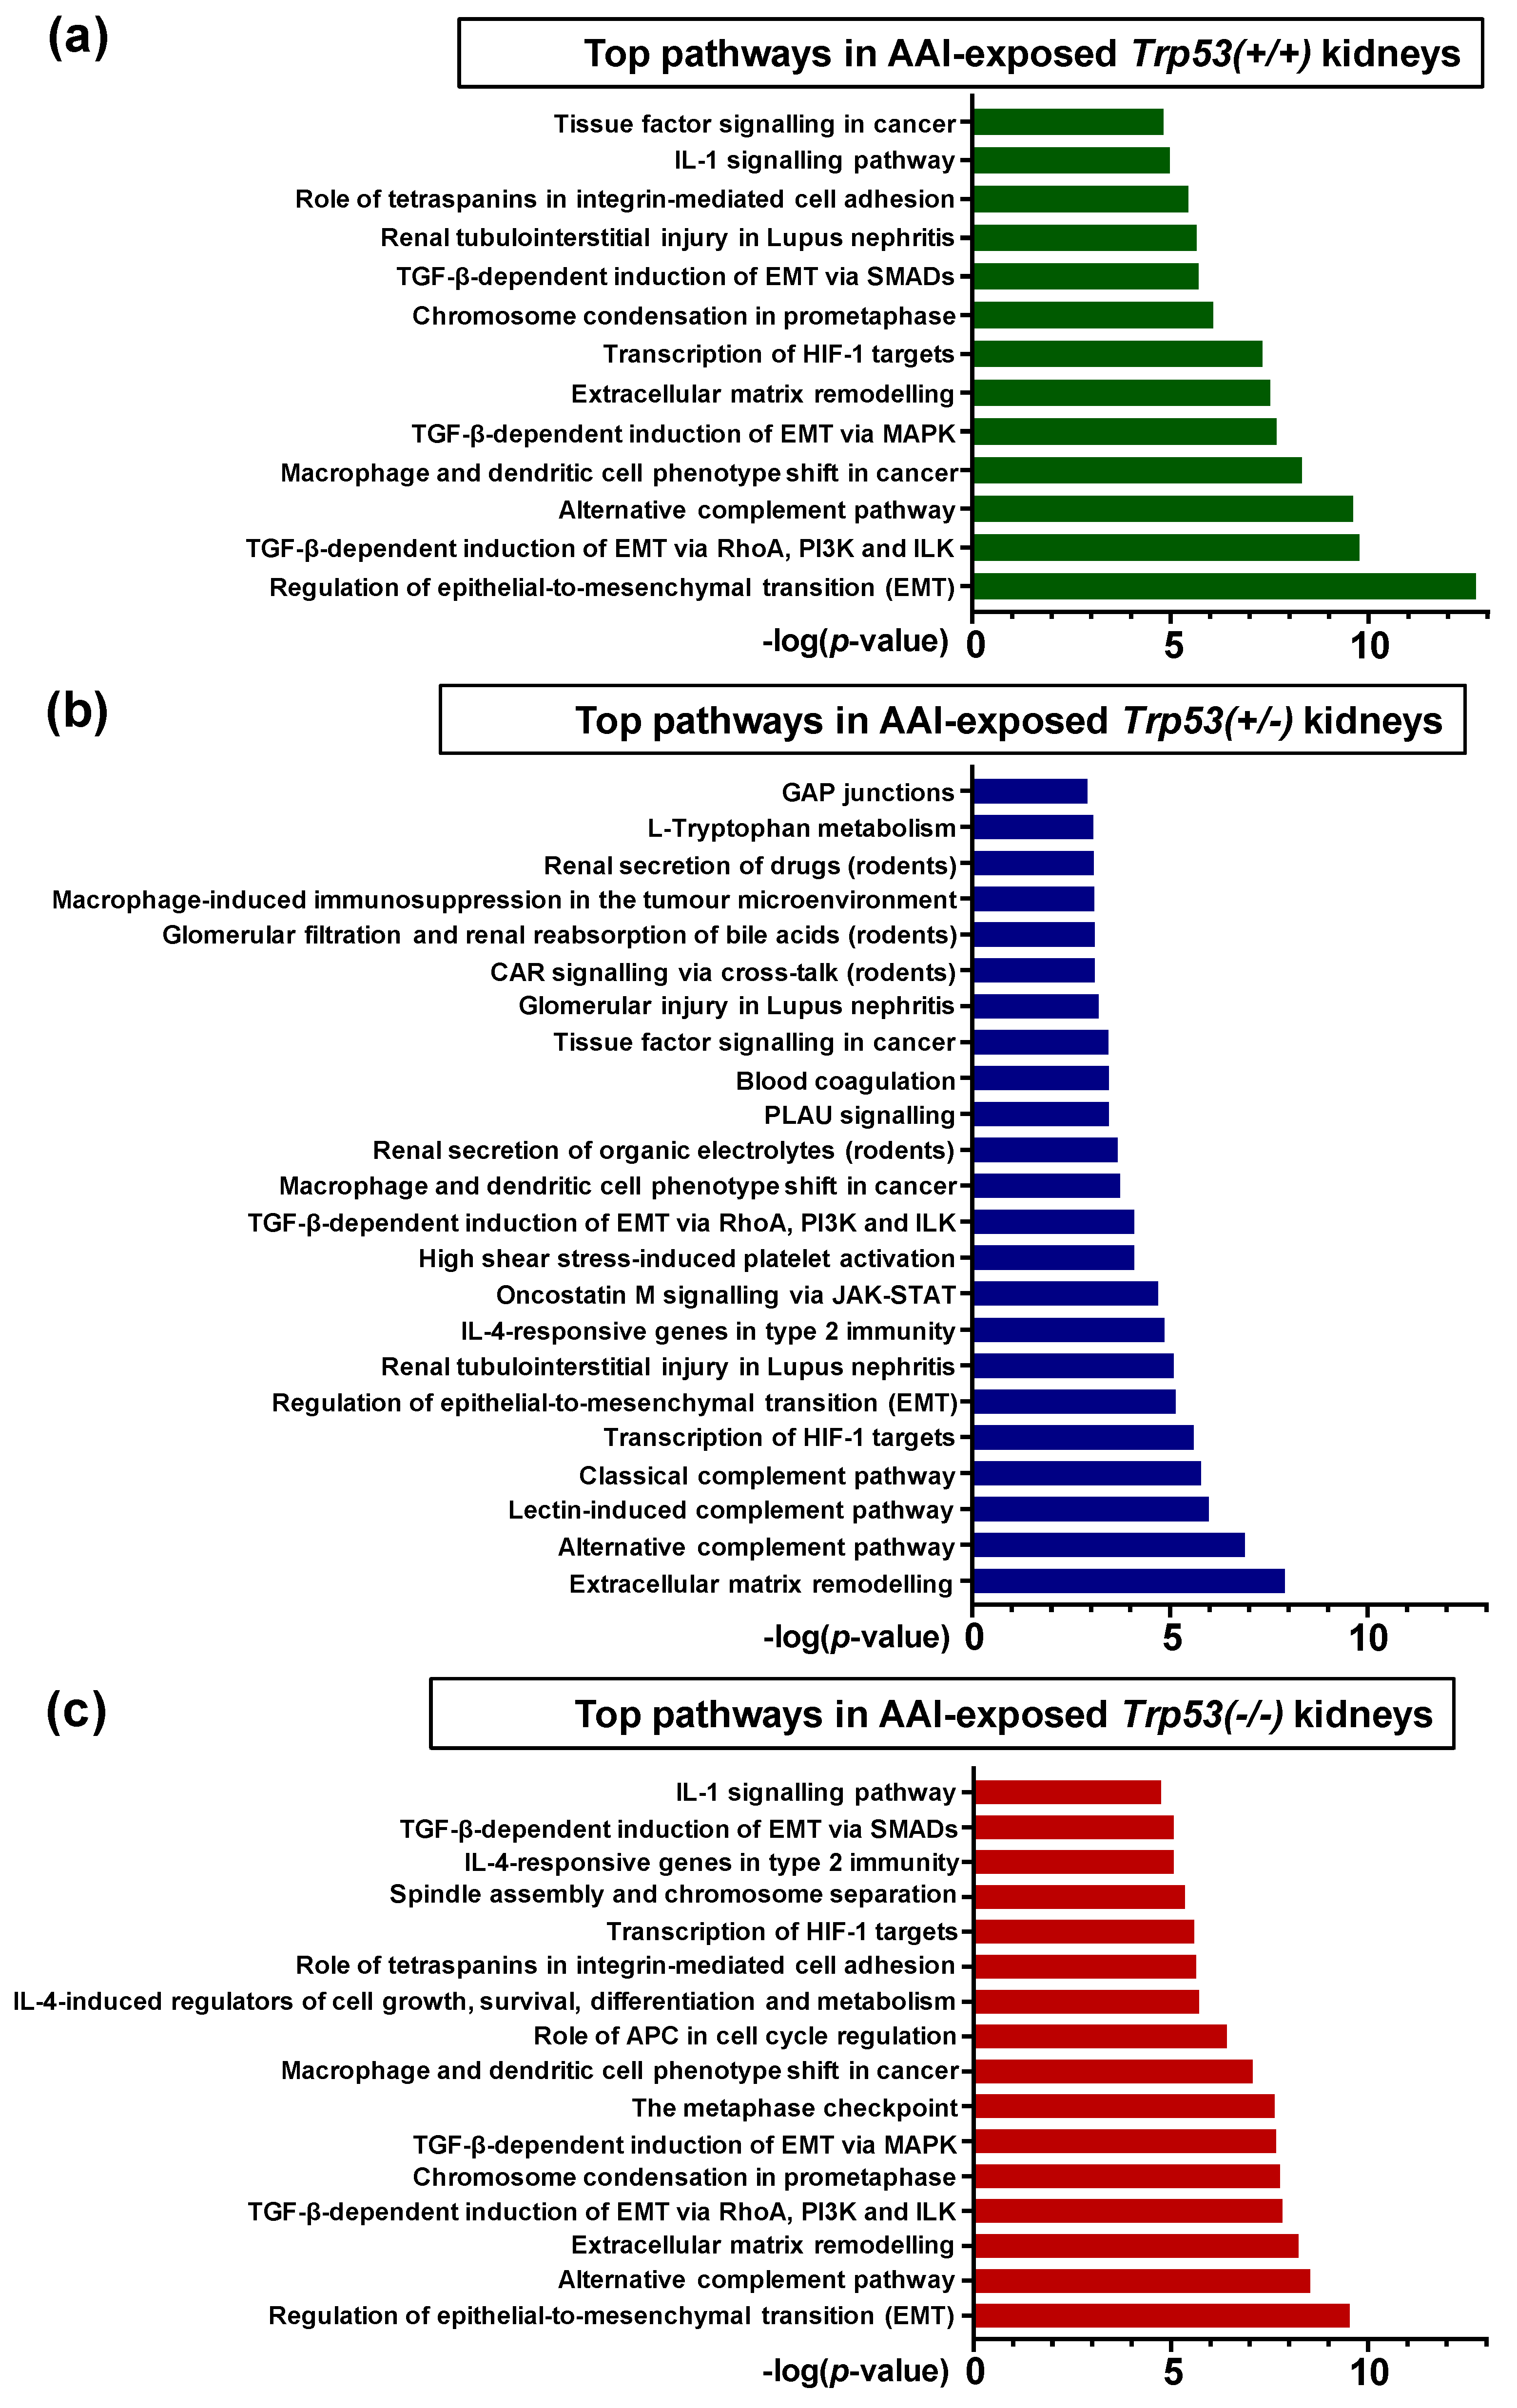
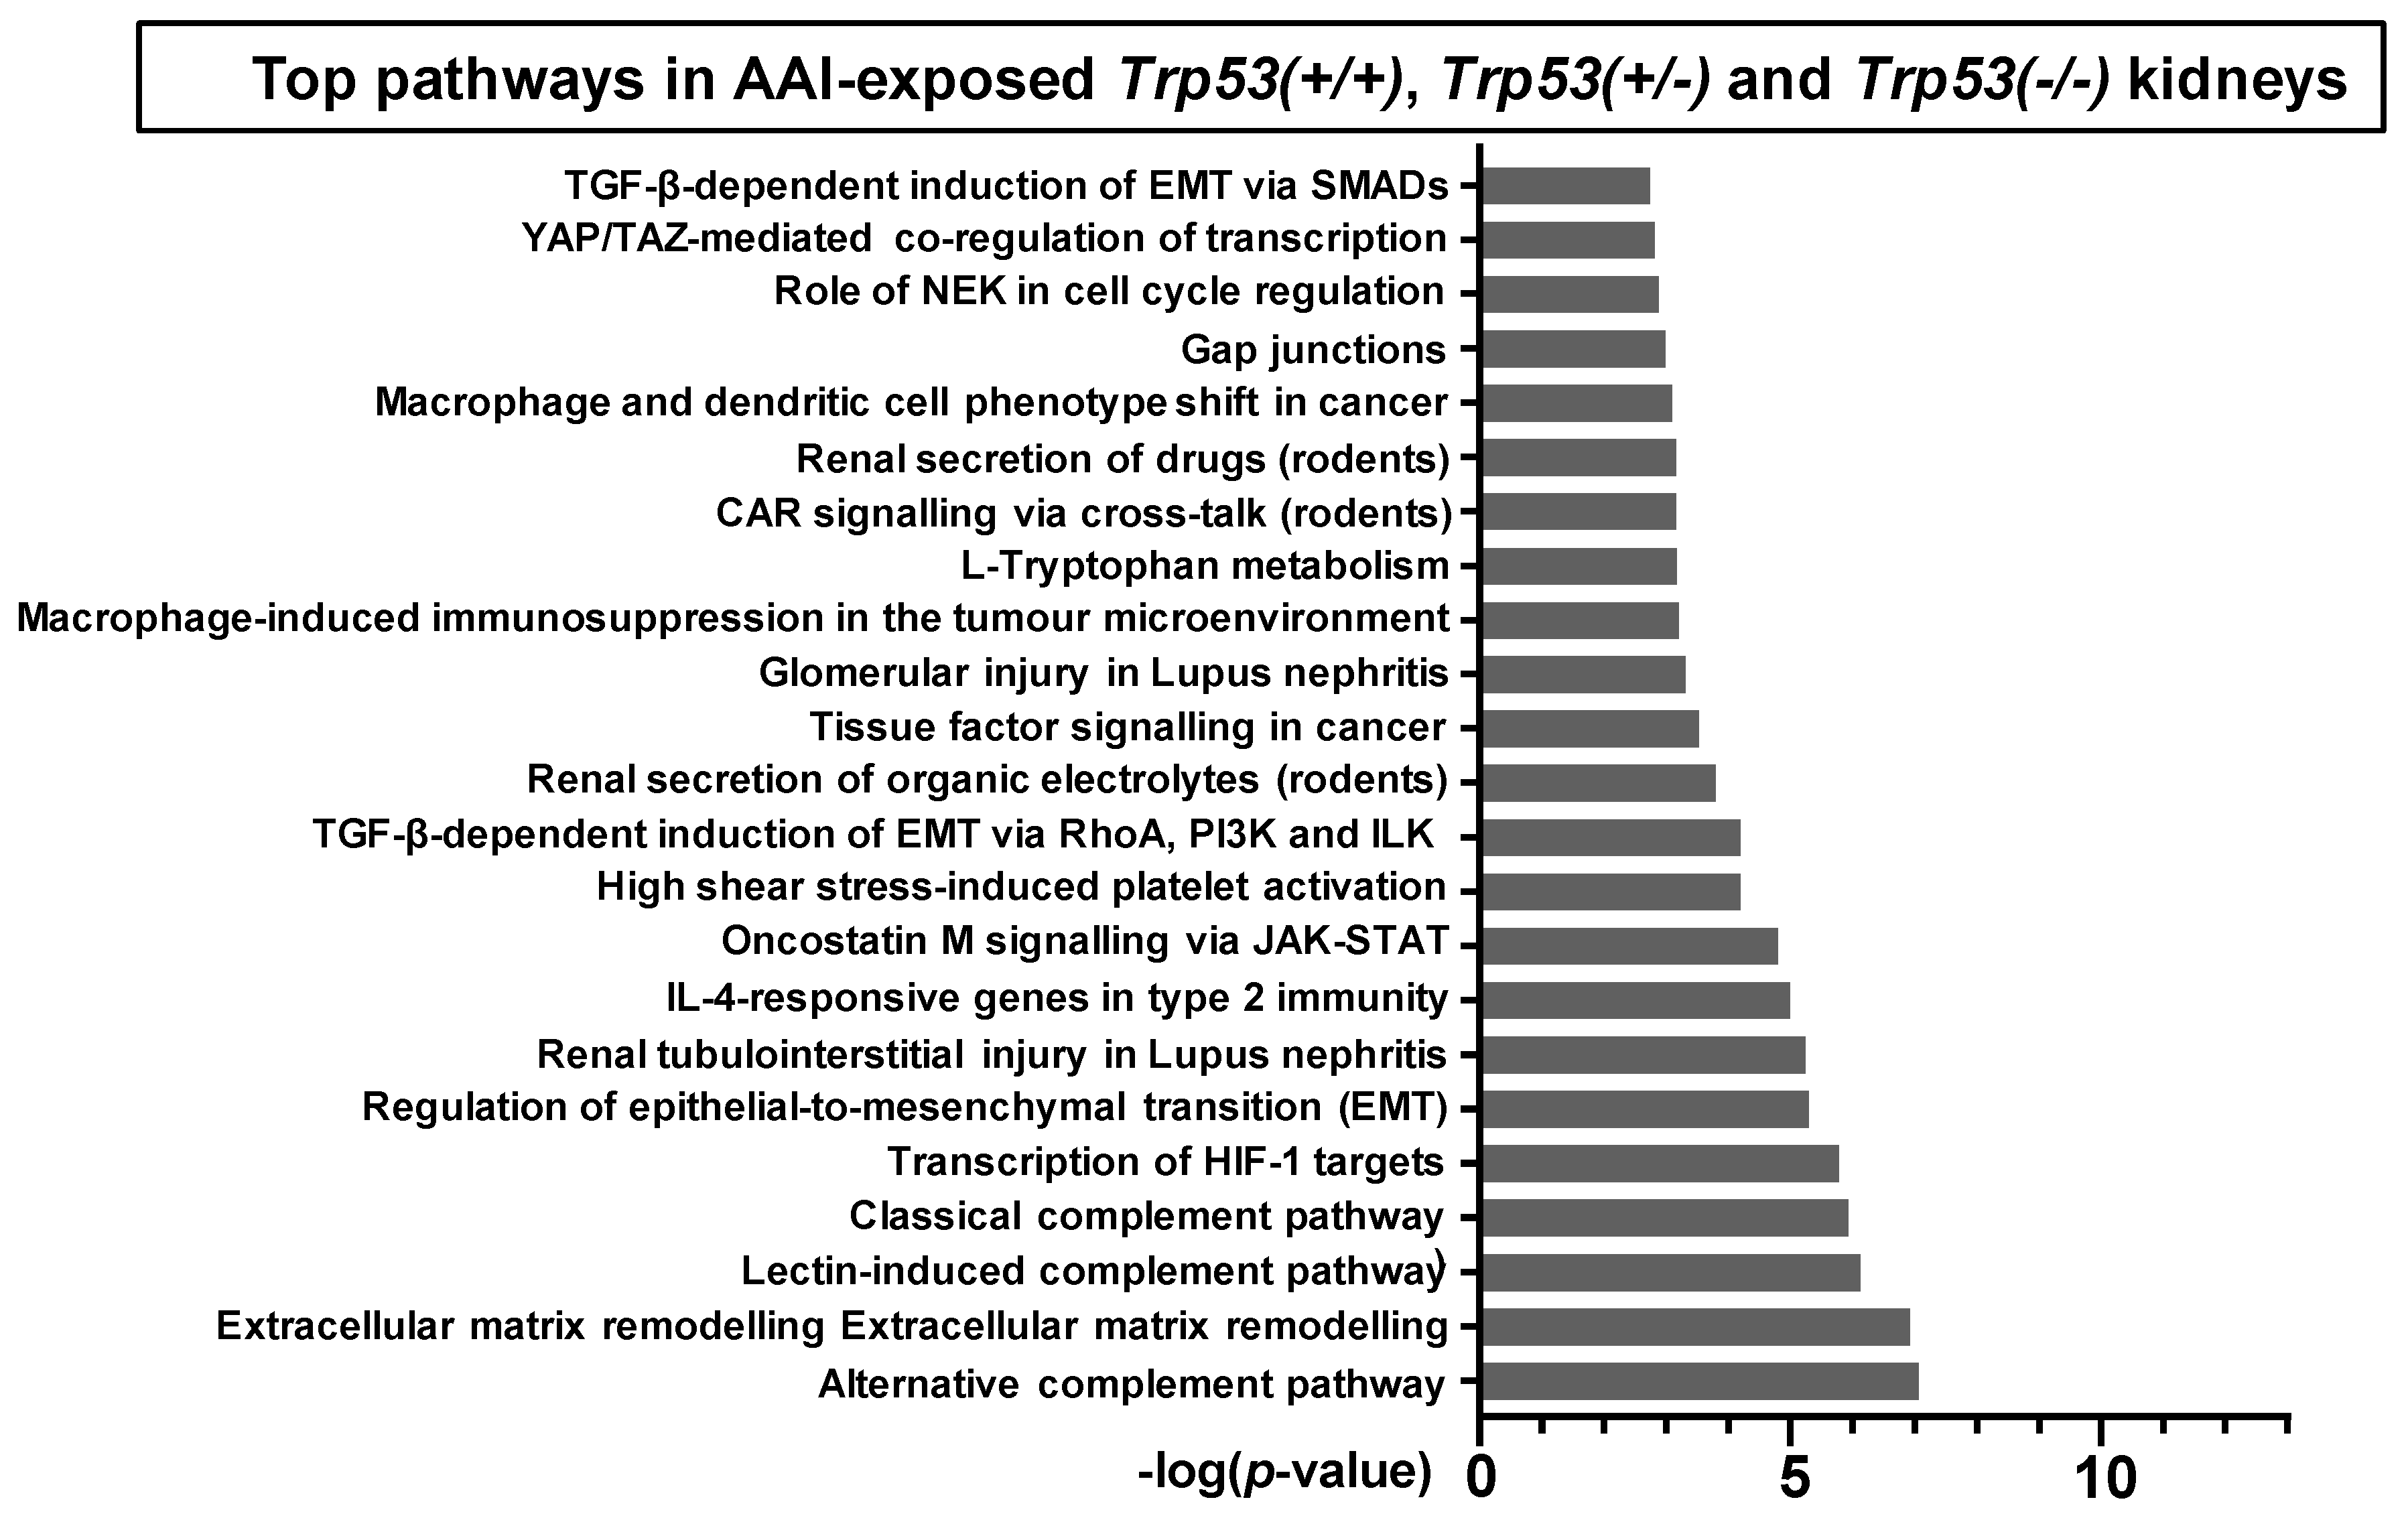
2.4. Pathway Comparison for AAI-Exposed Trp53(+/+), Trp53(+/-), and Trp53(-/-) Kidneys
3. Discussion
4. Materials and Methods
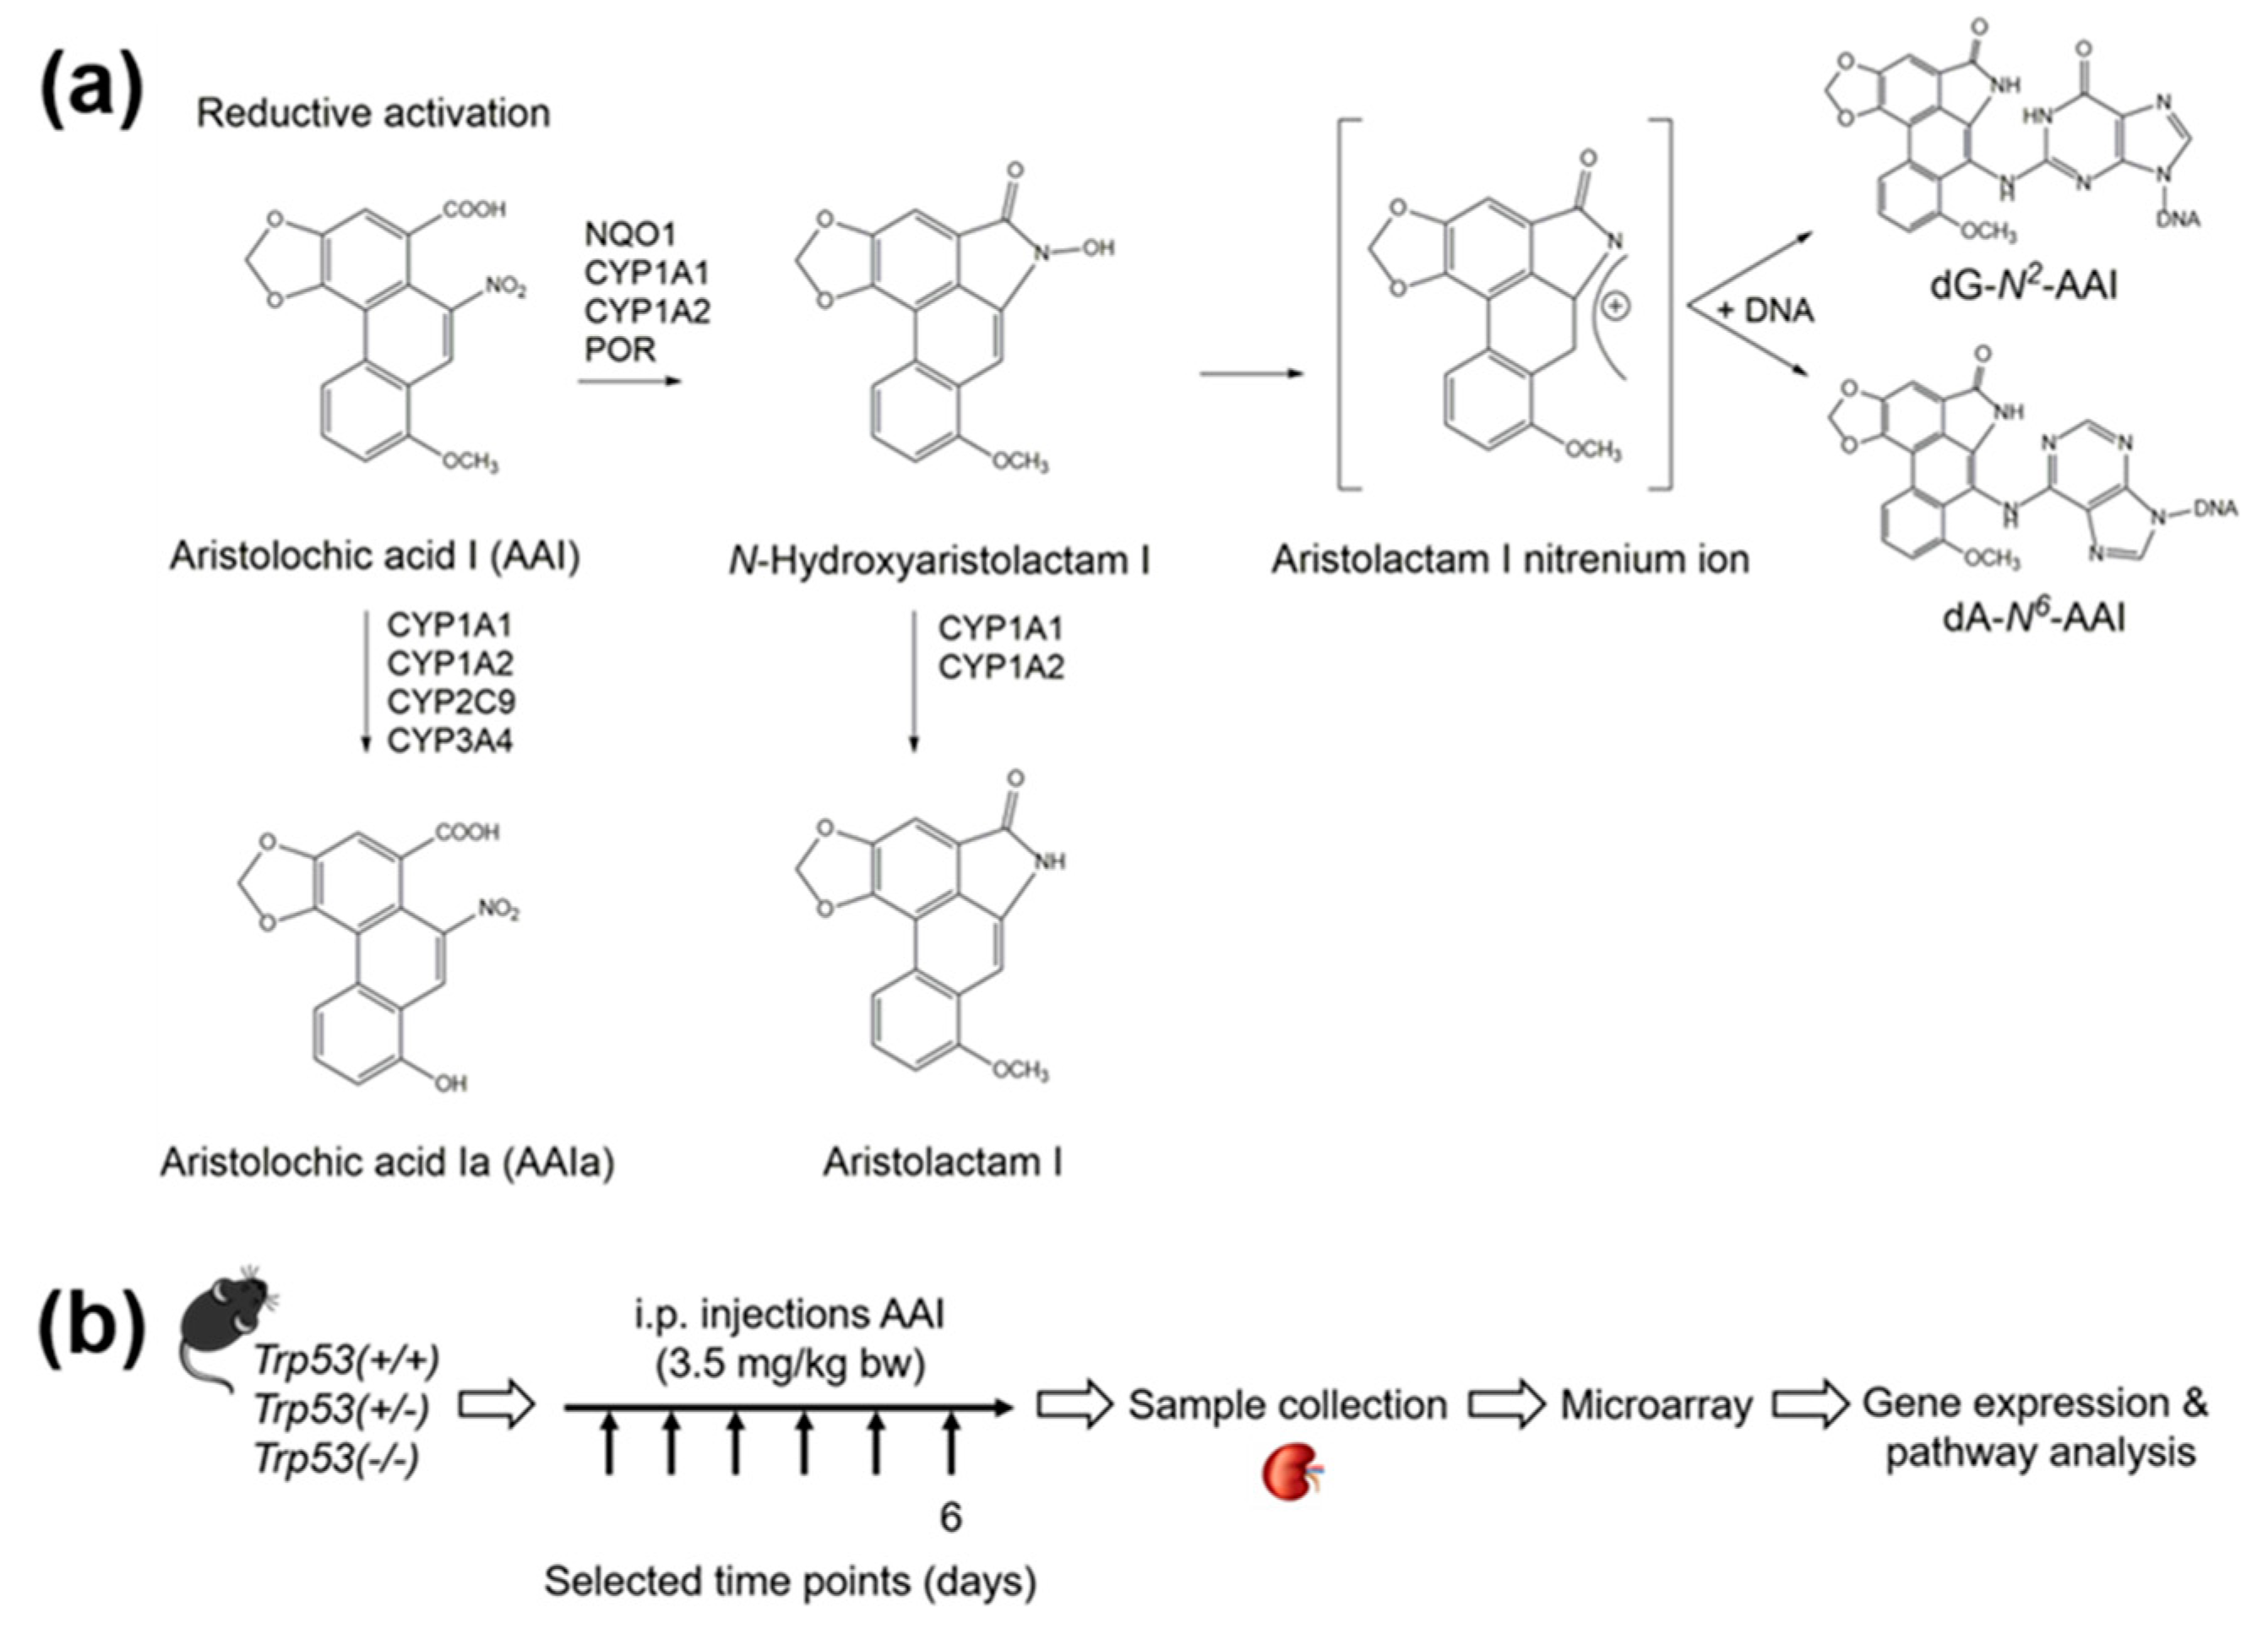
4.1. Carcinogen
4.2. Maintenance of Trp53(+/+), Trp53(+/-), and Trp53(-/-) Mice
4.3. Treatment of Trp53(+/+), Trp53(+/-), and Trp53(-/-) Mice with AAI
4.4. Microarray
4.5. Microarray Data Analysis
5. Conclusions
Supplementary Materials
Author Contributions
Funding
Acknowledgments
Conflicts of Interest
Abbreviations
| AAI | aristolochic acid I |
| AAN | aristolochic acid nephropathy |
| BEN | Balkan endemic nephropathy |
| BRCA | breast cancer susceptibility gene |
| bw | body weight |
| CDK | cyclin-dependent kinase |
| CYP | cytochrome P450 |
| EMT | epithelial-to-mesenchymal transition |
| FDR | false discovery rate |
| GLUT | glucose transporter |
| HIF-1 | hypoxia-inducible factor 1 |
| Hupki | human TP53 knock-in |
| i.p. | intraperitoneal |
| NF-κB | nuclear factor kappa-light-chain-enhancer of activated B cells |
| NGAL or LCN2 | neutrophil gelatinase-associated lipocalin |
| NQO | NAD(P)H:quinone oxidoreductase |
| OAT | organic anion transporter |
| p | p-value |
| p21Cip1/Waf1 or CDKN1A | cyclin-dependent kinase inhibitor 1a |
| p53 | tumour protein p53 |
| QC | quality control |
| SLC | solute carrier |
| TP53 | tumour protein 53 gene (human) |
| Trp53 | tumour protein 53 gene (mouse) |
References
- Vousden, K.H.; Lane, D.P. p53 in health and disease. Nat. Rev. Mol. Cell Biol. 2007, 8, 275–283. [Google Scholar] [CrossRef]
- Brosh, R.; Rotter, V. When mutants gain new powers: News from the mutant p53 field. Nat. Rev. Cancer 2009, 9, 701–713. [Google Scholar] [CrossRef]
- Freed-Pastor, W.A.; Prives, C. Mutant p53: One name, many proteins. Genes Dev. 2012, 26, 1268–1286. [Google Scholar] [CrossRef]
- Jacks, T.; Remington, L.; Williams, B.O.; Schmitt, E.M.; Halachmi, S.; Bronson, R.T.; Weinberg, R.A. Tumor spectrum analysis in p53-mutant mice. Curr. Biol. 1994, 4, 1–7. [Google Scholar] [CrossRef]
- Donehower, L.A.; Harvey, M.; Slagle, B.L.; McArthur, M.J.; Montgomery, C.A., Jr.; Butel, J.S.; Bradley, A. Mice deficient for p53 are developmentally normal but susceptible to spontaneous tumours. Nature 1992, 356, 215–221. [Google Scholar] [CrossRef]
- Olivier, M.; Hollstein, M.; Hainaut, P. TP53 mutations in human cancers: Origins, consequences, and clinical use. Cold Spring Harb. Perspect. Biol. 2010, 2, 1–17. [Google Scholar] [CrossRef]
- IARC. IARC Monographs on the Evaluation of Carcinogenic Risk to Humans. 2014. Available online: https://monographs.iarc.fr/wp-content/uploads/2018/08/14-002.pdf (accessed on 6 November 2019).
- Gokmen, M.R.; Cosyns, J.P.; Arlt, V.M.; Stiborova, M.; Phillips, D.H.; Schmeiser, H.H.; Simmonds, M.S.; Cook, H.T.; Vanherweghem, J.L.; Nortier, J.L.; et al. The epidemiology, diagnosis, and management of aristolochic acid nephropathy. Ann. Intern. Med. 2013, 158, 469–478. [Google Scholar] [CrossRef]
- Arlt, V.M.; Stiborova, M.; Schmeiser, H.H. Aristolochic acid as a probable human cancer hazard in herbal remedies: A review. Mutagenesis 2002, 17, 265–277. [Google Scholar] [CrossRef]
- Heinrich, M.; Chan, J.; Wanke, S.; Neinhuis, C.; Simmonds, M.S. Local uses of Aristolochia species and content of nephrotoxic aristolochic acid 1 and 2 - a global assessment based on bibliographic sources. J. Ethnopharmacol. 2009, 125, 108–144. [Google Scholar] [CrossRef]
- Schmeiser, H.H.; Stiborova, M.; Arlt, V.M. Chemical and molecular basis of the carcinogenicity of Aristolochia plants. Curr. Opin. Drug Discov. Devel. 2009, 12, 141–148. [Google Scholar]
- Stiborova, M.; Arlt, V.M.; Schmeiser, H.H. DNA adducts formed by aristolochic acid are unique biomarkers of exposure and explain the initiation phase of upper urothelial cancer. Int. J. Mol. Sci. 2017, 18, 2144. [Google Scholar] [CrossRef]
- Stiborova, M.; Martinek, V.; Frei, E.; Arlt, V.M.; Schmeiser, H.H. Enzymes metabolizing aristolochic acid and their contribution to the development of aristolochic acid nephropathy and urothelial cancer. Curr. Drug Metab. 2013, 14, 695–705. [Google Scholar] [CrossRef]
- Stiborova, M.; Frei, E.; Arlt, V.M.; Schmeiser, H.H. Knockout and humanized mice as suitable tools to identify enzymes metabolizing the human carcinogen aristolochic acid. Xenobiotica 2014, 44, 135–145. [Google Scholar] [CrossRef]
- Jadot, I.; Decleves, A.E.; Nortier, J.; Caron, N. An integrated view of aristolochic acid nephropathy: Update of the literature. Int. J. Mol. Sci. 2017, 18, 297. [Google Scholar] [CrossRef]
- Stiborova, M.; Arlt, V.M.; Schmeiser, H.H. Balkan endemic nephropathy: An update on its aetiology. Arch. Toxicol. 2016, 90, 2595–2615. [Google Scholar] [CrossRef]
- Jelakovic, B.; Dika, Z.; Arlt, V.M.; Stiborova, M.; Pavlovic, N.M.; Nikolic, J.; Colet, J.M.; Vanherweghem, J.L.; Nortier, J.L. Balkan Endemic Nephropathy and the causative role of aristolochic acid. Semin. Nephrol. 2019, 39, 284–296. [Google Scholar] [CrossRef]
- Cosyns, J.P.; Jadoul, M.; Squifflet, J.P.; Wese, F.X.; van Ypersele de Strihou, C. Urothelial lesions in Chinese-herb nephropathy. Am. J. Kidney Dis. 1999, 33, 1011–1017. [Google Scholar] [CrossRef]
- Lemy, A.; Wissing, K.M.; Rorive, S.; Zlotta, A.; Roumeguere, T.; Muniz Martinez, M.C.; Decaestecker, C.; Salmon, I.; Abramowicz, D.; Vanherweghem, J.L.; et al. Late onset of bladder urothelial carcinoma after kidney transplantation for end-stage aristolochic acid nephropathy: A case series with 15-year follow-up. Am. J. Kidney Dis. 2008, 51, 471–477. [Google Scholar] [CrossRef]
- Nortier, J.L.; Muniz Martinez, M.C.; Schmeiser, H.H.; Arlt, V.M.; Bieler, C.A.; Petein, M.; Depierreux, M.F.; De Pauw, L.; Abramowicz, D.; Vereerstraeten, P.; et al. Urothelial carcinoma associated with the use of a Chinese herb (Aristolochia fangchi). N. Engl. J. Med. 2000, 342, 1686–1692. [Google Scholar] [CrossRef]
- Hoang, M.L.; Chen, C.H.; Chen, P.C.; Roberts, N.J.; Dickman, K.G.; Yun, B.H.; Turesky, R.J.; Pu, Y.S.; Vogelstein, B.; Papadopoulos, N.; et al. Aristolochic acid in the etiology of renal cell carcinoma. Cancer Epidemiol. Biomarkers Prev. 2016, 25, 1600–1608. [Google Scholar] [CrossRef]
- Turesky, R.J.; Yun, B.H.; Brennan, P.; Mates, D.; Jinga, V.; Harnden, P.; Banks, R.E.; Blanche, H.; Bihoreau, M.; Chopard, P.; et al. Aristolochic acid exposure in Romania and implications for renal cell carcinoma. Br. J. Cancer 2016, 114, 76–80. [Google Scholar] [CrossRef]
- Grollman, A.P. Aristolochic acid nephropathy: Harbinger of a global iatrogenic disease. Environ. Mol. Mutagen. 2013, 54, 1–7. [Google Scholar] [CrossRef]
- Chen, C.H.; Dickman, K.G.; Moriya, M.; Zavadil, J.; Sidorenko, V.S.; Edwards, K.L.; Gnatenko, D.V.; Wu, L.; Turesky, R.J.; Wu, X.R.; et al. Aristolochic acid-associated urothelial cancer in Taiwan. Proc. Natl. Acad. Sci. USA 2012, 109, 8241–8246. [Google Scholar] [CrossRef]
- Grollman, A.P.; Shibutani, S.; Moriya, M.; Miller, F.; Wu, L.; Moll, U.; Suzuki, N.; Fernandes, A.; Rosenquist, T.; Medverec, Z.; et al. Aristolochic acid and the etiology of endemic (Balkan) nephropathy. Proc. Natl. Acad. Sci. USA 2007, 104, 12129–12134. [Google Scholar] [CrossRef]
- Kucab, J.E.; Zou, X.; Morganella, S.; Joel, M.; Nanda, A.S.; Nagy, E.; Gomez, C.; Degasperi, A.; Harris, R.; Jackson, S.P.; et al. A compendium of mutational signatures of environmental agents. Cell 2019, 177, 821–836. [Google Scholar] [CrossRef]
- Nik-Zainal, S.; Kucab, J.E.; Morganella, S.; Glodzik, D.; Alexandrov, L.B.; Arlt, V.M.; Weninger, A.; Hollstein, M.; Stratton, M.R.; Phillips, D.H. The genome as a record of environmental exposure. Mutagenesis 2015, 30, 763–770. [Google Scholar] [CrossRef]
- Simoes, M.L.; Hockley, S.L.; Schwerdtle, T.; da Costa, G.G.; Schmeiser, H.H.; Phillips, D.H.; Arlt, V.M. Gene expression profiles modulated by the human carcinogen aristolochic acid I in human cancer cells and their dependence on TP53 [and erratum 2018, 344, 75]. Toxicol. Appl. Pharmacol. 2008, 232, 86–98. [Google Scholar] [CrossRef]
- Arlt, V.M.; Zuo, J.; Trenz, K.; Roufosse, C.A.; Lord, G.M.; Nortier, J.L.; Schmeiser, H.H.; Hollstein, M.; Phillips, D.H. Gene expression changes induced by the human carcinogen aristolochic acid I in renal and hepatic tissue of mice. Int. J. Cancer 2011, 128, 21–32. [Google Scholar] [CrossRef]
- Chen, T.; Guo, L.; Zhang, L.; Shi, L.; Fang, H.; Sun, Y.; Fuscoe, J.C.; Mei, N. Gene expression profiles distinguish the carcinogenic effects of aristolochic acid in target (kidney) and non-target (liver) tissues in rats. BMC Bioinform. 2006, 7, 1–13. [Google Scholar] [CrossRef]
- Sborchia, M.; De Prez, E.G.; Antoine, M.H.; Bienfait, L.; Indra, R.; Valbuena, G.; Phillips, D.H.; Nortier, J.L.; Stiborova, M.; Keun, H.C.; et al. The impact of p53 on aristolochic acid I-induced nephrotoxicity and DNA damage in vivo and in vitro. Arch. Toxicol. 2019, 93, 3345–3366. [Google Scholar] [CrossRef]
- Davidson, A. What is damaging the kidney in lupus nephritis? Nat. Rev. Rheumatol. 2016, 12, 143–153. [Google Scholar] [CrossRef]
- Koepsell, H.; Endou, H. The SLC22 drug transporter family. Pflugers Arch. 2004, 447, 666–676. [Google Scholar] [CrossRef]
- Qu, D.; Huang, H.; Di, J.; Gao, K.; Lu, Z.; Zheng, J. Structure, functional regulation and signaling properties of Rap2B. Oncol. Lett. 2016, 11, 2339–2346. [Google Scholar] [CrossRef]
- Trevino, V.; Falciani, F.; Barrera-Saldana, H.A. DNA microarrays: A powerful genomic tool for biomedical and clinical research. Mol. Med. 2007, 13, 527–541. [Google Scholar] [CrossRef]
- Kruiswijk, F.; Labuschagne, C.F.; Vousden, K.H. p53 in survival, death and metabolic health: A lifeguard with a licence to kill. Nat. Rev. Mol. Cell Biol. 2015, 16, 393–405. [Google Scholar] [CrossRef]
- Romanov, V.; Whyard, T.C.; Waltzer, W.C.; Grollman, A.P.; Rosenquist, T. Aristolochic acid-induced apoptosis and G2 cell cycle arrest depends on ROS generation and MAP kinases activation. Arch. Toxicol. 2015, 89, 47–56. [Google Scholar] [CrossRef]
- Nitzsche, D.; Melzig, M.F.; Arlt, V.M. Evaluation of the cytotoxicity and genotoxicity of aristolochic acid I - a component of Aristolochiaceae plant extracts used in homeopathy. Environ. Toxicol. Pharmacol. 2013, 35, 325–334. [Google Scholar] [CrossRef]
- Megyesi, J.; Tarcsafalvi, A.; Li, S.; Hodeify, R.; Seng, N.S.; Portilla, D.; Price, P.M. Increased expression of p21WAF1/CIP1 in kidney proximal tubules mediates fibrosis. Am. J. Physiol. Renal. Physiol. 2015, 308, 122–130. [Google Scholar] [CrossRef]
- Christoph, F.; Schmidt, B.; Schmitz-Draeger, B.J.; Schulz, W.A. Over-expression and amplification of the c-myc gene in human urothelial carcinoma. Int. J. Cancer Oncol. 1999, 84, 169–173. [Google Scholar] [CrossRef]
- Grimm, M.O.; Jiirgens, B.; Schulz, W.A.; Decken, K.; Makri, D.; Schmitz-Driiger, B.J. Inactivation of tumor suppressor genes and deregulation of the c-myc gene in urothelial cancer cell lines. Urol. Res. 1995, 23, 293–300. [Google Scholar] [CrossRef]
- Habuchi, T.; Kinoshita, H.; Yamada, H.; Kakehi, Y.; Ogawa, O.; Wu, W.J.; Takahashi, R.; Sugiyama, T.; Yoshida, O. Oncogene amplification in urothelial cancers with p53 gene mutation or MDM2 amplification. J. Natl. Cancer Inst. 1994, 86, 1331–1335. [Google Scholar] [CrossRef]
- Pawar, R.D.; Pitashny, M.; Gindea, S.; Tieng, A.T.; Levine, B.; Goilav, B.; Campbell, S.R.; Xia, Y.; Qing, X.; Thomas, D.B.; et al. Neutrophil gelatinase-associated lipocalin is instrumental in the pathogenesis of antibody-mediated nephritis in mice. Arthritis Rheum. 2012, 64, 1620–1631. [Google Scholar] [CrossRef]
- Hvidberg, V.; Jacobsen, C.; Strong, R.K.; Cowland, J.B.; Moestrup, S.K.; Borregaard, N. The endocytic receptor megalin binds the iron transporting neutrophil-gelatinase-associated lipocalin with high affinity and mediates its cellular uptake. FEBS Lett. 2005, 579, 773–777. [Google Scholar] [CrossRef]
- Bratt, T. Lipocalins and cancer. Biochim. Biophys. Acta 2000, 1482, 318–326. [Google Scholar] [CrossRef]
- Fuchs, T.C.; Mally, A.; Wool, A.; Beiman, M.; Hewitt, P. An exploratory evaluation of the utility of transcriptional and urinary kidney injury biomarkers for the prediction of aristolochic acid-induced renal injury in male rats. Vet. Pathol. 2014, 51, 680–694. [Google Scholar] [CrossRef]
- Pozdzik, A.A.; Berton, A.; Schmeiser, H.H.; Missoum, W.; Decaestecker, C.; Salmon, I.J.; Vanherweghem, J.L.; Nortier, J.L. Aristolochic acid nephropathy revisited: A place for innate and adaptive immunity? Histopathology 2010, 56, 449–463. [Google Scholar] [CrossRef]
- Honarpisheh, M.; Foresto-Neto, O.; Steiger, S.; Kraft, F.; Koehler, P.; von Rauchhaupt, E.; Potempa, J.; Adamowicz, K.; Koziel, J.; Lech, M. Aristolochic acid I determine the phenotype and activation of macrophages in acute and chronic kidney disease. Sci. Rep. 2018, 8, 1–13. [Google Scholar] [CrossRef]
- Yung, S.; Chan, T.M. The role of hyaluronan and CD44 in the pathogenesis of lupus nephritis. Autoimmune Dis. 2012, 2012, 1–9. [Google Scholar] [CrossRef]
- Menke, J.; Iwata, Y.; Rabacal, W.A.; Basu, R.; Stanley, E.R.; Kelley, V.R. Distinct roles of CSF-1 isoforms in lupus nephritis. J. Am. Soc. Nephrol. 2011, 22, 1821–1833. [Google Scholar] [CrossRef]
- Menke, J.; Amann, K.; Cavagna, L.; Blettner, M.; Weinmann, A.; Schwarting, A.; Kelley, V.R. Colony-stimulating factor-1: A potential biomarker for lupus nephritis. J. Am. Soc. Nephrol. 2015, 26, 379–389. [Google Scholar] [CrossRef]
- Roth, M.; Obaidat, A.; Hagenbuch, B. OATPs, OATs and OCTs: The organic anion and cation transporters of the SLCO and SLC22A gene superfamilies. Br. J. Pharmacol. 2012, 165, 1260–1287. [Google Scholar] [CrossRef]
- Reimer, R.J. SLC17: A functionally diverse family of organic anion transporters. Mol. Aspects Med. 2013, 34, 350–359. [Google Scholar] [CrossRef]
- Xue, X.; Gong, L.K.; Maeda, K.; Luan, Y.; Qi, X.M.; Sugiyama, Y.; Ren, J. Critical role of organic anion transporters 1 and 3 in kidney accumulation and toxicity of aristolochic acid I. Mol. Pharm. 2011, 8, 2183–2192. [Google Scholar] [CrossRef]
- Bakhiya, N.; Arlt, V.M.; Bahn, A.; Burckhardt, G.; Phillips, D.H.; Glatt, H. Molecular evidence for an involvement of organic anion transporters (OATs) in aristolochic acid nephropathy. Toxicology 2009, 264, 74–79. [Google Scholar] [CrossRef]
- Dickman, K.G.; Sweet, D.H.; Bonala, R.; Ray, T.; Wu, A. Physiological and molecular characterization of aristolochic acid transport by the kidney. J. Pharmacol. Exp. Ther. 2011, 338, 588–597. [Google Scholar] [CrossRef]
- Babu, E.; Takeda, M.; Nishida, R.; Noshiro-Kofuji, R.; Yoshida, M.; Ueda, S.; Fukutomi, T.; Anzai, N.; Endou, H. Interactions of human organic anion transporters with aristolochic acids. J. Pharmacol. Sci. 2010, 113, 192–196. [Google Scholar] [CrossRef]
- Lou, Y.; Li, J.; Lu, Y.; Wang, X.; Jiao, R.; Wang, S.; Kong, L. Aristolochic acid-induced destruction of organic ion transporters and fatty acid metabolic disorder in the kidney of rats. Toxicol. Lett. 2011, 201, 72–79. [Google Scholar] [CrossRef]
- Jonker, J.W.; Wagenaar, E.; Van Eijl, S.; Schinkel, A.H. Deficiency in the organic cation transporters 1 and 2 (Oct1/Oct2 [Slc22a1/Slc22a2]) in mice abolishes renal secretion of organic cations. Mol. Cell Biol. 2003, 23, 7902–7908. [Google Scholar] [CrossRef]
- Kalluri, R.; Weinberg, R.A. The basics of epithelial-mesenchymal transition. J. Clin. Investig. 2009, 119, 1420–1428. [Google Scholar] [CrossRef]
- Kriz, W.; Kaissling, B.; Le Hir, M. Epithelial-mesenchymal transition (EMT) in kidney fibrosis: Fact or fantasy? J. Clin. Investig. 2011, 121, 468–474. [Google Scholar] [CrossRef]
- Debelle, F.D.; Nortier, J.L.; De Prez, E.G.; Garbar, C.H.; Vienne, A.R.; Salmon, I.J.; Deschodt-Lanckmann, M.M.; Vanherweghem, J.L. Aristolochic acids induce chronic renal failure with interstitial fibrosis in salt-depleted rats. J. Am. Soc. Nephrol. 2002, 13, 431–436. [Google Scholar]
- Nie, W.; Lv, Y.; Yan, L.; Chen, X.; Lv, H. Prediction and characterisation of the system effects of aristolochic acid: A novel joint network analysis towards therapeutic and toxicological mechanisms. Sci. Rep. 2015, 5, 1–13. [Google Scholar] [CrossRef]
- Zhou, L.; Fu, P.; Huang, X.R.; Liu, F.; Chung, A.C.; Lai, K.N.; Lan, H.Y. Mechanism of chronic aristolochic acid nephropathy: Role of Smad3. Am. J. Physiol. Renal. Physiol. 2010, 298, 1006–1017. [Google Scholar] [CrossRef]
- Li, J.; Zhang, Z.; Wang, D.; Wang, Y.; Li, Y.; Wu, G. TGF-β 1/Smads signaling stimulates renal interstitial fibrosis in experimental AAN. J. Recept Sig. Transd. 2009, 29, 280–285. [Google Scholar] [CrossRef]
- Basu, S.; Kolesnick, R. Stress signals for apoptosis: Ceramide and c-Jun kinase. Oncogene 1998, 17, 3277–3285. [Google Scholar] [CrossRef]
- Chang, Y. Lymphotoxin β receptor induces interleukin 8 gene expression via NF-κB and AP-1 activation. Exp. Cell Res. 2002, 278, 166–174. [Google Scholar] [CrossRef]
- Hu, X.; Zimmerman, M.A.; Bardhan, K.; Yang, D.; Waller, J.L.; Liles, G.B.; Lee, J.R.; Pollock, R.; Lev, D.; Ware, C.F.; et al. Lymphotoxin β receptor mediates caspase-dependent tumor cell apoptosis in vitro and tumor suppression in vivo despite induction of NF-κB activation. Carcinogenesis 2013, 34, 1105–1114. [Google Scholar] [CrossRef]
- Zou, H.; Li, Y.; Liu, X.; Wang, X. An APAF-1 cytochrome c multimeric complex is a functional apoptosome that activates procaspase-9. J. Biol. Chem. 1999, 274, 11549–11556. [Google Scholar] [CrossRef]
- Rui, H.L.; Wang, Y.Y.; Cheng, H.; Chen, Y.P. JNK-dependent AP-1 activation is required for aristolochic acid-induced TGF-β 1 synthesis in human renal proximal epithelial cells. Am. J. Physiol. Renal. Physiol. 2012, 302, 1569–1575. [Google Scholar] [CrossRef]
- Zhou, L.; Fu, P.; Huang, X.R.; Liu, F.; Lai, K.N.; Lan, H.Y. Activation of p53 promotes renal injury in acute aristolochic acid nephropathy. J. Am. Soc. Nephrol. 2010, 21, 31–41. [Google Scholar] [CrossRef] [PubMed]
- Zhang, X.; He, Y.; Lee, K.H.; Dubois, W.; Li, Z.; Wu, X.; Kovalchuk, A.; Zhang, W.; Huang, J. Rap2b, a novel p53 target, regulates p53-mediated pro-survival function. Cell Cycle 2013, 12, 1279–1291. [Google Scholar] [CrossRef] [PubMed]
- Di, J.; Huang, H.; Wang, Y.; Qu, D.; Tang, J.; Cheng, Q.; Lu, Z.; Zhang, Y.; Zheng, J. p53 target gene Rap2B regulates the cytoskeleton and inhibits cell spreading. J. Cancer Res. Clin. Oncol. 2015, 141, 1791–1798. [Google Scholar] [CrossRef] [PubMed]
- Di, J.; Huang, H.; Qu, D.; Tang, J.; Cao, W.; Lu, Z.; Cheng, Q.; Yang, J.; Bai, J.; Zhang, Y.; et al. Rap2B promotes proliferation, migration, and invasion of human breast cancer through calcium-related ERK1/2 signaling pathway. Sci. Rep. 2015, 5, 1–11. [Google Scholar] [CrossRef]
- Sancar, A.; Lindsey-Boltz, L.A.; Unsal-Kacmaz, K.; Linn, S. Molecular mechanisms of mammalian DNA repair and the DNA damage checkpoints. Ann. Rev. Biochem. 2004, 73, 39–85. [Google Scholar] [CrossRef]
- Satyanarayana, A.; Kaldis, P. A dual role of Cdk2 in DNA damage response. Cell Div. 2009, 4, 1–4. [Google Scholar] [CrossRef]
- Li, Y.; Liu, Z.; Guo, X.; Shu, J.; Chen, Z.; Li, L. Aristolochic acid I-induced DNA damage and cell cycle arrest in renal tubular epithelial cells in vitro. Arch. Toxicol. 2006, 80, 524–532. [Google Scholar] [CrossRef]
- Chang, H.R.; Lian, J.D.; Lo, C.W.; Chang, Y.C.; Yang, M.Y.; Wang, C.J. Induction of urothelial proliferation in rats by aristolochic acid through cell cycle progression via activation of cyclin D1/cdk4 and cyclin E/cdk2. Food Chem. Toxicol. 2006, 44, 28–35. [Google Scholar] [CrossRef]
- Shan, G.; Tang, T. Expression of cyclin D1 and cyclin E in urothelial bladder carcinoma detected in tissue chips using a quantum dot immunofluorescence technique. Oncol. Lett. 2015, 10, 1271–1276. [Google Scholar] [CrossRef]
- Yoshida, K.; Miki, Y. Role of BRCA1 and BRCA2 as regulators of DNA repair, transcription, and cell cycle in response to DNA damage. Cancer Sci. 2004, 95, 866–871. [Google Scholar] [CrossRef]
- Shin, D.S.; Pellegrini, L.; Daniels, D.S.; Yelent, B.; Craig, L.; Bates, D.; Yu, D.S.; Shivji, M.K.; Hitomi, C.; Arvai, A.S.; et al. Full-length archaeal Rad51 structure and mutants: Mechanisms for RAD51 assembly and control by BRCA2. EMBO J. 2003, 22, 4566–4576. [Google Scholar] [CrossRef] [PubMed]
- Chen, Y.; Chung, J.; Wu, H.; Bau, D.; Wu, K.; Kao, S.; Hsiang, C.Y.; Ho, T.Y.; Chiang, S.Y. Aristolochic acid suppresses DNA repair and triggers oxidative DNA damage in human kidney proximal tubular cells. Oncol. Rep. 2010, 24, 141–153. [Google Scholar] [CrossRef] [PubMed]
- Hoang, M.L.; Chen, C.H.; Sidorenko, V.S.; He, J.; Dickman, K.G.; Yun, B.H.; Moriya, M.; Niknafs, N.; Douville, C.; Karchin, R.; et al. Mutational signature of aristolochic acid exposure as revealed by whole-exome sequencing. Sci. Transl. Med. 2013, 5, 1–20. [Google Scholar] [CrossRef]
- Bara, T., Jr.; Gurzu, S.; Sugimura, H.; Bara, T.; Beleaua, M.A.; Jung, I. A systematic review of the possible carcinogenic role of the aristolochic acid. Rom. J. Morphol. Embryol. 2017, 58, 41–44. [Google Scholar]
- Salvesen, G.S.; Duckett, C.S. IAP proteins: Blocking the road to death’s door. Nat. Rev. Mol. Cell Biol. 2002, 3, 401–410. [Google Scholar] [CrossRef]
- Simon, N.; Hertig, A. Alteration of fatty acid oxidation in tubular epithelial cells: From acute kidney injury to renal fibrogenesis. Front. Med. 2015, 2, 1–8. [Google Scholar] [CrossRef]
- Kang, H.M.; Ahn, S.H.; Choi, P.; Ko, Y.A.; Han, S.H.; Chinga, F.; Park, A.S.; Tao, J.; Sharma, K.; Pullman, J.; et al. Defective fatty acid oxidation in renal tubular epithelial cells has a key role in kidney fibrosis development. Nat. Med. 2015, 21, 37–46. [Google Scholar] [CrossRef]
- Liu, T.F.; Vachharajani, V.T.; Yoza, B.K.; McCall, C.E. NAD+-dependent sirtuin 1 and 6 proteins coordinate a switch from glucose to fatty acid oxidation during the acute inflammatory response. J. Biol. Chem. 2012, 287, 25758–25769. [Google Scholar] [CrossRef]
- Rahmoune, H.; Thompson, P.W.; Ward, J.M.; Smith, C.D.; Hong, G.; Brown, J. Glucose transporters in human renal proximal tubular cells isolated from the urine of patients with non-insulin-dependent diabetes. Diabetes 2005, 54, 3427–3434. [Google Scholar] [CrossRef]
- Zhao, Y.Y.; Wang, H.L.; Cheng, X.L.; Wei, F.; Bai, X.; Lin, R.C.; Vaziri, N.D. Metabolomics analysis reveals the association between lipid abnormalities and oxidative stress, inflammation, fibrosis, and Nrf2 dysfunction in aristolochic acid-induced nephropathy. Sci. Rep. 2015, 5, 1–13. [Google Scholar] [CrossRef]
- Ye, X.; Li, M.; Hou, T.; Gao, T.; Zhu, W.; Yang, Y. Sirtuins in glucose and lipid metabolism. Oncotarget 2017, 8, 1845–1859. [Google Scholar] [CrossRef] [PubMed]
- Schwartzenberg-Bar-Yoseph, F.; Armoni, M.; Karnieli, E. The tumor suppressor p53 down-regulates glucose transporters GLUT1 and GLUT4 gene expression. Cancer Res. 2004, 64, 2627–2633. [Google Scholar] [CrossRef] [PubMed]
- Arlt, V.M.; Meinl, W.; Florian, S.; Nagy, E.; Barta, F.; Thomann, M.; Mrizova, I.; Krais, A.M.; Liu, M.; Richards, M.; et al. Impact of genetic modulation of SULT1A enzymes on DNA adduct formation by aristolochic acids and 3-nitrobenzanthrone. Arch. Toxicol. 2017, 91, 1957–1975. [Google Scholar] [CrossRef] [PubMed]
- Krais, A.M.; Speksnijder, E.N.; Melis, J.P.; Indra, R.; Moserova, M.; Godschalk, R.W.; van Schooten, F.J.; Seidel, A.; Kopka, K.; Schmeiser, H.H.; et al. The impact of p53 on DNA damage and metabolic activation of the environmental carcinogen benzo[a]pyrene: Effects in Trp53(+/+), Trp53(+/-) and Trp53(-/-) mice. Arch. Toxicol. 2016, 90, 839–851. [Google Scholar] [CrossRef] [PubMed]
- Krais, A.M.; Speksnijder, E.N.; Melis, J.P.; Singh, R.; Caldwell, A.; Gamboa da Costa, G.; Luijten, M.; Phillips, D.H.; Arlt, V.M. Metabolic activation of 2-amino-1-methyl-6-phenylimidazo [4,5-b]pyridine and DNA adduct formation depends on p53: Studies in Trp53(+/+), Trp53(+/-) and Trp53(-/-) mice. Int. J. Cancer 2016, 138, 976–982. [Google Scholar] [CrossRef]
- Donehower, L.A. Insights into wild-type and mutant p53 functions provided by genetically engineered mice. Hum. Mut. 2014, 35, 715–727. [Google Scholar] [CrossRef]
- Lozano, G. Mouse models of p53 functions. Cold Spring Harb. Perspect. Biol. 2009, 2, 1–12. [Google Scholar] [CrossRef]
- Taneja, P.; Zhu, S.; Maglic, D.; Fry, E.A.; Kendig, R.D.; Inoue, K. Transgenic and knockout mice models to reveal the functions of tumor suppressor genes. Clin. Med. Insights Oncol. 2011, 5, 235–257. [Google Scholar] [CrossRef]
- Kucab, J.E.; van Steeg, H.; Luijten, M.; Schmeiser, H.H.; White, P.A.; Phillips, D.H.; Arlt, V.M. TP53 mutations induced by BPDE in Xpa-WT and Xpa-Null human TP53 knock-in (Hupki) mouse embryo fibroblasts. Mutat. Res. 2015, 773, 48–62. [Google Scholar] [CrossRef]
- Baudoux, T.E.; Pozdzik, A.A.; Arlt, V.M.; De Prez, E.G.; Antoine, M.H.; Quellard, N.; Goujon, J.M.; Nortier, J.L. Probenecid prevents acute tubular necrosis in a mouse model of aristolochic acid nephropathy. Kidney Int. 2012, 82, 1105–1113. [Google Scholar] [CrossRef]


| Pathway | p-Value | FDR | No. Genes | List of Genes from MetaCore™ |
|---|---|---|---|---|
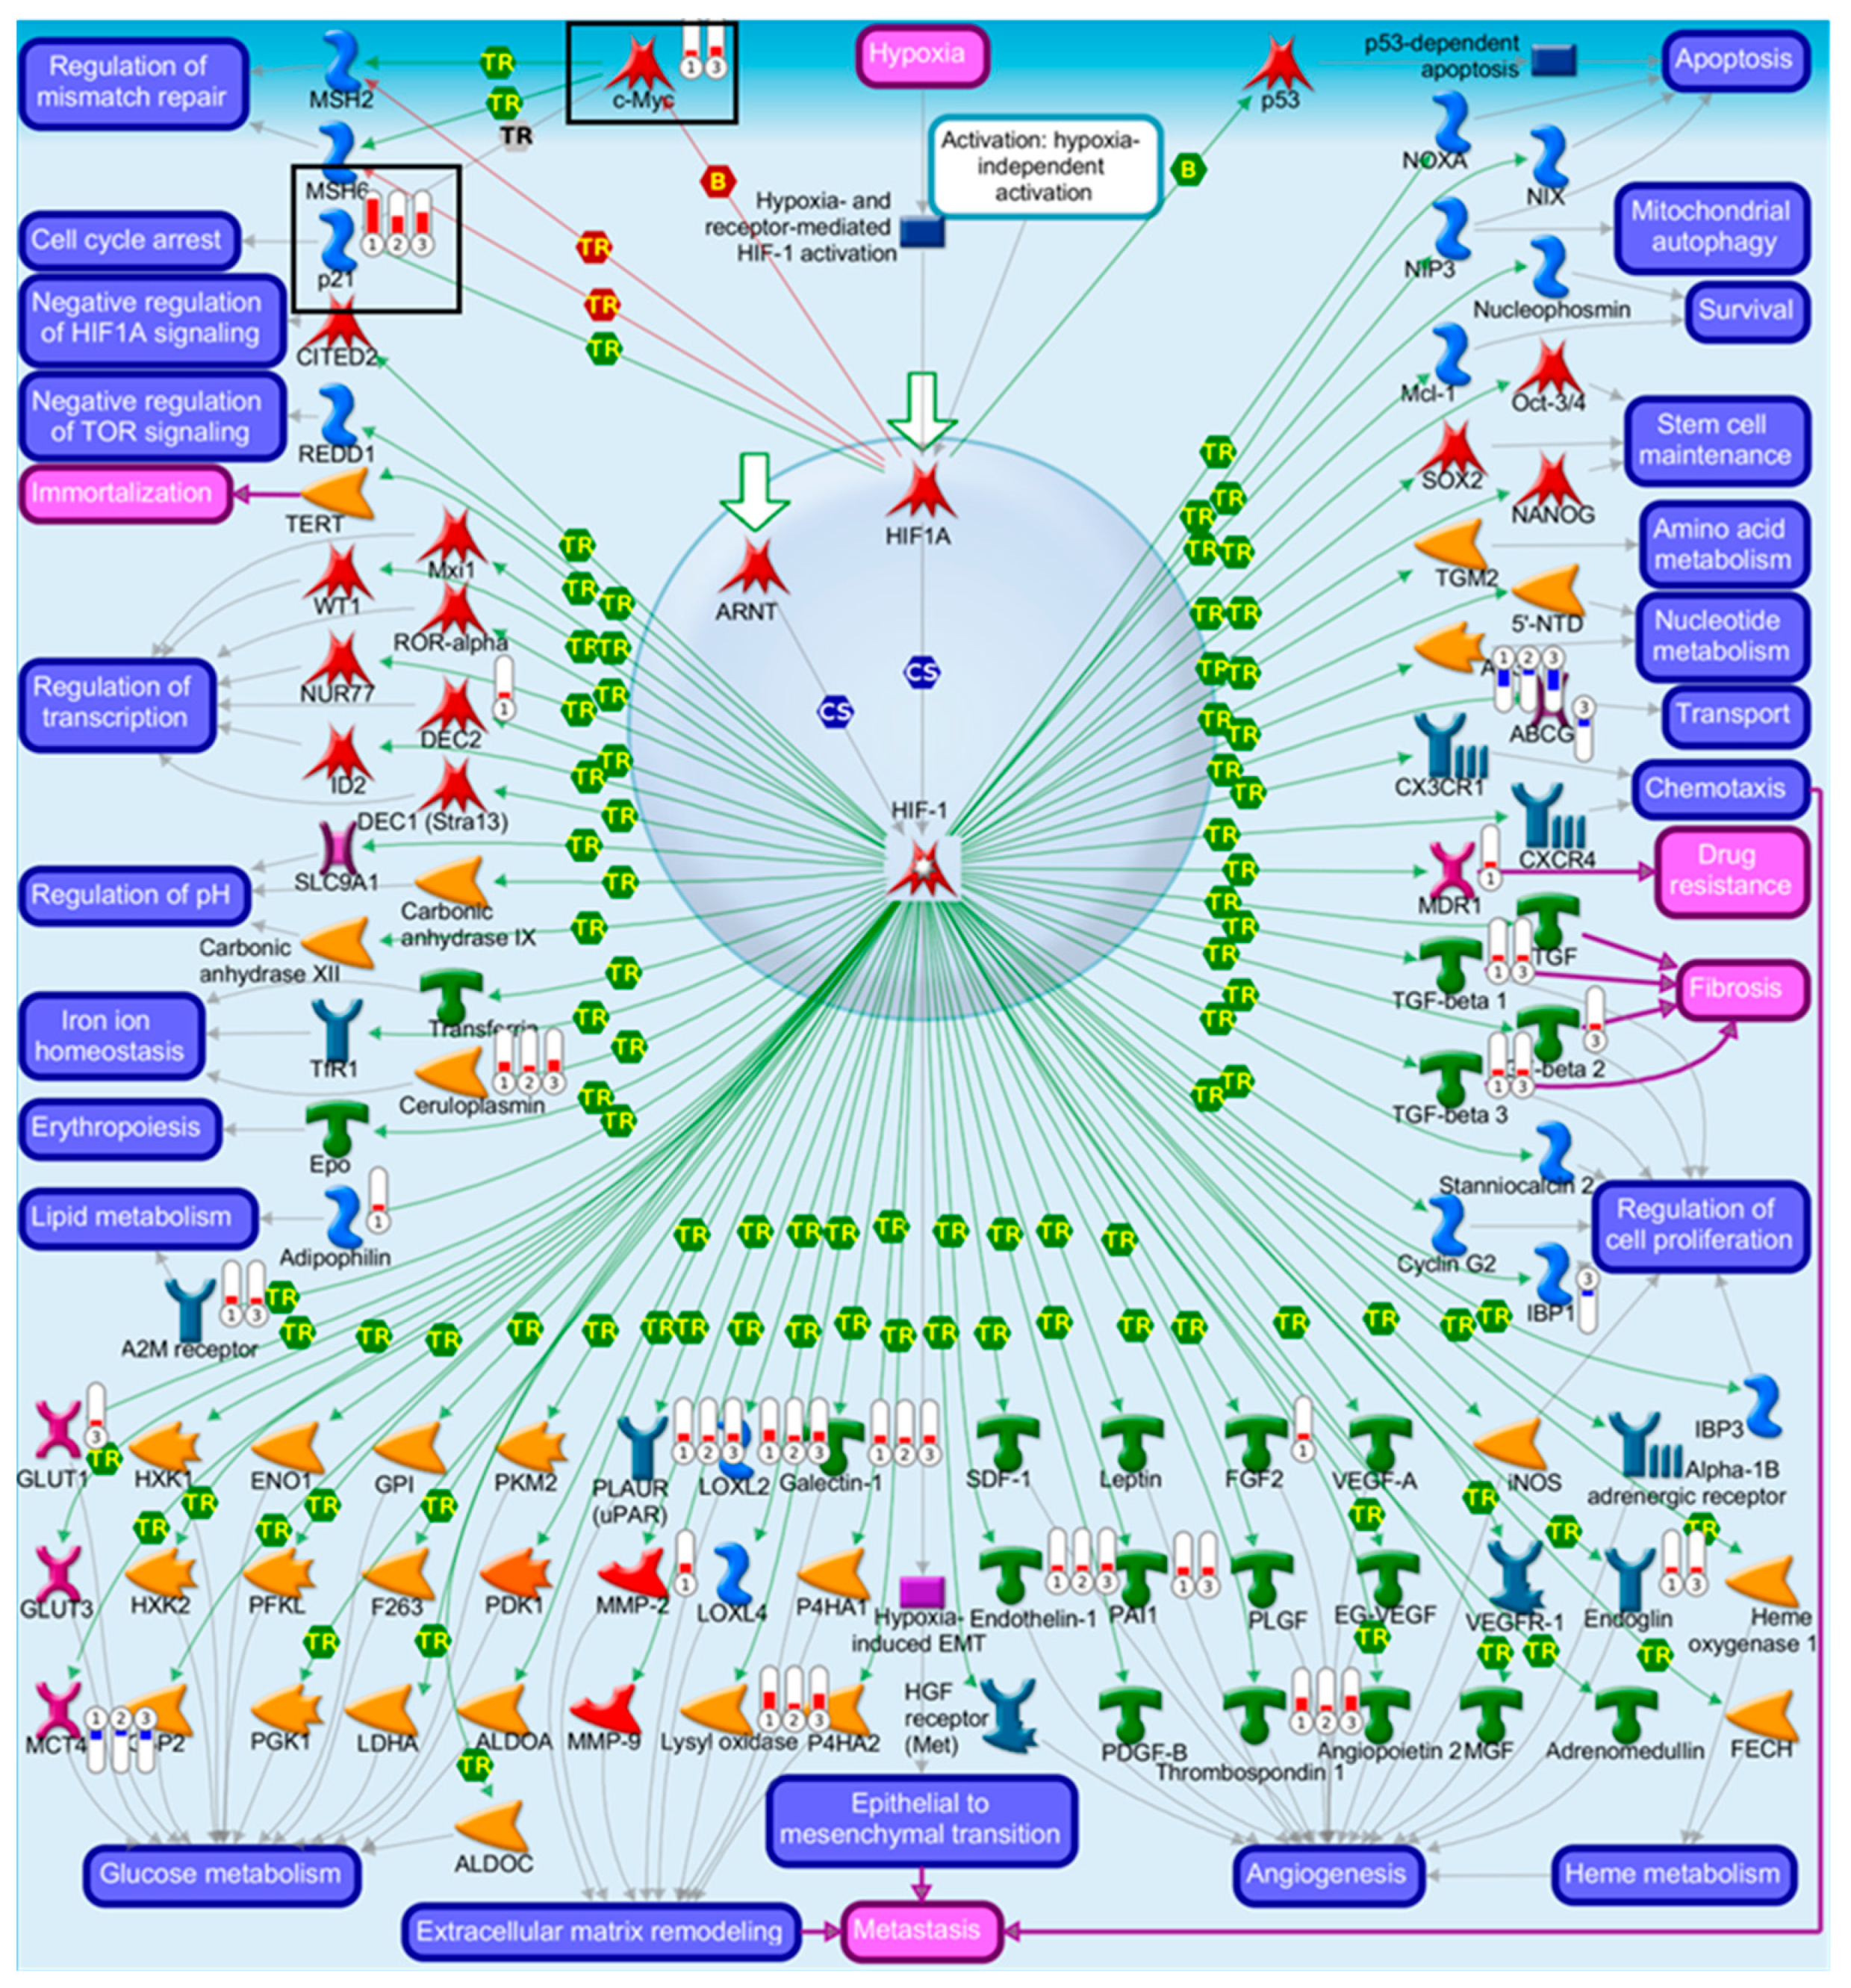
| Transcription of HIF-1 targets | 1.67 × 10⁻⁶ | 1.43 × 10⁻⁴ | 10 | Galectin-1, PLAUR (uPAR), Ceruloplasmin, Lysyl oxidase, p21, MCT4, Endothelin-1, Thrombospondin 1, LOXL2, AK3 |
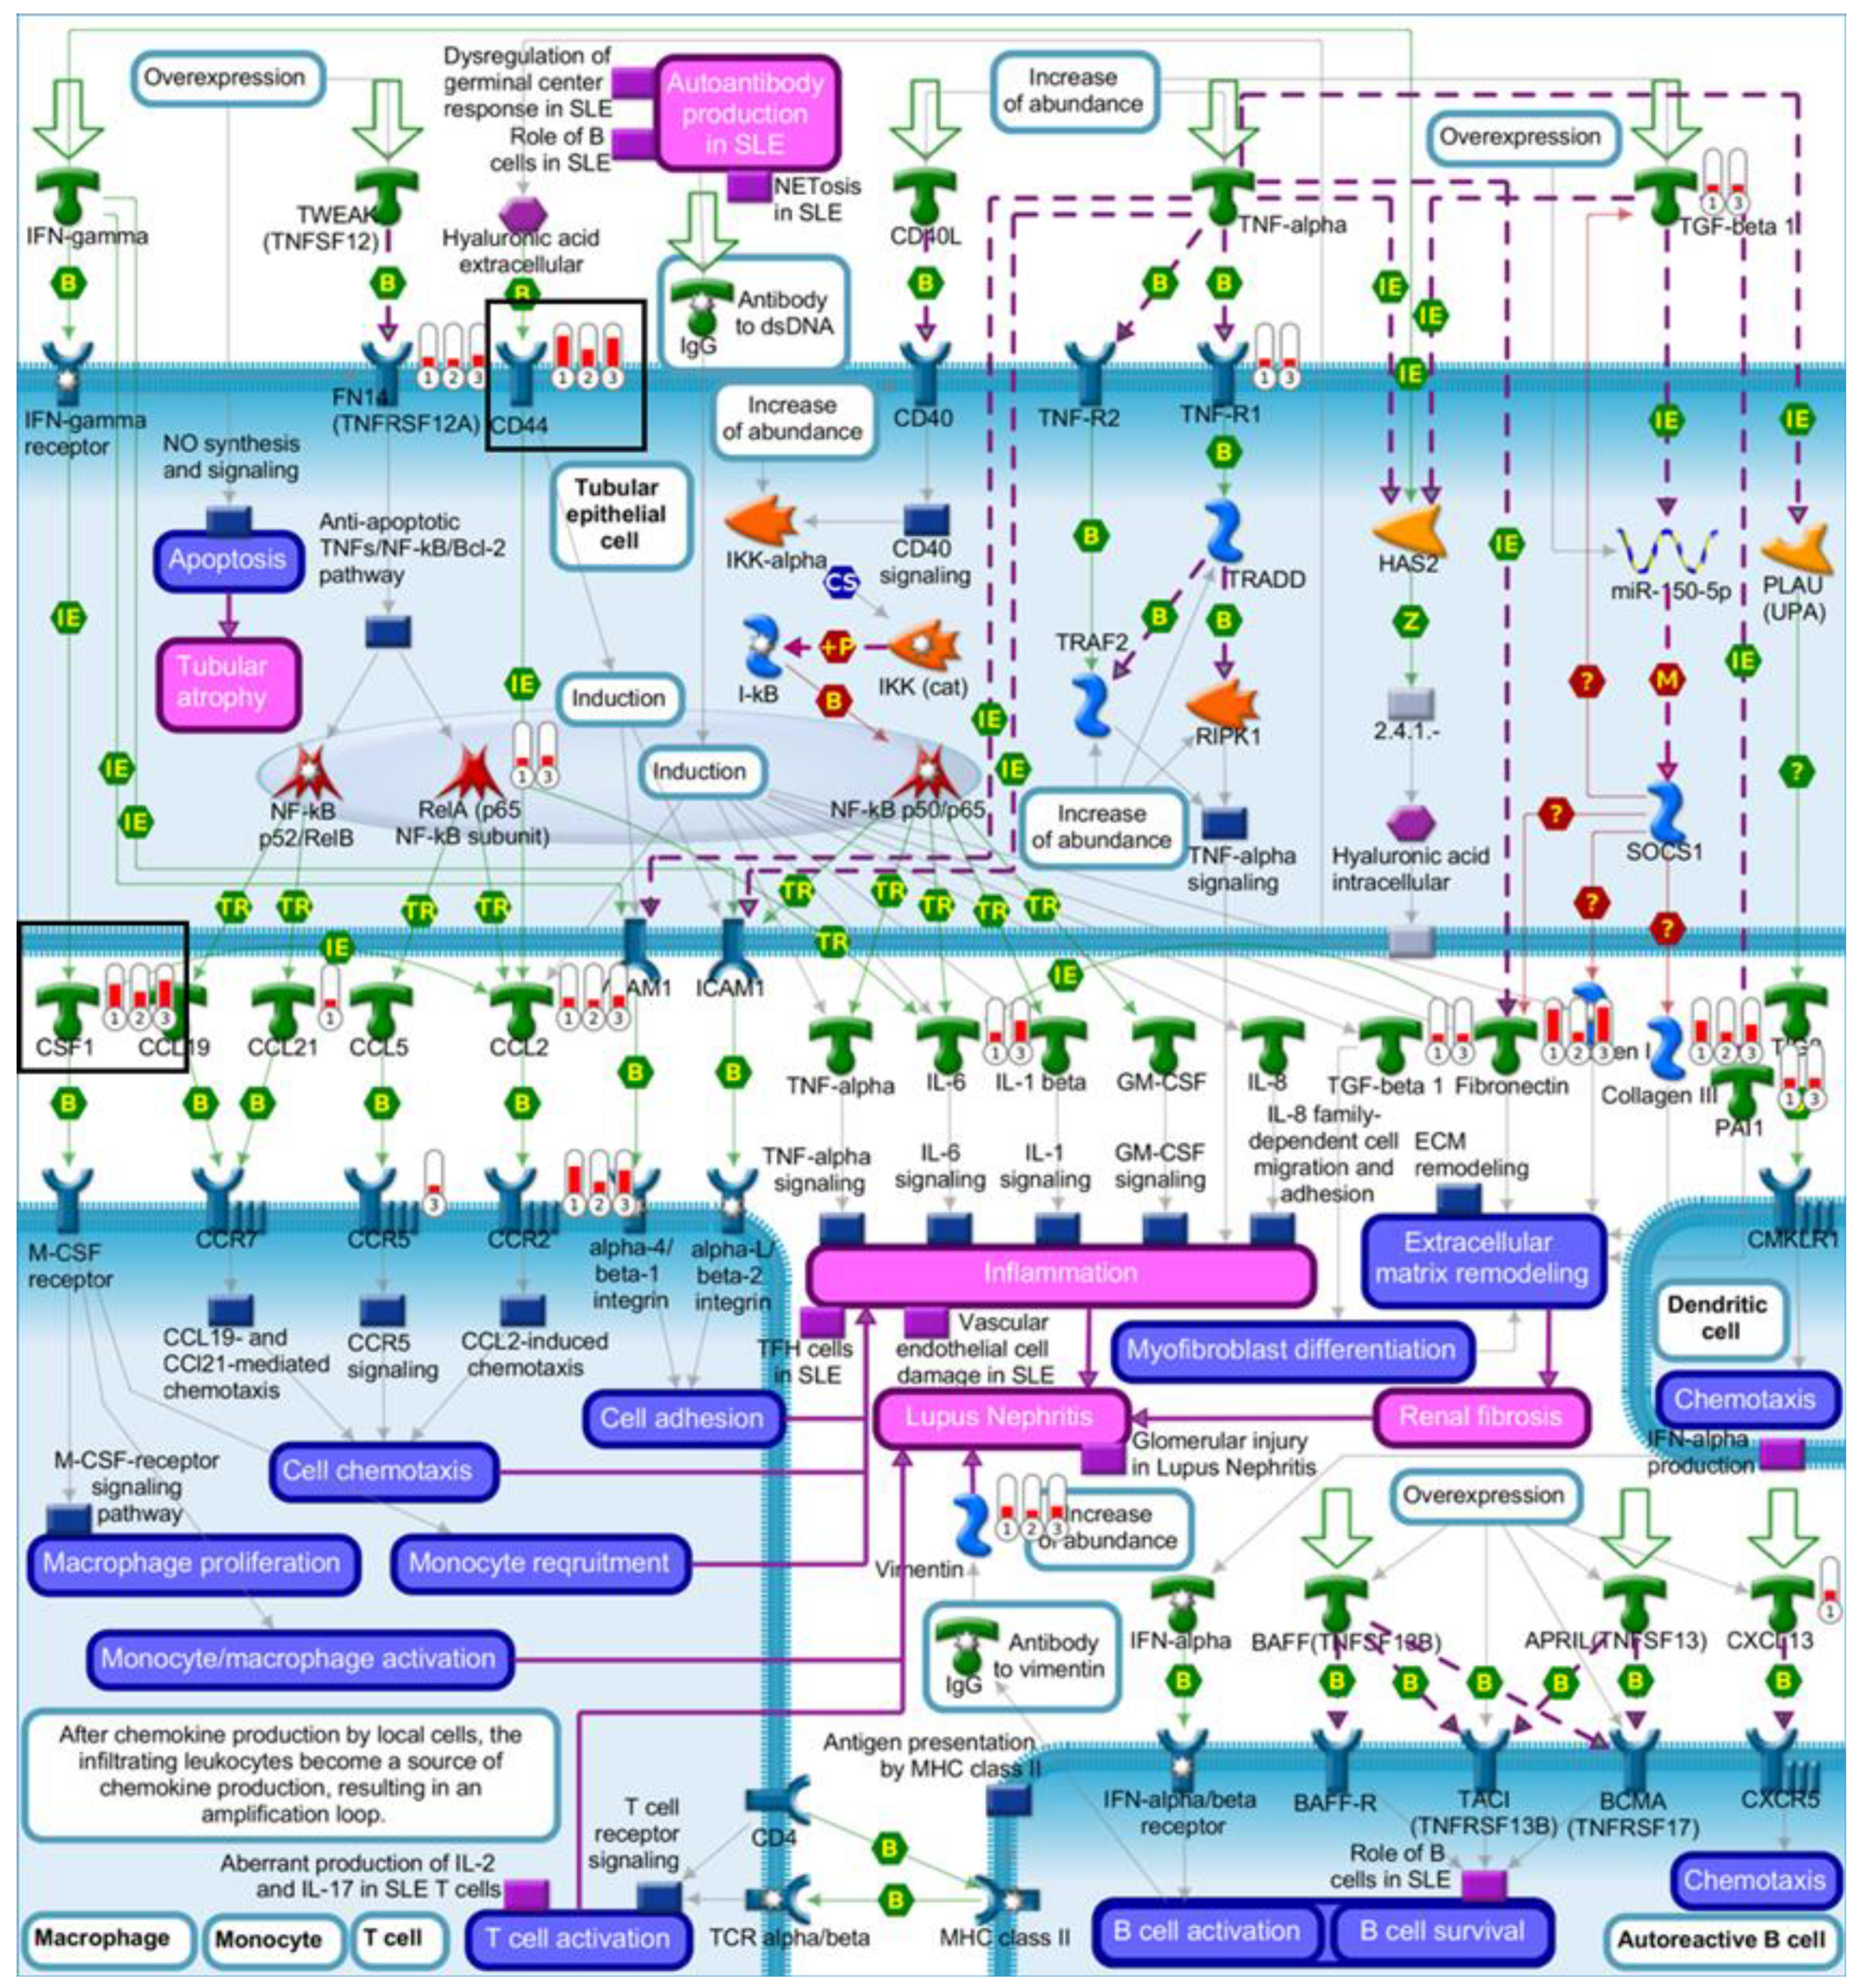
| Renal tubulointerstitial injury in Lupus nephritis | 5.80 × 10⁻⁶ | 3.74 × 10⁻⁴ | 8 | CSF1, CD44, CCL2, Fibronectin, Vimentin, FN14(TNFRSF12A), CCR2, Collagen III |
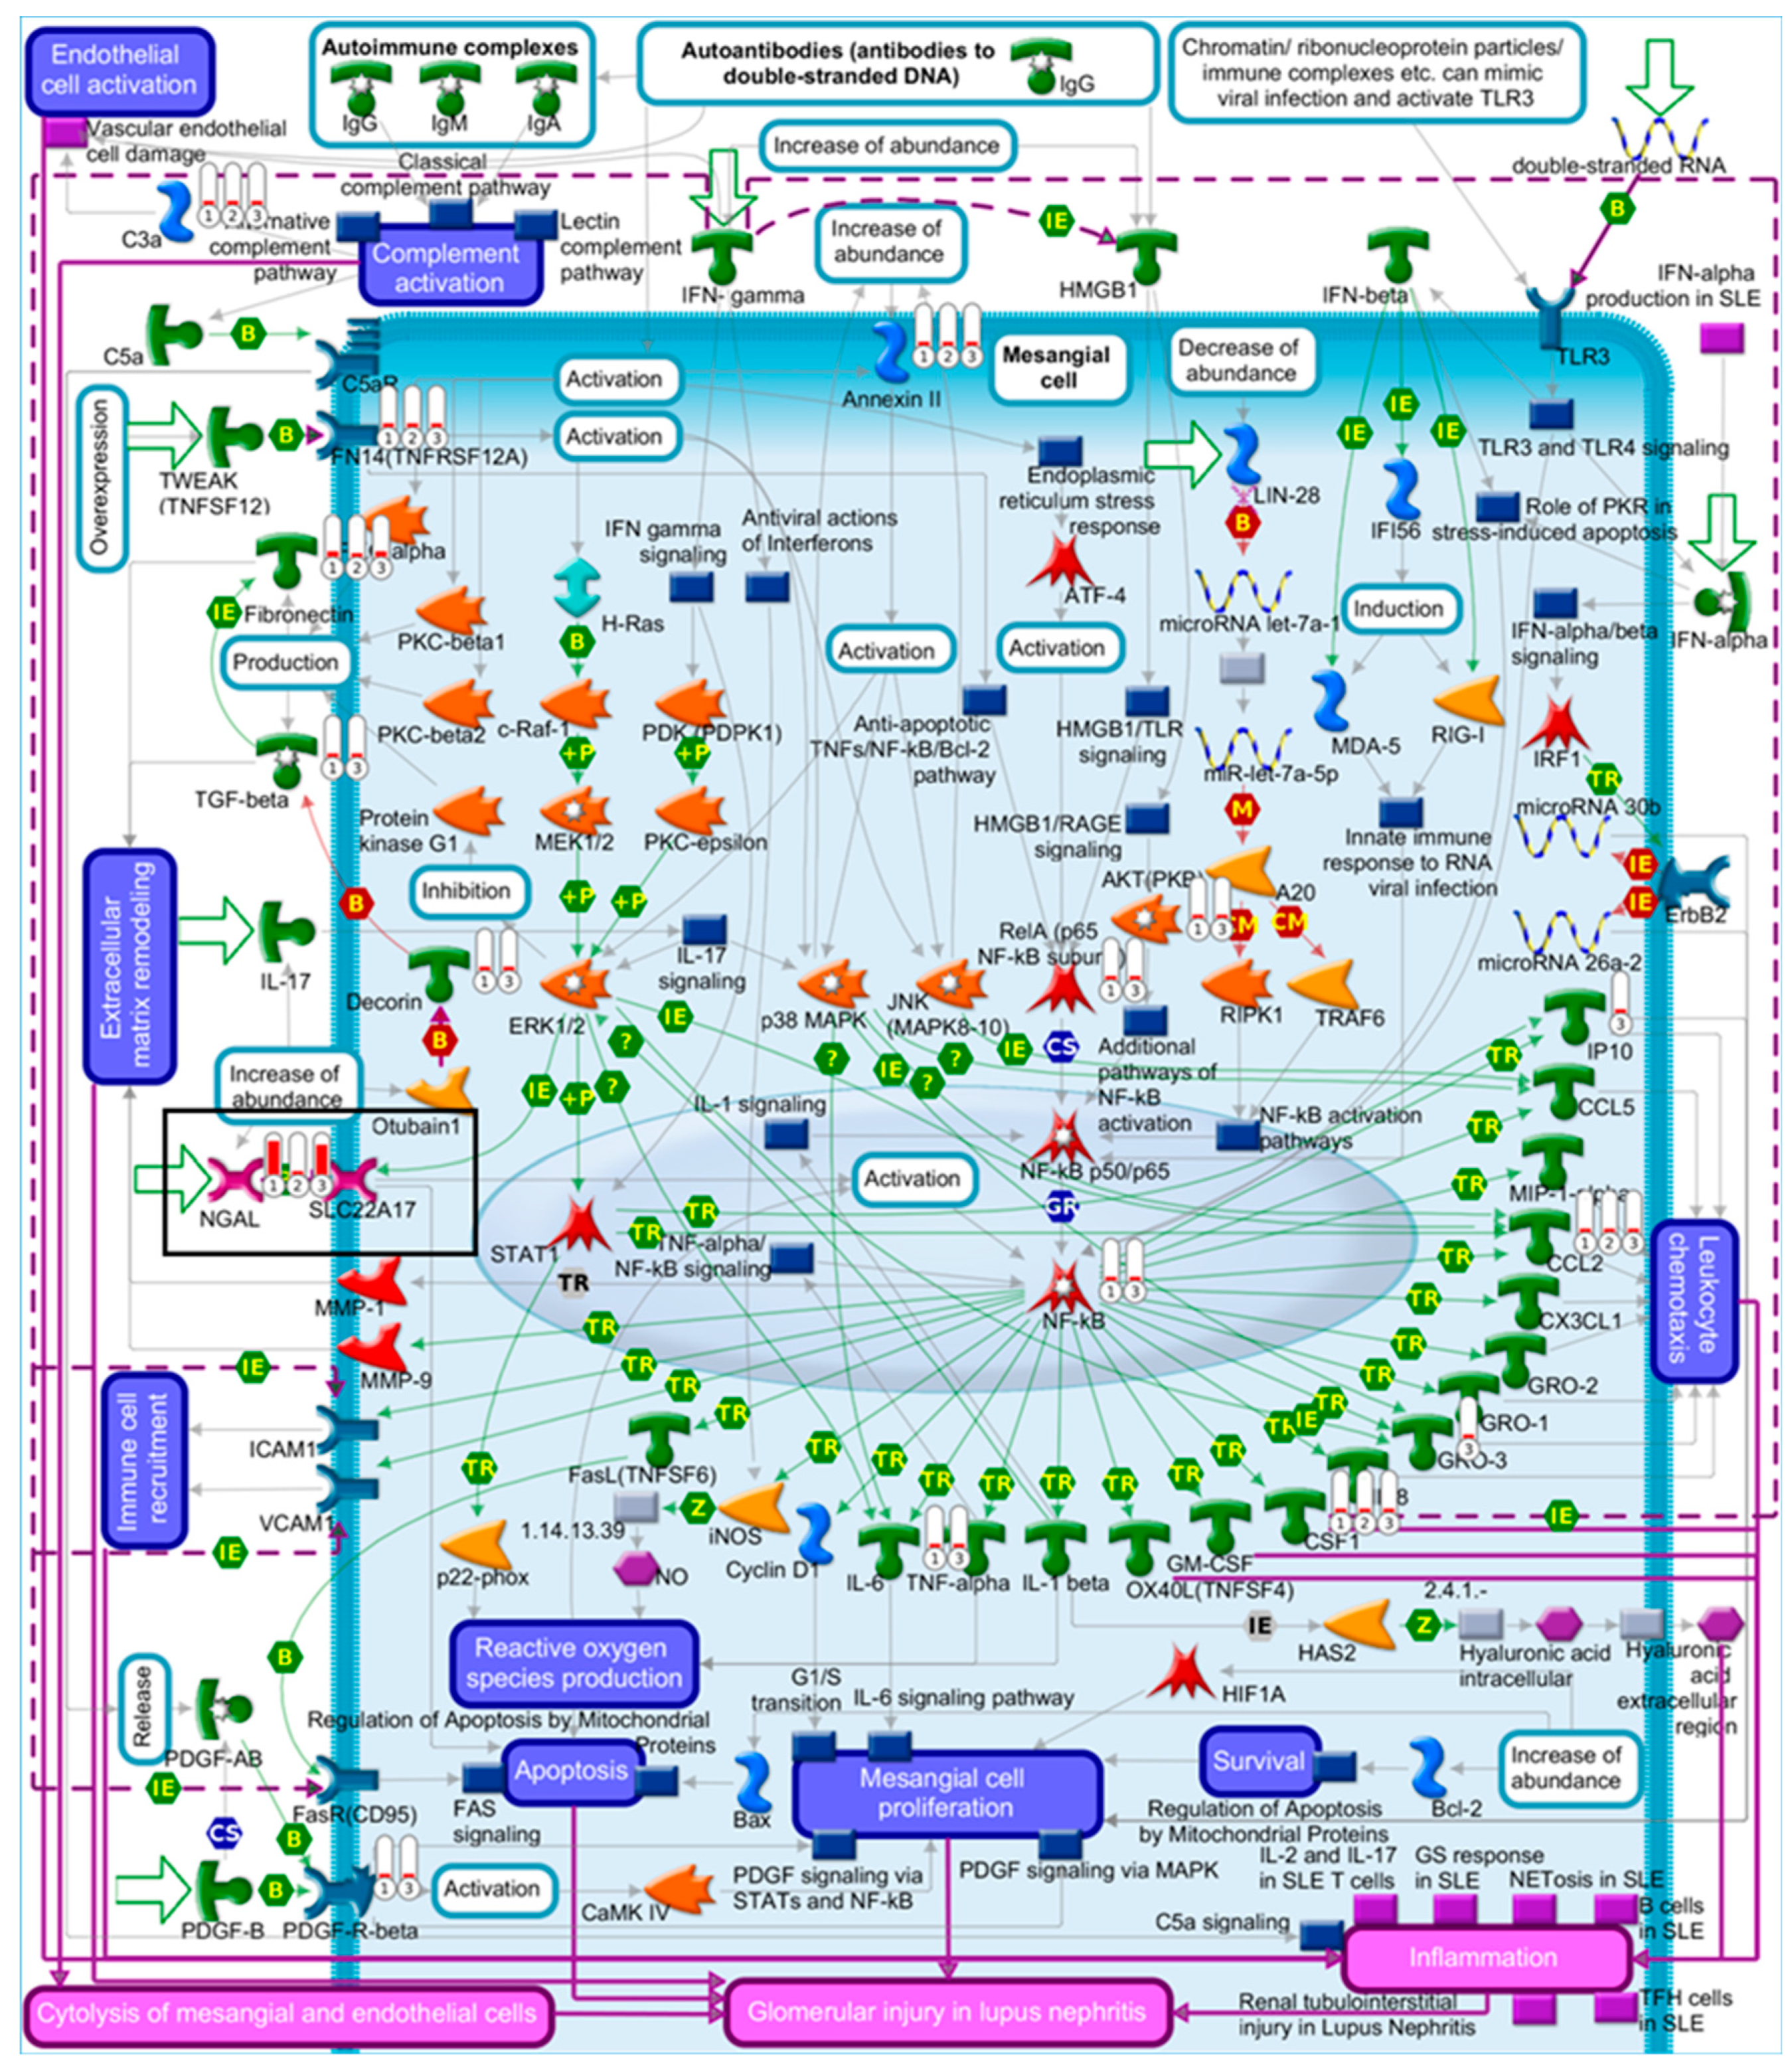
| Glomerular injury in Lupus nephritis | 4.88 × 10⁻⁴ | 1.24 × 10⁻² | 7 | CSF1, CCL2, Fibronectin, C3a, NGAL, Annexin II, FN14(TNFRSF12A) |
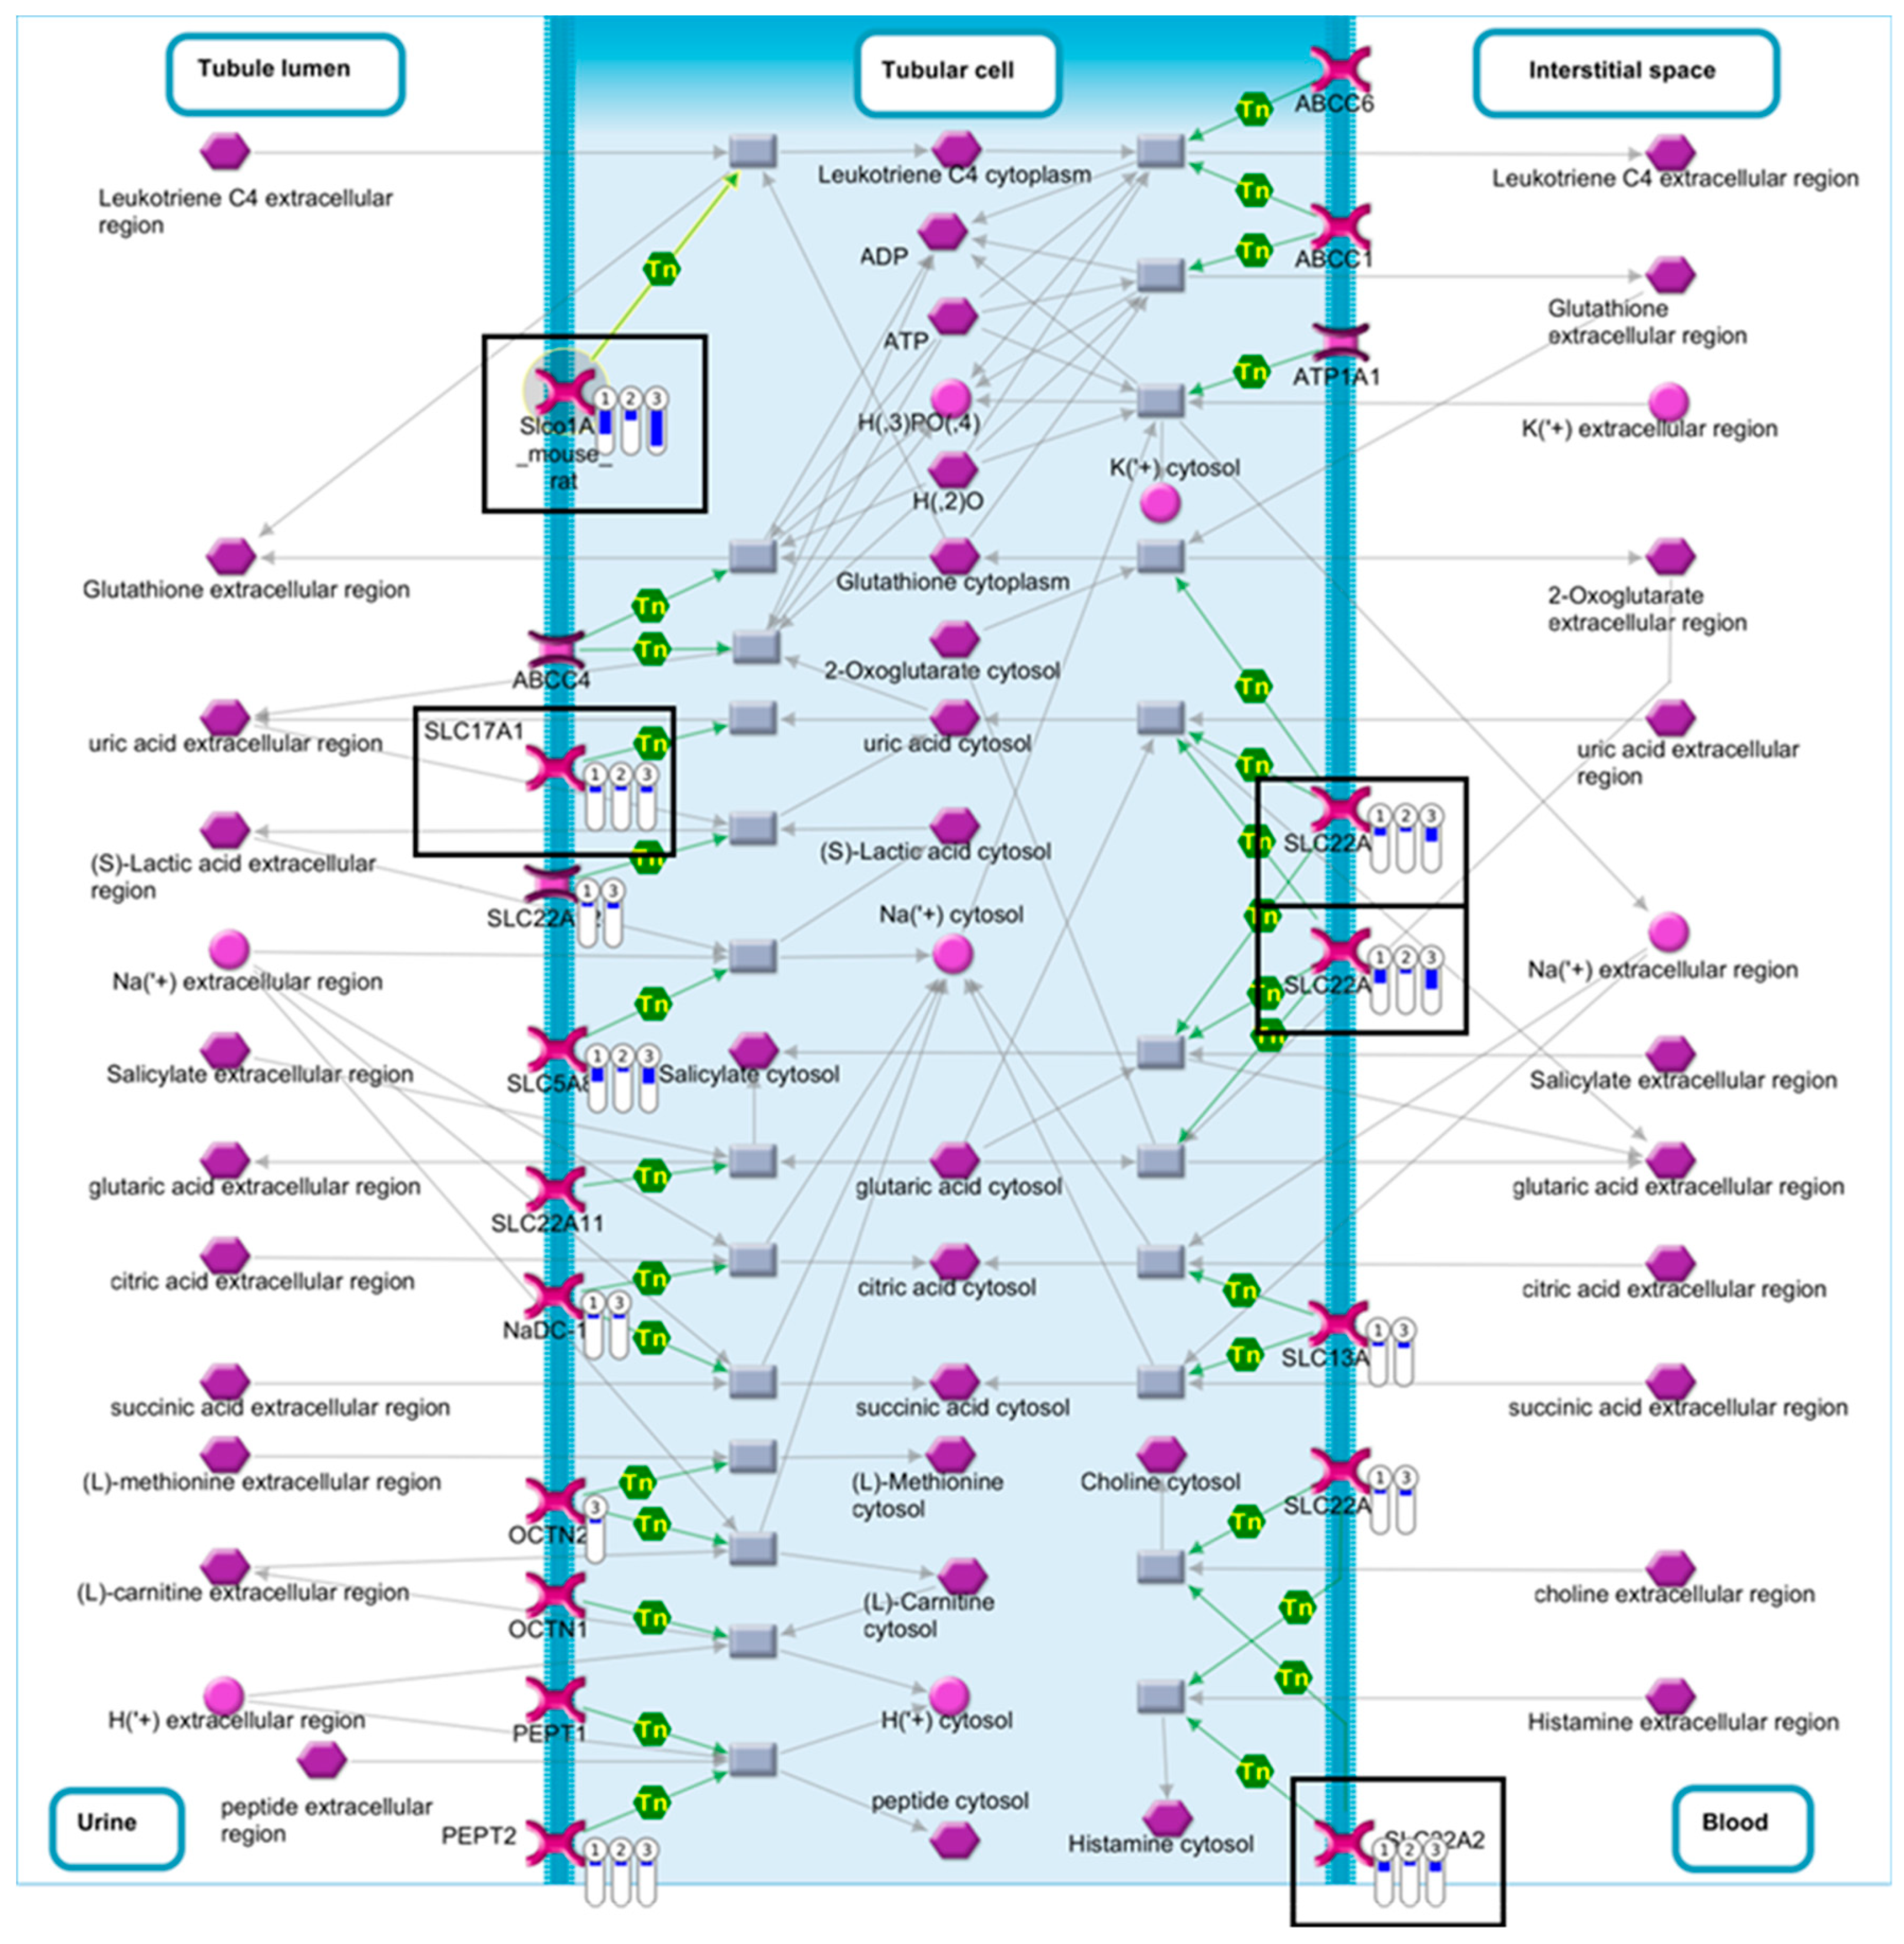
| Renal secretion of organic electrolytes (rodents) | 1.62 × 10⁻⁴ | 5.22 × 10⁻³ | 7 | SLC17A1, SLC22A2, SLC22A8, Slco1a1, SLC5A8, SLC22A6, PEPT2 |
| ID | Rank | Pathway | p-Value | FDR | No. Genes | List of Genes from MetaCore™ |
|---|---|---|---|---|---|---|
| Trp53(+/+) | ||||||
| 1 | 2 | GTP metabolism | 2.44 × 10⁻⁶ | 9.90 × 10⁻⁴ | 6 | GUCY1B1, GUCY1A3, GUCY1A2, Guanylate cyclase beta, Guanylate Cyclase 1, soluble, Guanylate cyclase alpha |
| 2 | 4 | IL-5 signalling via PI3K, MAPK and NF-kB | 1.82 × 10⁻⁵ | 3.69 × 10⁻³ | 6 | AP-1, c-Jun, Calpastatin, PI3K reg class IA (p85), MMP-2, Fc gamma RII alpha |
| 3 | 7 | CCL2 signalling | 4.35 × 10⁻⁵ | 5.05 × 10⁻³ | 5 | AP-1, c-Jun, ZO-1, PI3K reg class IA (p85), MMP-2 |
| 4 | 15 | Ceramides signalling pathway | 1.96 × 10⁻⁴ | 1.03 × 10⁻² | 4 | c-Jun, PI3K reg class IA (p85-alpha), PI3K reg class IA (p85), Cathepsin D |
| 5 | 18 | Lymphotoxin-β receptor signalling | 2.38 × 10⁻⁴ | 1.07 × 10⁻² | 4 | Apaf-1, c-Jun, CXCL13, CCL21 |
| 6 | 21 | TNF-R2 signalling pathways | 3.11 × 10⁻⁴ | 1.20 × 10⁻² | 4 | AP-1, c-Jun, PI3K reg class IA (p85), PI3K reg class IA |
| 7 | 23 | PTMs in IL-17-induced CIKS-independent signalling pathways | 3.39 × 10⁻⁴ | 1.20 × 10⁻² | 4 | AP-1, c-Jun, PI3K reg class IA (p85), PI3K reg class IA |
| 8 | 24 | TGF-β-dependent induction of epithelial-to-mesenchymal transition (EMT) via MAPK | 3.69 × 10⁻⁴ | 1.25 × 10⁻² | 4 | ITGB1, AP-1, c-Jun, MMP-2 |
| 9 | 25 | FGF2-dependent induction of EMT | 3.89 × 10⁻⁴ | 1.26 × 10⁻² | 3 | FGF2, AP-1, PI3K reg class IA (p85) |
| 10 | 26 | PEDF signalling | 4.33 × 10⁻⁴ | 1.35 × 10⁻² | 4 | SOD2, Fra-2, PI3K reg class IA, NGF |
| 11 | 31 | IL-4 signalling pathway | 6.02 × 10⁻⁴ | 1.51 × 10⁻² | 5 | AP-1, c-Jun, Fra-2, PI3K reg class IA (p85-alpha), c-Jun/Fra-2 |
| 12 | 32 | HSP60 and HSP70/TLR signalling pathway | 6.29 × 10⁻⁴ | 1.51 × 10⁻² | 4 | AP-1, c-Jun, CD14, HSP60 |
| 13 | 34 | Transcription of HIF-1 targets | 6.31 × 10⁻⁴ | 1.51 × 10⁻² | 5 | FGF2, MDR1, Adipophilin, MMP-2, DEC2 |
| 14 | 37 | TLR5, TLR7, TLR8 and TLR9 signalling pathways | 7.72 × 10⁻⁴ | 1.70 × 10⁻² | 4 | AP-1, c-Jun, PI3K reg class IA (p85), TLR8 |
| 15 | 42 | Adenosine A1 receptor signalling pathway | 1.06 × 10⁻³ | 1.98 × 10⁻² | 4 | SFK, PI3K reg class IA (p85), MMP-2, ADA |
| 16 | 45 | IL-18 signalling | 1.13 × 10⁻³ | 1.98 × 10⁻² | 4 | AP-1, c-Jun, PI3K reg class IA (p85-alpha), PI3K reg class IA |
| 17 | 48 | Regulation of EMT | 1.20 × 10⁻³ | 1.98 × 10⁻² | 4 | FGF2, c-Jun, ZO-1, MMP-2 |
| Trp53(+/-) | ||||||
| 1 | 1 | RAP2B regulation pathway | 6.07 × 10⁻⁴ | 2.43 × 10⁻³ | 1 | RAP-2B |
| 2 | 3 | Regulation of cyclic AMP levels by ACM | 3.90 × 10⁻³ | 4.08 × 10⁻³ | 1 | RAP-2B |
| 3 | 4 | β-adrenergic receptor-induced regulation of ERK | 4.08 × 10⁻³ | 4.08 × 10⁻³ | 1 | RAP-2B |
| Trp53(-/-) | ||||||
| 1 | 1 | The metaphase checkpoint | 1.42 × 10⁻⁷ | 1.36 × 10⁻⁴ | 8 | INCENP, CDCA1, CDC20, Rod, CENP-F, MAD2a, Survivin, CENP-H |
| 2 | 2 | Spindle assembly and chromosome separation | 1.90 × 10⁻⁵ | 9.05 × 10⁻³ | 6 | KNSL1, Importin (karyopherin)-alpha, CDC20, TPX2, MAD2a, Importin (karyopherin)-beta |
| 3 | 4 | dCTP/dUTP metabolism | 2.87 × 10⁻⁴ | 6.85 × 10⁻² | 7 | POLE1, Small RR subunit, RRM1, POLA2, Ribonucleotide reductase, RRM2, POLA1 |
| 4 | 6 | Transition and termination of DNA replication | 8.36 × 10⁻⁴ | 1.10 × 10⁻¹ | 4 | PCNA, Brca1, DNA ligase I, CDK2 |
| 5 | 7 | Anti-apoptotic TNFs/NF-kB/IAP pathway | 1.13 × 10⁻³ | 1.10 × 10⁻¹ | 4 | RelA (p65 NF-kB subunit), NF-kB, Survivin, c-IAP2 |
| 6 | 8 | Regulation of actin cytoskeleton nucleation and polymerization by Rho GTPases | 1.15 × 10⁻³ | 1.10 × 10⁻¹ | 5 | F-Actin cytoskeleton, FMNL1, mDIA2(DIAPH3), DRF, Actin cytoskeletal |
| 7 | 9 | IFN-α/β signalling via PI3K and NF-kB pathways | 1.22 × 10⁻³ | 1.10 × 10⁻¹ | 7 | PCNA, b-Myb, RelA (p65 NF-kB subunit), NF-kB, p107, CDK2, ISG15 |
| 8 | 10 | dATP/dITP metabolism | 1.22 × 10⁻³ | 1.10 × 10⁻¹ | 7 | POLE1, Small RR subunit, RRM1, POLA2, Ribonucleotide reductase, RRM2, POLA1 |
| 9 | 13 | Nucleocytoplasmic transport of CDK/cyclins | 1.63 × 10⁻³ | 1.15 × 10⁻¹ | 3 | Importin (karyopherin)-alpha, CDK2, Karyopherin beta 1 |
| 10 | 14 | Role of BRCA1 and BRCA2 in DNA repair | 1.69 × 10⁻³ | 1.15 × 10⁻¹ | 4 | PCNA, Brca1, Rad51, Brca2 |
| 11 | 16 | ATM/ATR regulation of G1/S checkpoint | 2.16 × 10⁻³ | 1.15 × 10⁻¹ | 4 | PCNA, Brca1, NF-kB, CDK2 |
| 12 | 17 | Role of APC in cell cycle regulation | 2.16 × 10⁻³ | 1.15 × 10⁻¹ | 4 | CDC20, MAD2a, Emi1, CDK2 |
| 13 | 18 | Start of DNA replication in early S phase | 2.16 × 10⁻³ | 1.15 × 10⁻¹ | 4 | ASK (Dbf4), MCM4, CDC7, CDK2 |
| 14 | 24 | RAN regulation pathway | 3.46 × 10⁻³ | 1.32 × 10⁻¹ | 3 | RanBP1, Importin (karyopherin)-alpha, Importin (karyopherin)-beta |
| 15 | 25 | RAC1 in cellular process | 3.71 × 10⁻³ | 1.32 × 10⁻¹ | 4 | F-Actin cytoskeleton, gp91-phox, Actin cytoskeletal, PARD6 |
| 16 | 29 | IL-9 signalling pathway | 4.34 × 10⁻³ | 1.32 × 10⁻¹ | 5 | IL-2R gamma chain, Scinderin, mTOR, Eotaxin, CCL7 |
| 17 | 30 | Macropinocytosis regulation by growth factors | 4.65 × 10⁻³ | 1.32 × 10⁻¹ | 5 | AMPK beta subunit, Leptin receptor, AMPK alpha subunit, PDE3B, Actin cytoskeletal |
| 18 | 31 | Inhibition of telomerase activity and cellular senescence | 4.72 × 10⁻³ | 1.32 × 10⁻¹ | 3 | Brca1, p107, CDK2 |
| 19 | 36 | Sirtuin 6 regulation and functions | 4.98 × 10⁻³ | 1.32 × 10⁻¹ | 5 | AMPK beta subunit, AMPK alpha subunit, RelA (p65 NF-kB subunit), c-IAP2, GLUT1 |
| 20 | 45 | ChREBP regulation pathway | 7.05 × 10⁻³ | 1.46 × 10⁻¹ | 3 | AMPK beta subunit, AMPK alpha subunit, Acyl-CoA synthetase |
| 21 | 46 | CDC42 in cellular processes | 7.05 × 10⁻³ | 1.46 × 10⁻¹ | 3 | F-Actin cytoskeleton, Actin cytoskeletal, PARD6 |
| 22 | 50 | Leptin signalling via PI3K-dependent pathway | 8.76 × 10⁻³ | 1.64 × 10⁻¹ | 4 | AMPK beta subunit, Leptin receptor, AMPK alpha subunit, PDE3B |
© 2019 by the authors. Licensee MDPI, Basel, Switzerland. This article is an open access article distributed under the terms and conditions of the Creative Commons Attribution (CC BY) license (http://creativecommons.org/licenses/by/4.0/).
Share and Cite
Sborchia, M.; Keun, H.C.; Phillips, D.H.; Arlt, V.M. The Impact of p53 on Aristolochic Acid I-Induced Gene Expression In Vivo. Int. J. Mol. Sci. 2019, 20, 6155. https://doi.org/10.3390/ijms20246155
Sborchia M, Keun HC, Phillips DH, Arlt VM. The Impact of p53 on Aristolochic Acid I-Induced Gene Expression In Vivo. International Journal of Molecular Sciences. 2019; 20(24):6155. https://doi.org/10.3390/ijms20246155
Chicago/Turabian StyleSborchia, Mateja, Hector C. Keun, David H. Phillips, and Volker M. Arlt. 2019. "The Impact of p53 on Aristolochic Acid I-Induced Gene Expression In Vivo" International Journal of Molecular Sciences 20, no. 24: 6155. https://doi.org/10.3390/ijms20246155
APA StyleSborchia, M., Keun, H. C., Phillips, D. H., & Arlt, V. M. (2019). The Impact of p53 on Aristolochic Acid I-Induced Gene Expression In Vivo. International Journal of Molecular Sciences, 20(24), 6155. https://doi.org/10.3390/ijms20246155