Abstract
Edwardsiella tarda is a Gram-negative bacterial pathogen with a broad host range, including fish, reptiles, and mammals. One prominent virulence feature of E. tarda is its ability to survive and replicate in host phagocytes, but the relevant molecular mechanism is largely unknown. In this study, we examined the transcriptome profiles of RAW264.7 cells, a murine macrophage cell line, infected with live E. tarda or stimulated with dead E. tarda for 4 h and 8 h. Eighteen libraries were constructed, and an average of 69 million clean reads per library were obtained, with ~81.63% of the reads being successfully mapped to the reference genome. In total, 208 and 232 differentially expressed genes (DEGs) were identified between live and dead E. tarda-treated cells at 4 h and 8 h post-infection, respectively. The DEGs were markedly enriched in the Gene Ontology (GO) and Kyoto Encyclopedia of Genes and Genomes (KEGG) pathways associated with immunity. Live E. tarda differed strikingly from dead E. tarda in the regulation of immune related genes. Compared with dead E. tarda-treated cells, live E. tarda-treated cells exhibited marked and significant suppression in the induction of a large amount of immune genes, including RIG-I-like receptors, cytokines, and interferon-related genes. Furthermore, some of the immune genes highly regulated by live E. tarda formed complicated interaction networks with each other. Together, the results of this study revealed a transcriptome profile specifically induced by the active virulence elements of live E. tarda during the infection process, thus adding new insights into the intracellular infection mechanism of E. tarda. This study also provided a valuable set of target genes for further study of the immune evasion strategy of E. tarda.
1. Introduction
Edwardsiella tarda is a Gram-negative bacteria and a pathogen with a broad range of hosts, including fish, birds, reptiles, and mammals [1,2]. In aquaculture, E. tarda is a lethal pathogen that infects both freshwater and marine fish, and induces heavy economic losses by causing a severe systemic disease known as edwardsiellosis [2]. As a result, E. tarda is considered one of the most serious pathogens of aquaculture. In addition, E. tarda is the only species in the Edwardsiella genus that is pathogenic to humans [1]. In humans, E. tarda has been reported to cause gastroenteritis, septicemia, meningitis, colitis, liver cirrhosis, tuboovarian abscess, and sepsis [1,3,4].
Recently, many virulence-associated factors and systems have been identified in E. tarda [5,6,7]. Unlike most bacterial pathogens of aquaculture source, E. tarda exhibits a strong capacity to circumvent the antibacterial immune reactions of the host, which enables the bacteria to disseminate in host tissues and cause systemic infection. Accumulating evidence has indicated that E. tarda is able to survive and replicate in host serum and phagocytes, the latter including macrophages [8,9,10,11,12]. Macrophages are professional phagocytes that provide the first line of innate immune defense against invading pathogens [13]. Macrophages, as well as other types of phagocytes, remove pathogens via various means, notably lysosome-dependent bacterial destruction by acidic enzymes, production of reactive oxygen species (ROS) and reactive nitrogen, and secretion of antimicrobial factors that promote other immune cells to clear the pathogens [14,15,16]. To survive in phagocytes such as macrophages, pathogens have developed various strategies to avoid or eliminate the cellular killing effects [17,18]. For E. tarda, it is known to suppress ROS production in fish macrophages and inhibit apoptosis by manipulating the expression of apoptotic genes in a fish cell line [9,19]. In the murine macrophage cell line of RAW264.7 and bone marrow derived macrophages (BMDM), E. tarda employed the clathrin- and caveolin-mediated endocytosis pathways for cellular invasion and caused suicidal destruction of the host cells by triggering inflammasome and pyroptosis [20,21]. However, the molecular mechanism of E. tarda infection in phagocytes still remains to be investigated.
In this study, in order to gain new understanding of the cellular infection mechanism of E. tarda, we employed high-throughput sequencing technology to examine the global transcription profiles of RAW264.7 cells infected with live E. tarda or treated with dead E. tarda of different time points. Comparative transcriptome analyses were then conducted to identify differentially expressed genes between these groups. With this approach, we uncovered a large number of immune-related genes specifically induced by the active infection of live E. tarda rather than by the passive action of host cell phagocytosis against inactive E. tarda. The results of our study added new insights into the intracellular pathogenicity of E. tarda and provided valuable transcriptome data for future studies.
2. Results
2.1. Infection of E. tarda in RAW264.7 Cells
The results showed that in RAW264.7 cells infected with live E. tarda, the intracellular numbers markedly increased with time from 0 to 8 h (Figure 1). In contrast, in RAW264.7 cells similarly infected with dead E. tarda, phagocytosis of the bacteria into the cells was observed, however, no increase of intracellular bacterial number was detected (Figure S1). Untreated RAW264.7 cells showed no presence of bacteria (Figure S2).
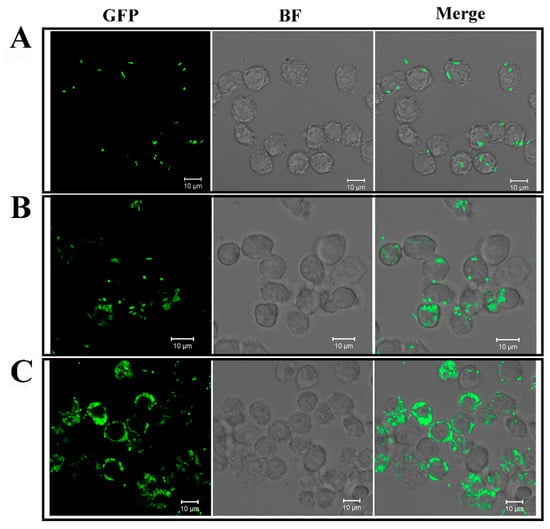
Figure 1.
Microscopic observation of the intracellular replication of Edwardsiella tarda in RAW264.7 cells. RAW264.7 cells were infected with GFP-expressing E. tarda for 2 h. The extracellular and surface-attached bacteria were killed by antibiotic treatment. The cells were then incubated for 0 h (A), 4 h (B), and 8 h (C) to allow intracellular bacterial replication. After incubation at each time point, the cells were observed with a confocal microscope under bright field (BF) and fluorescent light (GFP). The merged image of each panel is shown on the right. Scale bar, 10 µm.
2.2. RNA Sequencing and Read Mapping
The sequencing data of the 18 libraries are summarized in Table 1. A mean number of 69,507,649 filtered clean reads was obtained from each library, and 79.58–83.67% of the clean reads were mapped to the reference genome. The number of genes detected in each sample ranged from 12,605 to 12,891. Correlation analysis among sequencing samples showed good repeatability (Figure S3). All the sequencing data were submitted to Sequence Read Archive (SRA) in National Center for Biotechnology Information (NCBI) under the accession number PRJNA579883.

Table 1.
Summary of the sequencing data. C, control groups; D, dead E. tarda-treated groups; L, live E. tarda-treated groups; 4 h, 4 h post infection (hpi); 8 h, 8 hpi. Each sample was triplicated as indicated by the number after the hyphen, e.g., C4h-1, C4h-2, and C4h-3.
2.3. Differential Expression Analysis
As shown in Table 2 and Figure 2, the number of differentially expressed genes (DEGs) identified in L4h-vs-C4h was 145, with 81 being upregulated DEGs and 65 being downregulated DEGs. In contrast, the number of DEGs identified in D4h-vs-C4h was 387, with 268 upregulated DEGs and 119 downregulated DEGs. In the 8 hpi comparison, the number of DEGs identified in L8h-vs-C8h was 180, with 121 being upregulated DEGs and 59 being downregulated DEGs, while the number of DEGs in D8h-vs-C8h was 488, with 313 upregulated DEGs and 175 downregulated DEGs. When the live E. tarda-treated group and the dead E. tarda-treated group were compared, the number of DEGs in L4h-vs-D4h was 208, with 57 DEGs being upregulated and 151 DEGs being downregulated in the live E. tarda-treated group; the number of DEGs in L8h-vs-D8h was 232, with 63 DEGs being upregulated and 169 DEGs being downregulated in the live E. tarda-treated group (Table 2).
Table 2.
The number of differentially expressed genes (DEGs) for different groups. L4h, live E. tarda treatment for 4 h; L8h, live E. tarda treatment for 8 h; D4h, dead E. tarda treatment for 4 h; D8h, dead E. tarda treatment for 8 h; C4h, control group at 4 h of treatment; C8h, control group at 8 h of treatment.
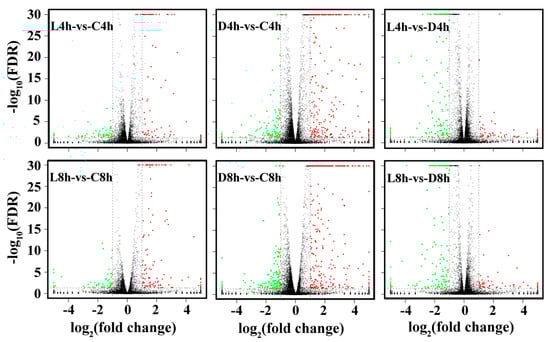
Figure 2.
Volcano plot of differentially expressed genes (DEGs) between different groups of Edwardsiella tarda-treated RAW264.7 cells. Red, green, and black dots represent upregulated DEGs, downregulated DEGs, and non-DEGs, respectively. The X-axis indicates the logarithm of fold change. The Y-axis displays the negative logarithm to the base 30 of the t-test Q-values. C: control groups, D: dead E. tarda-treated groups, L: live E. tarda-treated groups; 4 h: 4 hpi; 8 h: 8 hpi.
2.4. Validation of DEGs
In order to validate the RNA-seq results, the expression patterns of 12 DEGs were further analyzed with qRT-PCR. As shown in Figure 3, the qRT-PCR results of all examined DEGs were in good agreement with that of RNA-Seq. Furthermore, one of the DEGs identified by RNA-seq, i.e., NOS2, which catalyzes the production of nitric oxide (NO), was examined for both its expression based on qRT-PCR and its effect on NO production. The results showed that both dead and live E. tarda treatments significantly upregulated NOS2 expression at 4 h and 8 h, however, the expression levels induced by live E. tarda were significantly lower than that induced by dead E. tarda (Figure 4A). These results were similar to that of RNA-seq. Consistently, in dead E. tarda-treated cells, NO production was significantly increased at both 8 h and 16 h, whereas in live E. tarda-treated cells, NO production was significantly increased only at 16 h and to a level that was significantly lower than that in dead E. tarda-treated cells (Figure 4B).
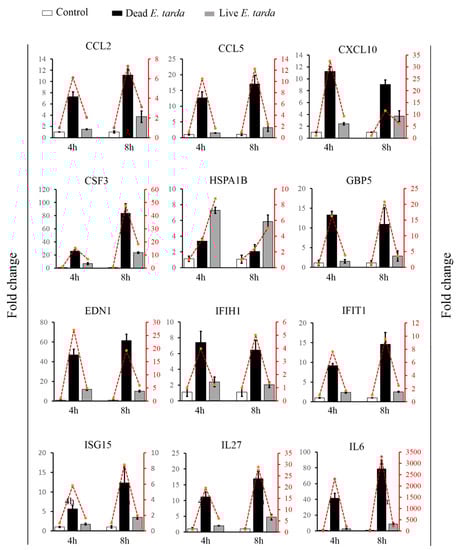
Figure 3.
The expression patterns of 12 differentially expressed genes (DEGs) determined by qRT-PCR. RAW264.7 cells were treated with or without (control) dead or live Edwardsiella tarda for 4 h and 8 h, and the expressions of the 12 selected DEGs were determined by qRT-PCR. Values are the means of triplicate experiments and shown as means ± SEM. The histograms represent the results of qRT-PCR; the line charts represent the results of RNA-seq.
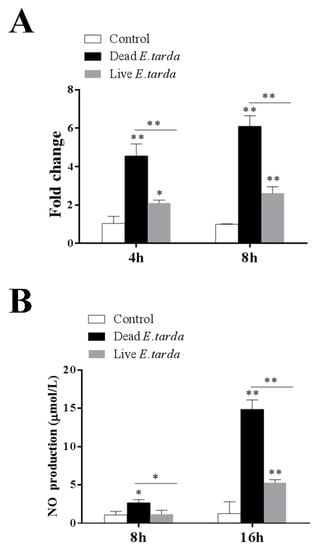
Figure 4.
NOS2 expression and nitric oxide (NO) production in RAW264.7 cells treated with Edwardsiella tarda. RAW264.7 cells were treated with or without (control) dead or live E. tarda. NOS2 expression was determined at 4 h and 8 h by qRT-PCR (A), and NO level was determined at 8 h and 16 h by measuring nitrite (B). Values are the means of three replicates and shown as means ± SEM. * p < 0.05; ** p < 0.01.
2.5. GO and KEGG Enrichment Analysis of the DEGs
GO functional enrichment analysis indicated that the DEGs of L4h-vs-D4h and L8h-vs-D8h were classified into three categories: Biological Process, Cellular Component, and Molecular Function. The complete or the top 20 significantly enriched GO terms of the three categories are shown in Figure 5. In the DEGs of L4h-vs-D4h, the GO terms of positive regulation of biological process, response to stress, immune system process, defense response, response to external stimulus, response to cytokine, immune effector process, response to external biotic stimulus, and response to another organism, were highly represented in the category of Biological Process. The GO terms of extracellular region and extracellular region part were highly represented in the category of Cellular Component. In the category of Molecular Function, the GO terms of receptor binding, nucleic acid binding transcription factor activity, cytokine receptor binding, cytokine activity, CCR chemokine receptor binding, and chemokine receptor binding, were also significantly enriched (Figure 5A). In the DEGs of L8h-vs-D8h, the GO terms of immune system process, multi−organism process, defense response, response to external stimulus, response to cytokine, response to biotic stimulus, response to external biotic stimulus, response to another organism, and immune effector process were highly represented in the Biological Process category. The GO terms of host, other organism, host cell, host cell part, other organism cell, and other organism part were significantly enriched in the Cellular Component category. In the category of Molecular Function, the GO term of binding was dominant. CCR chemokine receptor binding and chemokine receptor binding were also significantly enriched in the category of Molecular Function (Figure 5B). In KEGG analysis, the top 20 enriched pathways are shown in Figure 6. In the DEGs of L4h-vs-D4h, the top most represented KEGG categories included TNF signaling pathway, cytokine-cytokine receptor interaction, NOD-like receptor signaling pathway, chemokine signaling pathway, influenza A, rheumatoid arthritis, transcriptional misregulation in cancers, malaria, and herpes simplex infection. Other significantly enriched pathways included cytosolic DNA-sensing pathway, AGE-RAGE signaling pathway in diabetic complications, chagas disease (American trypanosomiasis), salmonella infection, legionellosis, NF-kappa B signaling pathway, and toll-like receptor signaling pathway (Figure 6A). In the DEGs of L8h-vs-D8h, the top most represented KEGG categories included influenza A, herpes simplex infection, TNF signaling pathway, measles, NOD-like receptor signaling pathway, cytosolic DNA sensing pathway, cytokine-cytokine receptor interaction, chagas disease (American trypanosomiasis), and rheumatoid arthritis. Other significantly enriched pathways included malaria, hepatitis C, and hepatitis B (Figure 6B).
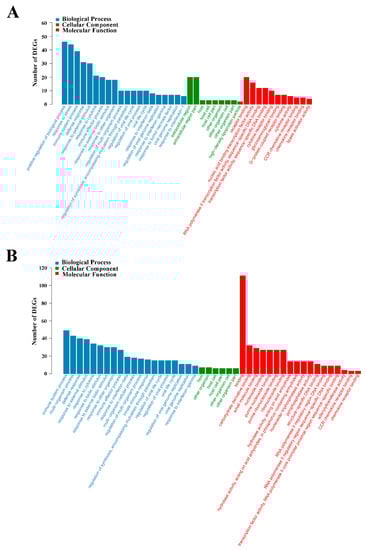
Figure 5.
GO enrichment analysis of differentially expressed genes (DEGs) in L4h-vs-D4h (A) and L8h-vs-D8h (B). The X- and Y-axis represent the significantly enriched GO terms and the corresponding number of DEGs, respectively.
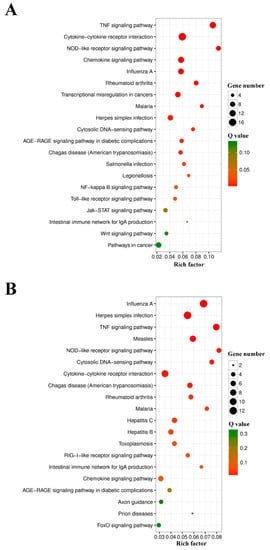
Figure 6.
The top 20 enriched KEGG pathways in the differentially expressed genes (DEGs) of L4h-VS-D4h (A) and L8h-VS-D8h (B). The color and size of the dots indicate Q-values and DEG numbers in pathways, respectively.
2.6. DEGs Involved in the Immune Response Induced by Live E. tarda
Diverse immune-related DEGs were identified in L4h-vs-D4h and L8h-vs-D8h, including retinoic acid-inducible gene I (RIG-I)-like receptors (RLRs), cytokines, interferon-related genes, and other immune-related genes, most of which were strikingly downregulated in live E. tarda-treated groups compared with that in dead E. tarda-treated groups (Table 3). For the RIG-I-like receptors, significant regulation was found in the genes of interferon induced with helicase C domain 1 (IFIH1), DEAD box polypeptide 58 (DDX58), and DEXH box polypeptide 58 (DHX58). IFIH1 was downregulated at both L4h-vs-D4h and L8h-vs-D8h, while DDX58 and DHX58 were downregulated at L8h-vs-D8h. A large number of DEGs in the category of cytokines were identified, including interleukins, chemokines, and colony stimulating factor. Interleukin (IL)-6 (IL-6), IL-27, IL1F9, chemokine C-C motif ligand (CCL) 5, CCL7, CCL2, and colony stimulating factor 3 (CSF3) were downregulated in both L4h-vs-D4h and L8h-vs-D8h. Fifteen interferon-related DEGs were detected, among which, guanylate binding protein (GBP) 2, GBP5, GBP2b, interferon-induced protein with tetratricopeptide repeats (IFIT) 3, IFIT3b, IFIT1, ubiquitin-like modifier (ISG15), immunity-related GTPase family M member 1(IRGM1), and IRGM2 were downregulated in both L4h-vs-D4h and L8h-vs-D8h. Other immune-related DEGs included myristoylated alanine rich protein kinase C substrate (MARCKS), programmed cell death 1 (PDCD1), inducible nitric oxide synthase 2 (NOS2), heat shock protein 1B (HSPA1B), endothelin 1 (EDN1), signal transducer and activator of transcription 2 (STAT2), and complement component 5a receptor 1 (C5AR1). Among these genes, MARCKS and EDN1 were downregulated in both L4h-vs-D4h and L8h-vs-D8h.
Table 3.
Immune-related DEGs in L4h-vs-D4h and L8h-vs-D8h. The “-” symbol before the fold change number indicates downregulation. ns, not significant.
2.7. The Interaction Networks of Immune-Related DEGs
The interaction networks of immune-related DEGs are shown in Figure 7. Table 4 lists the top 10 key DEGs with multiple interaction relationships. Among these DEGs, chemokine C-X-C motif ligand (CXCL) 10 displayed the highest number (29) of interactions. Next to CXCL10 was IL6, which interacted with 28 DEGs. Other highly interactive DEGs included IFIT2, CCL5, ISG15, IFIH1, IFIT1, CCL2, DDX58, and IRGM1, which exhibited interaction numbers ranging from 18 to 23 (Table 4).
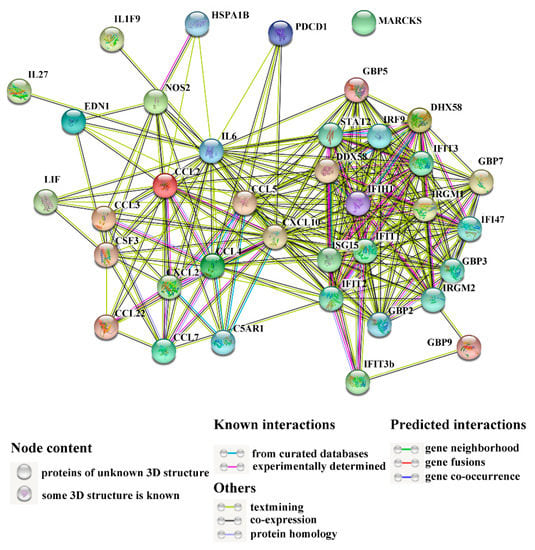
Figure 7.
The interaction networks of differentially expressed genes (DEGs) associated with immunity. Network nodes represent the proteins of immune-related DEGs; lines indicate association between the linked DEGs.
Table 4.
Summary of top 10 key DEGs based on protein-protein interaction networks.
2.8. Phosphorylation Status of NF-κB in RAW264.7 Cells Infected with Live and Dead E. tarda
To examine whether live and dead E. tarda infection induced different response with respect to NF-κB activation, the phosphorylation status of NF-κB p65 in RAW264.7 cells treated with live and dead E. tarda for different time was examined. The results showed that in RAW264.7 cells infected with dead E. tarda, phosphorylation of NF-κB p65 increased with time, while in RAW264.7 cells infected with live E. tarda, phosphorylation of NF-κB p65 was comparable during the course of infection and at each time point was apparently lower in level than that in dead E. tarda-infected cells (Figure 8).
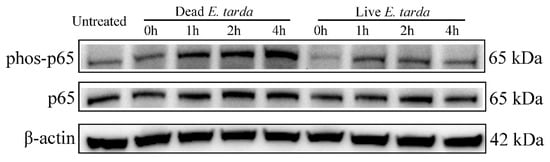
Figure 8.
Effects of live and dead Edwardsiella tarda on NF-κB p65 phosphorylation. RAW264.7 cells were infected with or without live or dead E. tarda for 2 h and then treated with 100 µg/mL gentamicin for 1 h. The cells were washed and incubated in fresh Opti-MEM containing 20 µg/mL gentamicin for 0 h, 1 h, 2 h or 4 h. After incubation, phosphorylation of NF-κB p65 (phos-p65) was detected by Western blot. β-actin was used as an internal reference.
3. Discussion
Survival in host phagocytic cells is the most important virulence characteristic of intracellular bacteria [22]. In this study, we observed that following incubation of E. tarda with RAW264.7 cells, the number of intracellular bacteria increased with time, indicating an ability of E. tarda to evade the bactericidal activities of macrophages and replicate inside phagocytic cells. To examine the host cell response triggered specifically during the process of E. tarda infection, we compared the transcriptomes of RAW264.7 cells exposed to live and dead E. tarda. Our results revealed that live and dead E. tarda elicited markedly different cellular responses. A previous study with human primary macrophages showed that the cells treated with inactivated Mycobacterium tuberculosis exhibited more differentially expressed microRNAs than the cells treated with live M. tuberculosis [13]. In our study, we found that compared with live E. tarda, dead E. tarda caused a much stronger host response, both in the number of the DEGs and in the degree of the expressional change of the DEGs. The DEGs induced by dead E. tarda were likely involved in innate immunity, particularly in that related to phagocytosis, while the DEGs specifically induced by live E. tarda were at least in part involved in the active immune evasion of the pathogen. GO annotation and KEGG pathway analysis classified immune-related DEGs into several categories, of which the DEGs strongly regulated by live E. tarda are discussed below.
3.1. RIG-I-Like Receptors
RIG-I-like receptors (RLRs) are a type of pattern-recognition receptors (PRRs) that identify pathogen association molecular patterns (PAMPs) and activate non-specific host defenses [23]. RLRs are cytosolic RNA-sensing proteins responsible for intracellular immune surveillance against primarily viral infections [24]. Currently, the RLRs family contains three members, i.e., IFIH1, DDX58 and DHX58. Interestingly, in our study, all the three RLRs members were down-regulated significantly in live E. tarda-infected groups compared with that in dead E. tarda-treated groups. In addition, IFIH1 and DDX58 were among the top 10 key genes based on protein-protein interaction analysis. Previous studies showed that DDX58 and IFIH1 participated in the production of type I interferon (IFN) and the intracellular immunity against various bacteria including Escherichia coli, Acinetobacter baumannii, Legionella pneumophila, and Pseudomonas aeruginosa [25,26,27]. The role of DHX58 in antimicrobial immunity is less clear, but it has been demonstrated that DHX58 could facilitate viral RNA recognition by IFIH1 and DDX58 [28]. Based on these observations, the systematic down-regulation of all RLR members by live E. tarda observed in our study suggested an important role of RLRs in E. tarda infection. It is likely that RLRs, as intracellular PRRs, recognize E. tarda-associated PAMPs during the intracellular infection process of the pathogen and elicit cellular responses that promote E. tarda clearance. As such, the downregulation of the expressions of the PRRs represents an infection strategy of E. tarda to overcome the immune defense of the host cells.
3.2. Cytokines
Cytokines are secreted mainly by activated immune-related cells and vital to antimicrobial infections [29,30]. In our study, it was found that compared with dead E. tarda, live E. tarda significantly down-regulated the expression of a number of interleukins and chemokines. Among the interleukins, IL6 was the most down-regulated, with a more than 10-fold change in expression level at both 4 hpi and 8 hpi. In addition, IL6 was a top 10 key DEGs with extensive protein-protein interactions. IL6 is known to be one of the major pro-inflammatory cytokines and participate in the infection process of bacterial pathogens [31,32]. A previous study showed that Mycobacterium marinum suppressed the production of IL6 in human macrophages to facilitate its survival [33]. In our study, it is very likely that by down-regulating IL6 expression, E. tarda blocked the induction of inflammation response in RAW264.7 cells, which allowed the pathogen to survive inside the macrophages.
Chemokines are classified into four families, i.e., XC, CC, CXC, and CX3C, of which, CXC and CC chemokines are the two major families [34]. During immune surveillance, chemokines guide cells of the immune system to the sites of infection and are important for effective clearance of pathogens [35,36,37,38]. In our study, comparing with dead E. tarda, live E. tarda significantly down-regulated the expressions of eight chemokines, all of which are of the CC and CXC families, suggesting an extensive regulatory effect of E. tarda on the major groups of chemokines. Among these differentially expressed chemokine genes, CXCL10, CCL5, and CCL2 were identified to be the key genes with multiple interaction relationships with other genes. These results underlay the importance of CC and CXC chemokines in host immune defense, which makes them one of the major targets of manipulation by E. tarda.
3.3. Interferon-Related Genes
Interferons (IFNs) are potent inducers of antimicrobial effectors and essential to host defense against intracellular pathogens [39,40,41,42]. In our study, a series of interferon-related genes were found to be down-regulated in live E. tarda-treated groups compared with that in dead E. tarda-treated groups. Strikingly, six members of the GBP family were significantly down-regulated by live E. tarda, with GBP5 being the most down-regulated. GBPs are known to participate in inflammasome assembly, apoptosis, and pyroptosis, and play a vital role in the defense against vacuolar pathogens [43,44,45]. The systematic downregulation of a large number of GBPs stressed the importance of GBP-mediated immunity in the clearance of E. tarda. Other strikingly suppressed genes included the family of IFIT, in which four members were significantly down-regulated by live E. tarda. IFITs are known to participate in antiviral immunity, but their functions in bacterial infection are essentially unknown [46]. In our study, the IFITs were not only down-regulated but also among the top 10 key genes with multiple interactive relationships with other genes. These observations indicated a potentially profound effect of IFITs on E. tarda infection. Other interferon-related DEGs down-regulated at both 4 hpi and 8 hpi included two members of the immunity-related GTPase (IRG) family, which is known to facilitate resistance against intracellular bacteria [47,48], and ISG15, which encodes an ubiquitin-like protein and is involved in viral and bacterial infections [49,50,51]. The significant downregulation of these genes by live E. tarda suggested that they likely played a vital role in the intracellular infection of E. tarda.
3.4. Other Immune-Related Genes
NOS2 regulates the production of NO, an important component of host defense against intracellular pathogens [52,53]. In order to survive, some pathogens have evolved ways of avoiding NO-mediated killing [54,55,56,57]. Previous studies showed that E. tarda induced NO production in RAW264.7 cells [11]. Consistently, in our study, the levels of NOS2 mRNA and NO production were augmented by both live and dead E. tarda, however, the folds of augmentation induced by live E. tarda were significantly lower than that induced by dead E. tarda. These results indicated that live E. tarda was able to inhibit, though not completely, NO-mediated immune response at the transcription level. Other immune-related DEGs included EDN1, a pro-inflammatory mediator known to play a role in Mycobacterium tuberculosis infection [58,59], and MARCKS, a lipopolysaccharide-induced protein kinase C substrate. MARCKS has been proposed to regulate actin-membrane interactions and is involved in phagocytosis and membrane trafficking [60,61]. The downregulation of these genes by live E. tarda may reduce inflammation and phagocytosis associated anti-bacterial effect, thus facilitating the invasion and survival of the pathogen.
NF-κB is a vital immune regulator, which can be activated by RIG-I signaling and activates the transcription of a large array of cytokines and other immune genes, such as NOS2 [62,63,64]. In the present work, we observed that the phosphorylation level of NF-κB p65 was decreased upon live versus dead E. tarda infection, indicating a suppression of NF-κB activity by live E. tarda. In consistence, members of RLRs (IFIH1, DDX58 and DHX58) and cytokines (such as IL6, CCL2, and CCL5), as well as NOS2, which are known to be the upstream PRRs and downstream target genes of NF-κB, respectively, were downregulated in RAW264.7 cells infected by live E. tarda. These observations implythat E. tarda is likely able to modulate the transcription of the PRRs of the RIG-I pathway and retard the subsequent activation of NF-κB signaling, thereby subverting host immune responses and facilitating infection.
In conclusion, in this study, we identified a large number of immune genes, in particular RIG-I-like receptors, cytokines, and interferon-regulated genes, associated with the intracellular infection of E. tarda. Since these genes were identified based on a comparative analysis between dead and live E. tarda-induced transcriptomes, they primarily represent the genes specifically induced by the virulence determinants of E. tarda expressed during the active infection process. Hence, these DEGs are very likely the manipulation targets of E. tarda immune evasion. Our results added new insights into the intracellular infection mechanism of E. tarda and provided valuable targets for future studies of E. tarda-host interaction.
4. Materials and Methods
4.1. Bacterial Strains and Cell Culture
The E. tarda strain used in this study was a fish pathogen that has been reported previously [65]. E. tarda containing the GFP-expressing plasmid pGFPuv has been reported previously [20]. The GFP- expressing E. tarda was used for confocal microscopy described below. E. tarda was cultured in Opti-MEM (Gibco, Grand Island, NY, USA) without shaking at 30 °C. RAW264.7 cells were purchased from American Tissue Culture Collection (ATCC, Rockville, MD, USA). The cells were cultured in DMEM supplemented with 10% fetal bovine serum (FBS) (Gibco, Grand Island, NY, USA) at 37 °C in a humidified atmosphere containing 5% carbon dioxide.
4.2. Cellular Infection and Confocal Microscopy
RAW264.7 cells were infected with E. tarda as described previously [20] with slight adjustments. Briefly, E. tarda was grown in Opti-MEM (Gibco, USA) at 30 °C without shaking to an OD600 of 0.6. To prepare live E. tarda sample, the bacteria were collected by centrifugation at 8000× g, washed with PBS, and resuspended in Opti-MEM to 1 × 10⁸ CFU/mL. To prepare inactivated E. tarda samples, the bacteria were heated at 65 °C for 45 min, and loss of bacterial viability was confirmed by plating onto Luria-Bertani (LB) agar plates and failing to see any bacterial growth. After heat inactivation, the bacteria were collected by centrifugation, washed with PBS, and resuspended in Opti-MEM as above. Cellular infection was conducted in triplicate as follows. Equal amounts of live and inactivated E. tarda were added separately to RAW264.7 cells in a 24-well plate at a multiplicity of infection (MOI) of 10:1. The control group of RAW264.7 cells was added with an equal amount of Opti-MEM. The plate was centrifuged at 400× g for 10 min, followed by incubation at 30 °C for 2 h (h). After incubation, the supernatant of the culture was removed. To kill extracellular E. tarda, fresh Opti-MEM containing gentamicin (100 µg/mL) was added to the plate, and the plate was incubated at 30 °C for 1 h. The cells were then washed three times with PBS and cultured in Opti-MEM containing 20 µg/mL gentamicin for 4 h or 8 h to allow intracellular replication of the bacteria. The cells were then used for RNA sequencing (described below) and observation with a Zeiss LSM 710 confocal microscope (Carl Zeiss, Oberkochen, Germany). For microscopic observation of dead E. tarda-treated RAW264.7 cells, E. tarda was inactivated as above, washed with PBS, and treated with 1 mg/mL fluorescein isothiocyanate (FITC) (Tiangen, Beijing, China) at 37 °C with shaking for 1.5 h. The FITC-labeled dead E. tarda was extensively washed with PBS and then used for cellular infection as above.
4.3. RNA Preparation, Library Construction, and Sequencing
RAW264.7 cells were treated with live E. tarda for 4 h and 8 h (named L4h and L8h, respectively) or with inactivated (dead) E. tarda for 4 h and 8 h (named D4h and D8h, respectively). As controls, RAW264.7 cells without any bacterial treatment were similarly cultured for 4 h and 8 h (named C4h and C8h, respectively). Triplicate samples of the above RAW264.7 cells were collected and used for the construction of 18 libraries. Total RNA extraction was conducted using Trizol reagent (Invitrogen, Carlsbad, CA, USA). The quality of the purified RNA was assessed using Agilent 2100 Bioanalyzer. RNA samples with high integrity (RIN > 8.0) and concentration of above 200 ng/µl were used for cDNA library construction. mRNA was enriched with Oligo (dT) beads (Qiagen, Hilden, Germany). The enriched mRNA was fragmented into short fragments and reverse transcribed into first-strand cDNA. The second-strand cDNA was synthesized using DNA polymerase I (Thermo Scientific, Waltham, MA, USA) and dNTP in the presence of RNase H. The cDNA fragments were purified with QiaQuick PCR extraction kit (Qiagen, Hilden, Germany), end repaired, poly (A) added, and ligated to Illumina sequencing adapters. The cDNA with the size of approximately 200 bp was selected and paired-end (PE150) sequenced by Illumina HiSeqTM 2500 platform in Gene Denovo Biotechnology Co (Guangzhou, China).
4.4. Sequence Quality Control and Data Processing
Raw reads were filtered by removing the low quality reads, including reads containing adapters, reads containing nucleotide with q quality score lower than 20, and reads with unknown nucleotides larger than 10%, before mapping to ribosome RNA (rRNA) database in Bowtie 2 version 2.2.8 [66]. The rRNA-mapped reads were removed, and the remaining reads were mapped to the Mus musculus reference genome (https://www.ncbi.nlm.nih.gov/genome/52?genome_assembly_id=334509) using TopHat v2.1.1 [67]. The reconstruction of the transcripts was conducted using software cufflinks v2.2.1 [68]. Gene abundances were quantified with software RSEM v1.2.19 [69]. The gene expression level was normalized by using the Fragments Per Kilobase of transcript per Million mapped reads (FPKM) method. Correlation analysis among sequencing samples were performed with R package gmodels (http://www.r-project.org/).
4.5. Differentially Expressed Genes (DEGs) Analysis
To examine the differentially expressed genes (DEGs) between different groups, pairwise comparisons of the DEGs among the different groups were carried out, i.e., live E. tarda-treated groups versus control groups at 4 hpi and 8 hpi (L4h-vs-C4h and L8h-vs-C8h, respectively), dead E. tarda-treated groups versus control groups at 4 hpi and 8 hpi (D4h-vs-C4h and D8h-vs-C8h, respectively), and live E. tarda-treated groups versus dead E. tarda-treated groups at 4 hpi and 8hpi (L4h-vs-D8h and L8h-vs-D8h, respectively). DEGs were identified using the edgeR package (http://www.r-project.org/). Genes with a fold change ≥ 2 and a false discovery rate (FDR) < 0.05 were treated as significant DEGs.
4.6. Gene Ontology (GO) and Kyoto Encyclopedia of Genes and Genomes (KEGG) Enrichment Analysis
DEGs were further annotated by GO functional enrichment and KEGG pathway analysis. All DEGs were mapped to the GO terms in the Gene Ontology database (http://www.geneontology.org/), and gene numbers were calculated for every term. Pathway enrichment analysis was performed using the Kyoto Encyclopedia of Genes and Genomes database [70]. After multiple test correction, GO terms and pathways with Q value < 0.05 were considered to be significantly enriched in DEGs.
4.7. Validation of DEGs by Quantitative Real-Time Reverse Transcription-PCR (qRT-PCR)
The sequences of the primers used for qRT-PCR are listed in Table 5. The mRNA prepared in the above cellular infection was used for cDNA synthesis with RevertAid First Strand cDNA Synthesis Kit (Thermo Scientific, Waltham, MA, USA). qRT-PCR was carried out with Eppendorf Mastercycler epgradient S (Eppendorf, Hamburg, Germany) using TB Green® Premix Ex Taq™ II (Takara, Dalian, China). The PCR reaction was performed in a 20 μL volume containing 10 μL TB Green Premix Ex Taq II, 0.4 μM specific forward primer and reverse primer, and 2.0 μL diluted cDNA (50 ng/μL). The PCR conditions were 95 °C for 30 s, followed by 40 cycles of 95 °C for 5 s and 60 °C for 30 s. The specificity of qRT-PCR products was examined by melting curve analysis. The expression of each gene was normalized to that of glyceraldehyde-3-phosphate dehydrogenase (GAPDH) and calculated using the comparative threshold cycle method (2−ΔΔCT). The experiment was performed in triplicate.
Table 5.
List of primers used for qRT-PCR validation.
4.8. Determination of NOS2 Expression and Nitric Oxide (NO) Production
RAW264.7 cells were treated with or without (control) dead or live E. tarda as described above for 4 h, 8 h, and 16 h. NOS2 expression was determined by qRT-PCR as described above. NO production was determined by measuring its end product nitrite using the Nitric Oxide Assay Kit (Beyotime, Beijing, China) according to the manufacturer’s instructions. The assays were performed three times.
4.9. Construction of Protein-Protein Interaction Networks
The immune-related DEGs in Table 3 were used to construct protein-protein interaction (PPI) networks. PPI networks were constructed using STRING v10.0 (http://string-db.org/) with default parameters [71].
4.10. Western Blot to Detect Phospho-NF-κB p65
RAW264.7 cells were treated with dead or live E. tarda as above for 0 h, 1 h, 2 h, and 4 h. The cells were lysed on ice for 30 min with RIPA lysis buffer (Beyotime, Beijing, China) containing phosphatase inhibitor cocktail (Beyotime, Beijing, China). The cell lysates were mixed with SDS-PAGE loading buffer and boiled at 100 °C for 10 min. The samples were then subjected to SDS-PAGE, and the separated proteins were electro-transferred from gels to nitrocellulose blotting membranes (GE healthcare, Germany). The membranes were soaked in TBST (20 mM Tris, pH 7.5; 500 mM NaCl; 0.1% Tween 20) containing 5% bovine serum albumin (Solarbio, Beijing, China) for 2 h. The membranes were incubated with rabbit anti-phospho-NF-κB p65 (Ser536) monoclonal antibody (Cell Signaling Technology, Beverly, MA, USA), anti-NF-κB p65 monoclonal antibody (ABclonal, Wuhan, China), or anti-β-actin monoclonal antibody (ABclonal, Wuhan, China) at 4 °C for overnight. After extensive washing with TBST, the membranes were incubated with HRP-conjugated anti-rabbit antibody (Abcam, Cambridge, UK) for 1h at room temperature. The membranes were washed with TBST for three times and incubated with enhanced chemiluminescence (ECL) solution (Beyotime, Beijing, China). The membranes were visualized using a GelDoc XR System (Bio-Rad, Hercules, CA, USA).
4.11. Statistical Analysis
All experiments were performed three times. Statistical analyses were performed using the SPSS 17.0 software (SPSS Inc., Chicago, IL, USA). Data were analyzed with Student’s t-test, and statistical significance was defined as p < 0.05.
Supplementary Materials
Supplementary materials can be found at https://www.mdpi.com/1422-0067/20/22/5724/s1.
Author Contributions
Conceptualization, L.S.; Data curation, H.L.; Formal analysis, H.L., B.S., X.N. and S.J.; Funding acquisition, L.S.; Investigation, H.L.; Methodology, B.S. and S.J.; Supervision, L.S.; Writing—original draft, H.L.; Writing—review & editing, L.S.
Funding
This work was supported by the grants of the National Key R&D Program of China (2018YFD0900500), the Shandong Major Science and Technology Innovation Project (2018SDKJ0302-2), the AoShan Talents Program supported by Qingdao National Laboratory for Marine Science and Technology (No. 2015ASTP), and the Taishan Scholar Program of Shandong Province.
Conflicts of Interest
The authors declare no conflict of interest.
References
- Leung, K.Y.; Siame, B.A.; Tenkink, B.J.; Noort, R.J.; Mok, Y.K. Edwardsiella tarda—Virulence mechanisms of an emerging gastroenteritis pathogen. Microbes Infect. 2012, 14, 26–34. [Google Scholar] [CrossRef]
- Park, S.B.; Aoki, T.; Jung, T.S. Pathogenesis of and strategies for preventing Edwardsiella tarda infection in fish. Vet. Res. 2012, 43, 67. [Google Scholar] [CrossRef] [PubMed]
- Golub, V.; Kim, A.C.; Krol, V. Surgical wound infection, tuboovarian abscess, and sepsis caused by Edwardsiella tarda: Case reports and literature review. Infection 2010, 38, 487–489. [Google Scholar] [CrossRef] [PubMed]
- Hirai, Y.; Asahata-Tago, S.; Ainoda, Y.; Fujita, T.; Kikuchi, K. Edwardsiella tarda bacteremia. A rare but fatal water- and foodborne infection: Review of the literature and clinical cases from a single centre. Can. J. Infect. Dis. Med. Microbiol. 2015, 26, 313–318. [Google Scholar] [CrossRef] [PubMed]
- Leung, K.Y.; Wang, Q.; Yang, Z.; Siame, B.A. Edwardsiella piscicida: A versatile emerging pathogen of fish. Virulence 2019, 10, 555–567. [Google Scholar] [CrossRef] [PubMed]
- Kumar, G.; Rathore, G.; El-Matbouli, M. Outer membrane protein assembly factor YaeT (omp85) and GroEL proteins of Edwardsiella tarda are immunogenic antigens for Labeo rohita (Hamilton). J. Fish. Dis. 2014, 37, 1055–1059. [Google Scholar] [CrossRef]
- Das, B.K.; Chakraborty, H.J.; Rout, A.K.; Behera, B.K. De novo whole transcriptome profiling of Edwardsiella tarda isolated from infected fish (Labeo catla). Gene 2019, 701, 152–160. [Google Scholar] [CrossRef]
- Li, M.F.; Sun, L.; Li, J. Edwardsiella tarda evades serum killing by preventing complement activation via the alternative pathway. Fish. Shellfish. Immunol 2015, 43, 325–329. [Google Scholar] [CrossRef]
- Ishibe, K.; Osatomi, K.; Hara, K.; Kanai, K.; Yamaguchi, K.; Oda, T. Comparison of the responses of peritoneal macrophages from Japanese flounder (Paralichthys olivaceus) against high virulent and low virulent strains of Edwardsiella tarda. Fish. Shellfish. Immunol. 2008, 24, 243–251. [Google Scholar] [CrossRef]
- Srinivasa Rao, P.S.; Lim, T.M.; Leung, K.Y. Opsonized virulent Edwardsiella tarda strains are able to adhere to and survive and replicate within fish phagocytes but fail to stimulate reactive oxygen intermediates. Infect. Immun. 2001, 69, 5689–5697. [Google Scholar]
- Qin, L.; Sun, Y.; Zhao, Y.; Xu, J.; Bi, K. In vitro model to estimate Edwardsiella tarda-macrophage interactions using RAW264.7 cells. Fish. Shellfish. Immunol. 2017, 60, 177–184. [Google Scholar] [CrossRef] [PubMed]
- Zhang, L.; Ni, C.; Xu, W.; Dai, T.; Yang, D.; Wang, Q.; Zhang, Y.; Liu, Q. Intramacrophage infection reinforces the virulence of Edwardsiella tarda. J. Bacteriol. 2016, 198, 1534–1542. [Google Scholar] [CrossRef] [PubMed]
- Furci, L.; Schena, E.; Miotto, P.; Cirillo, D.M. Alteration of human macrophages microRNA expression profile upon infection with Mycobacterium tuberculosis. Int. J. Mycobacteriol. 2013, 2, 128–134. [Google Scholar] [CrossRef] [PubMed]
- Schnappinger, D.; Ehrt, S.; Voskuil, M.I.; Liu, Y.; Mangan, J.A.; Monahan, I.M.; Dolganov, G.; Efron, B.; Butcher, P.D.; Nathan, C.; et al. Transcriptional adaptation of Mycobacterium tuberculosis within macrophages: Insights into the phagosomal environment. J. Exp. Med. 2003, 198, 693–704. [Google Scholar] [CrossRef] [PubMed]
- Barbel, R.; Kaufmann, S.H.E. Immune responses to intracellular bacteria. Curr. Opin. Immunol. 2001, 13, 417–428. [Google Scholar]
- Flannagan, R.S.; Cosio, G.; Grinstein, S. Antimicrobial mechanisms of phagocytes and bacterial evasion strategies. Nat. Rev. Microbiol. 2009, 7, 355–366. [Google Scholar] [CrossRef]
- Shah, S.; Bohsali, A.; Ahlbrand, S.E.; Srinivasan, L.; Rathinam, V.A.; Vogel, S.N.; Fitzgerald, K.A.; Sutterwala, F.S.; Briken, V. Cutting edge: Mycobacterium tuberculosis but not nonvirulent mycobacteria inhibits IFN-beta and AIM2 inflammasome-dependent IL-1beta production via its ESX-1 secretion system. J. Immunol. 2013, 191, 3514–3518. [Google Scholar] [CrossRef]
- Myers, J.T.; Tsang, A.W.; Swanson, J.A. Localized reactive oxygen and nitrogen intermediates inhibit escape of Listeria monocytogenes from vacuoles in activated macrophages. J. Immunol. 2003, 171, 5447–5453. [Google Scholar] [CrossRef]
- Zhou, Z.J.; Sun, L. Edwardsiella tarda-induced inhibition of apoptosis: A strategy for intracellular survival. Front. Cell. Infect. Microbiol. 2016, 6, 76. [Google Scholar] [CrossRef]
- Sui, Z.H.; Xu, H.; Wang, H.; Jiang, S.; Chi, H.; Sun, L. Intracellular Trafficking Pathways of Edwardsiella tarda: From Clathrin- and Caveolin-Mediated Endocytosis to Endosome and Lysosome. Front. Cell. Infect. Microbiol. 2017, 7, 400. [Google Scholar] [CrossRef]
- Chen, H.; Yang, D.; Han, F.; Tan, J.; Zhang, L.; Xiao, J.; Zhang, Y.; Liu, Q. The Bacterial T6SS Effector EvpP Prevents NLRP3 Inflammasome Activation by Inhibiting the Ca(2+)-Dependent MAPK-Jnk Pathway. Cell Host Microbe 2017, 21, 47–58. [Google Scholar] [CrossRef] [PubMed]
- Finlay, B.B.; Falkow, S. Common themes in microbial pathogenicity revisited. Microbiol. Mol. Biol. R. 1997, 61, 136–169. [Google Scholar]
- Loo, Y.M.; Gale, M., Jr. Immune signaling by RIG-I-like receptors. Immunity 2011, 34, 680–692. [Google Scholar] [CrossRef] [PubMed]
- Dixit, E.; Kagan, J.C. Intracellular pathogen detection by RIG-I-like receptors. Adv. Immunol. 2013, 117, 99–125. [Google Scholar] [PubMed]
- Sheikh, F.; Dickensheets, H.; Gamero, A.M.; Vogel, S.N.; Donnelly, R.P. An essential role for IFN-beta in the induction of IFN-stimulated gene expression by LPS in macrophages. J. Leukocyte. Biol. 2014, 96, 591–600. [Google Scholar] [CrossRef]
- Asadpour-Behzadi, A.; Kariminik, A. RIG-1 and MDA5 are the important intracellular sensors against bacteria in septicemia suffering patients. J. Appl. Biomed. 2018, 16, 358–361. [Google Scholar] [CrossRef]
- Monroe, K.M.; McWhirter, S.M.; Vance, R.E. Identification of host cytosolic sensors and bacterial factors regulating the type I interferon response to Legionella pneumophila. Plos Pathog 2009, 5, 11. [Google Scholar] [CrossRef]
- Satoh, T.; Kato, H.; Kumagai, Y.; Yoneyama, M.; Sato, S.; Matsushita, K.; Tsujimura, T.; Fujita, T.; Akira, S.; Takeuchi, O. LGP2 is a positive regulator of RIG-I- and MDA5-mediated antiviral responses. Proc. Natl. Acad. Sci. USA 2010, 107, 1512–1517. [Google Scholar] [CrossRef]
- Borish, L.C.; Steinke, J.W. 2. Cytokines and chemokines. J. Allergy. Clin. Immunol. 2003, 111, S460–S475. [Google Scholar] [CrossRef]
- Medzhitov, R. Origin and physiological roles of inflammation. Nature 2008, 454, 428–435. [Google Scholar] [CrossRef]
- Moreilhon, C.; Gras, D.; Hologne, C.; Bajolet, O.; Cottrez, F.; Magnone, V.; Merten, M.; Groux, H.; Puchelle, E.; Barbry, P. Live Staphylococcus aureus and bacterial soluble factors induce different transcriptional responses in human airway cells. Physiol. Genom. 2005, 20, 244–255. [Google Scholar] [CrossRef] [PubMed][Green Version]
- Giacomini, E.; Iona, E.; Ferroni, L.; Miettinen, M.; Fattorini, L.; Orefici, G.; Julkunen, I.; Coccia, E.M. Infection of human macrophages and dendritic cells with Mycobacterium tuberculosis induces a differential cytokine gene expression that modulates T cell response. J. Immunol. 2001, 166, 7033–7704. [Google Scholar] [CrossRef] [PubMed]
- Abdallah, A.M.; Savage, N.D.; van Zon, M.; Wilson, L.; Vandenbroucke-Grauls, C.M.; van der Wel, N.N.; Ottenhoff, T.H.; Bitter, W. The ESX-5 secretion system of Mycobacterium marinum modulates the macrophage response. J. Immunol. 2008, 181, 7166–7175. [Google Scholar] [CrossRef] [PubMed]
- Tecchio, C.; Cassatella, M.A. Neutrophil-derived chemokines on the road to immunity. Semin. Immunol. 2016, 28, 119–128. [Google Scholar] [CrossRef]
- Arango Duque, G.; Descoteaux, A. Macrophage cytokines: Involvement in immunity and infectious diseases. Front. Immunol. 2014, 5, 491. [Google Scholar] [CrossRef]
- Audrey, L.K.; Mario, O.; Delia, G.; Alessnadra, O.; Drew, W.; Kira, G.; Elena, H.; Robert, G.; Linda, E.; Anthony, S.F. HIV replication in CD4+ T cells of HIV-infected individuals is regulated by a balance between the viral suppressive effects of endogenous β-chemokines and the viral inductive effects of other endogenous cytokines. P. Natl. Acad. Sci. USA 1996, 93, 14076–14081. [Google Scholar]
- Roach, D.R.; Bean, A.G.; Demangel, C.; France, M.P.; Briscoe, H.; Britton, W.J. TNF regulates chemokine induction essential for cell recruitment, granuloma formation, and clearance of mycobacterial infection. J. Immunol. 2002, 168, 4620–4627. [Google Scholar] [CrossRef]
- Vallerskog, T.; Martens, G.W.; Kornfeld, H. Diabetic mice display a delayed adaptive immune response to Mycobacterium tuberculosis. J. Immunol. 2010, 184, 6275–6282. [Google Scholar] [CrossRef]
- Auerbuch, V.; Brockstedt, D.G.; Meyer-Morse, N.; O’Riordan, M.; Portnoy, D.A. Mice lacking the type I interferon receptor are resistant to Listeria monocytogenes. J. Exp. Med. 2004, 200, 527–533. [Google Scholar] [CrossRef]
- Devitt, A.; Lund, P.A.; Morris, A.G.; Pearce, J.H. Induction of alpha/beta interferon and dependent nitric oxide synthesis during Chlamydia trachomatis infection of McCoy cells in the absence of exogenous cytokine. Infect. Immun. 1996, 64, 3951–3956. [Google Scholar]
- Henry, T.; Brotcke, A.; Weiss, D.S.; Thompson, L.J.; Monack, D.M. Type I interferon signaling is required for activation of the inflammasome during Francisella infection. J. Exp. Med. 2007, 204, 987–994. [Google Scholar] [CrossRef] [PubMed]
- Stetson, D.B.; Medzhitov, R. Recognition of cytosolic DNA activates an IRF3-dependent innate immune response. Immunity 2006, 24, 93–103. [Google Scholar] [CrossRef] [PubMed]
- Meunier, E.; Wallet, P.; Dreier, R.F.; Costanzo, S.; Anton, L.; Ruhl, S.; Dussurgey, S.; Dick, M.S.; Kistner, A.; Rigard, M.; et al. Guanylate-binding proteins promote activation of the AIM2 inflammasome during infection with Francisella novicida. Nat. Immunol. 2015, 16, 476–484. [Google Scholar] [CrossRef] [PubMed]
- Shenoy, A.R.; Wellington, D.A.; Kumar, P.; Kassa, H.; Booth, C.J.; Cresswell, P.; MacMicking, J.D. GBP5 promotes NLRP3 inflammasome assembly and immunity in mammals. Science 2012, 336, 481–485. [Google Scholar] [CrossRef]
- Fisch, D.; Bando, H.; Clough, B.; Hornung, V.; Yamamoto, M.; Shenoy, A.R.; Frickel, E.M. Human GBP 1 is a microbe-specific gatekeeper of macrophage apoptosis and pyroptosis. Embo. J. 2019, 38, 1–19. [Google Scholar] [CrossRef]
- Fensterl, V.; Sen, G.C. Interferon-induced Ifit proteins: Their role in viral pathogenesis. J. Virol. 2015, 89, 2462–2468. [Google Scholar] [CrossRef]
- MacMicking, J.D. Immune control of phagosomal bacteria by p47 GTPases. Curr. Opin. Microbiol. 2005, 8, 74–82. [Google Scholar] [CrossRef]
- Taylor, G.A. IRG proteins: Key mediators of interferon-regulated host resistance to intracellular pathogens. Cell Microbiol. 2007, 9, 1099–1107. [Google Scholar] [CrossRef]
- Dao, C.T.; Zhang, D.E. ISG15: A ubiquitin-like enigma. Front. Biosci. 2005, 10, 2701–2722. [Google Scholar] [CrossRef]
- Pitha-Rowe, I.F.; Pitha, P.M. Viral defense, carcinogenesis and ISG15: Novel roles for an old ISG. Cytokine. Growth F. R. 2007, 18, 409–417. [Google Scholar] [CrossRef]
- Liu, C.S.; Sun, Y.; Zhang, M.; Sun, L. Identification and analysis of a Sciaenops ocellatus ISG15 homologue that is involved in host immune defense against bacterial infection. Fish. Shellfish. Immunol. 2010, 29, 167–174. [Google Scholar] [CrossRef] [PubMed]
- Chakravortty, D.; Hensel, M. Inducible nitric oxide synthase and control of intracellular bacterial pathogens. Microbes Infect. 2003, 5, 621–627. [Google Scholar] [CrossRef]
- Eriksson, S.; Bjorkman, J.; Borg, S.; Syk, A.; Pettersson, S.; Andresson, D.I.; Rhen, M. Salmonella typhimurium mutants that downregulate phagocyte nitric oxide production. Cell Microbiol. 2010, 2, 239–250. [Google Scholar] [CrossRef] [PubMed]
- O’Brien, L.; Carmichael, J.; Lowrie, D.B.; Andrew, P.W. Strains of Mycobacterium tuberculosis differ in susceptibility to reactive nitrogen intermediates in vitro. Infect. Immun. 1994, 62, 5187–5190. [Google Scholar]
- Ishibe, K.; Yamanishi, T.; Wang, Y.; Osatomi, K.; Hara, K.; Kanai, K.; Yamaguchi, K.; Oda, T. Comparative analysis of the production of nitric oxide (NO) and tumor necrosis factor-alpha (TNF-alpha) from macrophages exposed to high virulent and low virulent strains of Edwardsiella tarda. Fish. Shellfish. Immunol. 2009, 27, 386–389. [Google Scholar] [CrossRef]
- Grayfer, L.; Hodgkinson, J.W.; Belosevic, M. Antimicrobial responses of teleost phagocytes and innate immune evasion strategies of intracellular bacteria. Dev. Comp. Immunol. 2014, 43, 223–242. [Google Scholar] [CrossRef]
- Fast, M.D.; Tse, B.; Boyd, J.M.; Johnson, S.C. Mutations in the Aeromonas salmonicida subsp. salmonicida type III secretion system affect Atlantic salmon leucocyte activation and downstream immune responses. Fish. Shellfish. Immunol. 2009, 27, 721–728. [Google Scholar]
- Teder, P.; Noble, P.W. Endothelin-1 in pulmonary inflammation and fibrosis. Am. J. Resp. Cell Mol. 2000, 23, 7–10. [Google Scholar] [CrossRef]
- Denisenko, E.; Guler, R.; Mhlanga, M.; Suzuki, H.; Brombacher, F.; Schmeier, S. Transcriptionally induced enhancers in the macrophage immune response to Mycobacterium tuberculosis infection. BMC Genom. 2019, 20, 71. [Google Scholar] [CrossRef]
- Allen, L.H.; Aderem, A. A role for MARCKS, the alpha isozyme of protein kinase C and myosin I in zymosan phagocytosis by macrophages. J. Exp. Med. 1995, 182, 829–840. [Google Scholar] [CrossRef]
- Aderem, A. Phagocytosis and the inflammatory response. J. Infect. Dis. 2003, 187, 340–345. [Google Scholar] [CrossRef] [PubMed]
- Samanta, M.; Iwakiri, D.; Kanda, T.; Imaizumi, T.; Takada, K. EB virus-encoded RNAs are recognized by RIG-I and activate signaling to induce type I IFN. EMBO J. 2006, 25, 4207–4214. [Google Scholar] [CrossRef] [PubMed]
- Kim, Y.S.; Kim, J.H.; Woo, M.; Kim, T.S.; Sohn, K.M.; Lee, Y.H.; Jo, E.K.; Yuk, J.M. Innate signaling mechanisms controlling Mycobacterium chelonae-mediated CCL2 and CCL5 expression in macrophages. J. Microbiol. 2015, 53, 864–874. [Google Scholar] [CrossRef] [PubMed]
- Cao, L.; Li, R.; Chen, X.; Xue, Y.; Liu, D. Neougonin A Inhibits Lipopolysaccharide-Induced Inflammatory Responses via Downregulation of the NF-κB Signaling Pathway in RAW 264.7 Macrophages. Inflammation 2016, 39, 1939–1948. [Google Scholar] [CrossRef] [PubMed]
- Zhang, M.; Sun, K.; Sun, L. Regulation of autoinducer 2 production and luxS expression in a pathogenic Edwardsiella tarda strain. Microbiology 2008, 154, 2060–2069. [Google Scholar] [CrossRef]
- Langmead, B.; Salzberg, S.L. Fast gapped-read alignment with Bowtie 2. Nat. Methods 2012, 9, 357–359. [Google Scholar] [CrossRef]
- Kim, D.; Pertea, G.; Trapnell, C.; Pimentel, H.; Kelley, R.; Salzberg, S.L. TopHat2: Accurate alignment of transcriptomes in the presence of insertions, deletions and gene fusions. Genome Biol. 2013, 14, R36. [Google Scholar] [CrossRef]
- Trapnell, C.; Roberts, A.; Goff, L.; Pertea, G.; Kim, D.; Kelley, D.R.; Pimentel, H.; Salzberg, S.L.; Rinn, J.L.; Pachter, L. Differential gene and transcript expression analysis of RNA-seq experiments with TopHat and Cufflinks. Nat. Protoc. 2012, 7, 562–578. [Google Scholar] [CrossRef]
- Bo, L.; Colin, N.D. RSEM: Accurate transcript quantification from RNA-Seq data with or without a reference genome. BMC Bioinform. 2011, 12, 323. [Google Scholar] [CrossRef]
- Kanehisa, M.; Araki, M.; Goto, S.; Hattori, M.; Hirakawa, M.; Itoh, M.; Katayama, T.; Kawashima, S.; Okuda, S.; Tokimatsu, T.; et al. KEGG for linking genomes to life and the environment. Nucleic. Acids. Res. 2008, 36, 480–484. [Google Scholar] [CrossRef]
- Li, Z.; Liu, X.; Liu, J.; Zhang, K.; Yu, H.; He, Y.; Wang, X.; Qi, J.; Wang, Z.; Zhang, Q. Transcriptome profiling based on protein-protein interaction networks provides a core set of genes for understanding blood immune response mechanisms against Edwardsiella tarda infection in Japanese flounder (Paralichthys olivaceus). Dev. Comp. Immunol. 2018, 78, 100–113. [Google Scholar] [CrossRef] [PubMed]
© 2019 by the authors. Licensee MDPI, Basel, Switzerland. This article is an open access article distributed under the terms and conditions of the Creative Commons Attribution (CC BY) license (http://creativecommons.org/licenses/by/4.0/).