Novel Descriptors and Digital Signal Processing- Based Method for Protein Sequence Activity Relationship Study
Abstract
1. Introduction
2. Results
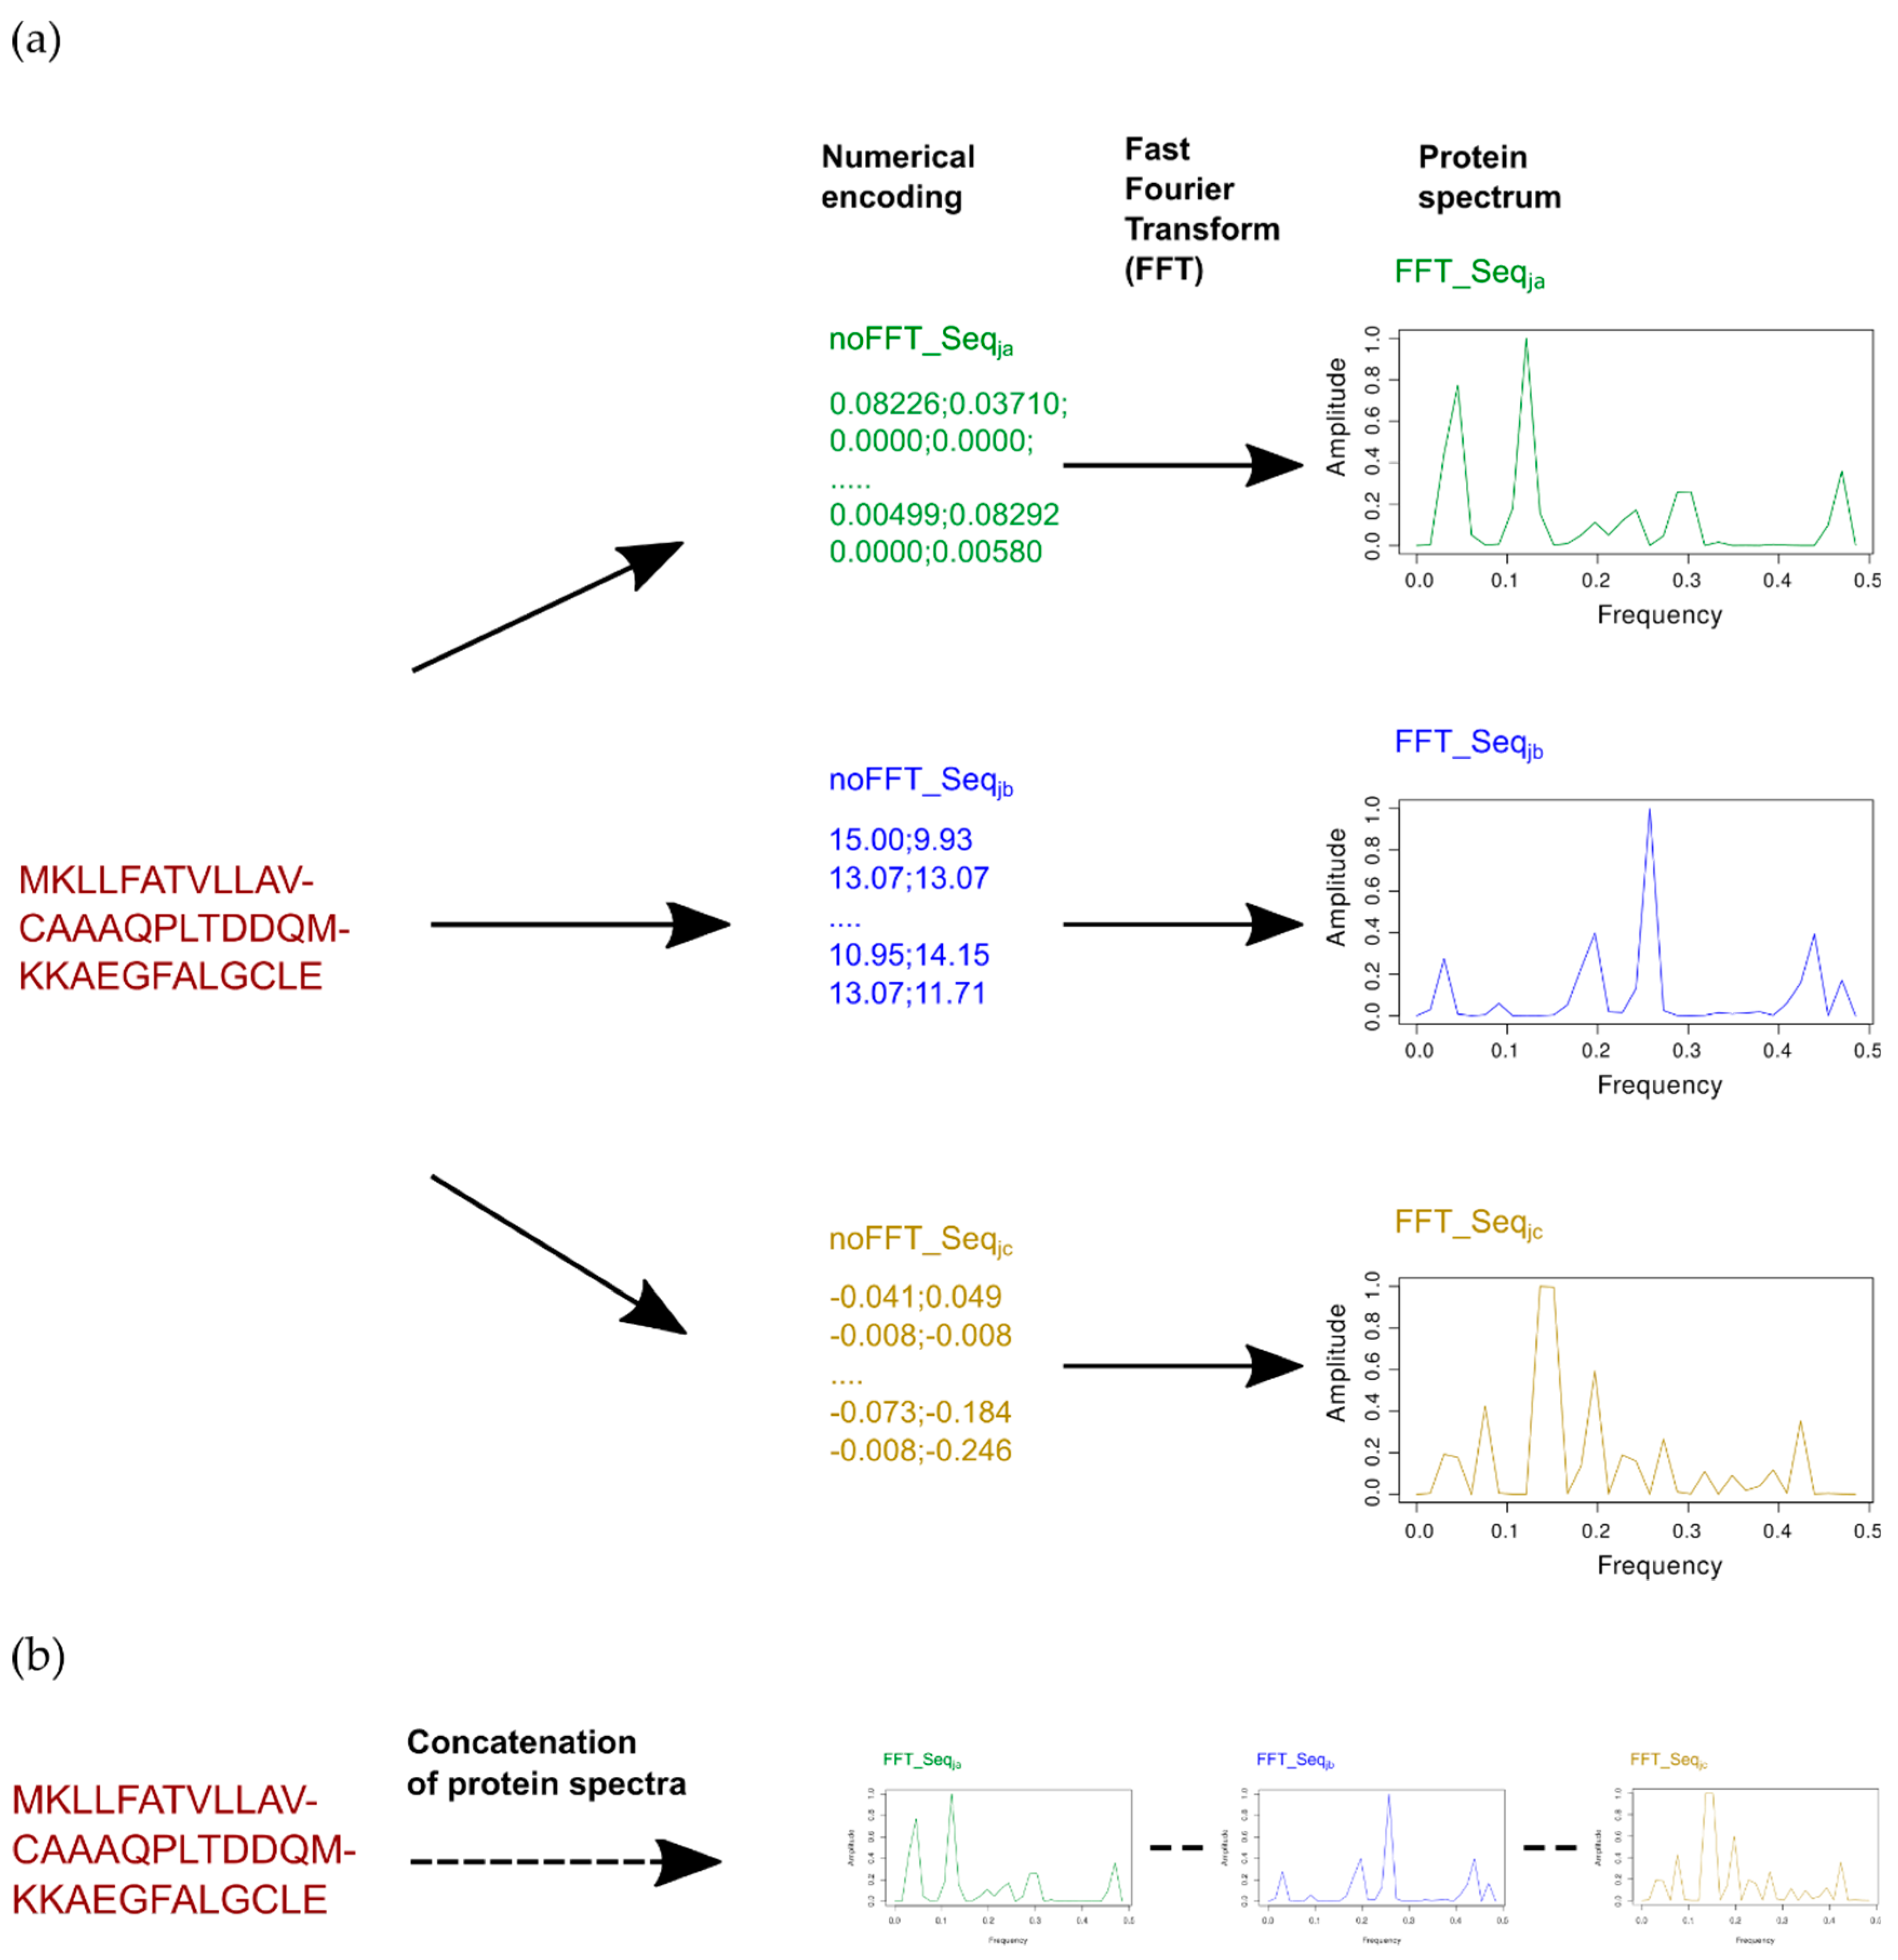
2.1. Concatenation to Obtain Extended Numerical Sequences
2.2. Combining One or Multiple Indices
2.2.1. Concatenation of the Best Single Indices with or/and without FFT
2.2.2. Combinatorial of a Protein Sequence Encoded by Multiple Indices with FFT
Combinatorial Sequences Approach by Using a Selection of Best Single Indices
Successive Concatenation of a Protein Sequence Encoded by Multiple Indices
2.3. Selection of Indices from Different Families for Concatenation or Combination
- Alpha and turn propensities,
- beta propensity,
- composition,
- hydrophobicity,
- physicochemical properties,
- other properties.
2.4. Selection of Variables Inside the Ext_SEQ
- (i)
- (ii)
3. Discussion
3.1. Cumulating Indices Could Provide Better Prediction Performances
3.2. PLSR Modeling Using FFT and Extended Sequence Leads to Better Results
3.3. Considerations on the Nature of the Descriptors and Versatility of the Approach
3.4. Calculation Time
4. Materials and Methods
4.1. Datasets
4.1.1. Epoxide Hydrolase
4.1.2. Cytochrome P450
4.1.3. GLP-2
4.1.4. TNF Alpha
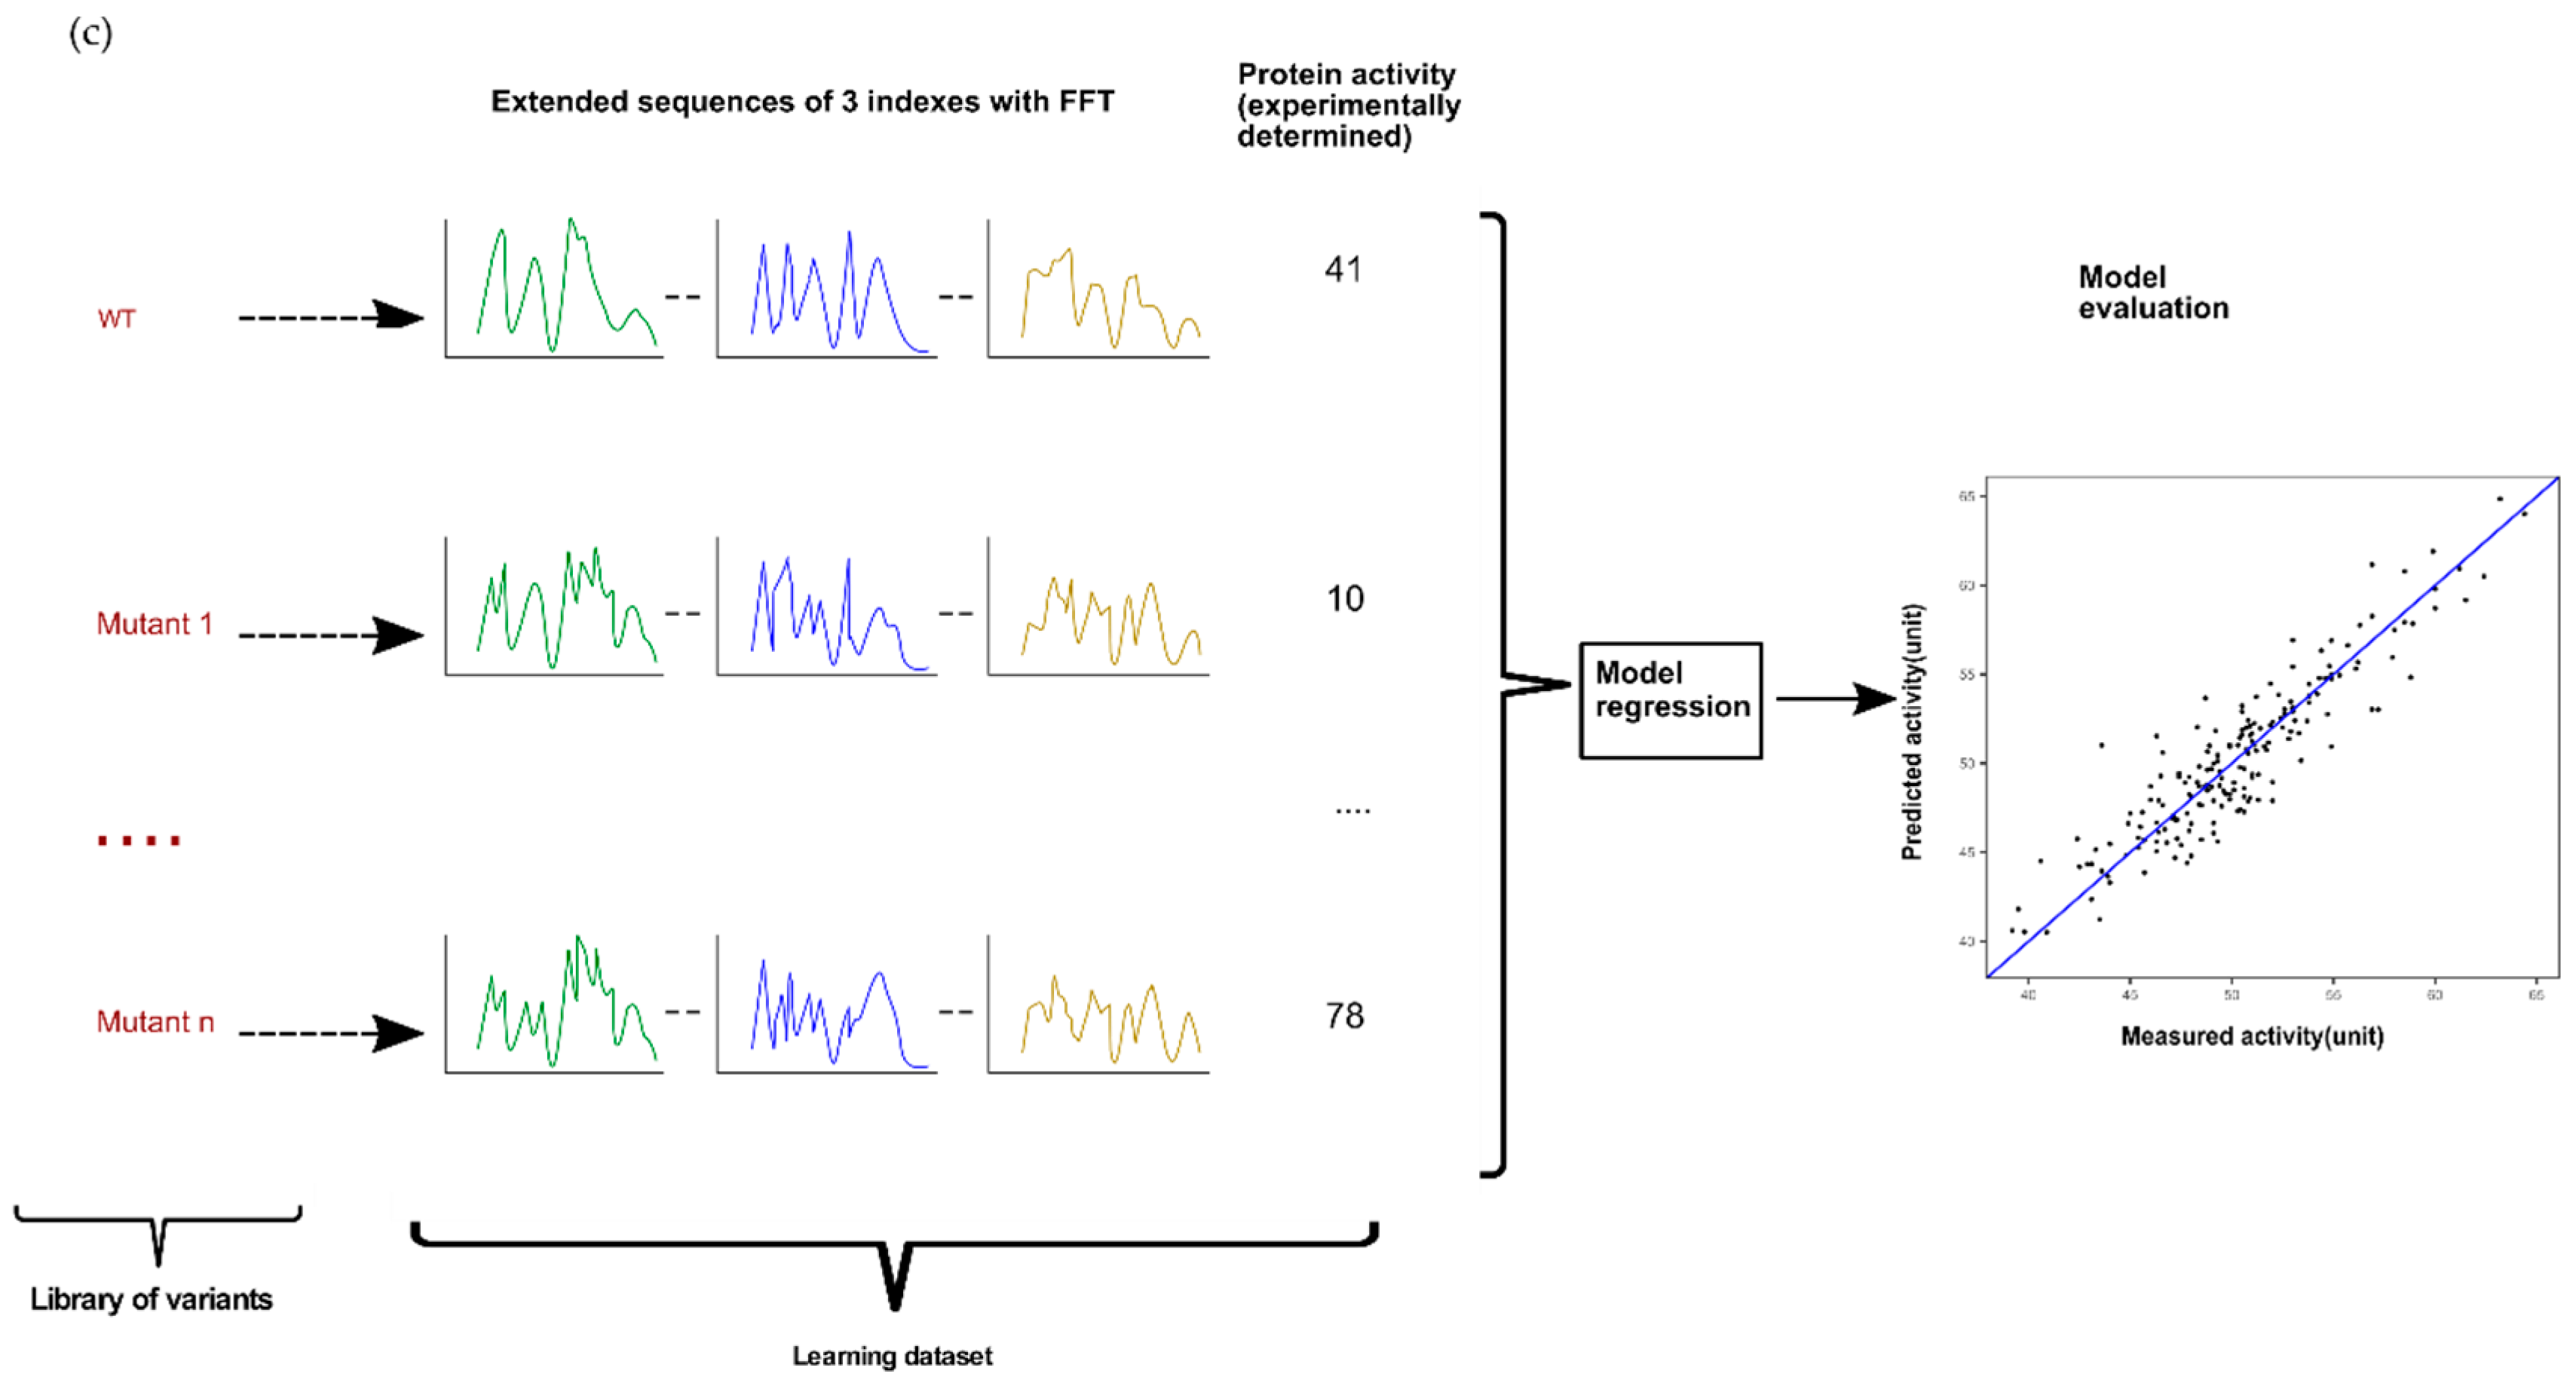
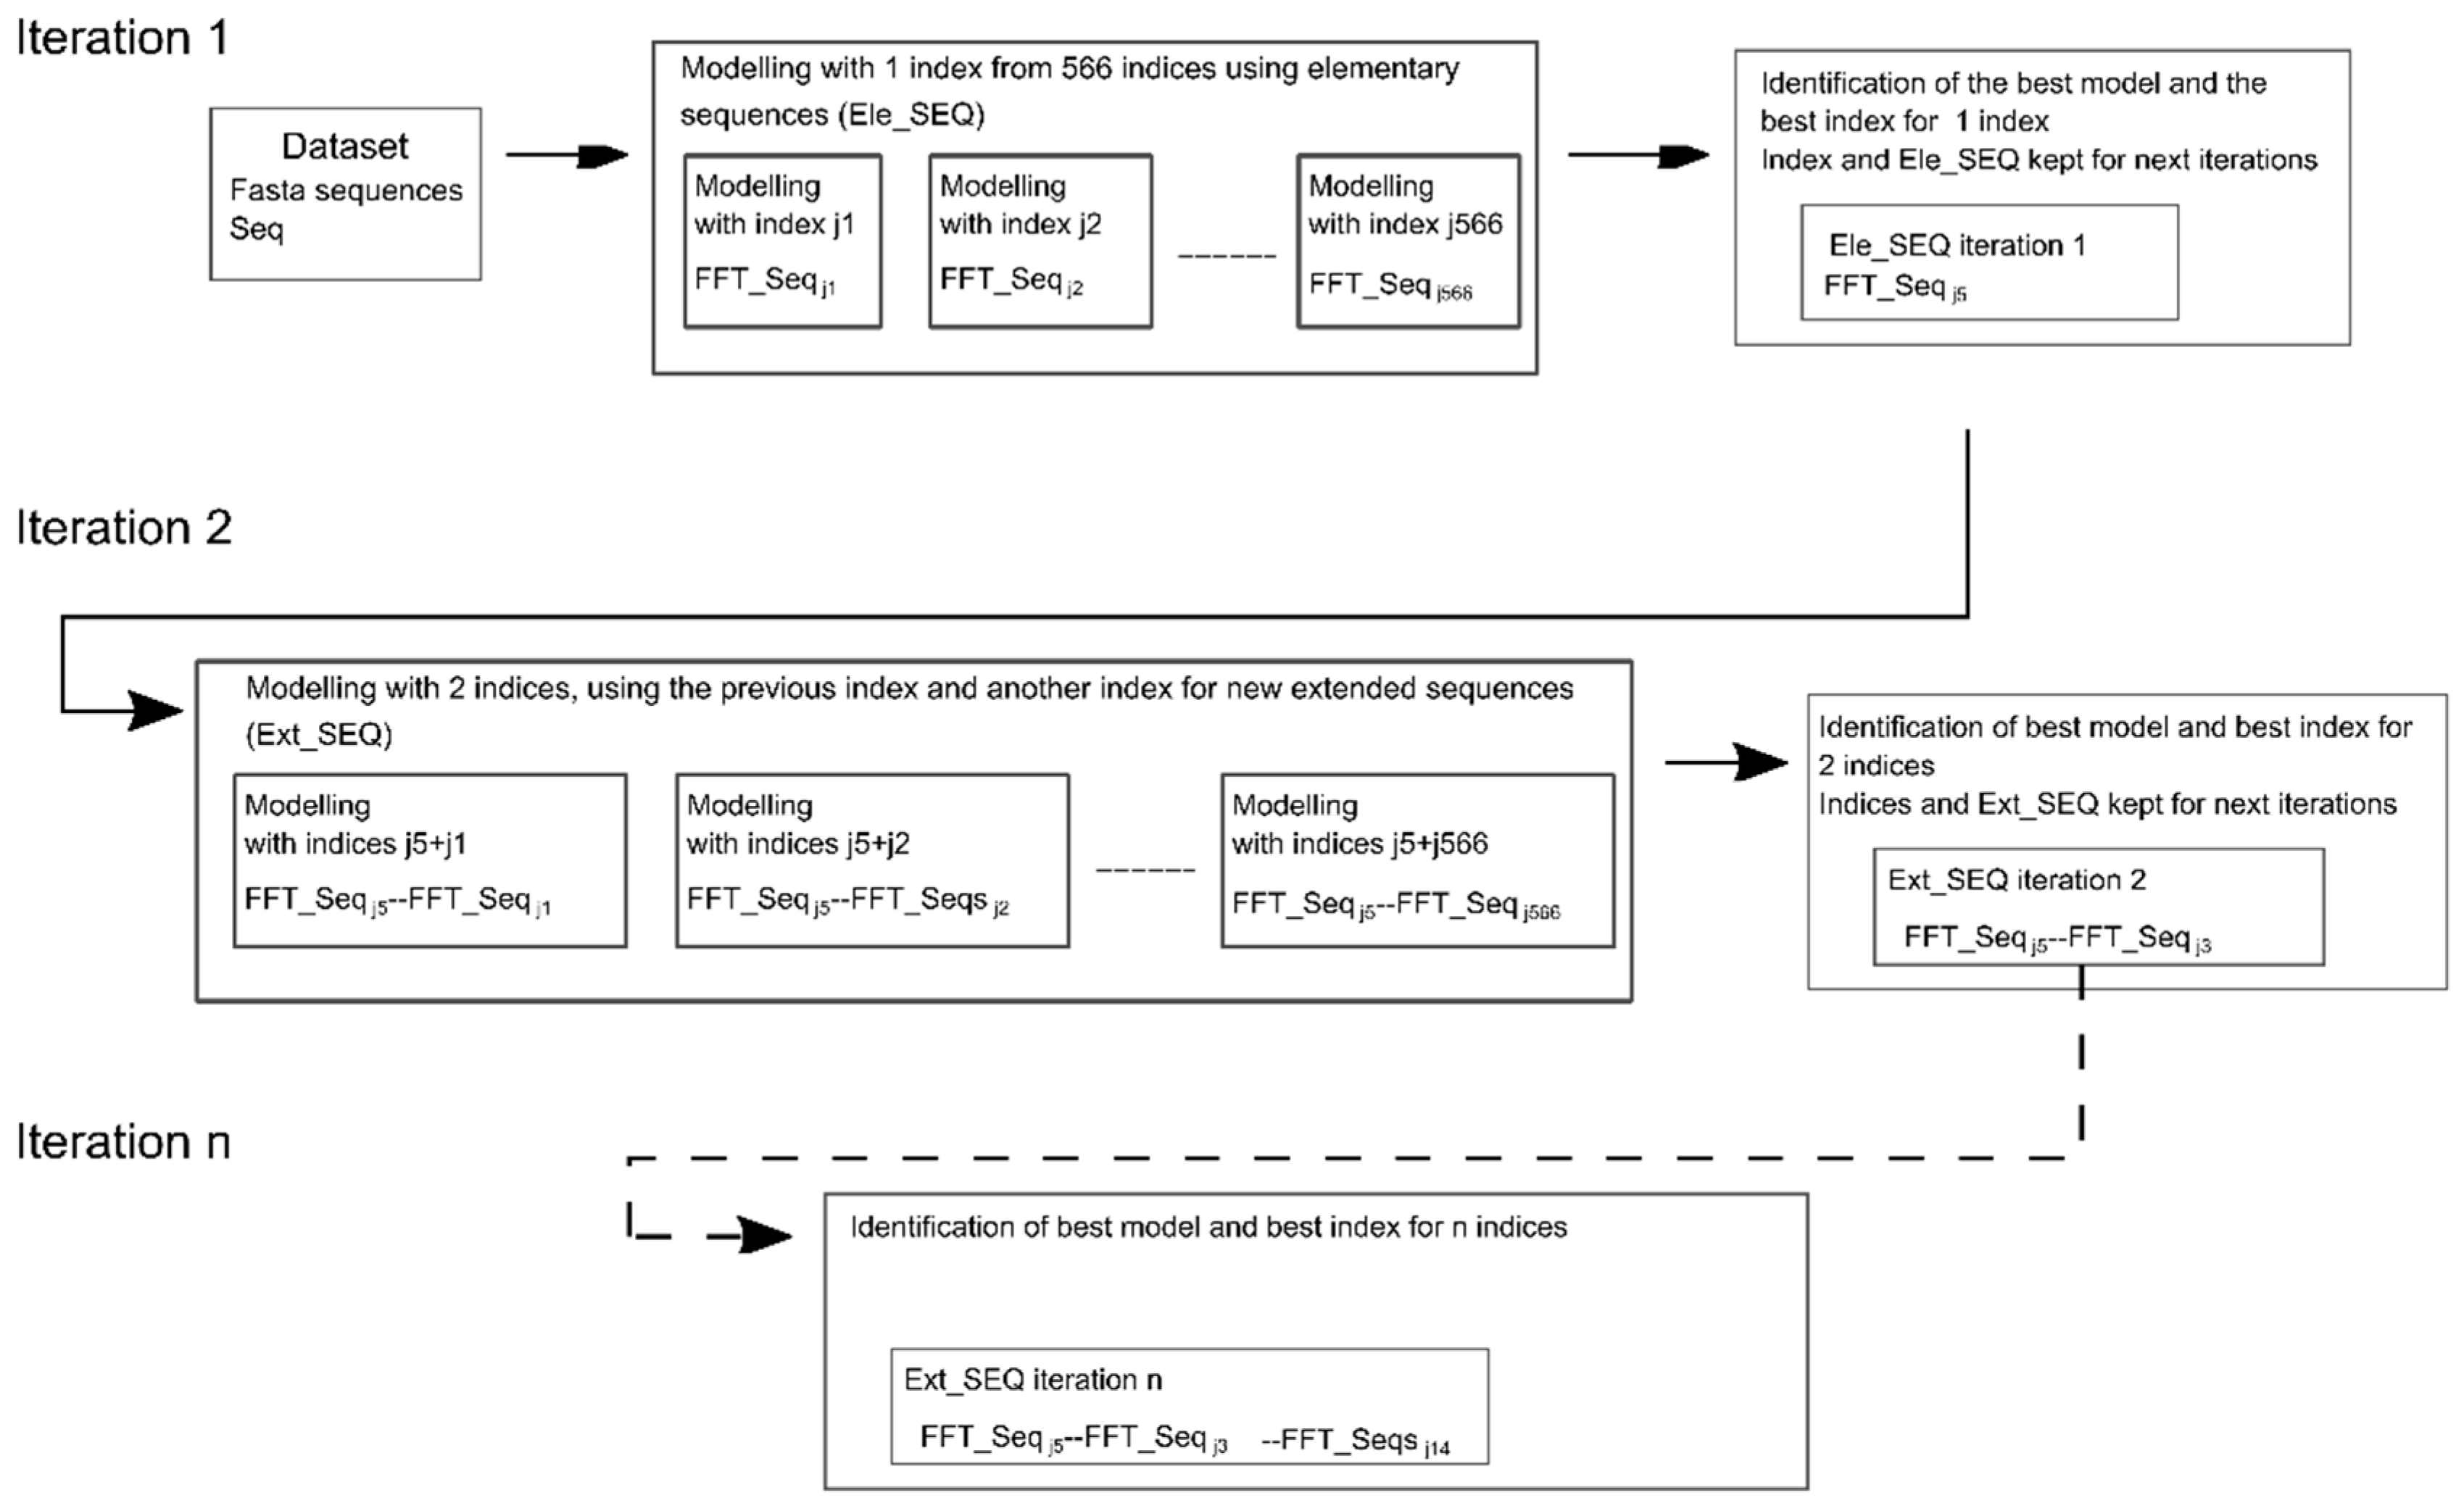
4.2. Modeling Approach Based on Single or Multiple Encoding with or without Fast Fourier Transform (FFT)
4.3. Evaluation of Modeling Performances
4.4. Measure of the Significance of the Improvement between Two Models
5. Conclusions
Author Contributions
Funding
Conflicts of Interest
References
- Damborsky, J.; Brezovsky, J. Computational tools for designing and engineering enzymes. Curr. Opin. Chem. Biol. 2014, 19, 8–16. [Google Scholar] [CrossRef] [PubMed]
- Sumbalova, L.; Stourac, J.; Martinek, T.; Bednar, D.; Damborsky, J. HotSpot Wizard 3.0: Web server for automated design of mutations and smart libraries based on sequence input information. Nucleic Acids Res. 2018, 46, W356–W362. [Google Scholar] [CrossRef] [PubMed]
- Romero-Rivera, A.; Garcia-Borràs, M.; Osuna, S. Computational tools for the evaluation of laboratory-engineered biocatalysts. Chem. Commun. 2017, 53, 284–297. [Google Scholar] [CrossRef] [PubMed]
- Yang, K.K.; Wu, Z.; Bedbrook, C.N.; Arnold, F.H. Learned protein embeddings for machine learning. Bioinformatics 2018, 34, 2642–2648. [Google Scholar] [CrossRef] [PubMed]
- Wu, Z.; Kan, S.B.J.; Lewis, R.D.; Wittmann, B.J.; Arnold, F.H. Machine learning-assisted directed protein evolution with combinatorial libraries. Proc. Natl. Acad. Sci. USA 2019, 116, 8852–8858. [Google Scholar] [CrossRef] [PubMed]
- Li, Y.; Drummond, D.A.; Sawayama, A.M.; Snow, C.D.; Bloom, J.D.; Arnold, F.H. A diverse family of thermostable cytochrome P450s created by recombination of stabilizing fragments. Nat. Biotechnol. 2007, 25, 1051–1056. [Google Scholar] [CrossRef] [PubMed]
- Hellberg, S.; Sjöström, M.; Wold, S. The Prediction of Bradykinin Potentiating Potency of Pentapeptides. An Example of a Peptide Quantitative Structure-activity Relationship. Acta Chem. Scand. 1986, 40, 135–140. [Google Scholar] [CrossRef] [PubMed]
- Norinder, U.; Rivera, C.; Undén, A. A quantitative structure-activity relationship study of some substance P-related peptides a multivariate approach using PLS and variable selection. J. Pept. Res. 2009, 49, 155–162. [Google Scholar] [CrossRef] [PubMed]
- Wold, S.; Trygg, J.; Berglund, A.; Antti, H. Some recent developments in PLS modeling. Chemom. Intell. Lab. Syst. 2001, 58, 131–150. [Google Scholar] [CrossRef]
- Lapinsh, M.; Prusis, P.; Gutcaits, A.; Lundstedt, T.; Wikberg, J.E.S. Development of proteo-chemometrics: A novel technology for the analysis of drug-receptor interactions. Biochim. Acta BBA Gen. Subj. 2001, 1525, 180–190. [Google Scholar] [CrossRef]
- Fox, R. Directed molecular evolution by machine learning and the influence of nonlinear interactions. J. Theor. Biol. 2005, 234, 187–199. [Google Scholar] [CrossRef] [PubMed]
- Li, G.; Dong, Y.; Reetz, M.T. Can Machine Learning Revolutionize Directed Evolution of Selective Enzymes? Adv. Synth. Catal. 2019. [Google Scholar] [CrossRef]
- Qu, G.; Li, A.; Sun, Z.; Acevedo-Rocha, C.G.; Reetz, M.T. The Crucial Role of Methodology Development in Directed Evolution of Selective Enzymes. Angew. Chem. Int. Ed. 2019. [Google Scholar] [CrossRef] [PubMed]
- Berland, M.; Offmann, B.; Andre, I.; Remaud-Simeon, M.; Charton, P. A web-based tool for rational screening of mutants libraries using ProSAR. Protein Eng. Des. Sel. 2014, 27, 375–381. [Google Scholar] [CrossRef] [PubMed]
- Smith, S.W. The Scientist and Engineer’s Guide to Digital Signal Processing; California Technical Publishing: San Diego, CA, USA, 1997. [Google Scholar]
- Cadet, X.F.; Dehak, R.; Chin, S.P.; Bessafi, M. Non-Linear Dynamics Analysis of Protein Sequences. Application to CYP450. Entropy 2019, 21, 852. [Google Scholar] [CrossRef]
- Cosic, I. Macromolecular bioactivity: Is it resonant interaction between macromolecules?-theory and applications. IEEE Trans. Biomed. Eng. 1994, 41, 1101–1114. [Google Scholar] [CrossRef] [PubMed]
- Walsh, I.; Sirocco, F.G.; Minervini, G.; Di Domenico, T.; Ferrari, C.; Tosatto, S.C.E. RAPHAEL: Recognition, periodicity and insertion assignment of solenoid protein structures. Bioinformatics 2012, 28, 3257–3264. [Google Scholar] [CrossRef] [PubMed][Green Version]
- Hrabe, T.; Godzik, A. ConSole: Using modularity of Contact maps to locate Solenoid domains in protein structures. BMC Bioinform. 2014, 15, 119. [Google Scholar] [CrossRef] [PubMed]
- Nwankwo, N. Digital Signal Processing Techniques:Calculating Biological Functionalities. J. Proteom. Bioinform. 2012, 4. [Google Scholar] [CrossRef]
- Jia, J.; Liu, Z.; Xiao, X.; Liu, B.; Chou, K.-C. iPPI-Esml: An ensemble classifier for identifying the interactions of proteins by incorporating their physicochemical properties and wavelet transforms into PseAAC. J. Biol. 2015, 377, 47–56. [Google Scholar] [CrossRef] [PubMed]
- Cadet, F.; Fontaine, N.; Vetrivel, I.; Chong, M.N.F.; Savriama, O.; Cadet, X.; Charton, P. Application of fourier transform and proteochemometrics principles to protein engineering. BMC Bioinform. 2018, 19, 382. [Google Scholar] [CrossRef] [PubMed]
- Cadet, F.; Fontaine, N.; Li, G.; Sanchis, J.; Chong, M.N.F.; Pandjaitan, R.; Vetrivel, I.; Offmann, B.; Reetz, M.T. A machine learning approach for reliable prediction of amino acid interactions and its application in the directed evolution of enantioselective enzymes. Sci. Rep. 2018, 8, 16757. [Google Scholar] [CrossRef] [PubMed]
- Ostafe, R.; Fontaine, N.; Frank, D.; Ng Fuk Chong, M.; Prodanovic, R.; Pandjaitan, R.; Offmann, B.; Cadet, F.; Fischer, R. One-shot optimization of multiple enzyme parameters: Tailoring glucose oxidase for pH and electron mediators. Biotechnol. Bioeng. 2019. [Google Scholar] [CrossRef] [PubMed]
- Prusis, P.; Lundstedt, T.; Wikberg, J.E.S. Proteo-chemometrics analysis of MSH peptide binding to melanocortin receptors. Protein Eng. Des. Sel. 2002, 15, 305–311. [Google Scholar] [CrossRef] [PubMed][Green Version]
- Barley, M.H.; Turner, N.J.; Goodacre, R. Improved Descriptors for the Quantitative Structure–Activity Relationship Modeling of Peptides and Proteins. J. Chem. Inf. Model. 2018, 58, 234–243. [Google Scholar] [CrossRef] [PubMed]
- Kawashima, S.; Pokarowski, P.; Pokarowska, M.; Kolinski, A.; Katayama, T.; Kanehisa, M. AAindex: Amino acid index database, progress report 2008. Nucleic Acids Res. 2007, 36, D202–D205. [Google Scholar] [CrossRef] [PubMed]
- Tomii, K.; Kanehisa, M. Analysis of amino acid indices and mutation matrices for sequence comparison and structure prediction of proteins. Protein Eng. 1996, 9, 27–36. [Google Scholar] [CrossRef] [PubMed]
- Sneath, P.H.A. Relations between chemical structure and biological activity in peptides. J. Theor. Biol. 1966, 12, 157–195. [Google Scholar] [CrossRef]
- Chou, P.Y.; Fasman, G.D. Prediction of the Secondary Structure of Proteins from Their Amino Acid Sequence. In Advances in Enzymology - and Related Areas of Molecular Biology; Meister, A., Ed.; John Wiley & Sons, Inc.: Hoboken, NJ, USA, 2006; pp. 45–148. [Google Scholar] [CrossRef]
- Palau, J.; Argos, P.; Puigdomenech, P. Protein Secondary Structure. Studies on the Limits of Prediction Accuracy. Int. J. Pept. Protein Res. 1982, 19, 394–401. [Google Scholar] [CrossRef] [PubMed]
- Rackovsky, S.; Scheraga, H.A. Differential Geometry and Polymer Conformation. 4. Conformational and Nucleation Properties of Individual Amino Acids. Macromolecules 1982, 15, 1340–1346. [Google Scholar] [CrossRef]
- Robson, B.; Suzuki, E. Conformational Properties of Amino Acid Residues in Globular Proteins. J. Mol. Biol. 1976, 107, 327–356. [Google Scholar] [CrossRef]
- Naderi-Manesh, H.; Sadeghi, M.; Arab, S.; Moosavi Movahedi, A.A. Prediction of Protein Surface Accessibility with Information Theory. Proteins 2001, 42, 452–459. [Google Scholar] [CrossRef]
- Bull, H.B.; Breese, K. Surface Tension of Amino Acid Solutions: A Hydrophobicity Scale of the Amino Acid Residues. Arch. Biochem. Biophys. 1974, 161, 665–670. [Google Scholar] [CrossRef]
- Levitt, M. Conformational Preferences of Amino Acids in Globular Proteins. Biochemistry 1978, 17, 4277–4285. [Google Scholar] [CrossRef] [PubMed]
- Meek, J.L. Prediction of Peptide Retention Times in High-Pressure Liquid Chromatography on the Basis of Amino Acid Composition. Proc. Natl. Acad. Sci. USA 1980, 77, 1632–1636. [Google Scholar] [CrossRef] [PubMed]
- Prabhakaran, M. The Distribution of Physical, Chemical and Conformational Properties in Signal and Nascent Peptides. Biochem. J. 1990, 269, 691–696. [Google Scholar] [CrossRef] [PubMed]
- George, R.A.; Heringa, J. An Analysis of Protein Domain Linkers: Their Classification and Role in Protein Folding. Protein Eng. 2002, 15, 871–879. [Google Scholar] [CrossRef] [PubMed]
- Di Giulio, M. A Comparison of Proteins from Pyrococcus Furiosus and Pyrococcus Abyssi: Barophily in the Physicochemical Properties of Amino Acids and in the Genetic Code. Gene 2005, 346, 1–6. [Google Scholar] [CrossRef] [PubMed]
- Nakashima, H.; Nishikawa, K.; Ooi, T. Distinct Character in Hydrophobicity of Amino Acid Compositions of Mitochondrial Proteins. Proteins 1990, 8, 173–178. [Google Scholar] [CrossRef] [PubMed]
- Kumar, S.; Tsai, C.J.; Nussinov, R. Factors Enhancing Protein Thermostability. Protein Eng. 2000, 13, 179–191. [Google Scholar] [CrossRef] [PubMed]
- Nakashima, H.; Nishikawa, K. The Amino Acid Composition Is Different between the Cytoplasmic and Extracellular Sides in Membrane Proteins. FEBS Lett. 1992, 303, 141–146. [Google Scholar] [CrossRef] [PubMed]
- Rackovsky, S.; Scheraga, H.A. Hydrophobicity, Hydrophilicity, and the Radial and Orientational Distributions of Residues in Native Proteins. Proc. Natl. Acad. Sci. USA 1977, 74, 5248–5251. [Google Scholar] [CrossRef] [PubMed]
- Reetz, M.T.; Sanchis, J. Constructing and Analyzing the Fitness Landscape of an Experimental Evolutionary Process. ChemBioChem 2008, 9, 2260–2267. [Google Scholar] [CrossRef] [PubMed]
- Iakovou, K.; Kazanis, M.; Vavayannis, A.; Bruni, G.; Romeo, M.R.; Massarelli, P.; Teramoto, S.; Fujiki, H.; Mori, T. Synthesis of oxypropanolamine derivatives of 3,4-dihydro-2H-1,4-benzoxazine, beta-adrenergic affinity, inotropic, chronotropic and coronary vasodilating activities. Eur. J. Med. Chem. 1999, 34, 903–917. [Google Scholar] [CrossRef]
- DaCambra, M.P.; Yusta, B.; Sumner-Smith, M.; Crivici, A.; Drucker, D.J.; Brubaker, P.L. Structural determinants for activity of glucagon-like peptide-2. Biochemistry 2000, 39, 8888–8894. [Google Scholar] [CrossRef] [PubMed]
- Mukai, Y.; Shibata, H.; Nakamura, T.; Yoshioka, Y.; Abe, Y.; Nomura, T.; Taniai, M.; Ohta, T.; Ikemizu, S.; Nakagawa, S.; et al. Structure–Function Relationship of Tumor Necrosis Factor (TNF) and Its Receptor Interaction Based on 3D Structural Analysis of a Fully Active TNFR1-Selective TNF Mutant. J. Mol. Biol. 2009, 385, 1221–1229. [Google Scholar] [CrossRef] [PubMed]
| Index | cvRMSE | cvR2 |
|---|---|---|
| 440 350 44 | 1.99 | 0.47 |
| 440 350 | 1.99 | 0.47 |
| 440 350 233 | 1.99 | 0.47 |
| 440 44 | 2.06 | 0.37 |
| 44 233 | 2.09 | 0.37 |
| 449 350 | 2.10 | 0.43 |
| 449 350 233 | 2.10 | 0.43 |
| 449 350 44 | 2.10 | 0.43 |
| 449 | 2.11 | 0.42 |
| 449 233 | 2.11 | 0.42 |
| Index | cvRMSE | cvR2 |
|---|---|---|
| 161 178 516 | 0.1051 | 0.9685 |
| 254 178 516 | 0.1051 | 0.9685 |
| 232 161 508 | 0.1123 | 0.9640 |
| 232 254 508 | 0.1123 | 0.9640 |
| 161 508 | 0.1146 | 0.9629 |
| 254 508 | 0.1146 | 0.9629 |
| 161 254 508 | 0.1150 | 0.9624 |
| 303 508 | 0.1161 | 0.9624 |
| 303 161 508 | 0.1170 | 0.9615 |
| 303 254 508 | 0.1170 | 0.9615 |
| Dataset | Index 1 and Protein Feature | Index 2 and Protein Feature | Index 3 and Protein Feature |
|---|---|---|---|
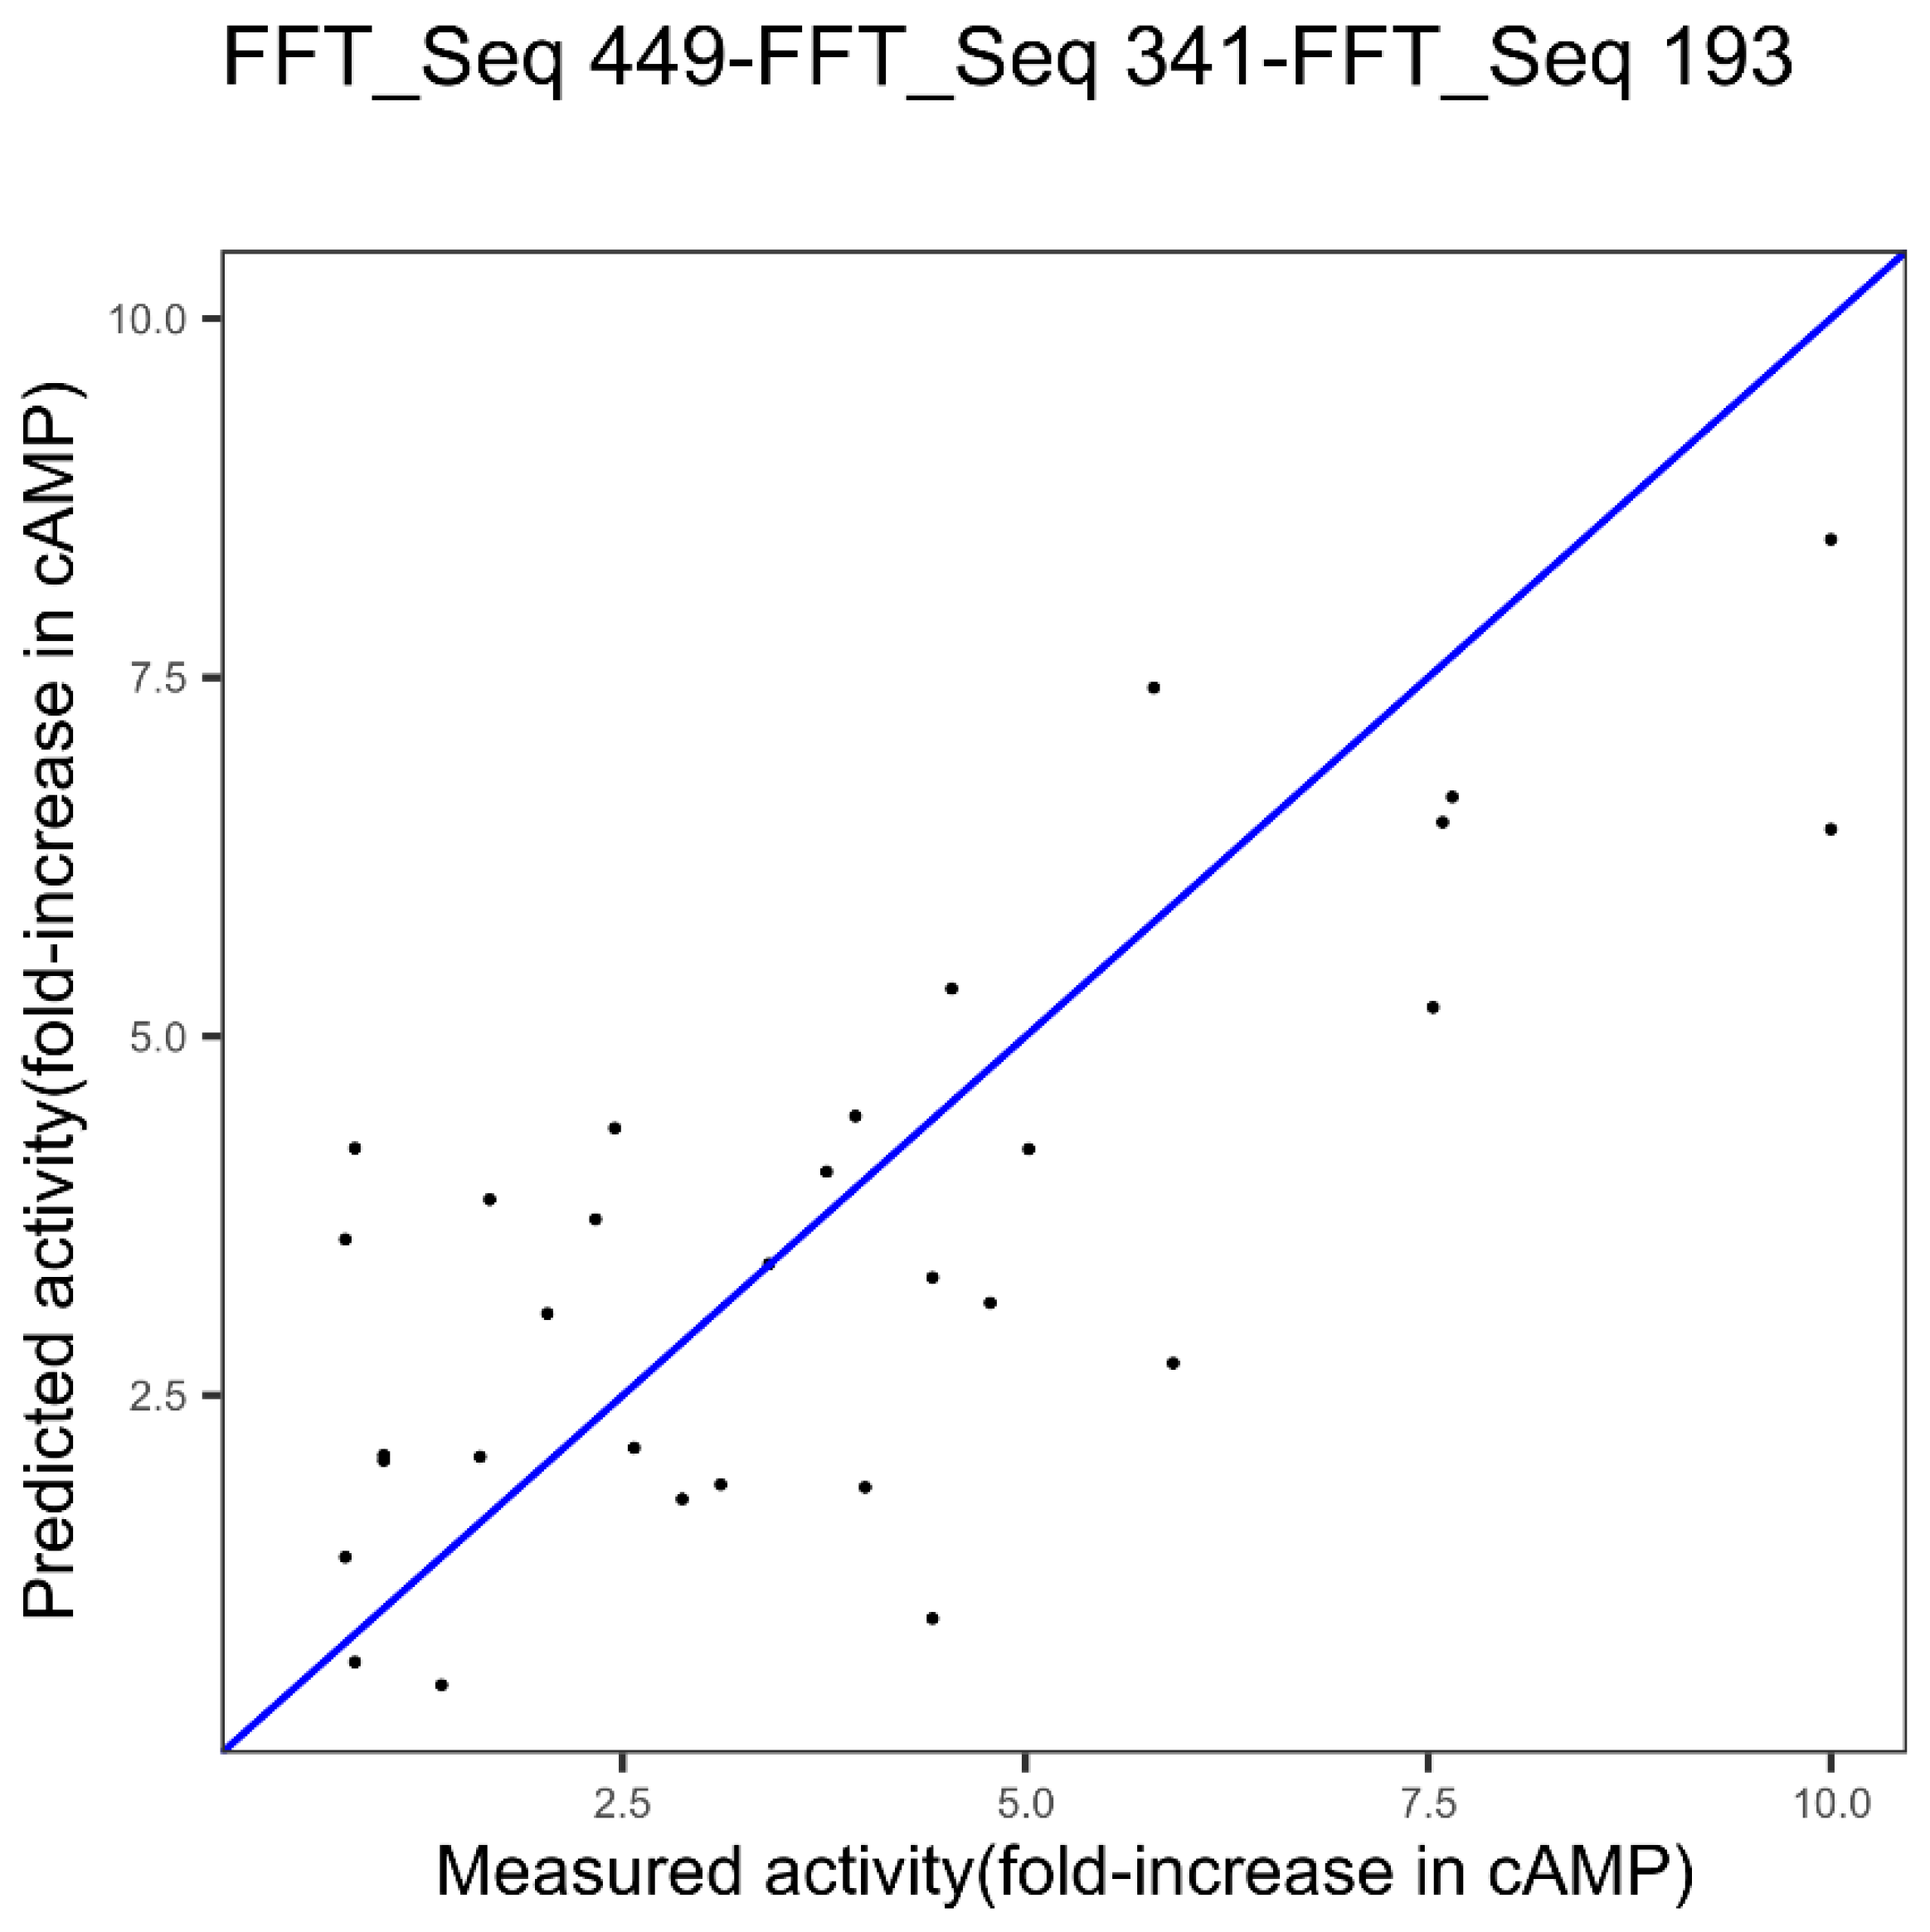
| GLP-2 | Index 449, other properties family | Index 341, alpha and turn propensities family | Index 193, composition family |
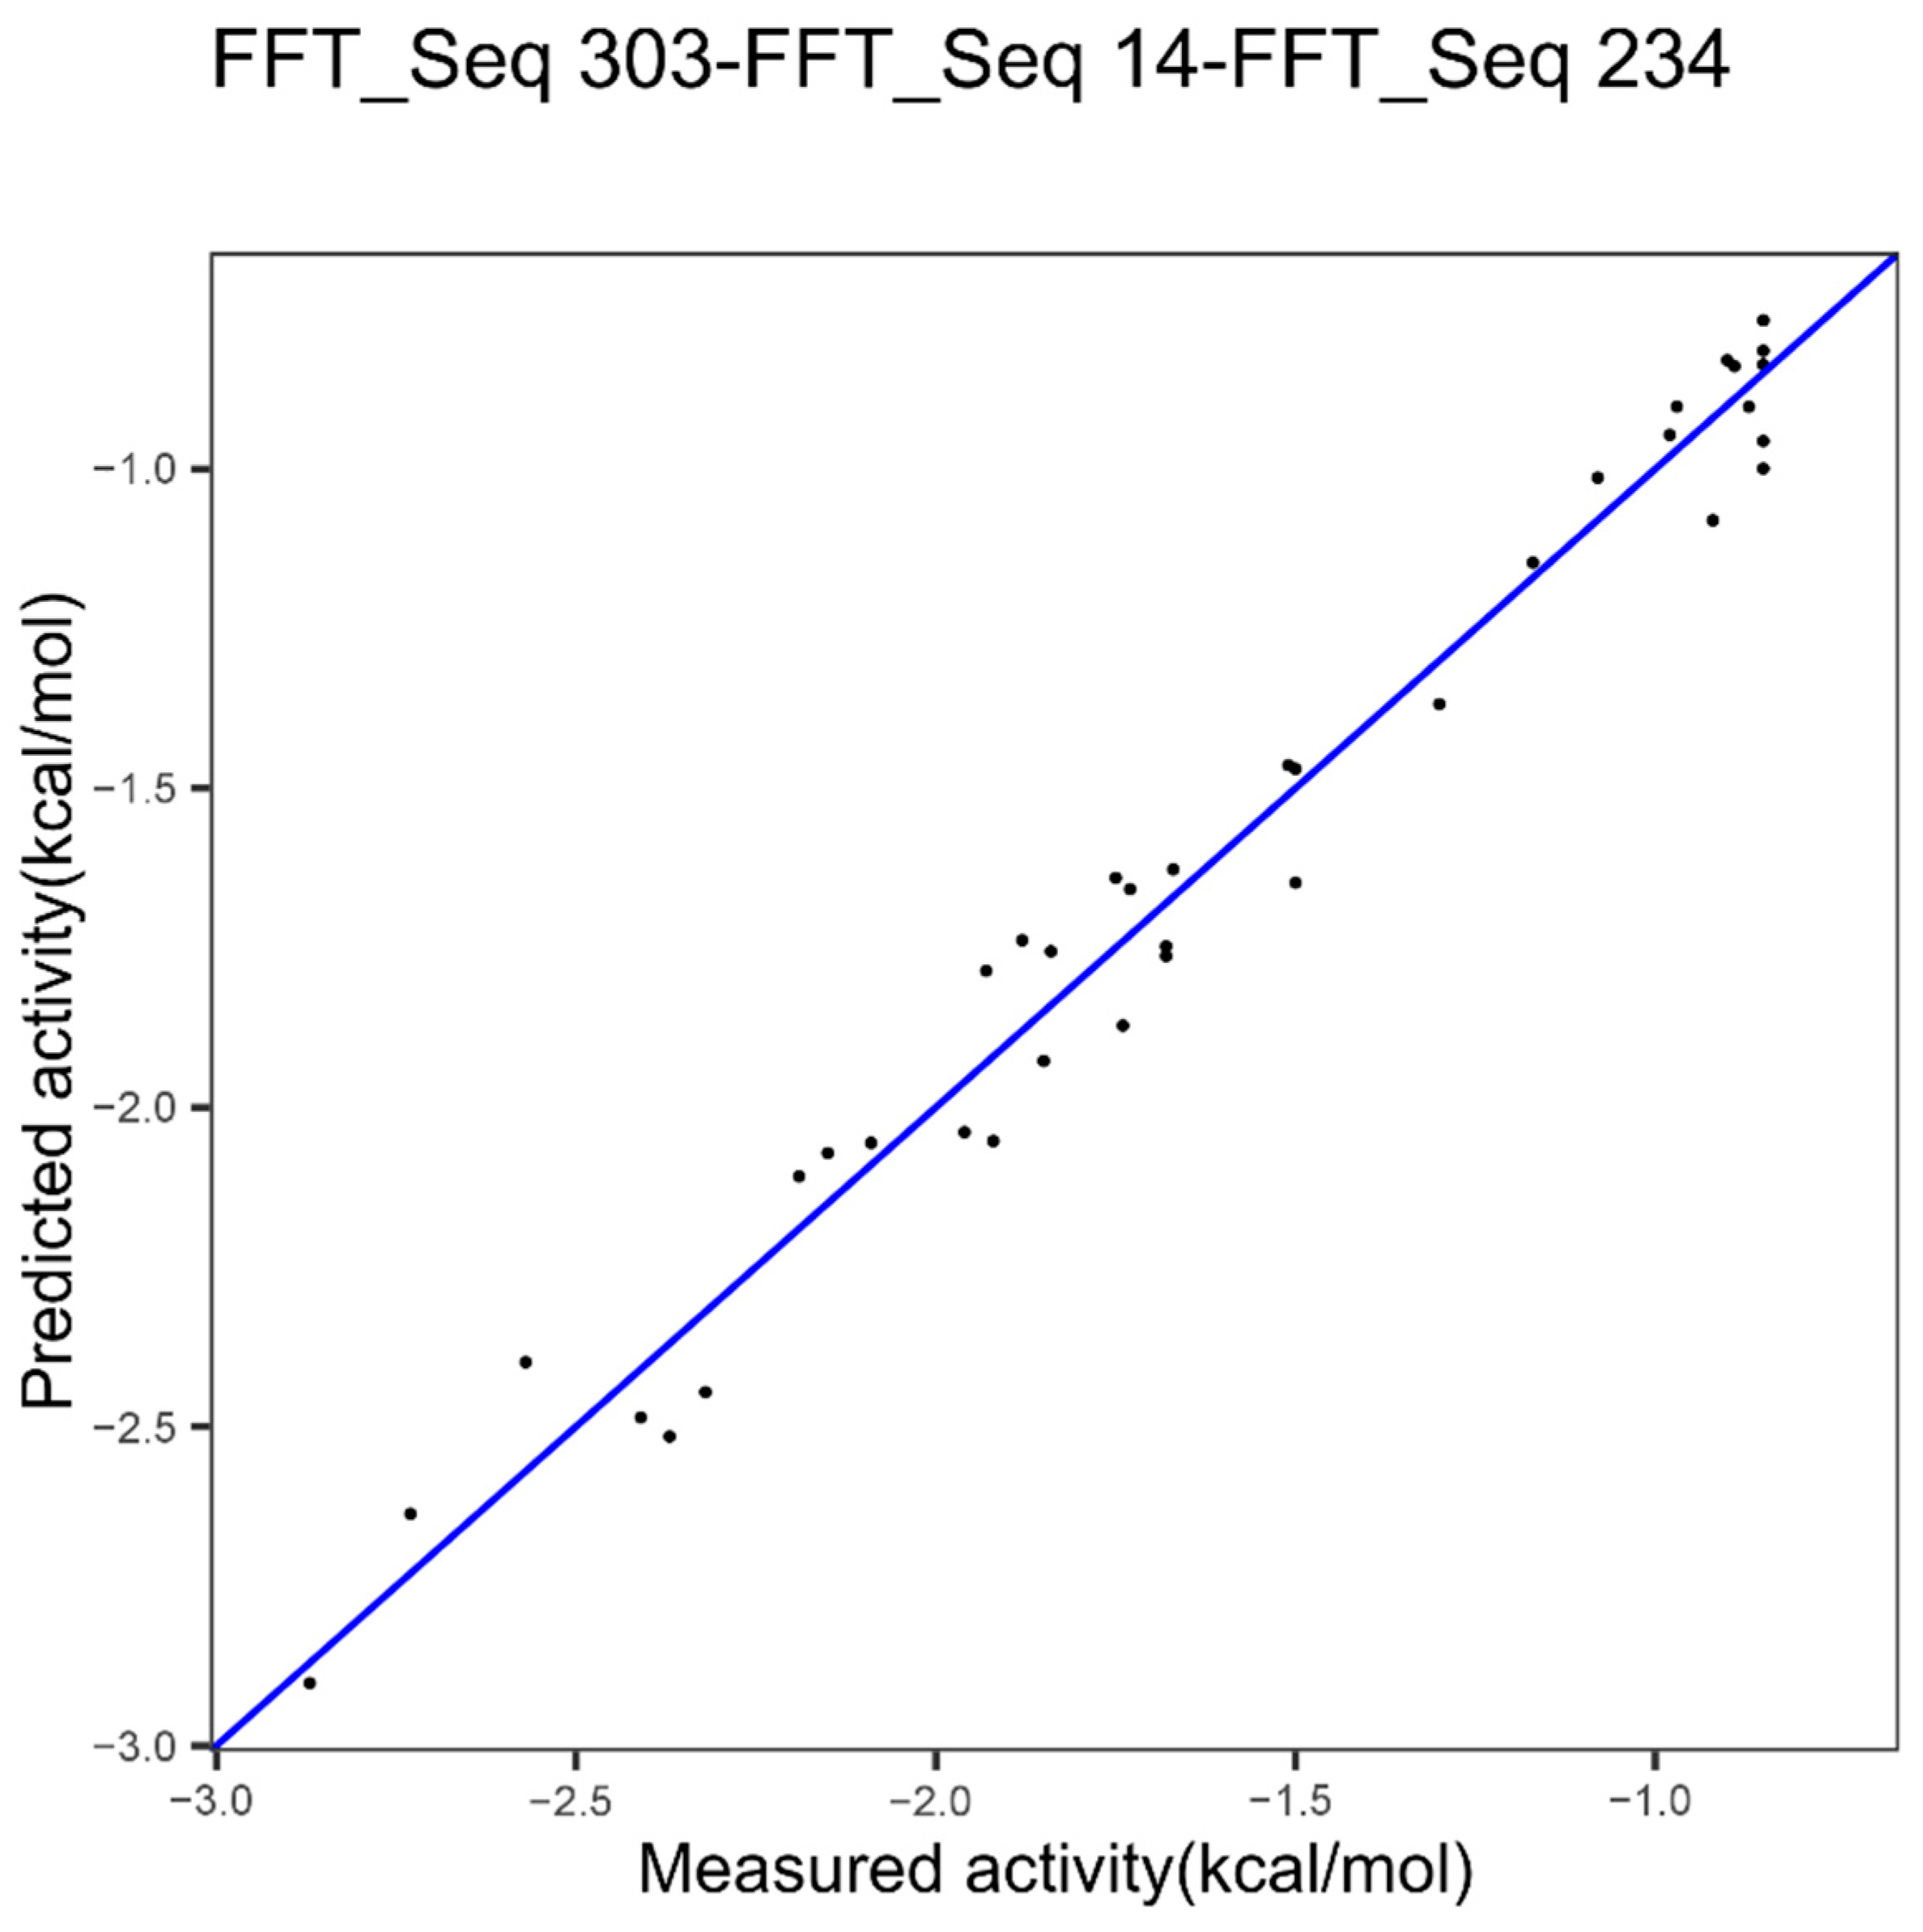
| Epoxide hydrolase | Index 303, other properties family | Index 14, hydrophobicity | Index 234, beta propensity |
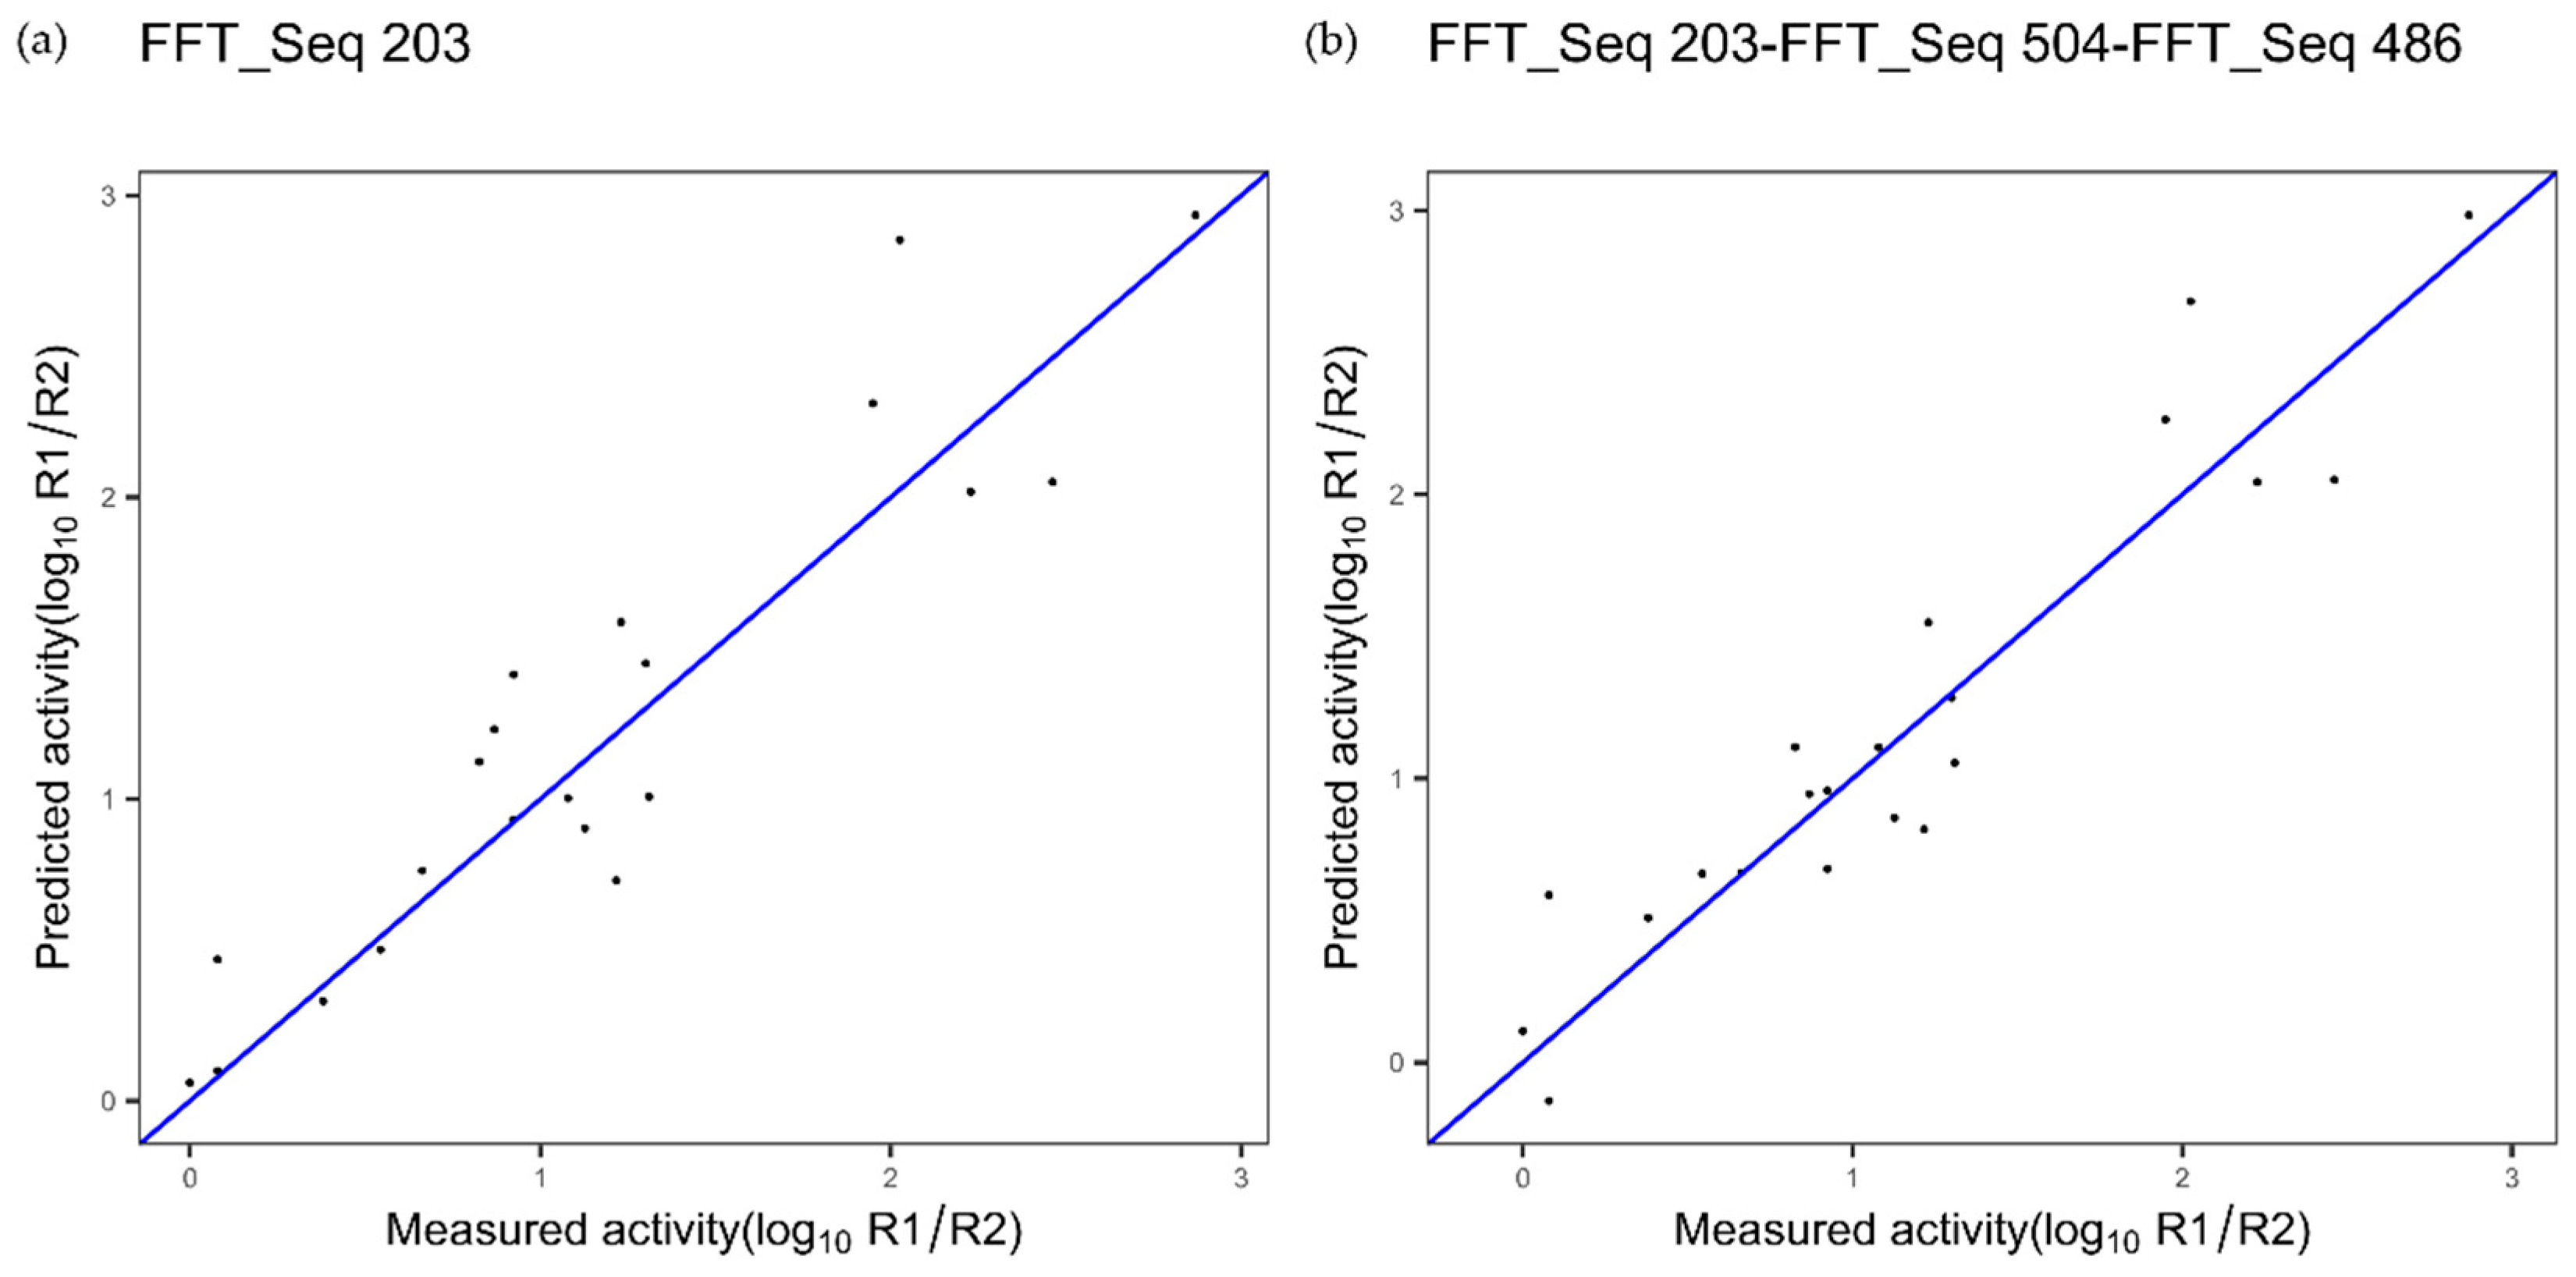
| TNF alpha | Index 203, composition | Index 504, NA | Index 486, NA |
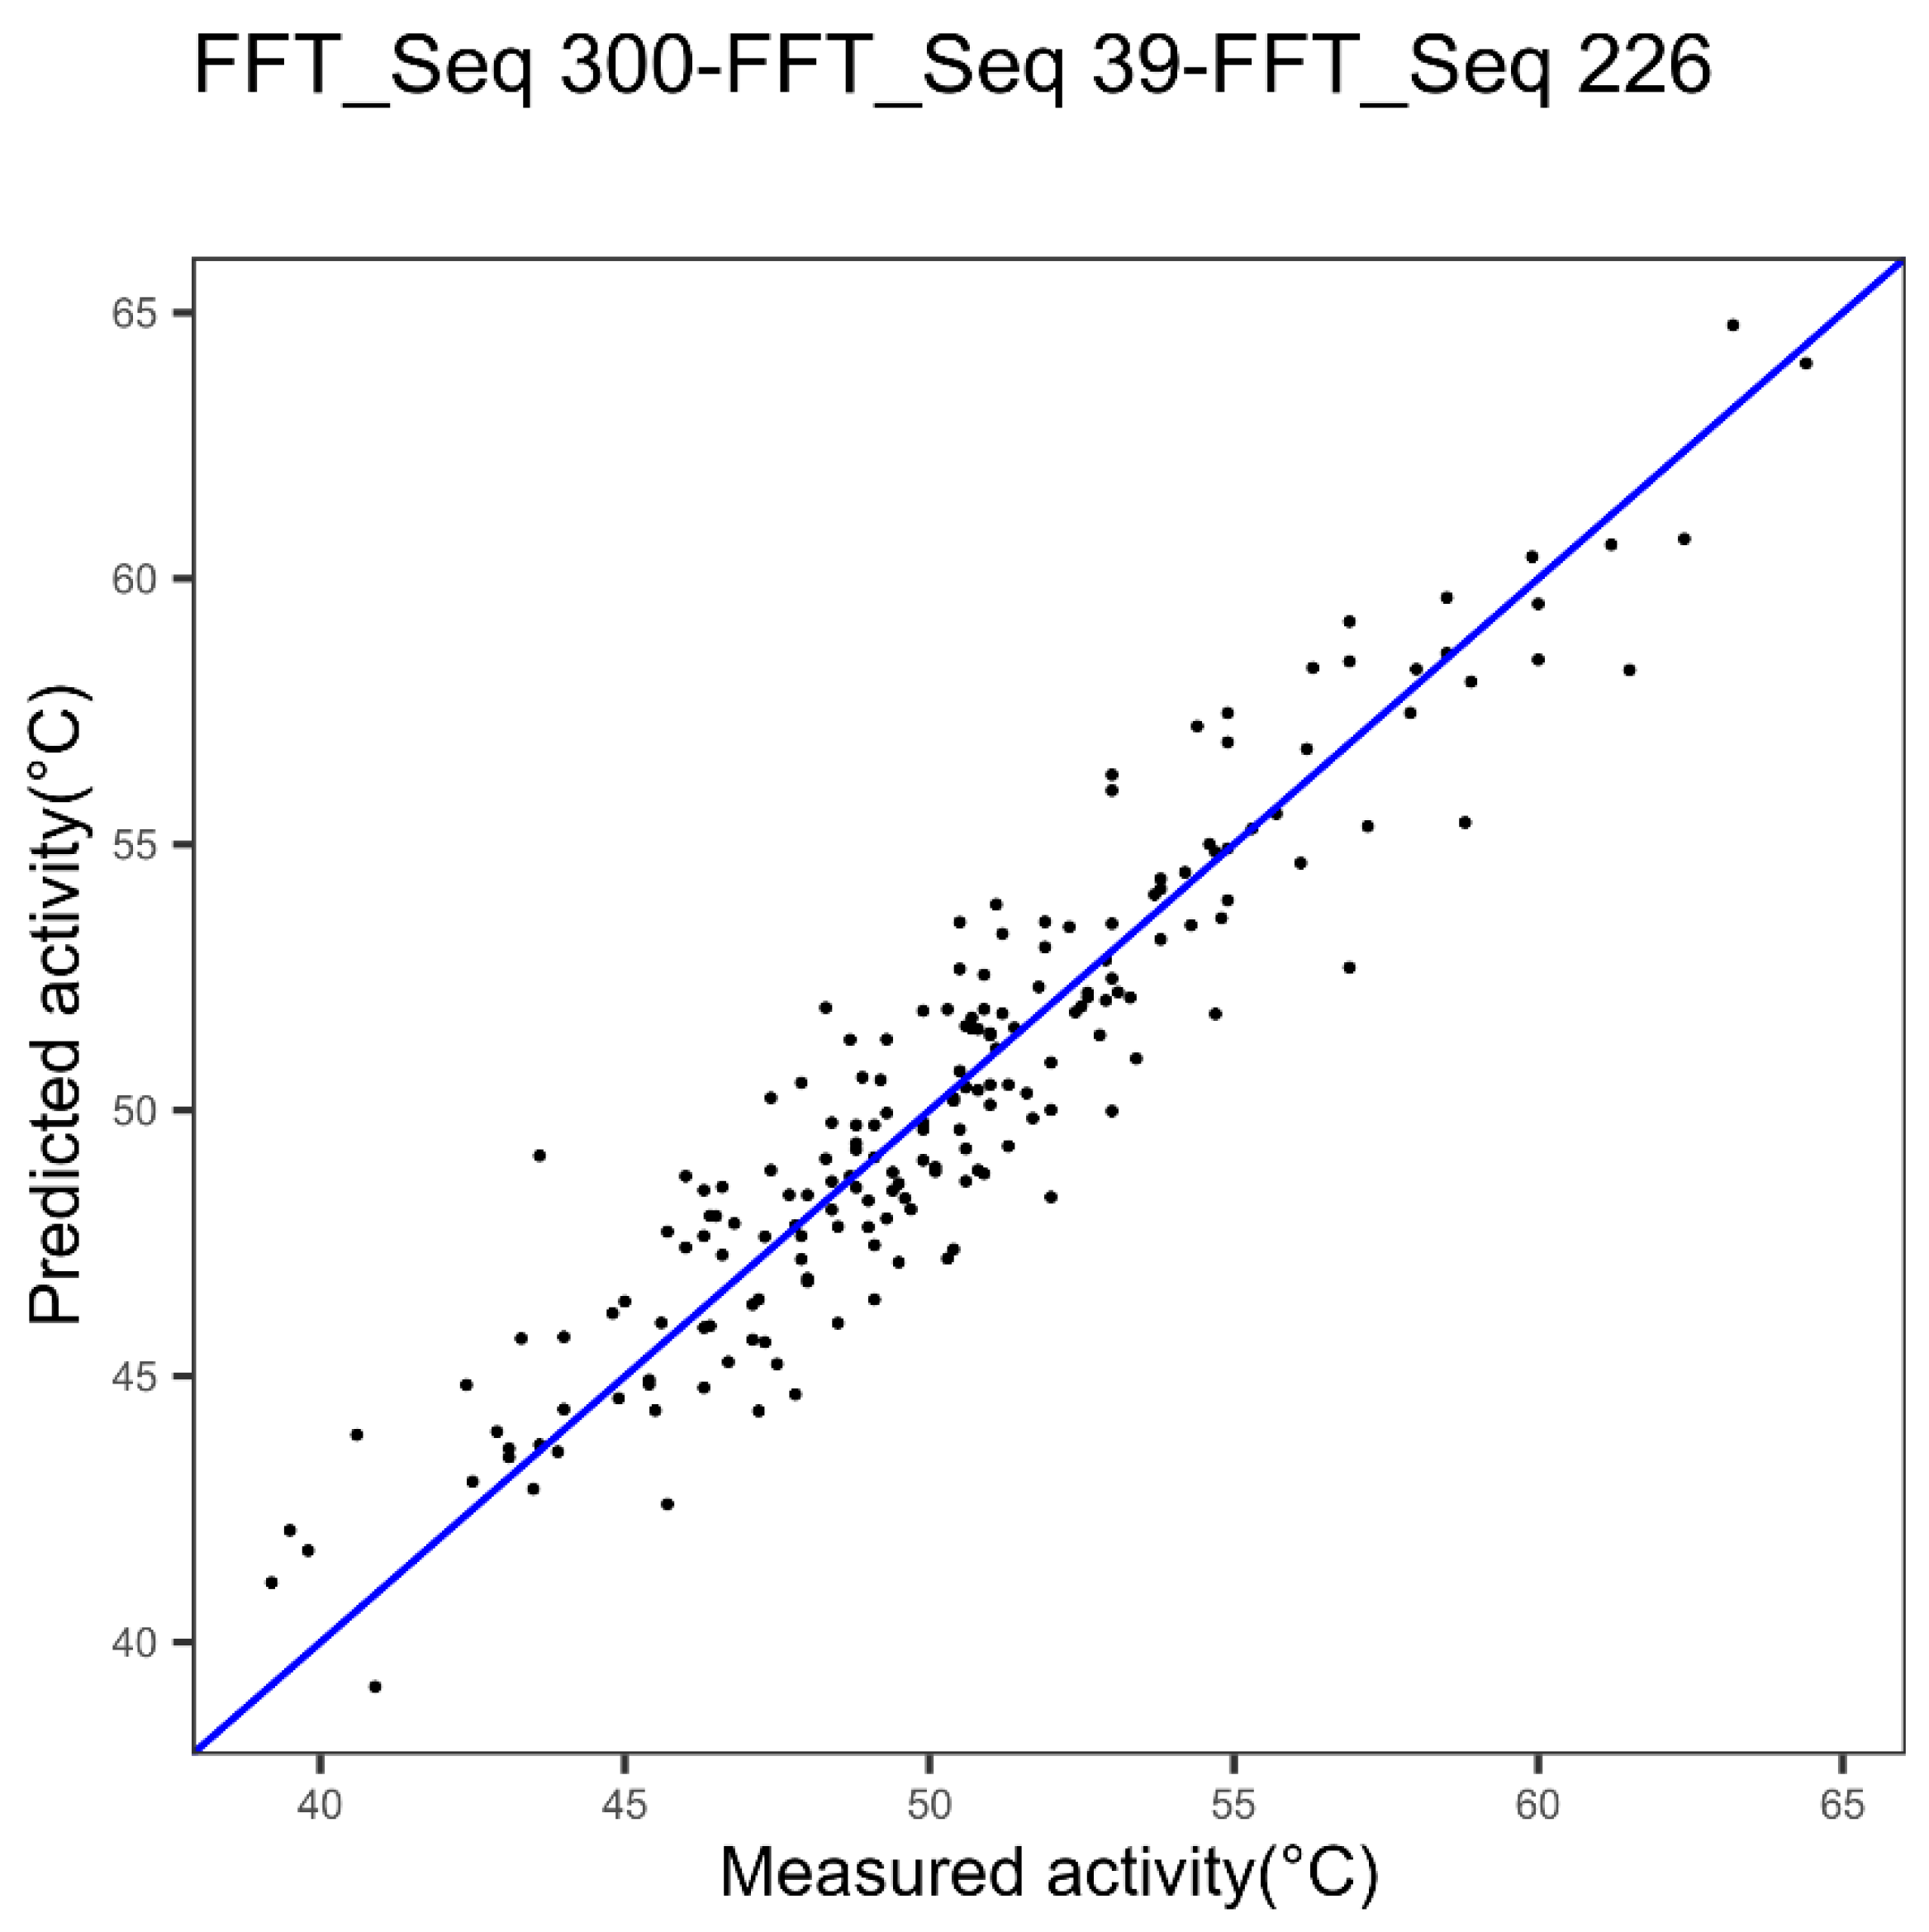
| Cytochrome P450 | Index 300, alpha and turn propensities | Index 39, beta propensity | Index 226 beta propensity |
| Dataset | cvRMSE | cvR2 | p-Value (Error² with Paired Student Test) |
|---|---|---|---|
| Cytochrome P450 | |||
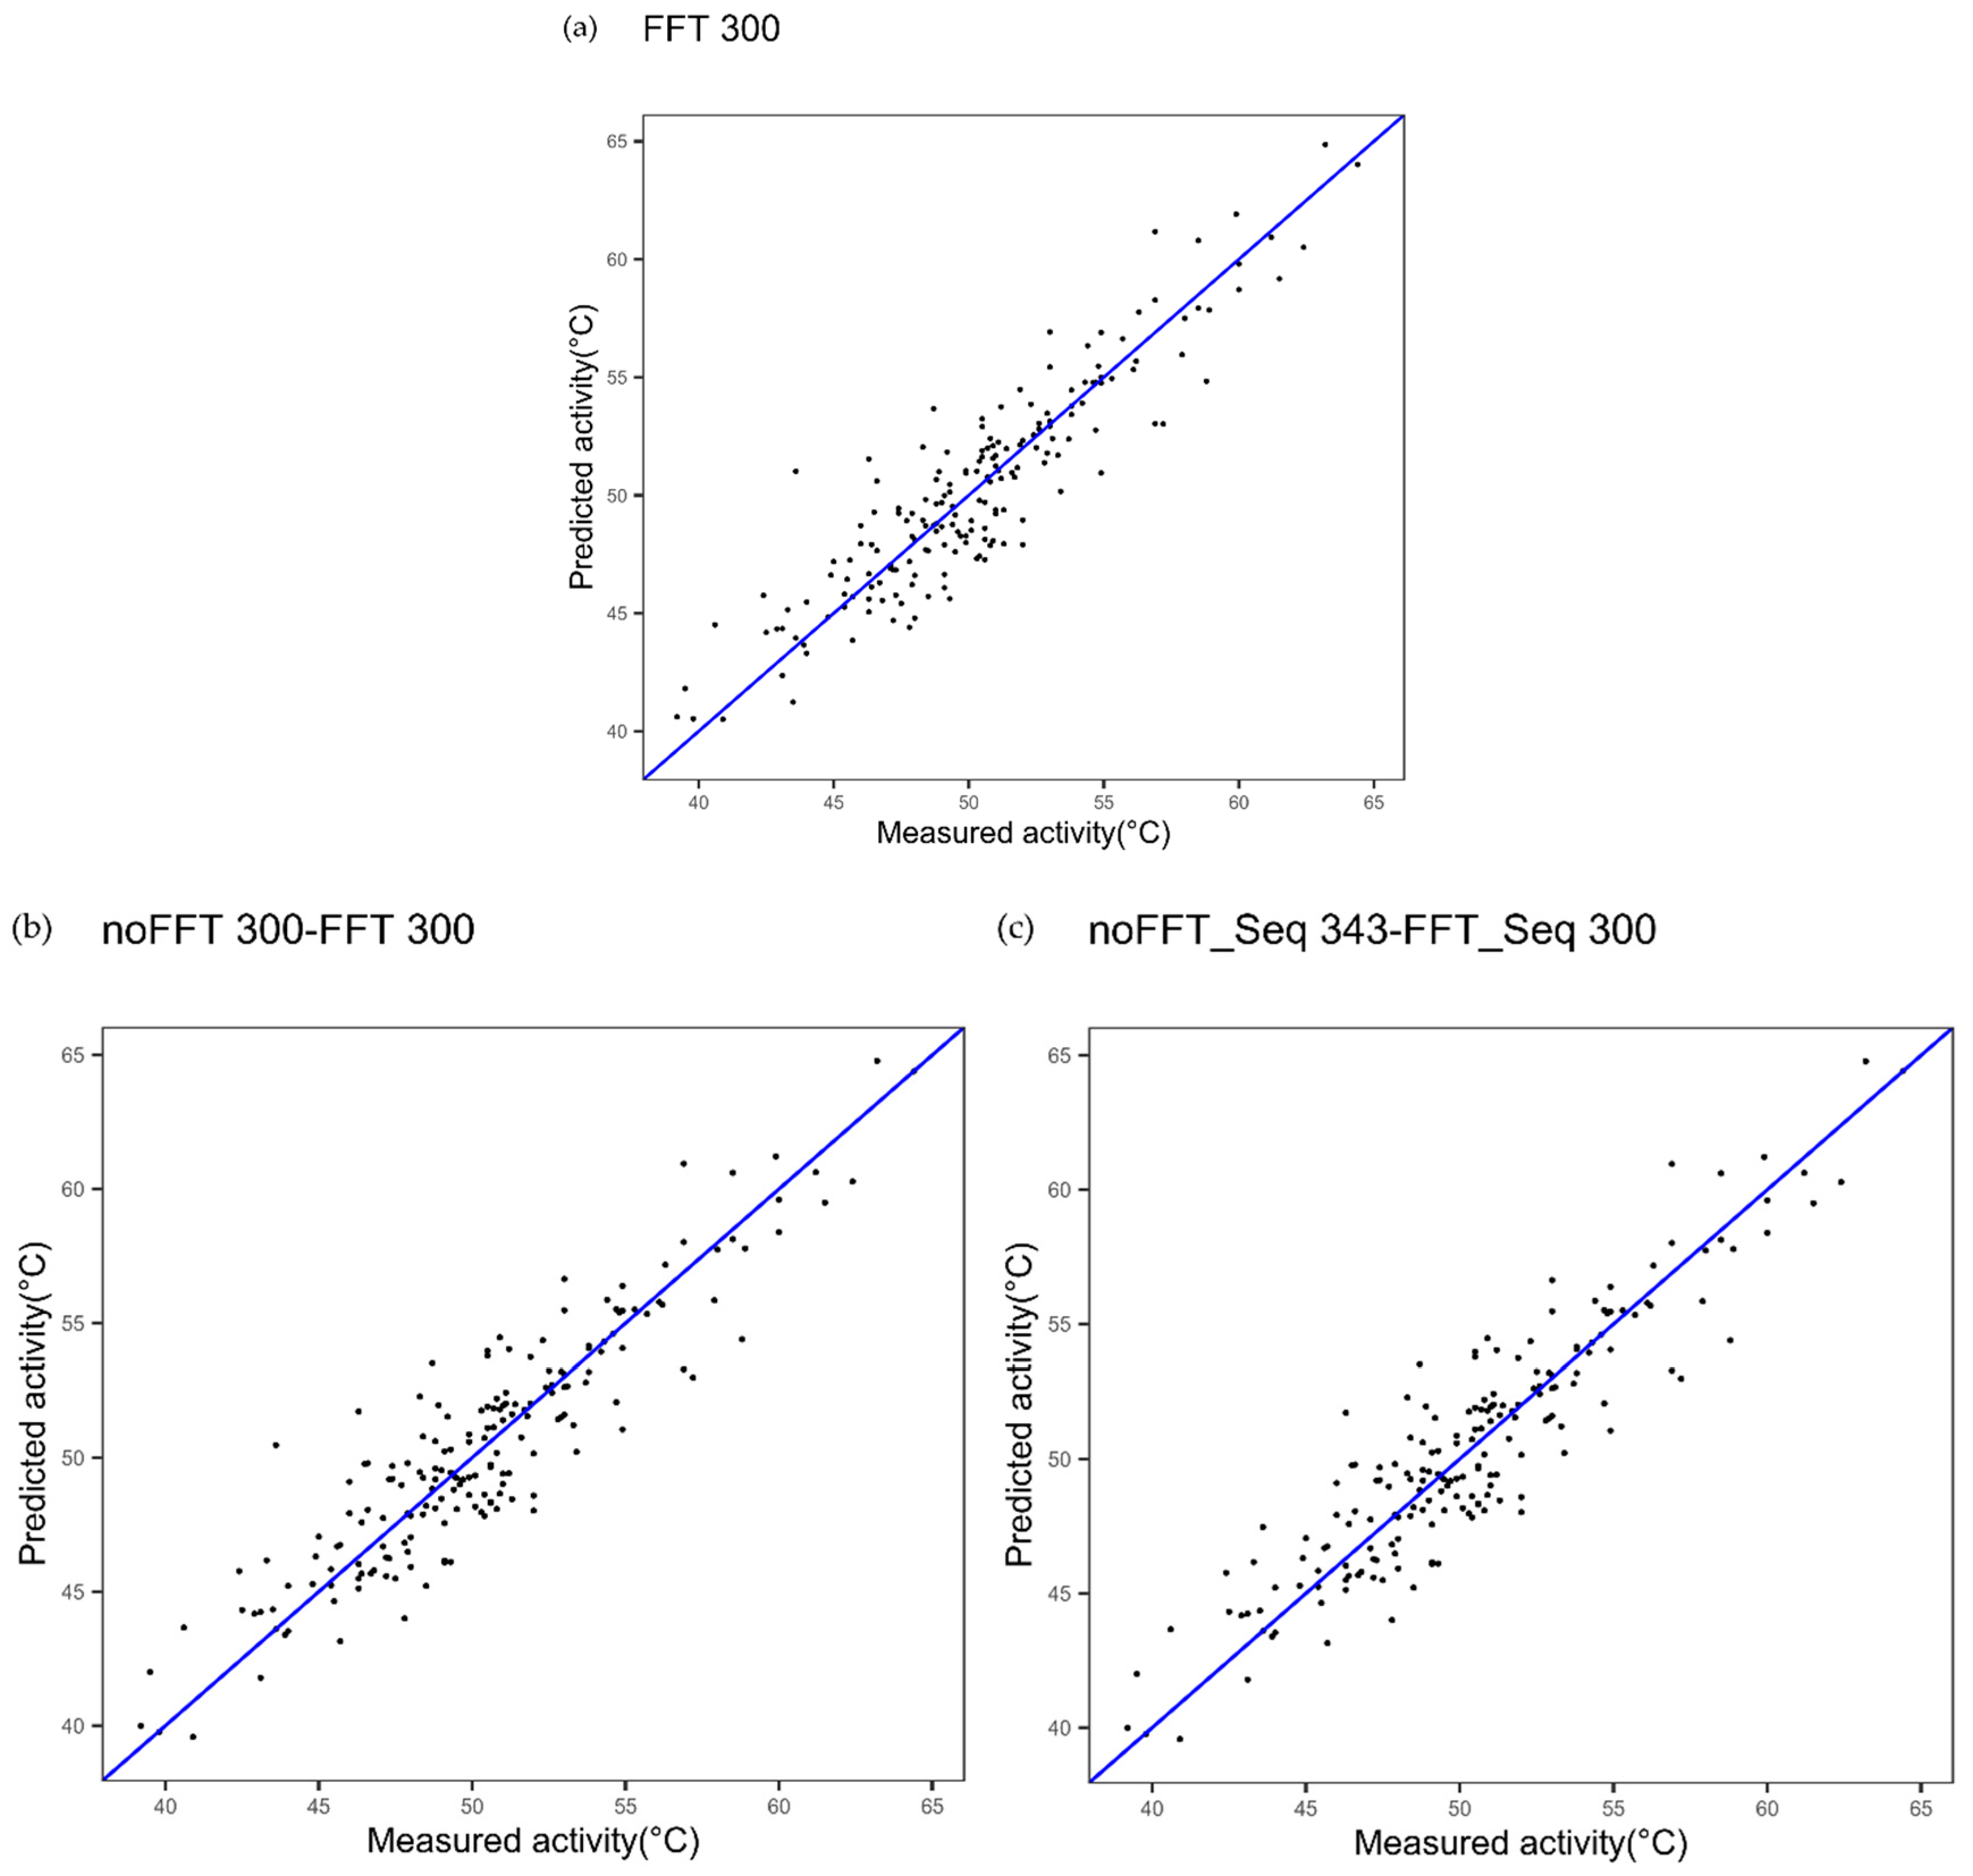
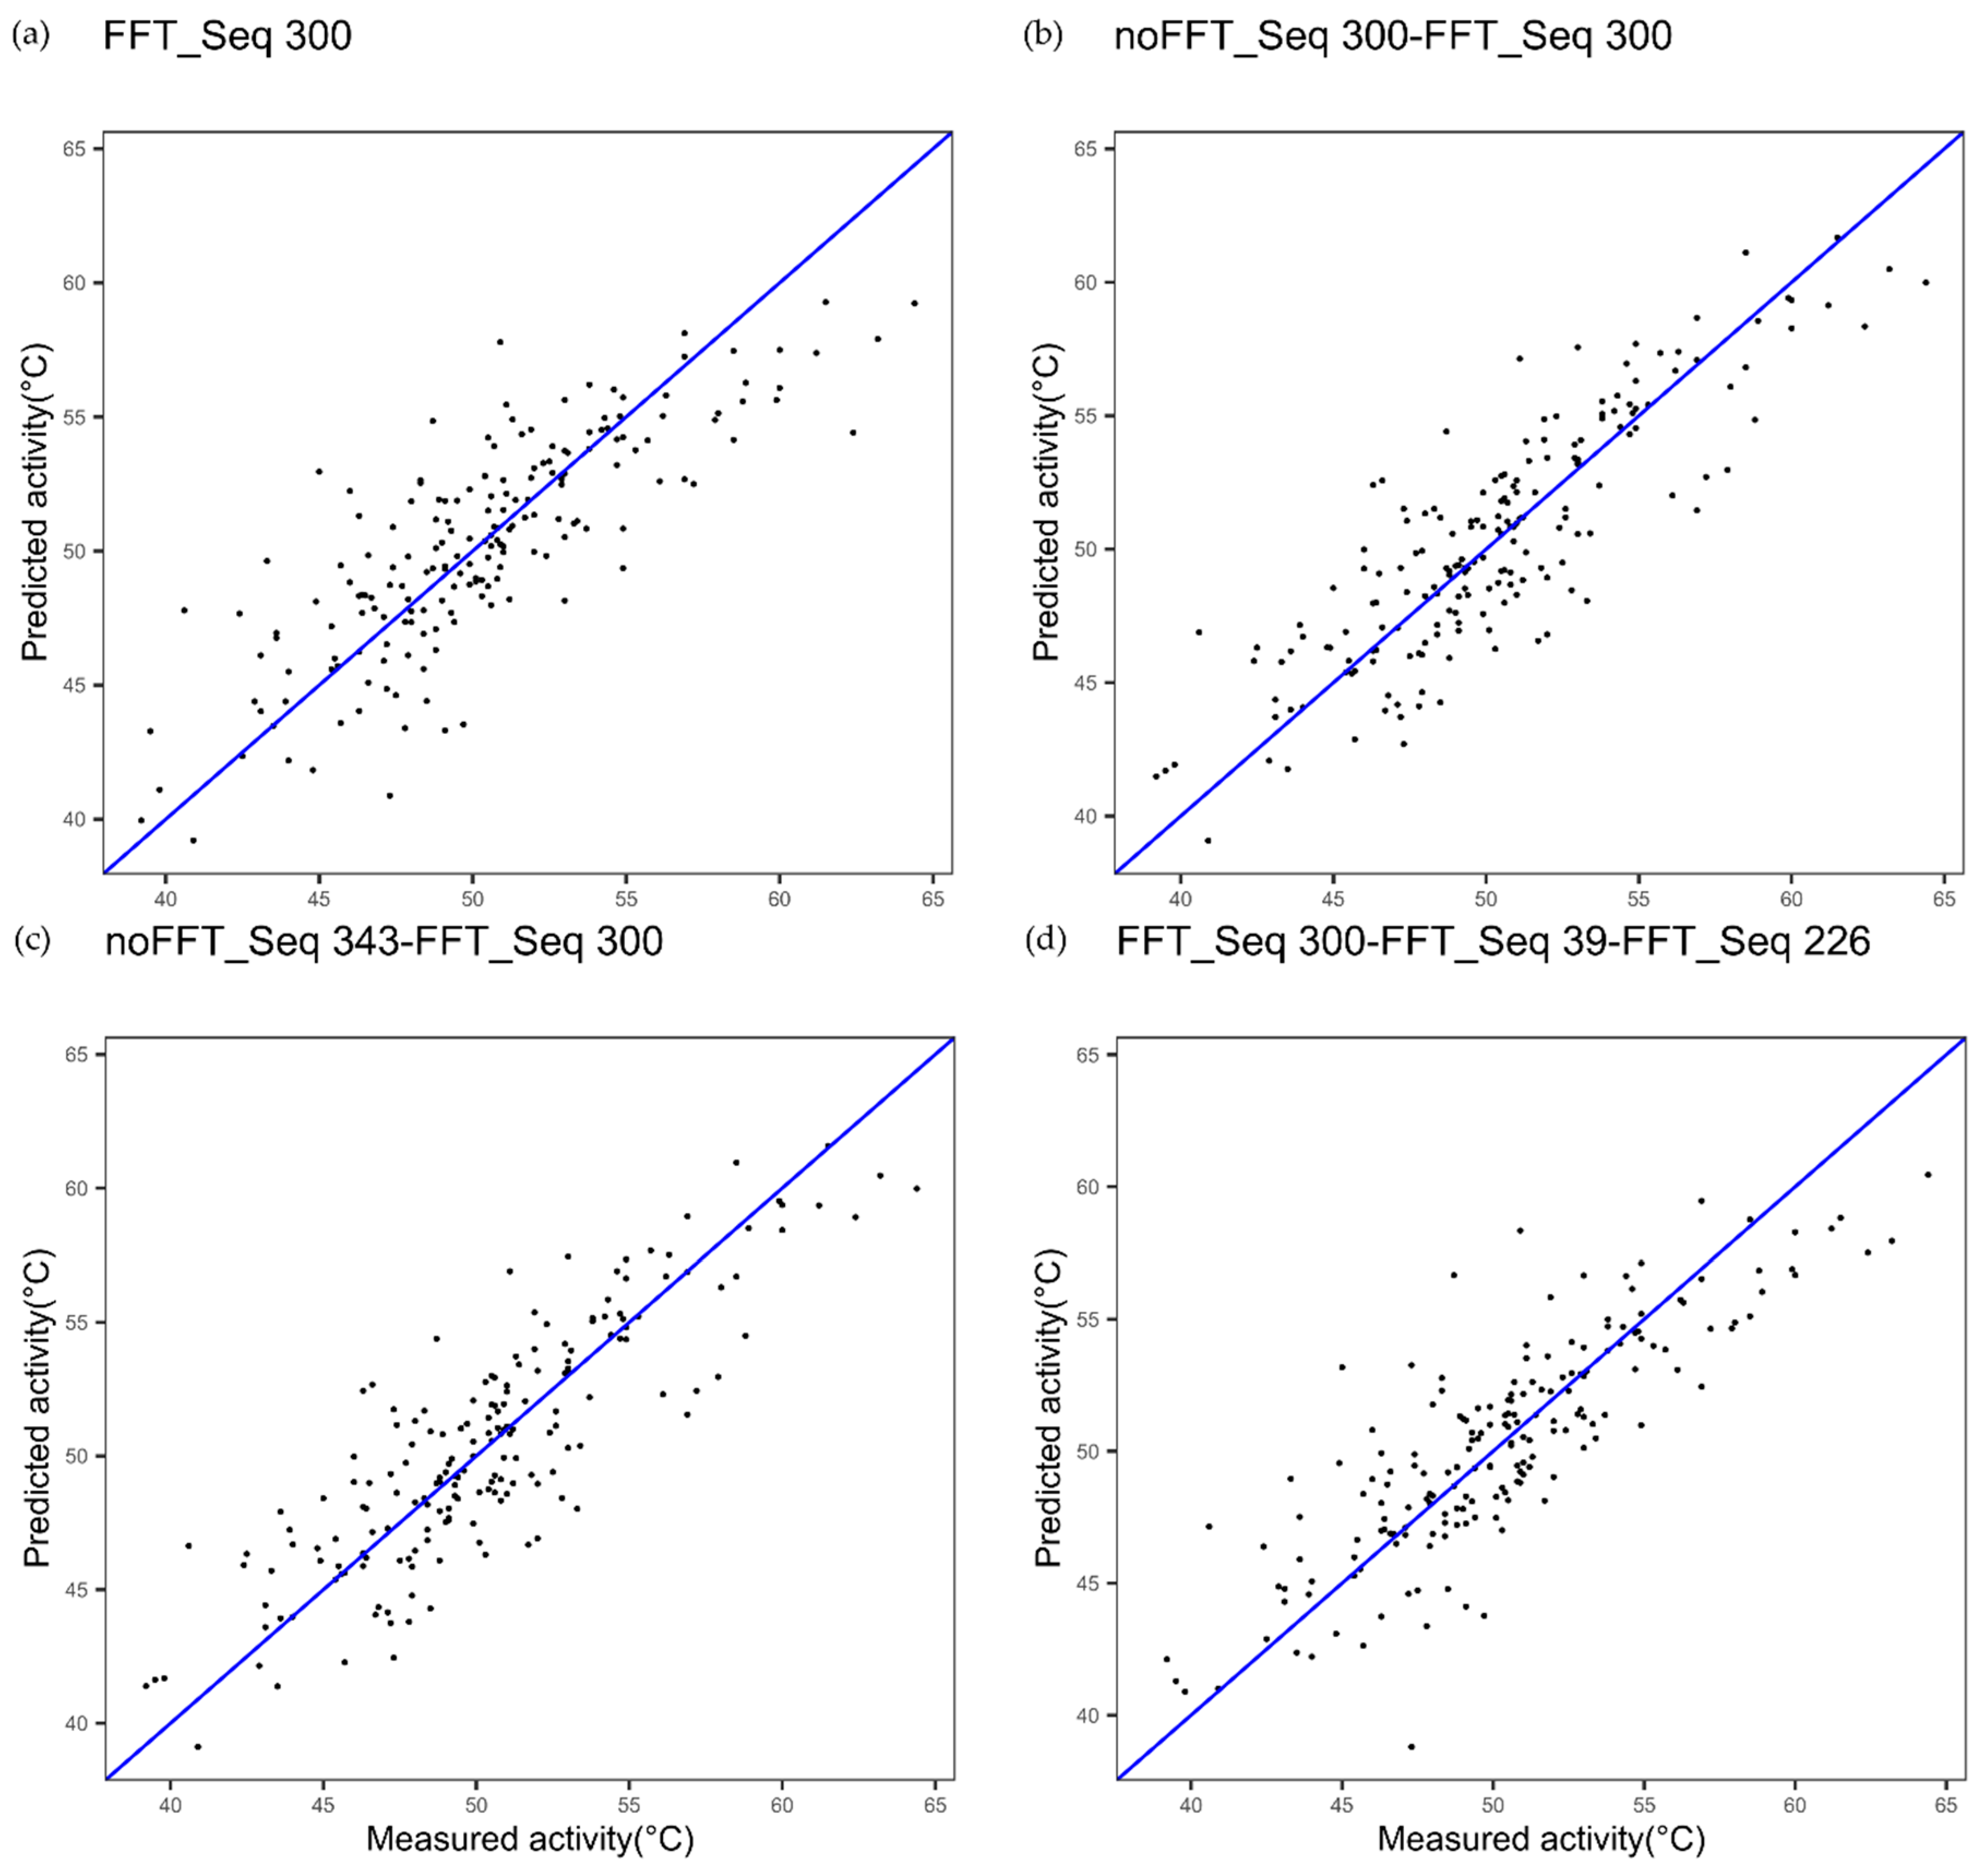
| Cytochrome P450 FFT one index Figure 2a | 1.91 | 0.83 | - |
| Cytochrome P450 multi indices noFFT_FFT Figure 2c | 1.85 | 0.84 | 0.4123 |
| Cytochrome P450 one index noFFT + FFT Figure 2b | 1.89 | 0.83 | 0.7781 |
| Cytochrome P450 3 indices FFT Figure 9 | 1.63 | 0.88 | 0.0020 |
| Cytochrome P450 - selection of 20% frequencies | |||
| Cytochrome P450 1 index FFT selection 20% Figure 10a | 2.68 | 0.66 | - |
| Cytochrome P450 two indices noFFT_FFT selection 20% Figure 10c | 2.39 | 0.74 | 0.0767 |
| Cytochrome P450 one index noFFT + FFT selection 20% (Figure 10b) | 2.38 | 0.74 | 0.0600 |
| Cytochrome P450 3 indices FFT selection 20% Figure 10d | 2.52 | 0.7 | 0.0826 |
| GLP-2 | |||
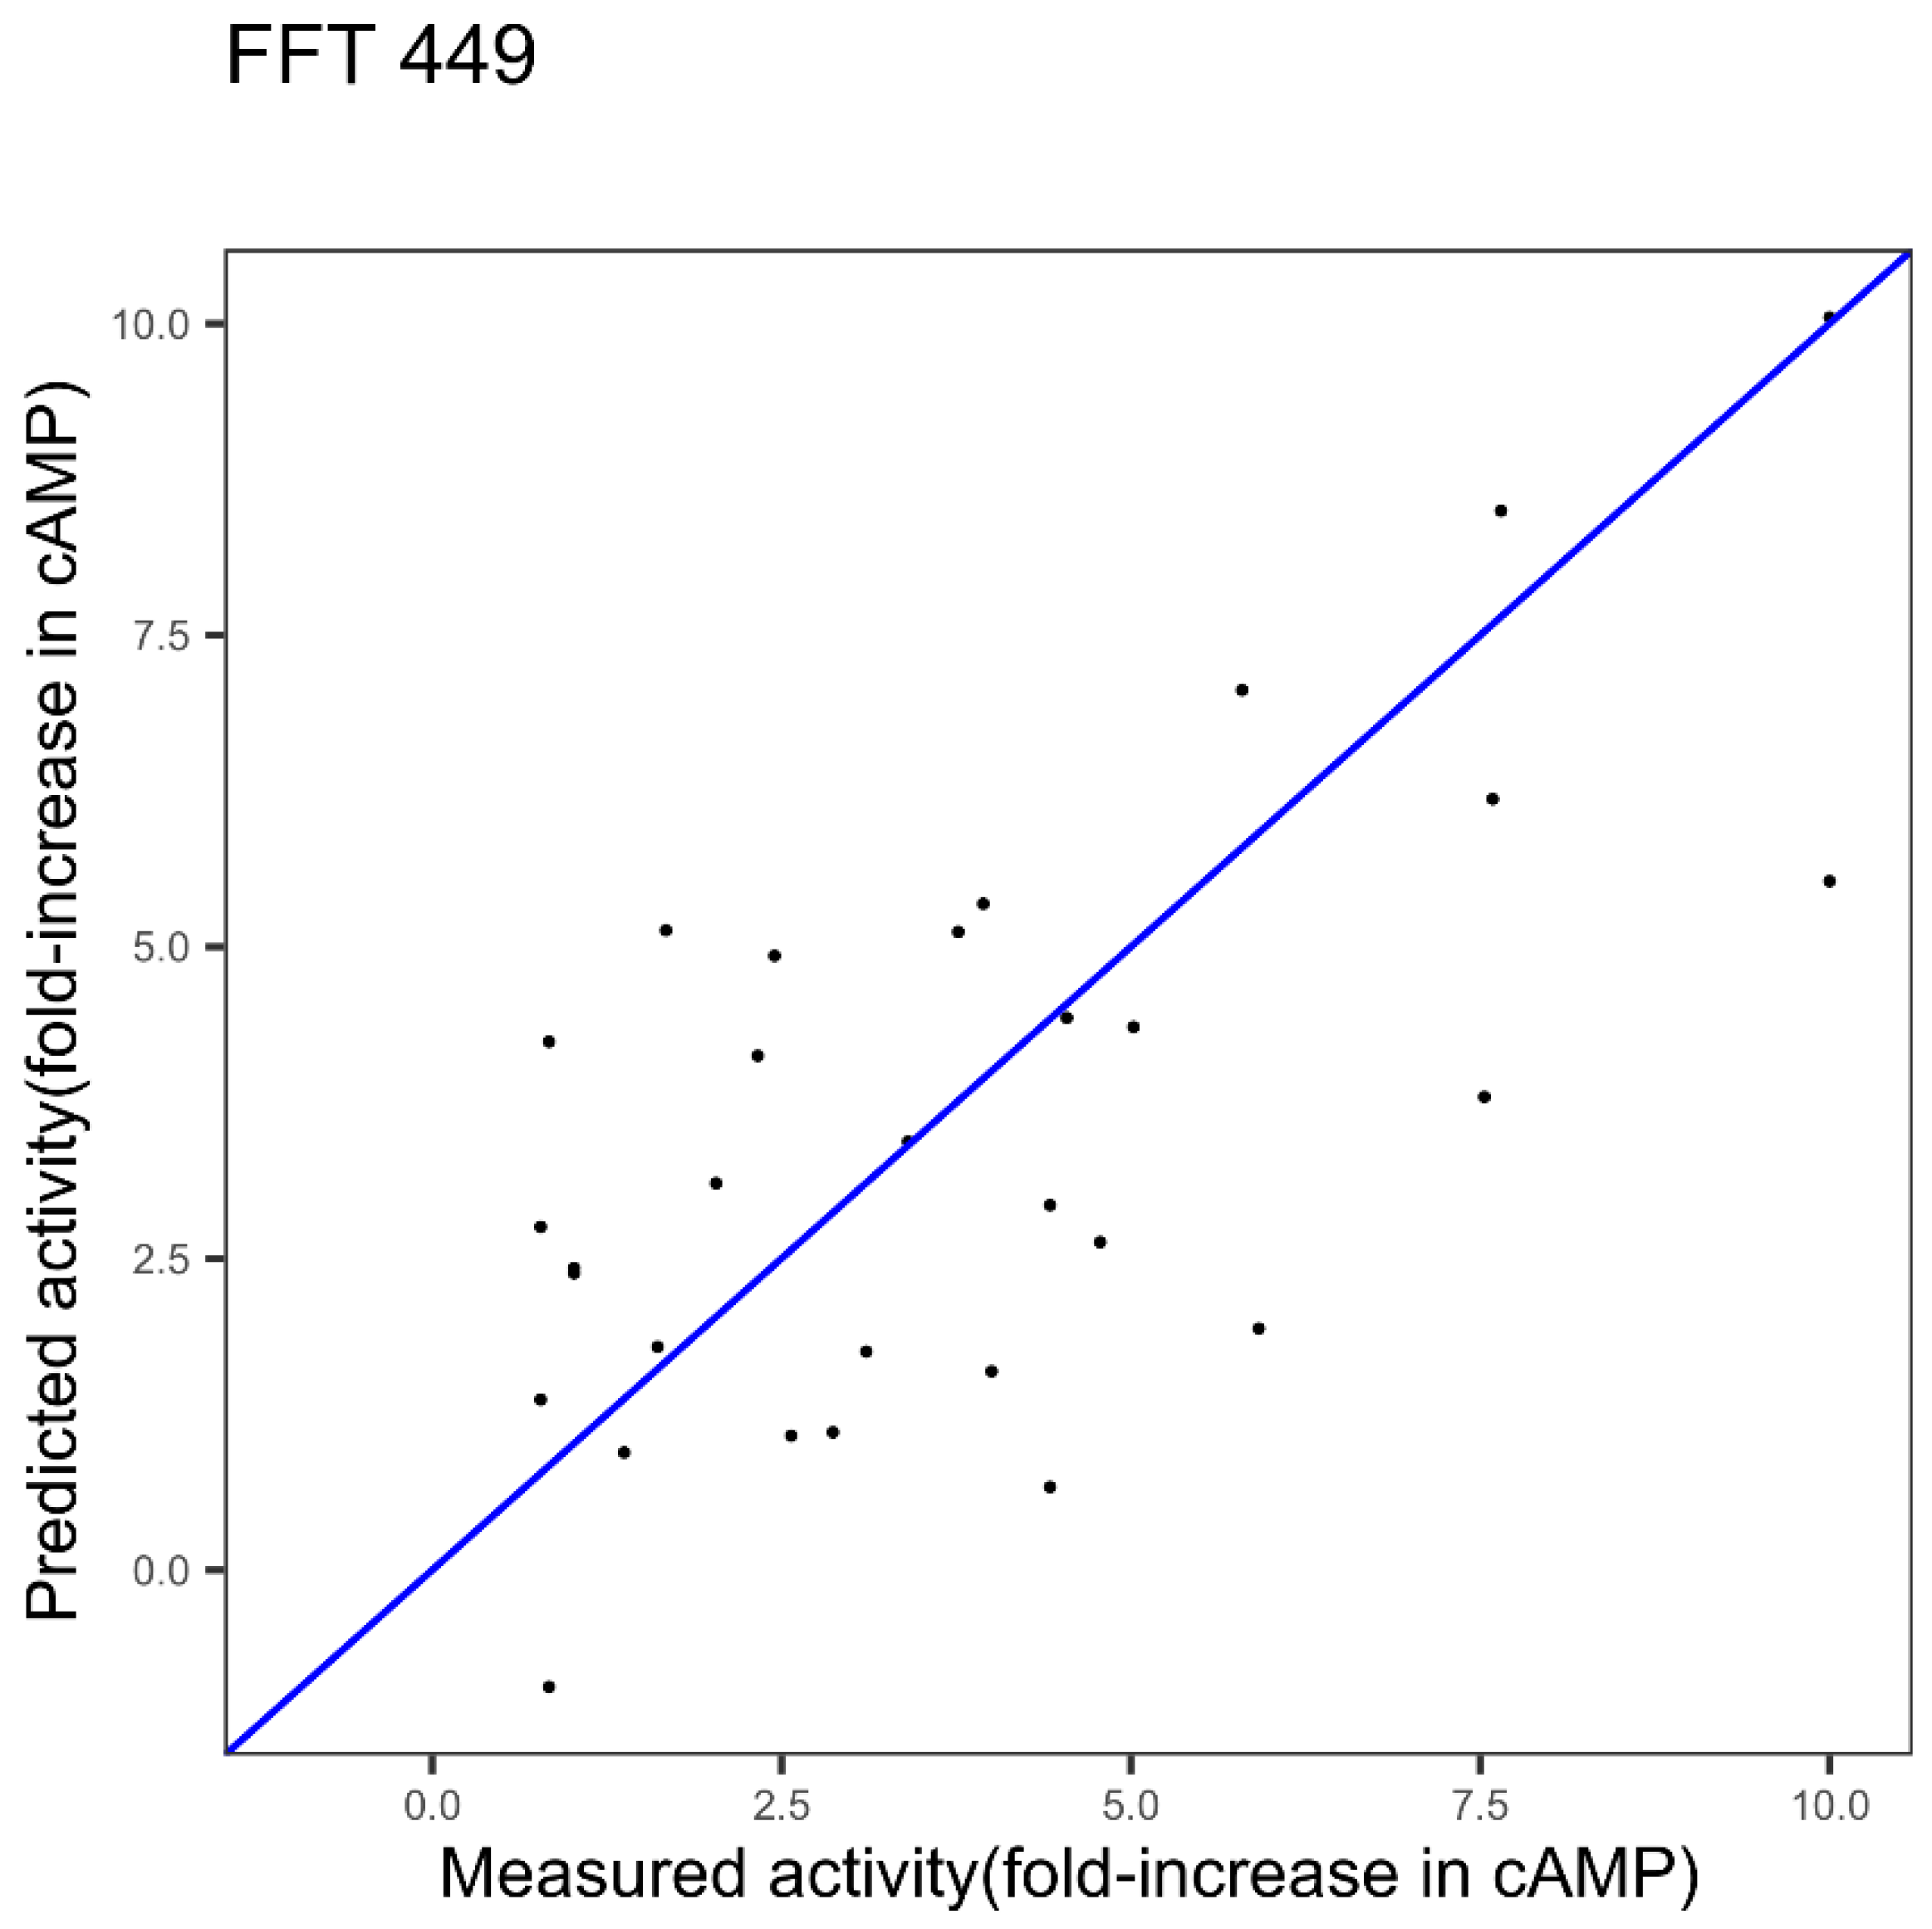
| GLP-2 1 index FFT Figure 3 | 2.11 | 0.42 | - |
| GLP-2 3 indices FFT Figure 6 | 1.75 | 0.55 | 0.0078 |
| GLP-2 3 indices best in Table 1 | 1.99 | 0.47 | 0.5309141 |
| Epoxide Hydrolase | |||
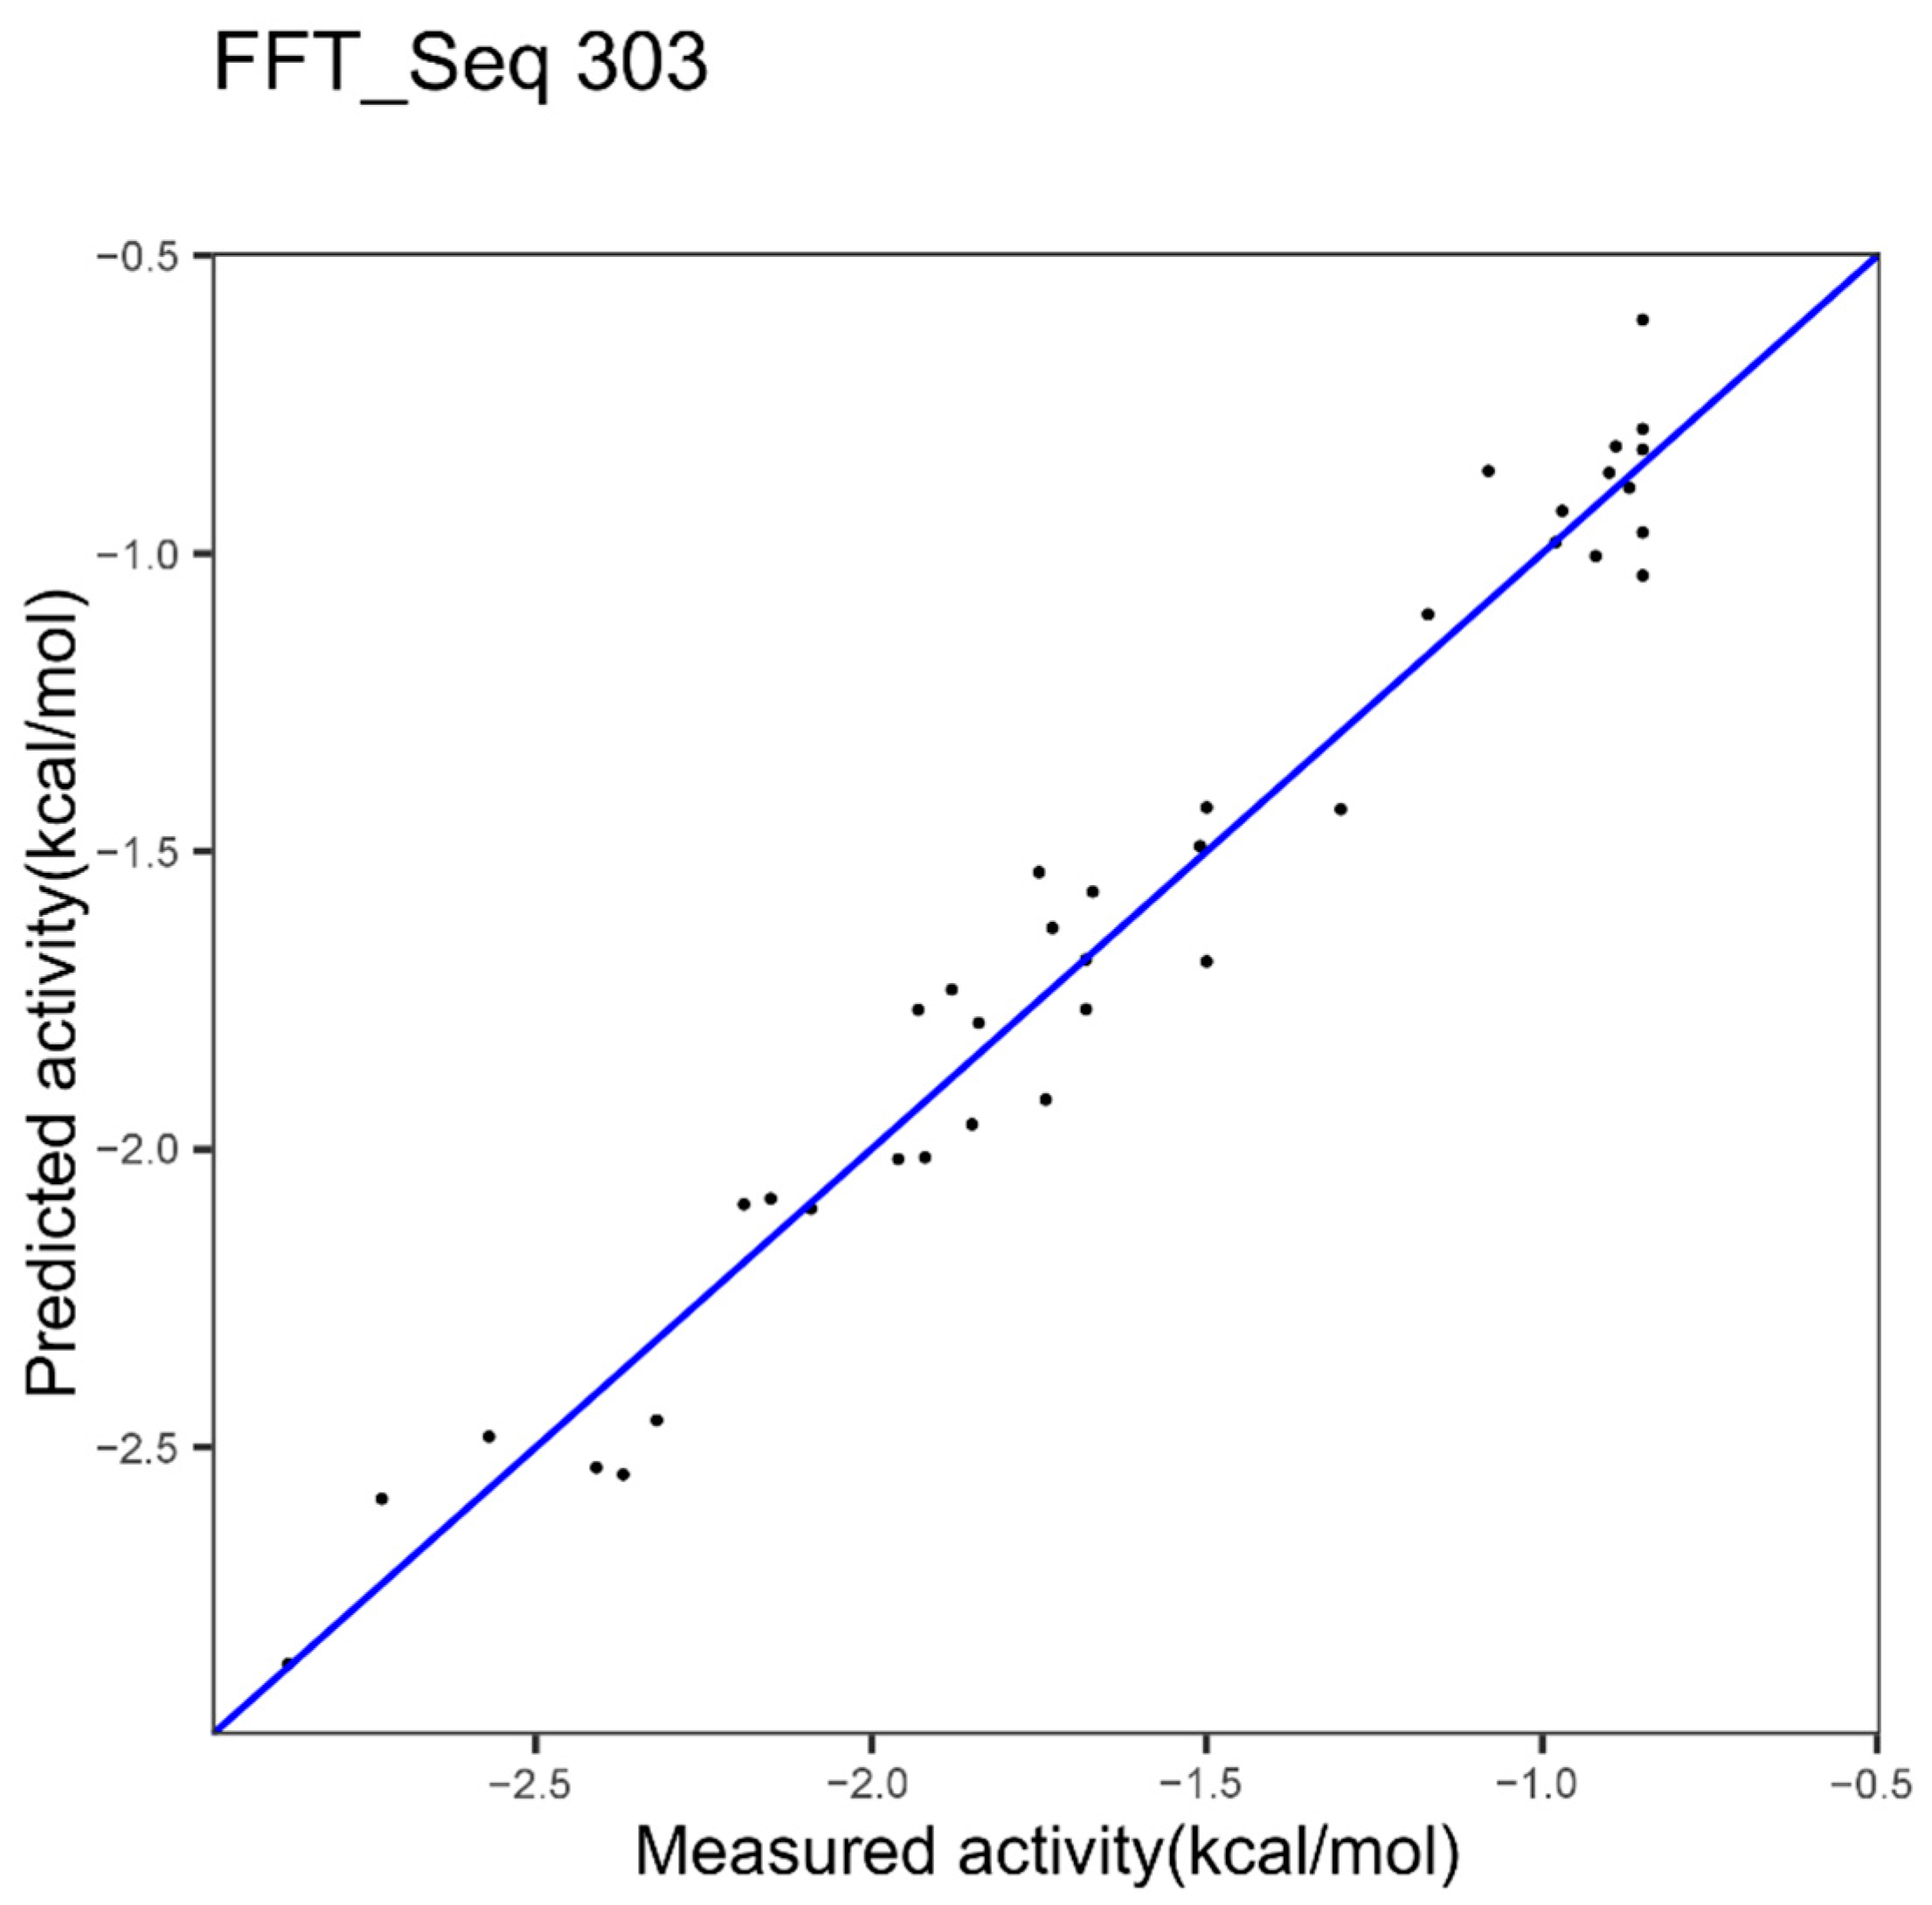
| Epoxide Hydrolase 1 index FFT 303 Figure 4 | 0.12 | 0.96 | - |
| Epoxide Hydrolase best in Table 2 | 0.1051 | 0.9685 | 0.4322954 |
| Epoxide Hydrolase 3 indices FFT Figure 7 | 0.094 | 0.9747 | 0.3435683 |
| TNF Alpha | |||
| TNF 1 index 203 Figure 8a | 0.32 | 0.85 | - |
| TNF 3 indices FFT Figure 8b | 0.28 | 0.88 | 0.1749 |
| Index Number | Index Name | Applied on Dataset |
|---|---|---|
| 39 | Normalized frequency of beta-sheet [30] | CYP450 |
| 226 | Normalized frequency of beta-sheet from CF [31] | CYP450 |
| 300 | Average relative fractional occurrence in A0(i) [32] | CYP450 |
| 343 | Information measure for extended [33] | CYP450 |
| 450 | Hydropathy scale based on self-information values in the two-state model (25% accessibility) [34] | CYP450 |
| 14 | Transfer free energy to surface [35] | Epoxide H. |
| 161 | Normalized frequency of beta-sheet, with weights [36] | Epoxide H. |
| 178 | Retention coefficient in HPLC, pH7.4 [37] | Epoxide H. |
| 232 | Normalized frequency of beta-sheet in all-beta class [31] | Epoxide H. |
| 254 | Relative frequency in beta-sheet [38] | Epoxide H. |
| 303 | Average relative fractional occurrence in EL(i) [32] | Epoxide H. |
| 508 | Linker propensity from helical (annotated by DSSP) dataset [39] | Epoxide H. |
| 516 | Hydrostatic pressure asymmetry index, PAI [40] | Epoxide H. |
| 44 | Normalized frequency of C-terminal non-helical region [30] | GLP-2 |
| 193 | AA composition of mt-proteins from animal [41] | GLP-2 |
| 233 | Normalized frequency of beta-sheet in alpha + beta class [39] | GLP-2 |
| 341 | Information measure for middle helix [33] | GLP-2 |
| 350 | Information measure for coil [33] | GLP-2 |
| 440 | Distribution of amino acid residues in the 18 non-redundant families of thermophilic proteins [42] | GLP-2 |
| 449 | Hydropathy scale based on self-information values in the two-state model (20% accessibility) [34] | GLP-2 |
| 203 | AA composition of CYT2 of single-spanning proteins [43] | TNF |
| 297 | Average reduced distance for C-alpha [44] | TNF |
| 486 | Electron-ion interaction potential values [17] | TNF |
| 504 | Linker propensity from three-linker dataset [39] | TNF |
| 523 | Apparent partition energies calculated from Chothia index [45] | TNF |
| Dataset | Calculation Time for Method A (min) | Calculation Time for Method B (min) |
|---|---|---|
| GLP-2 | 5 | 2 |
| Epoxide hydrolase | 60 | 9 |
| TNF alpha | 15 | 3 |
| Cytochrome P450 | 120 | ND |
© 2019 by the authors. Licensee MDPI, Basel, Switzerland. This article is an open access article distributed under the terms and conditions of the Creative Commons Attribution (CC BY) license (http://creativecommons.org/licenses/by/4.0/).
Share and Cite
Fontaine, N.T.; Cadet, X.F.; Vetrivel, I. Novel Descriptors and Digital Signal Processing- Based Method for Protein Sequence Activity Relationship Study. Int. J. Mol. Sci. 2019, 20, 5640. https://doi.org/10.3390/ijms20225640
Fontaine NT, Cadet XF, Vetrivel I. Novel Descriptors and Digital Signal Processing- Based Method for Protein Sequence Activity Relationship Study. International Journal of Molecular Sciences. 2019; 20(22):5640. https://doi.org/10.3390/ijms20225640
Chicago/Turabian StyleFontaine, Nicolas T., Xavier F. Cadet, and Iyanar Vetrivel. 2019. "Novel Descriptors and Digital Signal Processing- Based Method for Protein Sequence Activity Relationship Study" International Journal of Molecular Sciences 20, no. 22: 5640. https://doi.org/10.3390/ijms20225640
APA StyleFontaine, N. T., Cadet, X. F., & Vetrivel, I. (2019). Novel Descriptors and Digital Signal Processing- Based Method for Protein Sequence Activity Relationship Study. International Journal of Molecular Sciences, 20(22), 5640. https://doi.org/10.3390/ijms20225640


