Transgenerational Response to Nitrogen Deprivation in Arabidopsis thaliana


 , , and
Abstract
1. Introduction
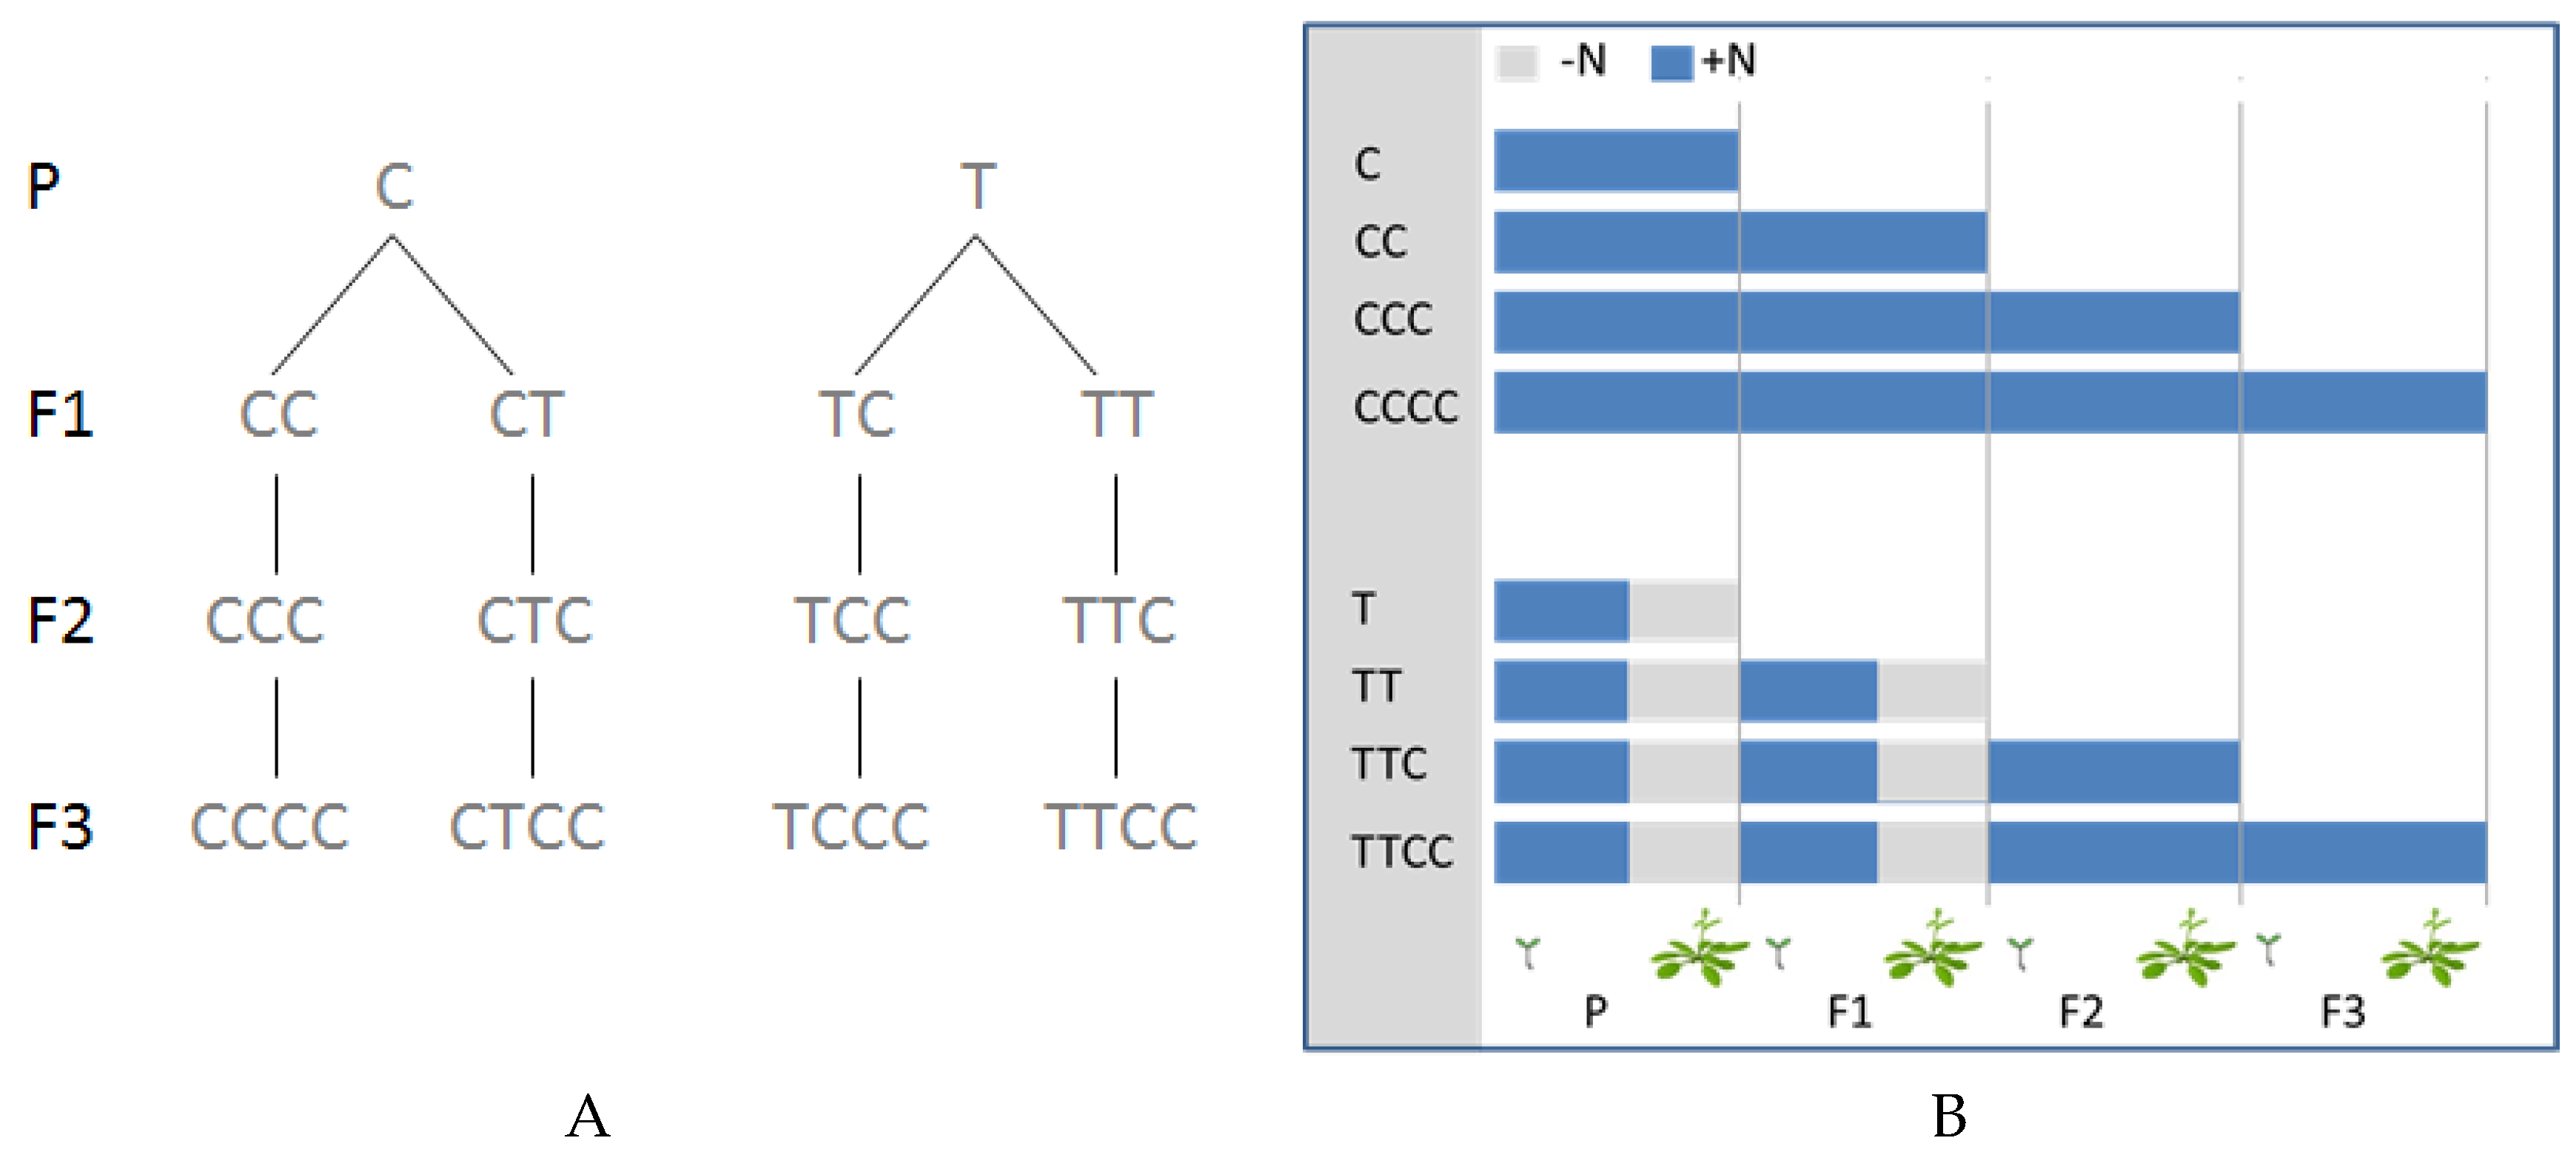
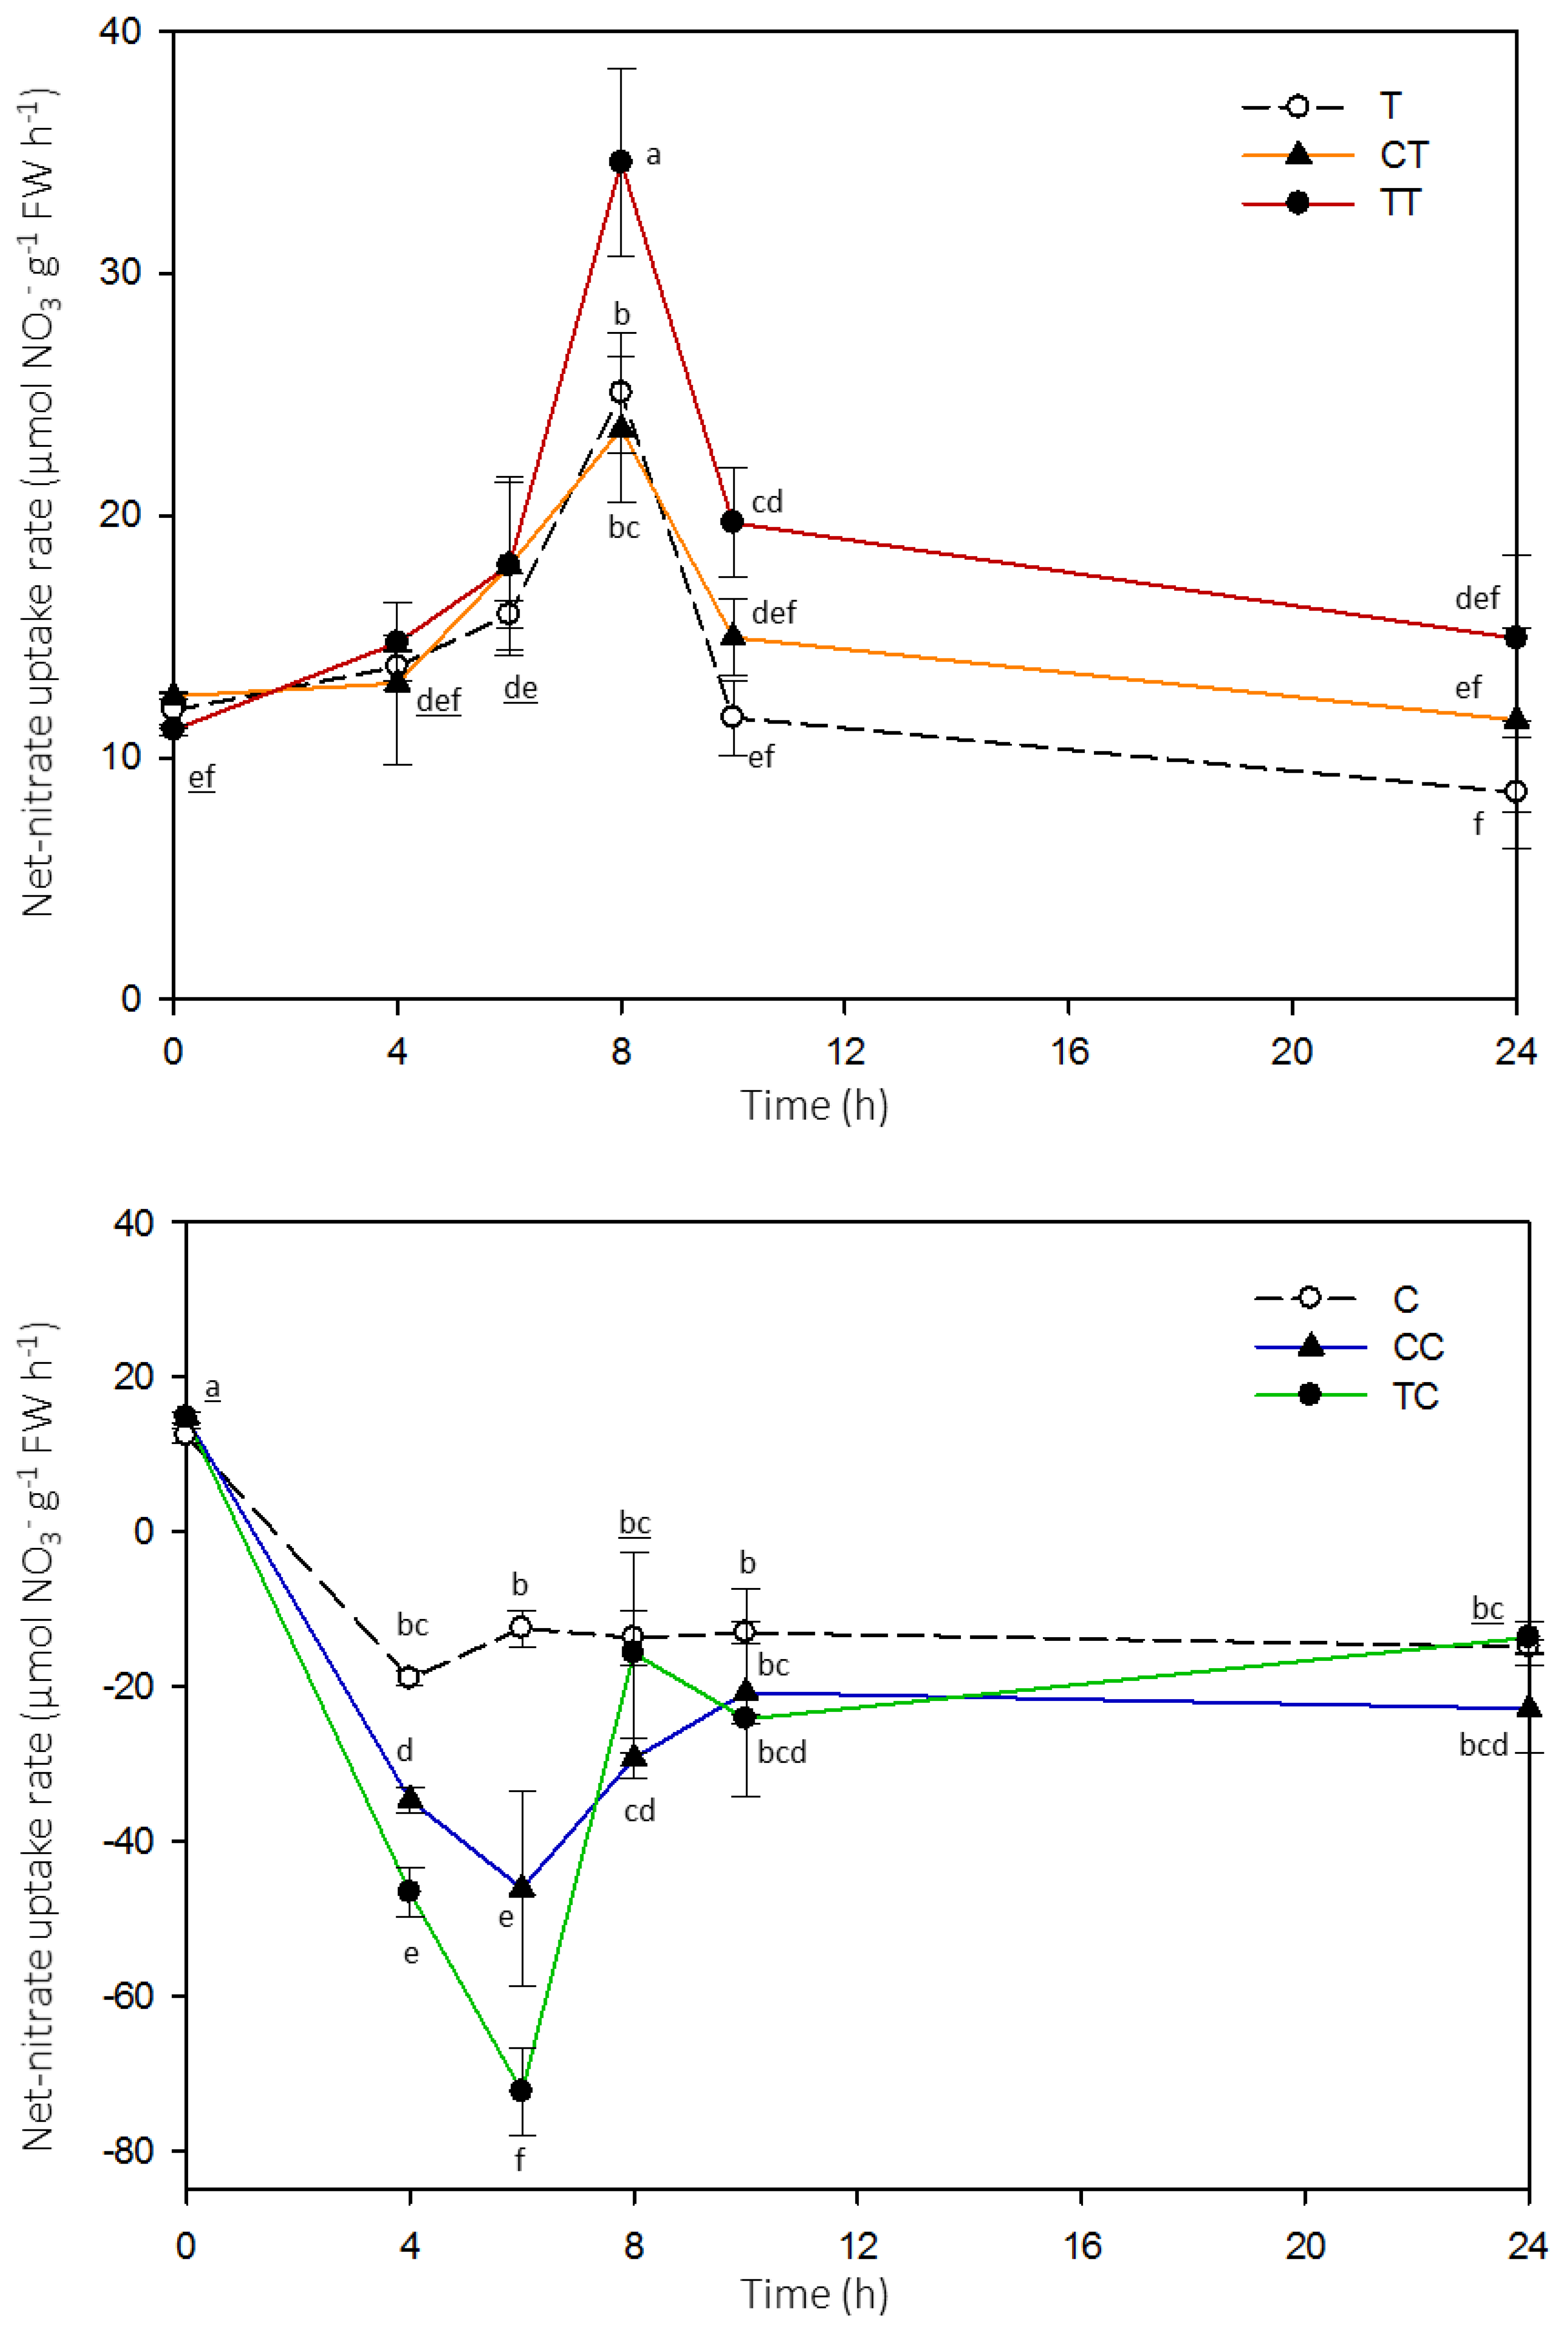
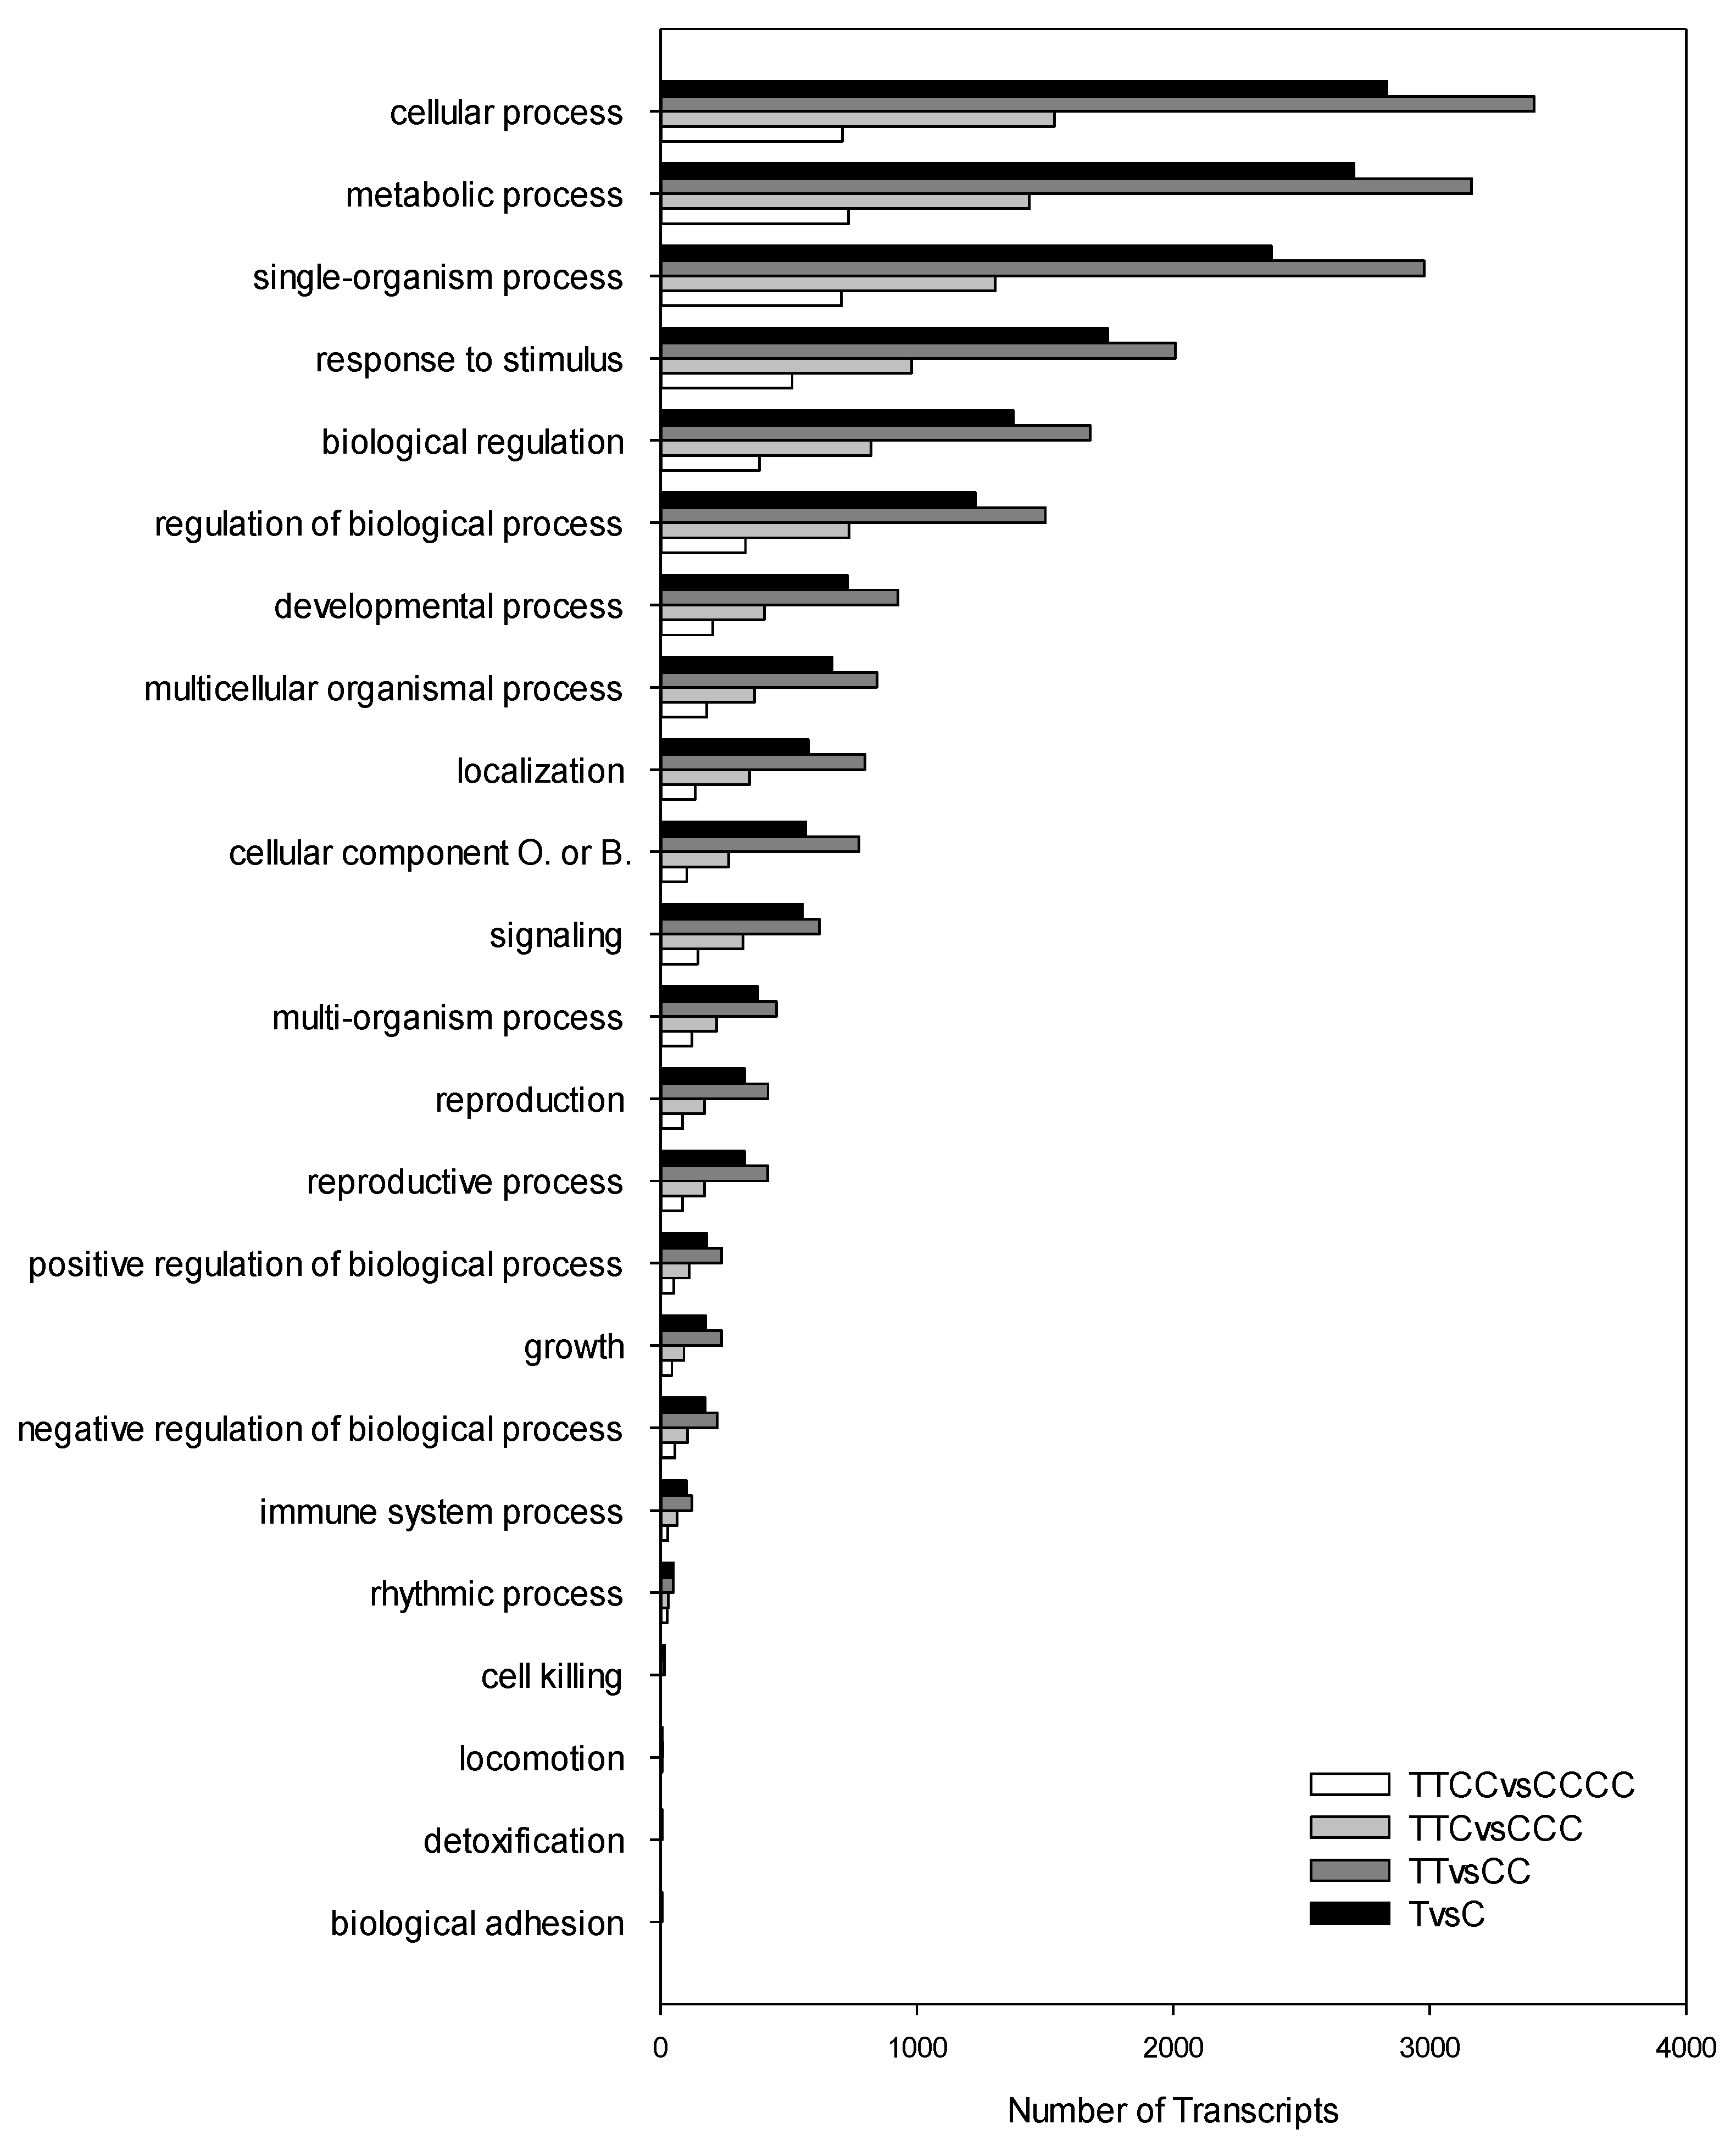
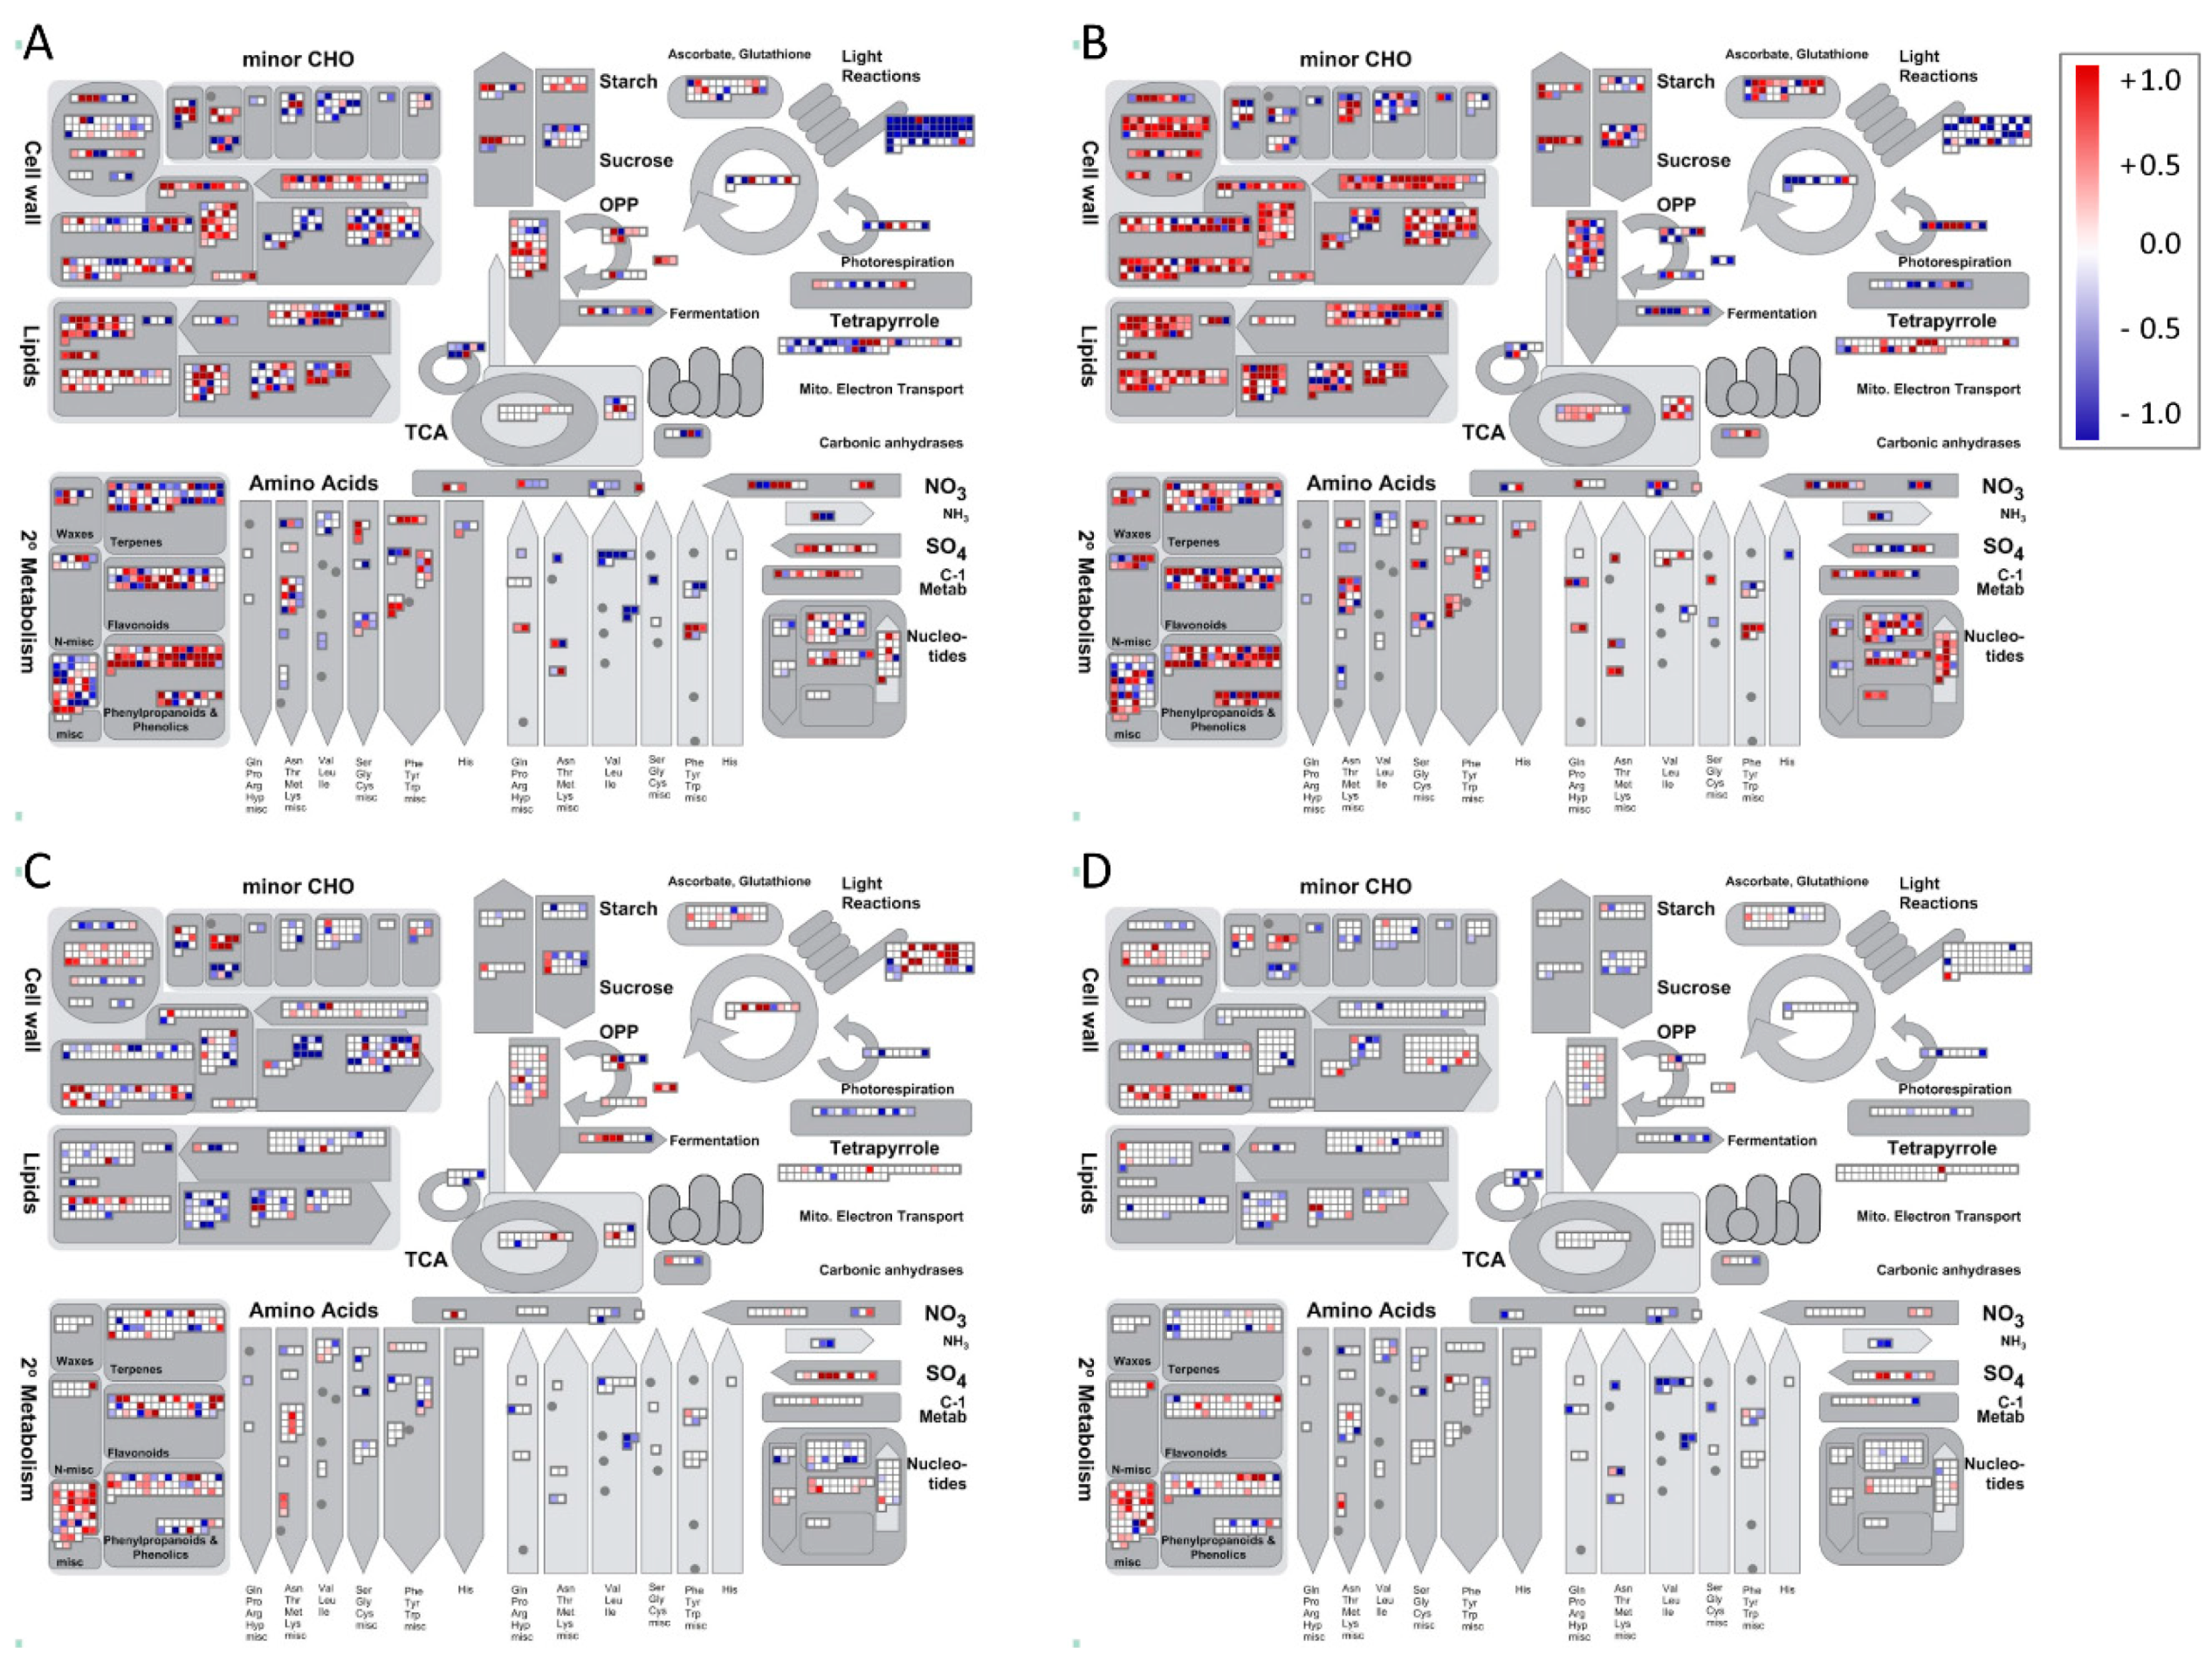
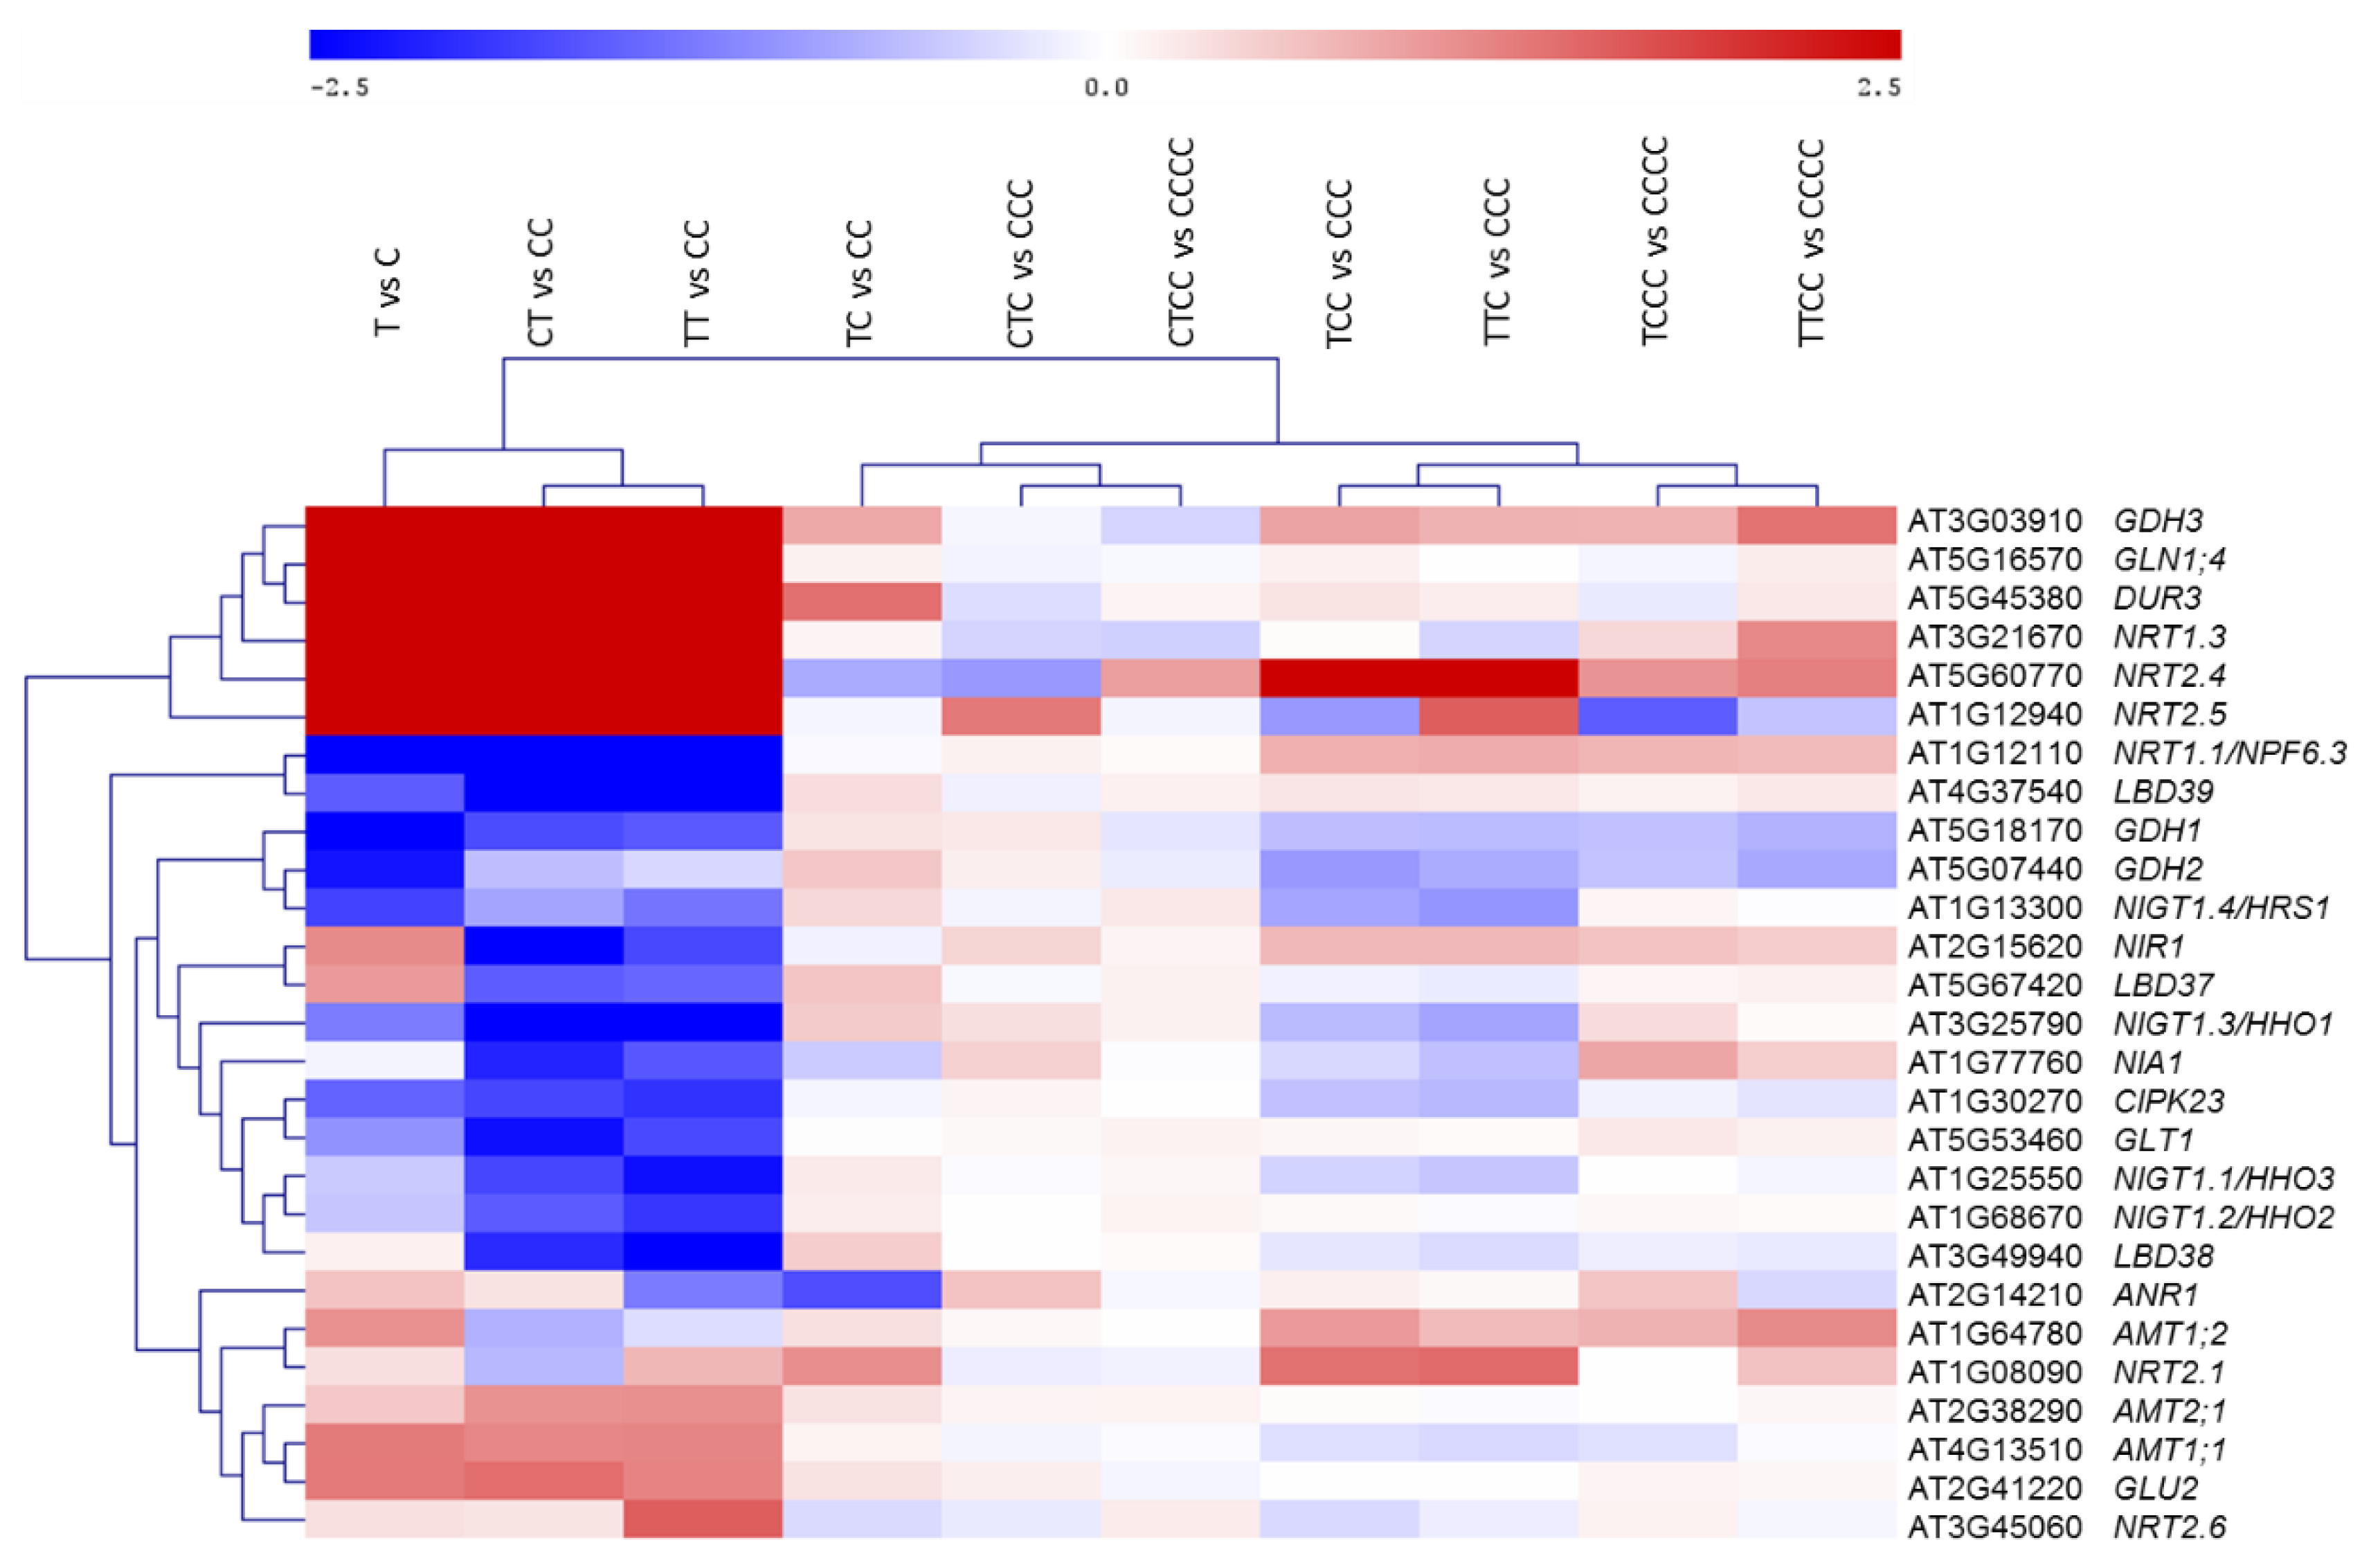
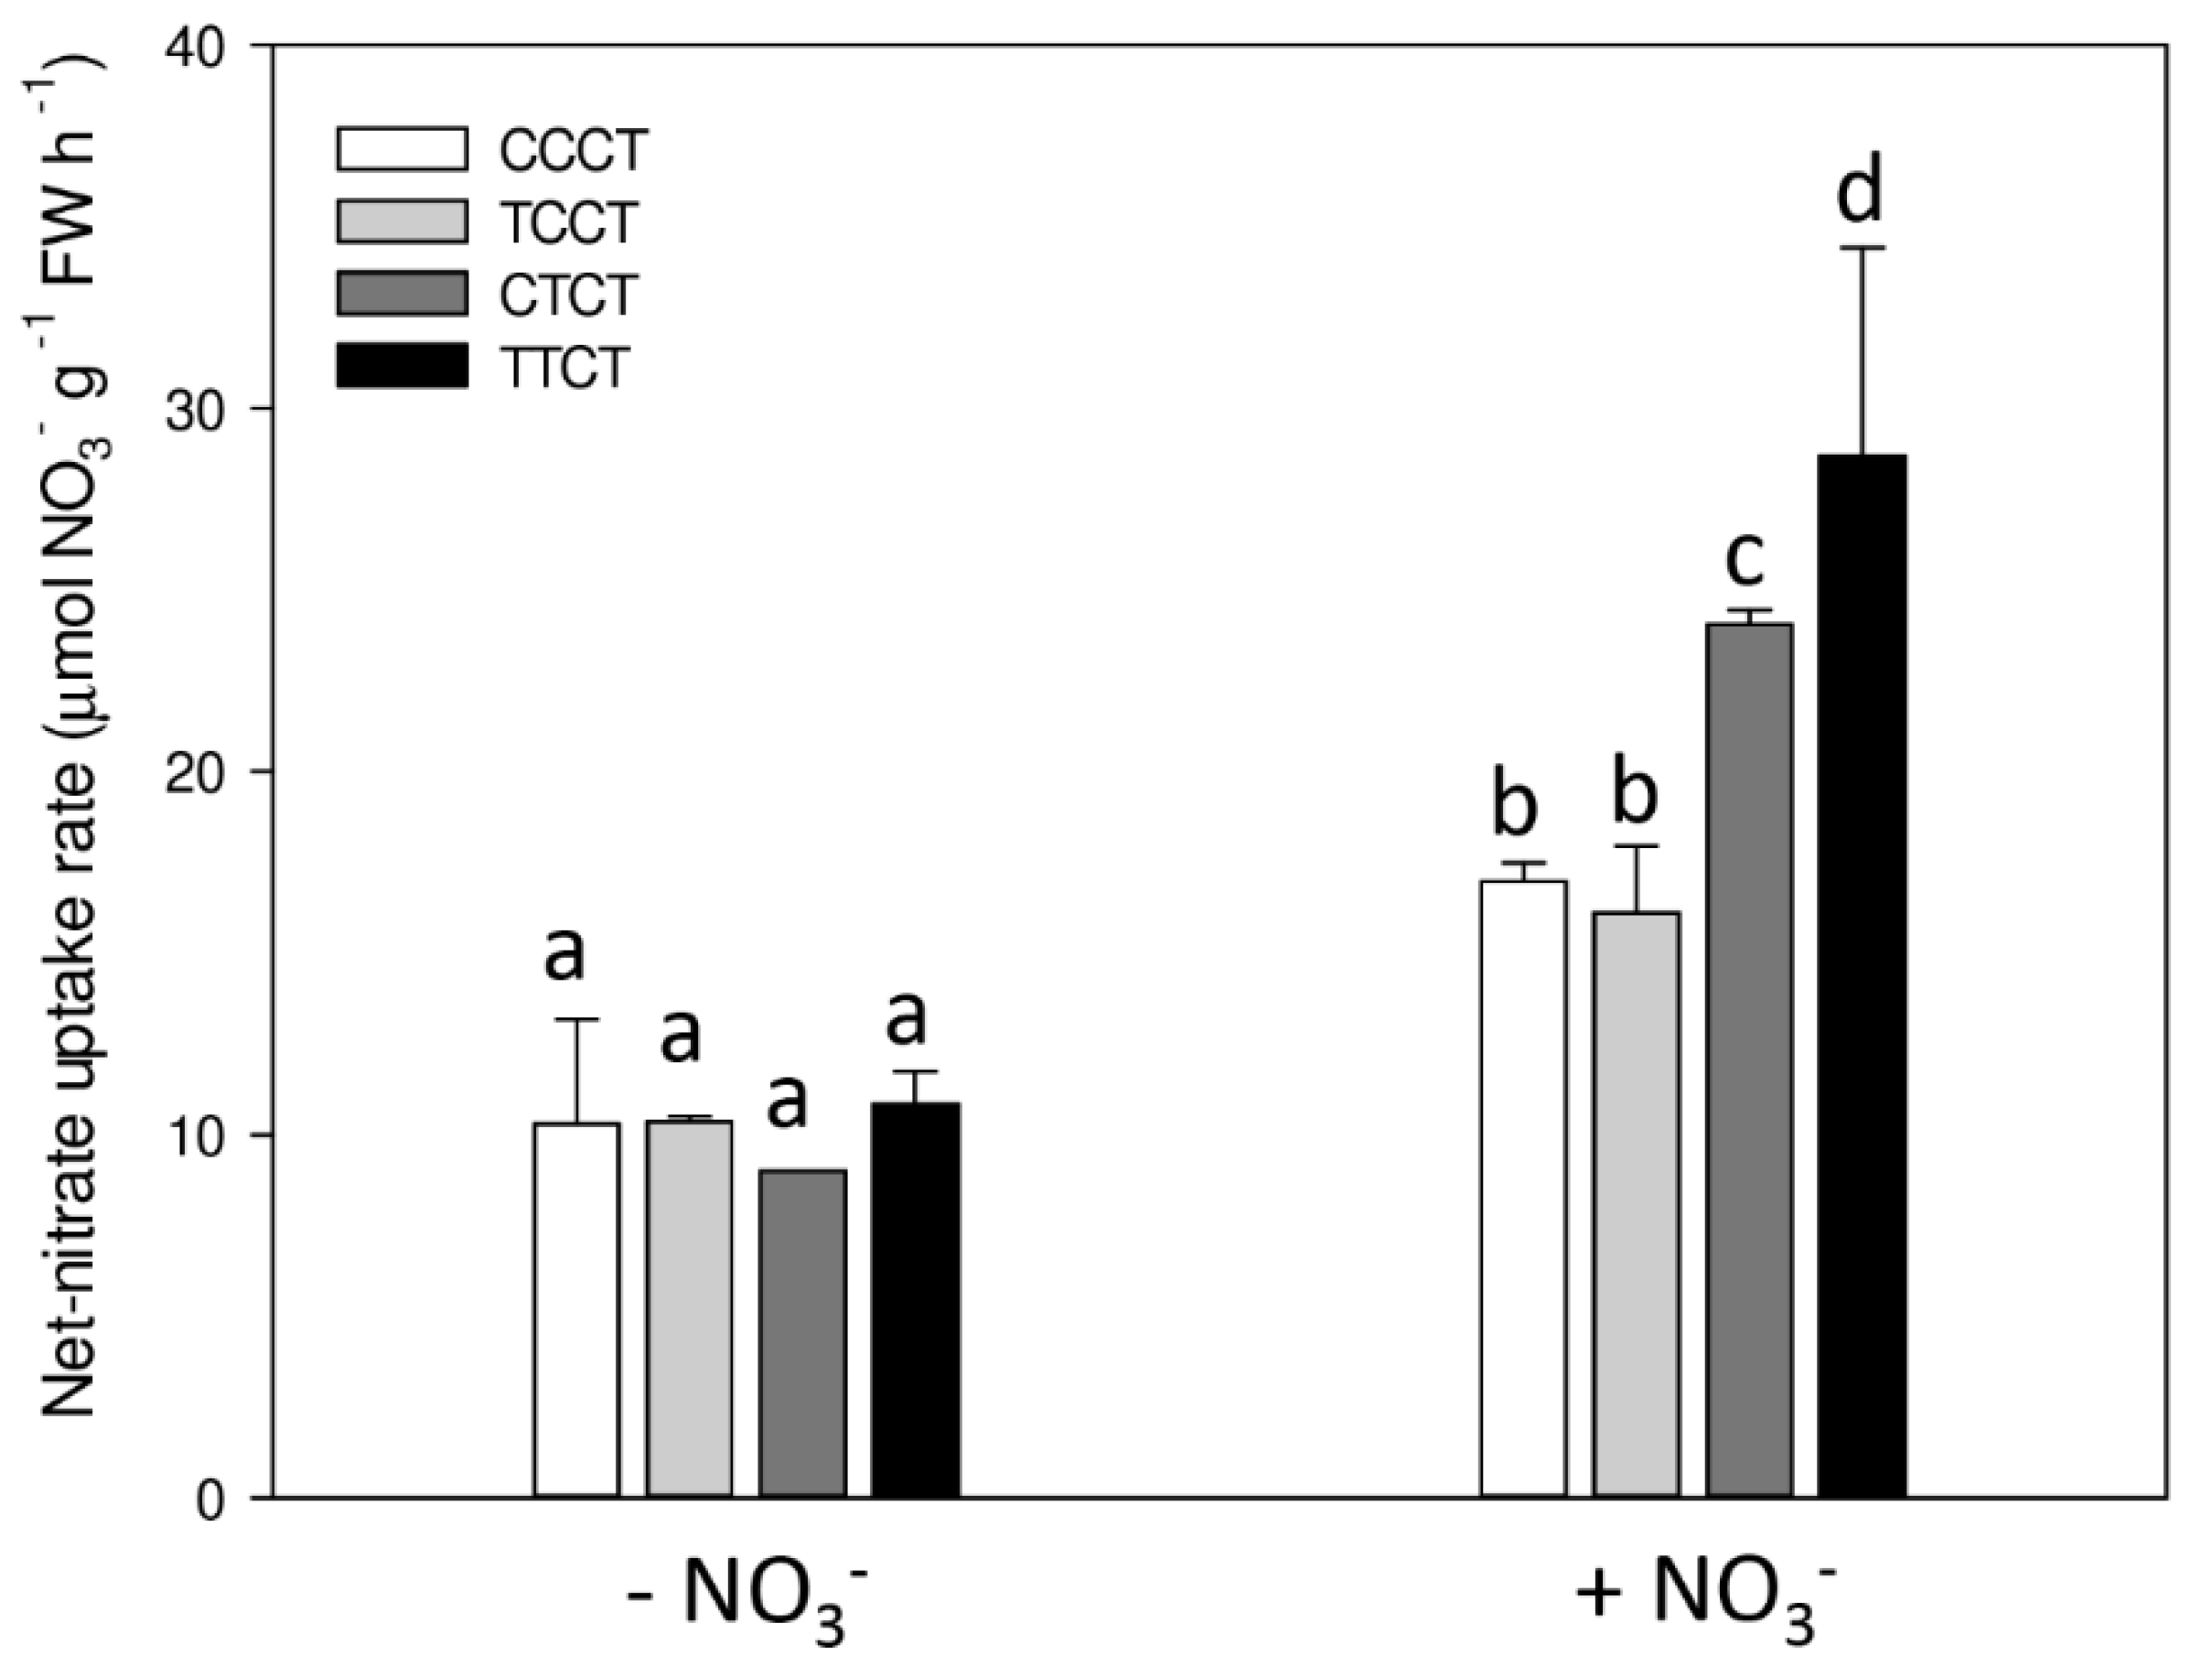
2. Results
3. Discussion
4. Materials and Methods
4.1. Plant Growth
4.2. Net High-Affinity Nitrate Uptake in Arabidopsis Plants
4.3. RNA Extraction
4.4. RNA Sequencing
4.5. Real-Time RT-PCR
4.6. Statistical Analyses
5. Conclusions
Supplementary Materials
Author Contributions
Funding
Conflicts of Interest
Abbreviations
| N | Nitrogen |
| NUE | Nitrogen Use Efficiency |
| T | Treatment (0 mM NH4NO3) |
| C | Control (0.5 mM NH4NO3) |
References
- Chapin, F.S. Integrated responses of plants to stress. BioScience 1991, 29, 36. [Google Scholar] [CrossRef]
- Schjoerring, J.K.; Cakmak, I.; White, P.J. Plant nutrition and soil fertility: Synergies for acquiring global green growth and sustainable development. Plant Soil 2019, 434, 1. [Google Scholar] [CrossRef]
- Medici, A.; Krouk, G. The Primary Nitrate Response: A multifaceted signalling pathway. J. Exp. Bot. 2014, 65, 5567–5576. [Google Scholar] [CrossRef] [PubMed]
- Krapp, A.; David, L.C.; Chardin, C.; Girin, T.; Marmagne, A.; Leprince, A.S.; Chaillou, S.; Ferrario-Méry, S.; Meyer, C.; Daniel-Vedele, F. Nitrate transport and signalling in Arabidopsis. J. Exp. Bot. 2014, 65, 789–798. [Google Scholar] [CrossRef]
- Harrison, A.F.; Helliwell, D.R. A bioassay for comparing phosphorus availability in soils. J. Appl. Ecol. 1979, 16, 497–505. [Google Scholar] [CrossRef]
- Castaings, L.; Marchive, C.; Meyer, C.; Krapp, A. Nitrogen signalling in Arabidopsis: How to obtain insights into a complex signalling network. J. Exp. Bot. 2011, 62, 1391–1397. [Google Scholar] [CrossRef]
- Eickhout, B.; Bouwman, A.V.; Van Zeijts, H. The role of nitrogen in world food production and environmental sustainability. Agr. Ecosyst. Environ. 2006, 116, 4–14. [Google Scholar] [CrossRef]
- Kinoshita, T.; Seki, M. Epigenetic memory for stress response and adaptation in plants. Plant Cell Physiol. 2014, 55, 1859–1863. [Google Scholar] [CrossRef]
- Conrath, U.; Beckers, G.J.; Flors, V.; García-Agustín, P.; Jakab, G.; Mauch, F.; Newman, M.A.; Pieterse, C.M.J.; Poinssot, B.; Pozo, M.J.; et al. Priming: Getting ready for battle. Mol. Plant-Microbe Interact. 2006, 19, 1062–1071. [Google Scholar] [CrossRef]
- Knight, H.; Brandt, S.; Knight, M.R. A history of stress alters drought calcium signalling pathways in Arabidopsis. Plant J. 1998, 16, 681–687. [Google Scholar] [CrossRef]
- Yamaguchi-Shinozaki, K.; Shinozaki, K. Organization of cis-acting regulatory elements in osmotic-and cold-stress-responsive promoters. Trends Plant Sci. 2005, 10, 88–94. [Google Scholar] [CrossRef] [PubMed]
- Campos, E.I.; Reinberg, D. Histones: Annotating chromatin. Annu. Rev. Genet. 2009, 43, 559–599. [Google Scholar] [CrossRef] [PubMed]
- Kim, J.M.; To, T.K.; Ishida, J.; Morosawa, T.; Kawashima, M.; Matsui, A.; Toyoda, T.; Kimura, H.; Shinozaki, K.; Seki, M. Alterations of lysine modifications on the histone H3 N-tail under drought stress conditions in Arabidopsis thaliana. Plant Cell Physiol. 2008, 49, 1580–1588. [Google Scholar] [CrossRef]
- Tricker, P.J.; Gibbings, J.G.; López, C.M.R.; Hadley, P.; Wilkinson, M.J. Low relative humidity triggers RNA-directed de novo DNA methylation and suppression of genes controlling stomatal development. J. Exp. Bot. 2012, 63, 3799–3813. [Google Scholar] [CrossRef] [PubMed]
- Ito, H.; Gaubert, H.; Bucher, E.; Mirouze, M.; Vaillant, I.; Paszkowski, J. An siRNA pathway prevents transgenerational retrotransposition in plants subjected to stress. Nature 2011, 472, 115–119. [Google Scholar] [CrossRef]
- McMillen, I.C.; MacLaughlin, S.M.; Muhlhausler, B.S.; Gentili, S.; Duffield, J.L.; Morrison, J.L. Developmental origins of adult health and disease: The role of periconceptional and foetal nutrition. Basic Clin. Pharmacol. 2008, 102, 82–89. [Google Scholar] [CrossRef]
- Vanhees, K.; van Schooten, F.J.; van Doorn, S.B.V.W.; van Helden, S.; Munnia, A.; Peluso, M.; Briedé, J.J.; Haenen, G.R.M.M.; Godschalk, R.W. Intrauterine exposure to flavonoids modifies antioxidant status at adulthood and decreases oxidative stress-induced DNA damage. Free Radic. Biol. Med. 2013, 57, 154–161. [Google Scholar] [CrossRef]
- Mehedint, M.G.; Niculescu, M.D.; Craciunescu, C.N.; Zeisel, S.H. Choline deficiency alters global histone methylation and epigenetic marking at the Re1 site of the calbindin 1 gene. FASEB J. 2010, 24, 184–195. [Google Scholar] [CrossRef]
- Niculescu, M.D. Nutritional epigenetics. Ilar J. 2012, 53, 270–278. [Google Scholar] [CrossRef]
- Wibowo, A.; Becker, C.; Marconi, G.; Durr, J.; Price, J.; Hagmann, J.; Papareddy, R.; Putra, H.; Kageyama, J.; Becker, J.; et al. Hyperosmotic stress memory in Arabidopsis is mediated by distinct epigenetically labile sites in the genome and is restricted in the male germline by DNA glycosylase activity. eLife 2016, 5, e13546. [Google Scholar] [CrossRef]
- Ton, J.; D’Alessandro, M.; Jourdie, V.; Jakab, G.; Karlen, D.; Held, M.; Mauch-Mani, B.; Turlings, T.C. Priming by airborne signals boosts direct and indirect resistance in maize. Plant J. 2007, 49, 16–26. [Google Scholar] [CrossRef]
- Jakab, G.; Ton, J.; Flors, V.; Zimmerli, L.; Métraux, J.P.; Mauch-Mani, B. Enhancing Arabidopsis salt and drought stress tolerance by chemical priming for its abscisic acid responses. Plant Physiol. 2005, 139, 267–274. [Google Scholar] [CrossRef]
- Heil, M.; Bueno, J.C.S. Within-plant signaling by volatiles leads to induction and priming of an indirect plant defense in nature. Proc. Natl. Acad. Sci. USA 2007, 104, 5467–5472. [Google Scholar] [CrossRef]
- Ding, Y.; Fromm, M.; Avramova, Z. Multiple exposures to drought ‘train’ transcriptional responses in Arabidopsis. Nat. Commun. 2012, 3, 740. [Google Scholar] [CrossRef]
- Bruce, T.J.; Matthes, M.C.; Napier, J.A.; Pickett, J.A. Stressful “memories” of plants: Evidence and possible mechanisms. Plant Sci. 2007, 173, 603–608. [Google Scholar] [CrossRef]
- Chinnusamy, V.; Zhu, J.K. Epigenetic regulation of stress responses in plants. Curr. Opin. Plant Biol. 2009, 12, 133–139. [Google Scholar] [CrossRef]
- Ikeda, Y. Plant imprinted genes identified by genome-wide approaches and their regulatory mechanisms. Plant Cell Physiol. 2012, 53, 809–816. [Google Scholar] [CrossRef][Green Version]
- Kim, J.M.; To, T.K.; Seki, M. An epigenetic integrator: New insights into genome regulation, environmental stress responses and developmental controls by histone deacetylase 6. Plant Cell Physiol. 2012, 53, 794–800. [Google Scholar] [CrossRef]
- Kohler, C.; Wolff, P.; Spillane, C. Epigenetic mechanisms underlying genomic imprinting in plants. Annu. Rev. Plant Biol. 2012, 63, 331–352. [Google Scholar] [CrossRef]
- Saze, H.; Tsugane, K.; Kanno, T.; Nishimura, T. DNA methylation in plants: Relationship with small RNAs and histone modifications, and functions in transposon inactivation. Plant Cell Physiol. 2012, 53, 766–784. [Google Scholar] [CrossRef]
- Song, J.; Irwin, J.; Dean, C. Remembering the prolonged cold of winter. Curr. Biol. 2013, 23, R807–R811. [Google Scholar] [CrossRef]
- Remans, T.; Nacry, P.; Pervent, M.; Girin, T.; Tillard, P.; Lepetit, M.; Gojon, A. A central role for the nitrate transporter NRT2. 1 in the integrated morphological and physiological responses of the root system to nitrogen limitation in Arabidopsis. Plant Physiol. 2006, 140, 909–921. [Google Scholar] [CrossRef]
- Hachiya, T.; Sakakibara, H. Interactions between nitrate and ammonium in their uptake, allocation, assimilation, and signaling in plants. J. Exp. Bot. 2017, 68, 2501–2512. [Google Scholar] [CrossRef]
- Bouguyon, E.; Brun, F.; Meynard, D.; Kubeš, M.; Pervent, M.; Leran, S.; Lacombe, B.; Krouk, G.; Guiderdoni, E.; Zažímalová, E.; et al. Multiple mechanisms of nitrate sensing by Arabidopsis nitrate transceptor NRT1.1. Nat. Plants 2015, 1, 15015. [Google Scholar] [CrossRef]
- Wang, R.; Okamoto, M.; Xing, X.; Crawford, N.M. Microarray analysis of the nitrate response in Arabidopsis roots and shoots reveals over 1000 rapidly responding genes and new linkages to glucose, trehalose-6-phosphate, iron, and sulfate metabolism. Plant Physiol. 2003, 132, 556–567. [Google Scholar] [CrossRef]
- Zanin, L.; Zamboni, A.; Monte, R.; Tomasi, N.; Varanini, Z.; Cesco, S.; Pinton, R. Transcriptomic analysis highlights reciprocal interactions of urea and nitrate for nitrogen acquisition by maize roots. Plant Cell Physiol. 2015, 56, 532–548. [Google Scholar] [CrossRef]
- Ho, C.H.; Lin, S.H.; Hu, H.C.; Tsay, Y.F. CHL1 functions as a nitrate sensor in plants. Cell 2009, 138, 1184–1194. [Google Scholar] [CrossRef]
- Zhao, M.; Ding, H.; Zhu, J.K.; Zhang, F.; Li, W.X. Involvement of miR169 in the nitrogen-starvation responses in Arabidopsis. New Phytol. 2011, 190, 906–915. [Google Scholar] [CrossRef]
- Medici, A.; Marshall-Colon, A.; Ronzier, E.; Szponarski, W.; Wang, R.; Gojon, A.; Crawford, N.M.; Ruffel, S.; Coruzzi, G.M.; Krouk, G. AtNIGT1/HRS1 integrates nitrate and phosphate signals at the Arabidopsis root tip. Nat. Commun. 2015, 6, 6274. [Google Scholar] [CrossRef]
- Kiba, T.; Inaba, J.; Kudo, T.; Ueda, N.; Konishi, M.; Mitsuda, N.; Takiguchi, Y.; Kondou, Y.; Yoshizumi, T.; Ohme-Takagi, M.; et al. Repression of nitrogen starvation responses by members of the Arabidopsis GARP-type transcription factor NIGT1/HRS1 subfamily. Plant Cell 2018, 30, 925–945. [Google Scholar] [CrossRef]
- Zhao, L.; Liu, F.; Crawford, N.M.; Wang, Y. Molecular regulation of nitrate responses in plants. Int. J. Mol. Sci. 2018, 19, 2039. [Google Scholar] [CrossRef]
- Zanin, L.; Tomasi, N.; Zamboni, A.; Varanini, Z.; Pinton, R. The urease inhibitor NBPT negatively affects DUR3-mediated uptake and assimilation of urea in maize roots. Front. Plant Sci. 2015, 6, 1007. [Google Scholar] [CrossRef]
- Cataldo, D.A.; Maroon, M.; Schrader, L.E.; Youngs, V.L. Rapid colorimetric determination of nitrate in plant tissue by nitration of salicylic acid 1. Commun. Soil Sci. Plan Anal. 1975, 6, 71–80. [Google Scholar] [CrossRef]
- Trapnell, C.; Roberts, A.; Goff, L.; Pertea, G.; Kim, D.; Kelley, D.R.; Pimentel, H.; Salzberg, S.L.; Rinn, J.L.; Pachter, L. Differential gene and transcript expression analysis of RNA-seq experiments with TopHat and Cufflinks. Nat. Protoc. 2012, 7, 562–578. [Google Scholar] [CrossRef]
- Li, H.; Handsaker, B.; Wysoker, A.; Fennell, T.; Ruan, J.; Homer, N.; Marth, G.; Abecasis, G.; Durbin, R. The sequence alignment/map format and SAM tools. Bioinformatics 2009, 25, 2078–2079. [Google Scholar] [CrossRef]
- Thimm, O.; Bläsing, O.; Gibon, Y.; Nagel, A.; Meyer, S.; Krüger, P.; Selbing, J.; Müller, L.A.; Rhee, S.Y.; Stitt, M. Mapman: A user-driven tool to display genomics data sets onto diagrams of metabolic pathways and other biological processes. Plant J. 2004, 37, 914–939. [Google Scholar] [CrossRef]
- Livak, K.J.; Schmittgen, T.D. Analysis of relative gene expression data using real-time quantitative PCR and the 2−ΔΔCt method. Methods 2001, 25, 402–408. [Google Scholar] [CrossRef]


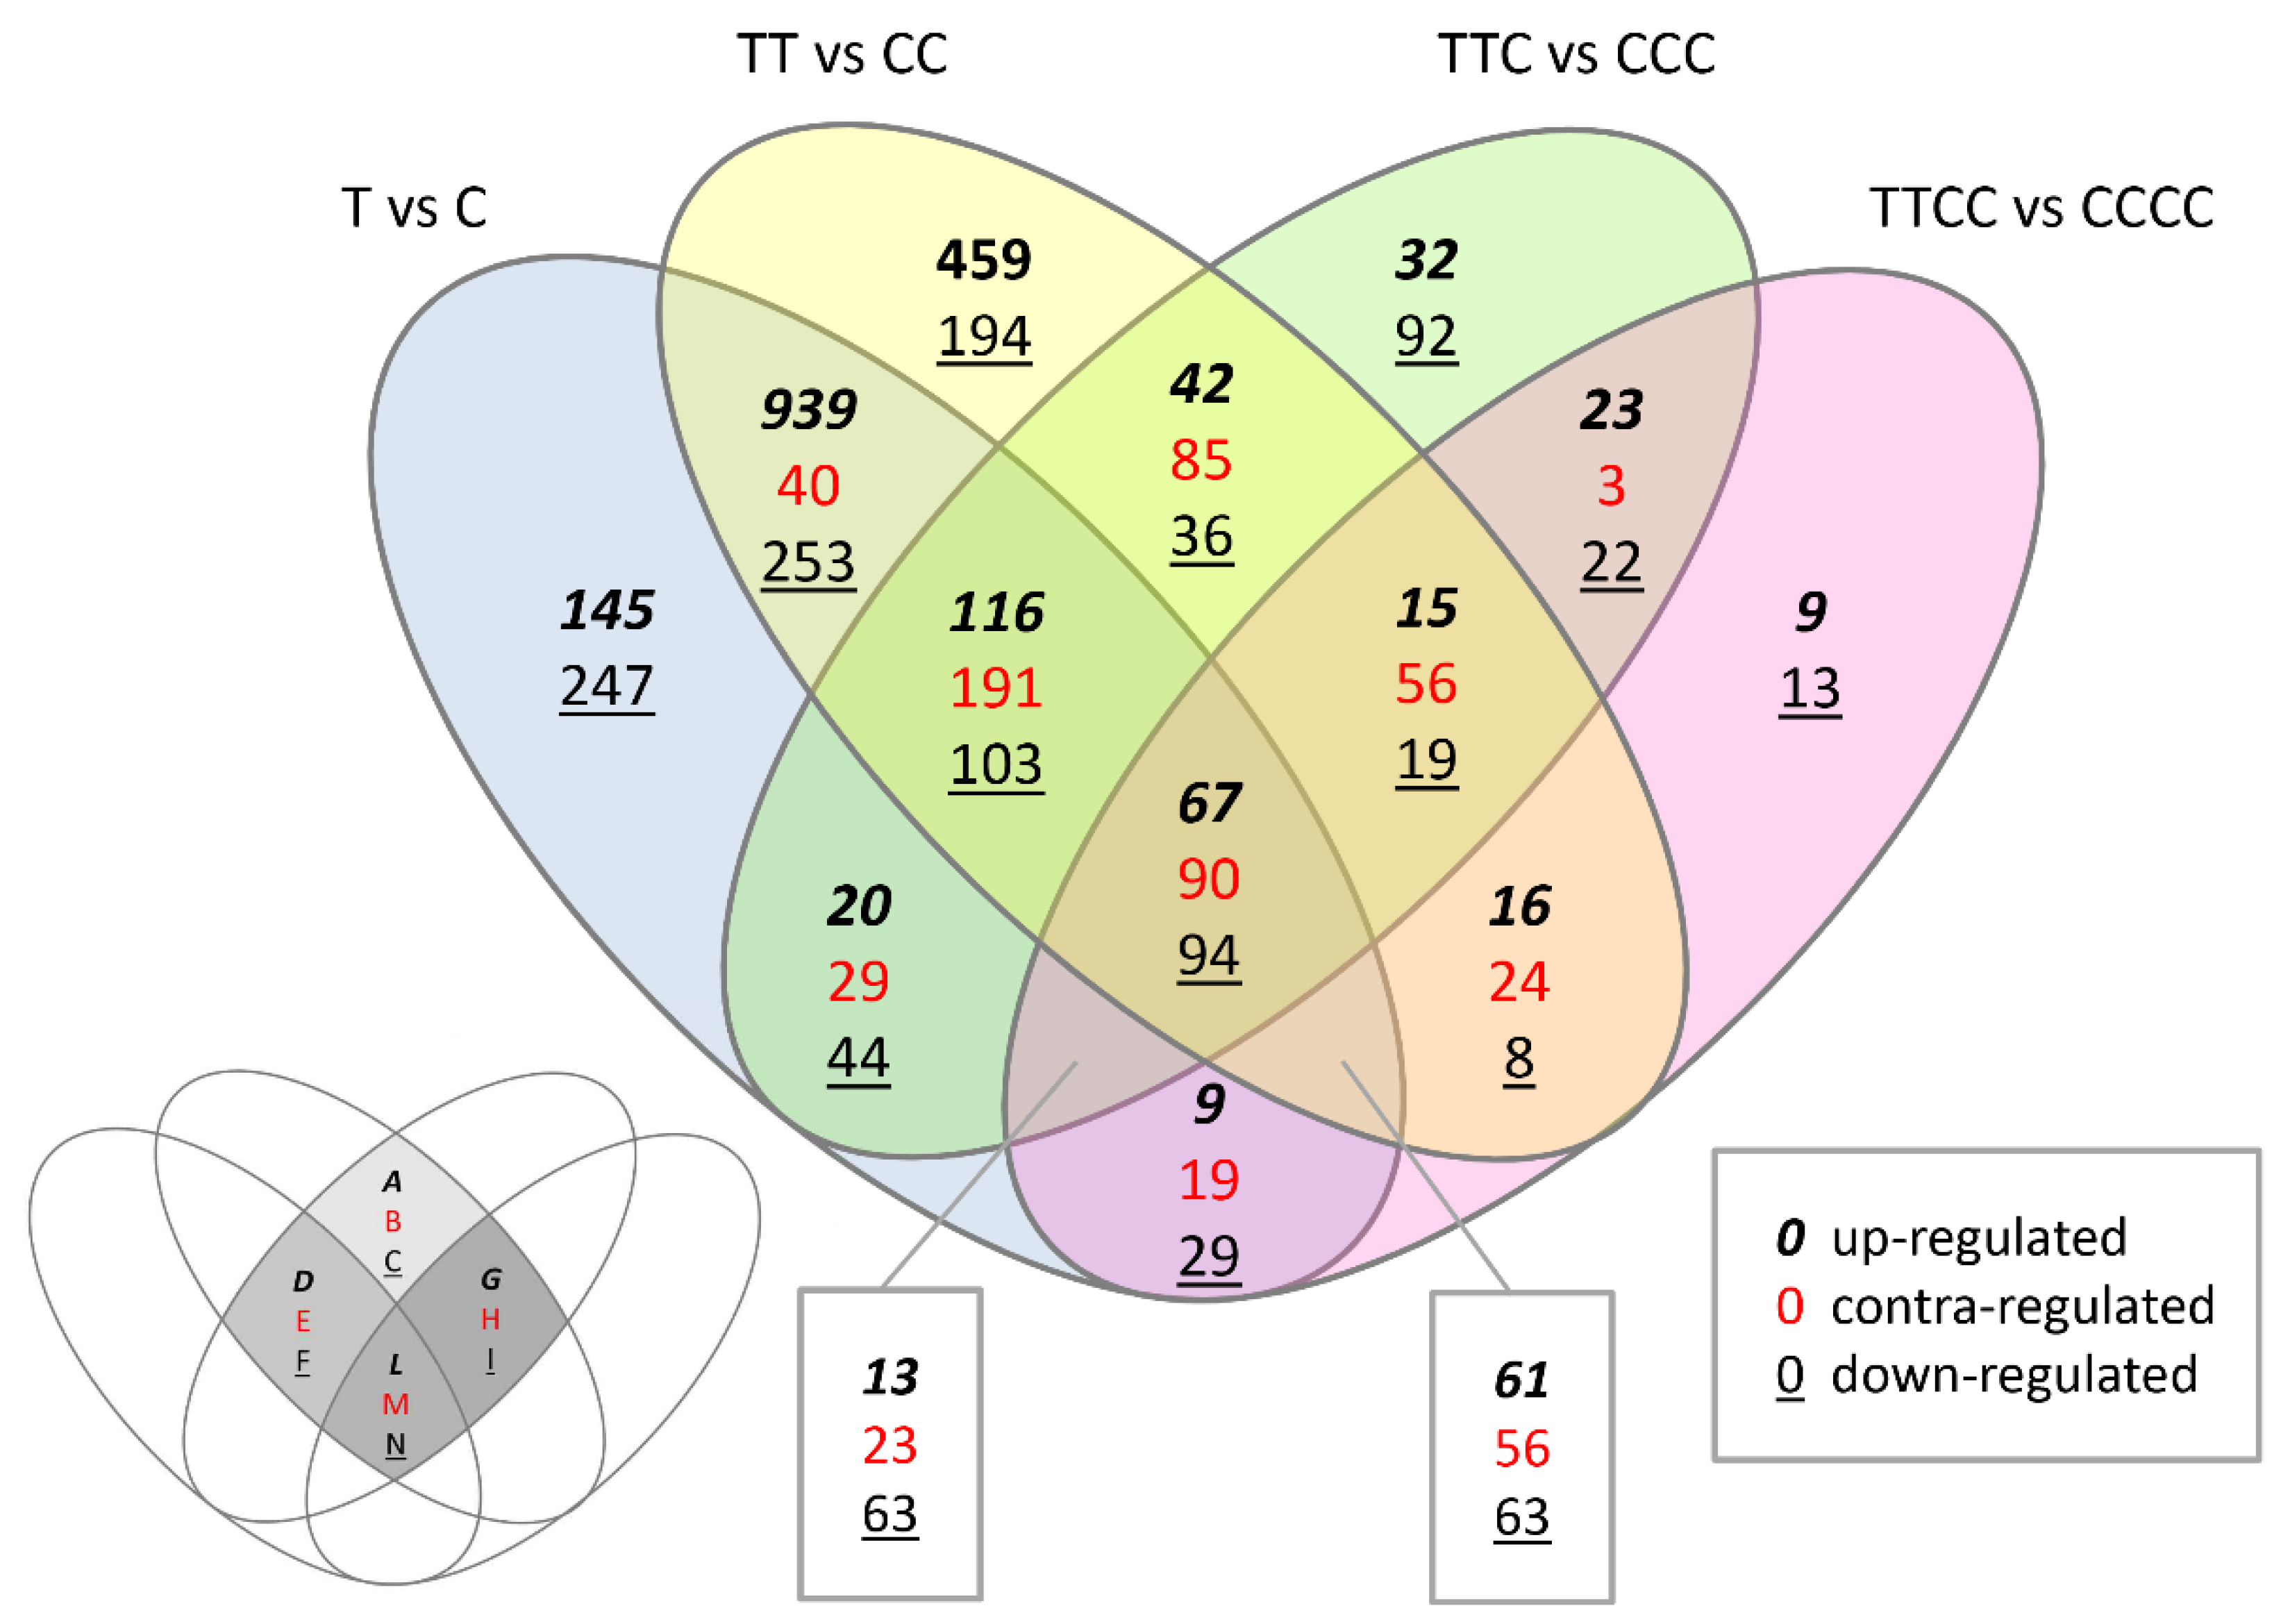
| Comparison | Up- | Down- | Total |
|---|---|---|---|
| T vs. C | 3355 | 2354 | 5709 |
| TT vs. CC | 4527 | 2488 | 7015 |
| TTC vs. CCC | 1050 | 2025 | 3075 |
| TTCC vs. CCCC | 662 | 781 | 1443 |
| Region | Regulation | T vs. C | TT vs. CC | TTC vs. CCC | TTCC vs. CCCC |
|---|---|---|---|---|---|
| Region A | up- |  | | ||
| (42 transcripts) | EXP12, TUB1, PDC3, CYP51G2, CKX5, ATGA2OX1, AtGolS3, UCC1, NHL12, PMSR2, PIL1, MGP, TSA1, AtRABH1e, ELIP1, MSRB7 | ||||
| Region B | contra- |  | | ||
| (85 transcripts) | FRO4, MIR163, LSU3, GAPA-1, LBD41, AtIDD4, DDB2, APR3, F3H | ||||
| | ||||
| AtCXE17, PRP3, CSLA14, AtPP2-B5, ANAC073, IRE, ERF13, SUS6, AtSIP2, CYP702A1, sks16, ATPUP19, ATATG18D, MMP, AGC2-1, WRKY38, WRKY59, CPK22, GLR2.6, HR1, RSH2, UTR1, KT1 | |||||
| Region C | down- | | | ||
| (36 transcripts) | YDK1, CYP706A2, CYP71B12, BGLU45, DIC2, BT5, DREB1A, ZAT10, MYB49, PUB24, SNC1 | ||||
| Region D | up- | | | | |
| (116 transcripts) | NF-YA2, TTL4, TOPP6, THAS, TGA3, SPS1, NRS/ER, NDB2, LAC1, IQD12, FUT5, FMO GS-OX4, FLS, FLA2, FLA15, DAR2, YP94B1, CYP86A4, CYP78A9, CYP705A12, CPuORF27, COR78, CER4,CAD4, B70, ST4B, OMT1, NADP-ME3, MYB53, MYB45, MYB40, MYB18, MES6, KATD, GSTU23, GST13, GLN1;1, EXPB1, ATEXP17, CSLC12, CSLB05, CSLA09, BAG1, ARFB1A, AGP41, AGP12, ACR6, AAP7 | ||||
| Region E | contra- | | | | |
| (191 transcripts) | ACO1, AN3, ALMT9, AtbZIP, MSRB5, NAS4, CLE5, CWLP, CYP705A17P, CYP71A16, CYP78A5, CYP81D1, CYP89A2, CYP96A12, TIP2;1, ELP, GA4, HMA2, LHCA3, LHCB2.1, LHCB5, PDC2, PKS2, PSAD-1, PSAL, RBCS1A, PIP2;3,ROXY2, SLAH2 | ||||
| | | |||
| CAT6, ACHT5, BGLU7 | |||||
| | | |||
| GA2OX6,POP1,WAG1,RFNR1,AHP1 | |||||
| | | |||
| AATP1, AHA7, AMT1;1, ANAC032, ANAC038, ANAC041, ANAC087, APK1B, ATH6, ATHRGP1, ATLP-3, MRP4, atnudt8, OPT7, AtPP2-A13, MYB67, BGAL8, COW1, FAR1, GAMMA-VPE, GH3.1, HHP2,LRX1, MGDC, MRH2, NSP3, PAL4, PMI1, RD21, scpl48, SUB, TBP1, UGT73B2, UGT73D1, WRKY58, XTR9 | |||||
| Region F | down- | | | | |
| (103 transcripts) | ZYP1b, XSP1,WRKY63, UGT76E2, TEM1, CBL4, SIGE, SFP1, SAG21, RPP13, RAP2.1, PR-1-LIKE, PLP1 PLA IVA, PLL3, PAL3, OBP4, NIMIN-3, MT1C, MOT1, MEE59, MEE23, KCS3, IP5PII, CYP71B2, CYP706A7, CPuORF29, CLE6, CIPK3, CIPK23, CH1, BOR1, ATPC1, ATGSL09, ATGLR2.8, ATERF6, ATCOL5 COL5, AtbZIP58, AtbZIP3, SULTR2;2, APT2, ANAC080, ACA4, NIGT1;1, NIGT1;3, NIGT1;4 | ||||
| Region | Regulation | T vs. C | TT vs. CC | TTC vs. CCC | TTCC vs. CCCC |
|---|---|---|---|---|---|
| Region G | up- | | | | |
| (15 transcripts) | AGP7, NRT2.1, CYP71A27, XTR6, ARR7, IDL5, 2OG-Fe(II) oxygenase, RCI2B | ||||
| Region H | contra- | | | | |
| (56 transcripts) | ABC tr, IPT3, TPPB, CPuORF26, AOP2, CYP71B26, APR2, LSU2, HSFA2, PIP1;4 | ||||
| | | |||
| BMY3, UBC17, bZIP, CYP702A2, STP1, AZF2, ATG8E, ERD5 | |||||
| | | |||
| NIA1, CDF, EF hand | |||||
| Region I | down- | | | | |
| (19 transcripts) | ZFP, MYB, MC9, TED6, CYP705A3, ERF104, WRKY28, WAKL4, HSPRO2 | ||||
| Region L | up- | | | | |
| (67 transcripts) | FLA16, 4CL5, JAZ4, GSTU20, UGT72E2, MYB305, YUCCA6, CYP702A5, MIR824a, TINY, ACR8, AtMS2, bHLH, ATSR1, CYP82F1, ATRL3, ZFP1, ATCNGC19, scpl28, ZFP5, XTR8, SHY2, UGT76D1, AtMYB74, CYP76C1, bZIP, MYB | ||||
| Region M | contra- | | | | |
| (90 transcripts) | CCA1, CDF3, EXS family transporter | ||||
| | | | ||
| IRT1, CAB1, GLB1, ETR2, SUS4 | |||||
| | | | ||
| SOT18, ATIREG1, SLAH3, CYP735A1, SLAH1, NIC3, AtRLP24, NRT1.1, HWS, AGP30, NAS1, AtGDU5, VSP2, FLA13, PHI-1, MYB34, OPT, MATE | |||||
| | | | ||
| SEN1, NAP0, BXL1, BGAL4, MIOX2, atnudt18 | |||||
| | | | ||
| MES16, peroxidases, xyloglucan transferase | |||||
| | | | ||
| NIR1, G6PD3, HSP81-1, ATSDI1, HSP70, PPCK1, ATRFNR2, ATTPPA, CIPK19, PLC4 | |||||
| | | | ||
| HO1, IQD22, LAC7 | |||||
| Region N | down- | | | | |
| (94 transcripts) | BGLU34, BARS1, BT1, BT2, UGE3, ATHB52, CAO, OXS3, AtbZIP1, MCCA, AGT1, MEE14, TPS9, TDT, GDH1, BGAL2, TPS10, WCRKC1, GDH2, ALDH3, NRAMP1, AtRLP9, AAE5, ATCTH, ASD1, EXL2, CP12-3, UGE1, ACL, CP5 | ||||
© 2019 by the authors. Licensee MDPI, Basel, Switzerland. This article is an open access article distributed under the terms and conditions of the Creative Commons Attribution (CC BY) license (http://creativecommons.org/licenses/by/4.0/).
Share and Cite
Massaro, M.; De Paoli, E.; Tomasi, N.; Morgante, M.; Pinton, R.; Zanin, L. Transgenerational Response to Nitrogen Deprivation in Arabidopsis thaliana. Int. J. Mol. Sci. 2019, 20, 5587. https://doi.org/10.3390/ijms20225587
Massaro M, De Paoli E, Tomasi N, Morgante M, Pinton R, Zanin L. Transgenerational Response to Nitrogen Deprivation in Arabidopsis thaliana. International Journal of Molecular Sciences. 2019; 20(22):5587. https://doi.org/10.3390/ijms20225587
Chicago/Turabian StyleMassaro, Monica, Emanuele De Paoli, Nicola Tomasi, Michele Morgante, Roberto Pinton, and Laura Zanin. 2019. "Transgenerational Response to Nitrogen Deprivation in Arabidopsis thaliana" International Journal of Molecular Sciences 20, no. 22: 5587. https://doi.org/10.3390/ijms20225587
APA StyleMassaro, M., De Paoli, E., Tomasi, N., Morgante, M., Pinton, R., & Zanin, L. (2019). Transgenerational Response to Nitrogen Deprivation in Arabidopsis thaliana. International Journal of Molecular Sciences, 20(22), 5587. https://doi.org/10.3390/ijms20225587