Abstract
TLC (TRAM/LAG/CRN8) proteins play important roles in ceramide metabolism and mycotoxin resistance. Herein a comparative genomics analysis of TLCs was performed in 31 plant and 3 species from other kingdoms, with an emphasis mainly on maize. TLCs were conserved across kingdoms and expanded in angiosperms, largely due to whole-genome/segmental duplication (WGD/SD) under purifying selection. Phylogeny reconstruction by maximum-likelihood method uncovered five TLC clades, subsequently named as TRAM/LAG, CLN8, PS-TLC, TM136 and TLCD clades. Each clade of TLCs shared specific transmembrane regions and motif composition. Divisions of conserved motifs to subunits may have occurred in TM136-type TLCs. Focusing on maize, five WGD and two DNA-mediated transposed duplication (TD) pairs were discovered, accounting for 61.11% ZmTLCs. Combined with further expression analysis, significant divergence was found in expression patterns between most maize WGD pairs, indicating subfunctionalization or/and neofunctionalization. Moreover, ZmTLC5, a deduced parental copy in a TD pair, was highly induced under FB1 and fungus pathogen injection and exhibited potential capacity to respond to environmental stimuli. Additionally, population genetics analysis showed that ZmTLC10 in the CLN8-clade may have experienced significant positive selection and differentiated between wild and inbred maize populations. Overall, our results help to decipher the evolutionary history of TLCs in maize and plants, facilitating further functional analysis of them.
1. Introduction
Plants are sessile and vulnerable to various biotic stresses, including bacteria, fungi, oomycetes, and nematodes [1]. In the long-term evolution process, plants have developed multiple immune defense routes to against pathogen invasion [2]. Disease resistance (R) genes have an irreplaceable role in the immune defense system, responding to pathogen virulence effectors and conforming to “gene-to-gene” hypotheses [3]. Among the various R-genes, TRAM/LAG/CLN8 (TLC) genes cause less concern. They are different from most R-genes and render plant resistance to pathogenic toxins, including FB1 (fumonisins B1) and AAL (Alternaria alternata f. sp. lycopersici) toxins, generally produced by Fusarium and Alternaria genus fungus, respectively. These toxins not only threaten crop quality and storage, but also harm animal and human health.
TLC genes are mainly comprised of LAG (longevity assurance gene), TRAM (translocating chai-associating membrane protein) and CLN8 (Neuronal Ceroid Lipofuscinosis 8) members [4]. They have been systemically investigated mainly in human, animal, and yeast encoding membrane-associated proteins [5]. It is summarized that these three types of TLC members are ER (endoplasmic reticula)-resident TM (transmembrane) proteins and ubiquitous in the eukaryotic kingdom. They act as synthases and activate the synthesis of ceramide-like moieties and/or sphingolipids, and translocate proteins in the ER [4]. It was the LAG-type TLC genes that were first reported to act as ceramide synthases and exhibit resistance to FB1 and AAL toxins [6]. Besides LAG genes, CLN8 and TRAM genes are also notable, they are important in stress response or apoptosis [7,8,9].
Ceremide synthesis in sphingolipid metabolism is also critically important in plants. The sphingolipid metabolism pathway, including ceremide synthesis, plays an important role in biotic and abiotic stress responses, triggering programmed cell death in plants [7,10,11]. In-depth investigation of TLC genes would be beneficial not only for decomposition of the sphingolipid metabolism, but also for disease therapy or food security. However, compared with animals and yeast, research about TLC genes in plants have been rarely reported. Available studies are mainly about LAG-type TLC genes in limited plant species. The first reported LAG gene in plants is Alternaria stem canker locus-1 (asc1) in Solanum lycopersicum, which endowed plants with resistance to FB1 and AAL toxins. Three LAG homologs in Arabidopsis thaliana, AtLOH1, -2, and -3, encode three different isoform ceramide synthases with distinct substrate specificities. Ceramide synthases are central in sphingolipid metabolism and catalyze the formation of ceramides from sphingoid long-chain base (LCB) and fatty acyl-CoA substrates [12]. AtLOH1 and AtLOH3 catalyze reactions with very-long-chain fatty acyl-CoA and trihydroxy long-chain base (LCB) substrates, while AtLOH2 applied palmitoyl-CoA and trihydroxy long-chain base (LCB) substrates. Furthermore, AtLOH1 ceramide synthase is strongly inhibited by FB1, while AtLOH2- and AtLOH3-overexpressing plants are tolerant to FB1 toxicity [11]. As one of the most important cereal crops worldwide [13], maize (Zea mays) suffers increasingly worse fungal diseases, causing mycotoxins to be an important threat to maize production and quality [14]. However, few reports about mycotoxin R-genes, TLC genes, have been published for maize. The completion of genome sequences of maize and many other sequences provide us valuable genetic data to decipher the evolutionary fate and characteristic of TLC genes in maize and plant kingdoms, which could be a stepping stone for in-depth functionally characterization of TLC genes [15].
In this study, TLC proteins were genome-wide identified from the maize genome. Their duplication modes, collinear relationship with monocot and dicot species, TM regions and conserved motif organization, gene exon/intron structure, population genetics, tissue-specific expression profiles, and expression patterns under toxin and pathogen injection were systemically investigated. Specifically, TLC genes from 30 other plant species and 3 outgroup species were also employed in this study to better reconstruct phylogeny and trace the evolutionary history of plant and maize TLC proteins. The results presented would not only uncover the evolutionary fate of TLCs in maize and plants, but also provide theoretical support for the future functional analysis of ZmTLCs.
2. Results
2.1. Identification of TLC Genes from Maize and 30 Other Plant Species
TLC homologs from maize were characterized by a genome-wide Pfam homology search and 18 ZmTLCs, encoding proteins harboring the TRAM_LAG1_CLN8 domain, were detected. These 18 ZmTLCs homologs were distributed unevenly on eight of ten maize chromosomes (Figure 1). Four ZmTLC genes reside in chromosome 1, 5, and 8, respectively. Two are located in chromosome 3, followed by only one in chromosome 2, 4, 7, and 9. These 18 ZmTLC genes were further named as TLC1 to TLC18 according to their chromosomal distribution (Table 1). In addition, the length of ZmTLC proteins were relatively conserved, ranging from 189 aa to 331 aa, with an average length of 279 aa. The iso-electricpoint (pI) and molecular weight (Ww) of 18 ZmTLC proteins were also calculated and listed in Table 1.
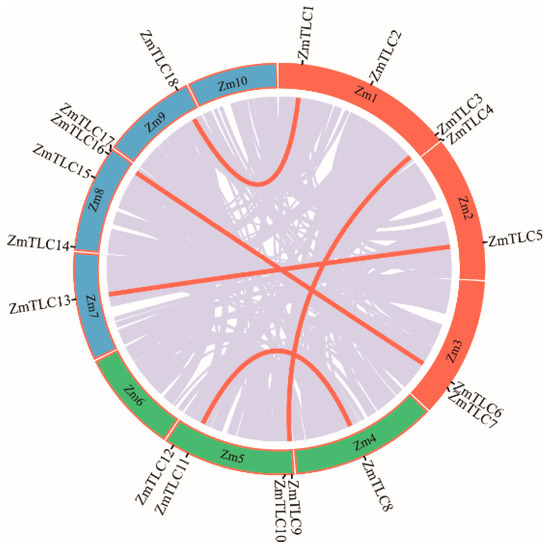
Figure 1.
Chromosomal distribution of maize TLC genes. Genome-wide collinear genes in maize are linked with grey lines and collinear TLC genes are marked with red lines.

Table 1.
Information of maize TLC proteins.
TLC homologs were also explored from 30 other representative plant genomes to better confirm the evolutionary status of TLC genes (Figure 2; Table S1). These 30 plant species cover 22 plant families, ranging from aquatic alga to higher angiosperms. TLC genes of Saccharomyces cerevisiae from the fungus kingdom and Caenorhabditis elegans and Mus musculus from the animal kingdom, were simultaneously detected and utilized as outgroups for further analysis. Results showed that TLC genes are conserved across all surveyed lineages. The four algae genomes harbored an average of eight TLC genes, with small ranges from 7 to 10. In the basal plant genomes, including three moss species, Physcomitrella patens, Sphagnum fallax, and Marchantia polymorpha; one fern species, Selaginella moellendorffii; and one gymnosperm, Ginkgo biloba, 6 to 15 TLC genes were identified. In higher green lineages, including 21 angiosperm species, there were variable TLC copy numbers from 6 to 20. Among all these surveyed species, Glycine max had the most TLC genes, yielding as many as 20, while Amborella trichopoda, the common ancestor of dicots and monocots, harbored the lowest TLC copy number. In C. elegans, S. cerevisiae and M. musculus, 9, 4, and 16 TLC genes were identified, respectively. Correlation between the number of TLC genes and genome size, chromosome number and genomic-wide protein-encoding gene number, were also assessed. Results demonstrated that the number of TLC genes was positively correlated with the genome-wide protein-encoding gene number for each genome (Figure S1) (r2 = 0.67, p < 0.01; Pearson’s product–moment correlation).
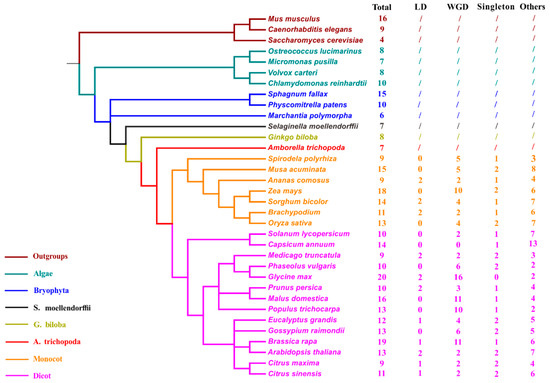
Figure 2.
Taxonomic tree of 31 surveyed plant species and 3 outgroup species. The total number of genome-wide identified TLCs in each species and number of TLCs involved in different duplication-modes were also listed. Species from different taxonomies and/or species were marked with different colors. “Total” represents total TLC protein numbers in each species; “LD” represents local duplication, including tandem and proximal duplication; “WGD” represents Whole-genome/Segmental duplication; “/” means duplication mode was not estimated.
2.2. Identification of Modes of Gene Duplication in Plant and Maize TLC Homologs
In surveyed plant species, the TLC gene family showed different degrees of expansion, especially in angiosperms. Gene duplication, generally resulting in multiple duplication modes including WGD/SD, local duplication (LD, including tandem and proximal duplication) and transposed duplication (TD), contributes mainly to gene family expansion in angiosperms [16,17]. In particular, WGD/SD and LD are considered as the two main causes of gene family expansion. Thus, to decipher mechanism underlying TLC gene expansion in plant species, Blastp and MCScanX were applied to first detect WGD/SD and LD events involved in the TLCs of angiosperms (Figure 2) [18,19]. In surveyed angiosperms, 7.9% TLC genes were singletons and others were involved in a kind of duplication mechanism. WGD/SD pairs made up 40.4% (107 out of 265) of TLC genes, while only 6.8% of TLC genes were LD gene pairs. LD modes could be detected from only 10 of the 22 angiosperm species.
Concentrating on maize, no LD events were identified and 10 of 18 (55.56%) TLC homologs were WGD duplicated pairs (Figure 3). Hence, in the remaining eight maize TLC genes, potential TD events were also characterized. To obtain accurate results, four genomes with a close genetic relationship with maize, including Oryza sativa, Setaria italica, Brachypodium distachyon, and Sorghum bicolor, were employed as outgroups. It is presumed that ZmTLC9 and ZmTLC5 are parentally copied, generating ZmTLC2 and ZmTLC1 by transposed duplication, respectively (Figure 3).
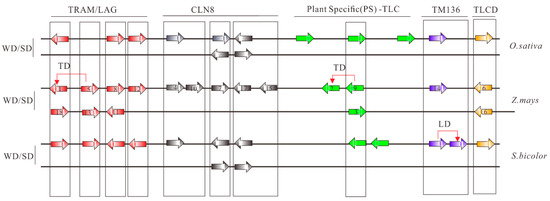
Figure 3.
Collinear analysis of TLC genes between maize and other species, including S. bicolor and O. sativa. TLC proteins are shown as arrows. Arrows towards the right direction means the gene was in the forward strand orientation, while arrows in the left direction means the gene was in the reverse strand orientation. Arrows with different colors represent different TLC types. Collinear communities are marked with black boxes. Results of collinear analysis between maize and Arabidopsis were not shown due to no collinear communities being found.
2.3. Calculation of Evolutionary Parameters of TLC Paralogs
Estimation of the evolutionary ratio of TLC duplicated paralogs would be beneficial for understanding dynamics driving TLC gene family evolution in plant kingdoms. Ka/Ks ratio is one of the most important molecular evolutionary parameters. Generally speaking, Ka/Ks > 1 indicates evolution under positive selection pressure, Ka/Ks < 1 is said to be conserved and subjected to purifying selection, and Ka/Ks = 1 indicates neutral selection. In the present study, measurement of Ka/Ks was performed to trace the evolutionary force responsible for WGD and LD TLC duplicated pairs. The majority of those WGD and LD duplicated pairs were under “purifying selection”, showing few or no selection constraints. Only one LD type gene pair, Eucgr.G01439 and Eucgr.G01442, had Ka/Ks bigger than 1 (Table S4).
According to our data, WGD and LD duplicated pairs had different evolutionary rates (Figure 4). Comparing the Ka/Ks values of WGD with those of LD duplicated pairs in all angiosperms, the average Ka/Ks value of WGD duplicated pairs (0.23) was less than that of LD duplicated pairs (0.42). Furthermore, LD duplicated pairs in monocots had a smaller average Ka/Ks value than those in dicot plants. This is consistent with the result that WGD pairs had a higher average value in dicots than that in monocots. These results demonstrated that there is a distinct molecular evolutionary ratio between LD and WGD TLC gene pairs, as well as TLC gene pairs between monocot and dicot plants. Additionally, the two TD pairs in maize also underwent purifying selection, with Ka/Ks lower than 1 (Table S4).
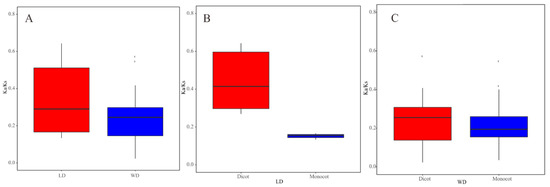
Figure 4.
Boxplots of non-synonymous (Ka) to synonymous (Ks) ratio of WGD and LD duplicated pairs. (A) Ka/Ks values of WGD and LD TLC genes pairs in all angiosperm plants. (B) Ka/Ks values of LD TLC gene pairs in dicot and monocot plants. (C) Ka/Ks values of WGD TLC gene pairs in dicot and monocot plants.
2.4. Contruction of a Maximum Likelihood (ML) Phylogenetic Tree with TLCs from All Surveyed Species
To better trace the evolutionary history of TLC genes in maize and plant kingdoms, a maximum likelihood (ML) phylogenetic tree was obtained with 348 TLC proteins from 31 plant species and 29 TLC proteins from 3 outgroup species (See Materials and Methods). According to the topology of the phylogenetic tree and taxonomy of surveyed species in Figure 2 (Figure 5 and Figure S2), the phylogenetic tree could be categorized to five clades, subsequently named as Clade I–V. TLC proteins from different species were unevenly clustered within different clades (Figure 5 and Figure 6). There were 155, 113, 34, 38, and 37 TLCs in the five clades. Clade I harbored the most TLC members, while Clade III harbored the least. In addition, Clade I comprised TLC proteins from all 34 genomes, including the three outgroup species. Clade II harbored TLC proteins from most surveyed genomes, except for one outgroup specie, C. elegans. In the other three clades, TLC proteins were absent in several species, or/and even lineages. For example, TLCs from all three outgroup species were absent in Clade III. Thus, this clade was further suggested to be a plant-specific (PS) TLC clade. In Clade IV, TLC proteins could be found in almost all surveyed lineages, while absent in several species. Finally, neither TLC homologs from the four aquatic alga nor the fungus S. cerevisiae were present in Clade V. According to the annotation of previously reported TLC proteins in M. musculus and their corresponding distribution [20], TRAM- and LAG- type TLCs were clustered within Clade I, while CLN8-type TLCs were in Clade II. TLCs in Clade IV were closely related to TM136, and TLCD5 was closely related to proteins in Clade V. Consequently, proteins in Clade I to V were annotated as TRAM/LAG-, CLN8-, PS-TLC-, TM136-, and TLCD- type TLC proteins in further analysis.
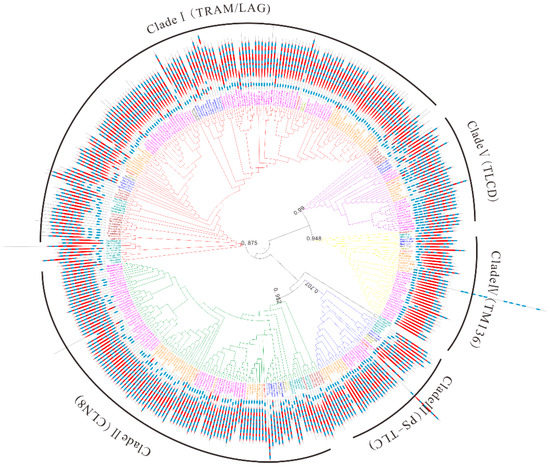
Figure 5.
The maximum likelihood (ML) phylogenetic tree built by TLC proteins from 31 plant species and 3 outgroup species. Abbreviation of species names in Table S1 were used as prefixes in the protein names to denote the species they belong to. Additionally, TLC members belonging to different lineages or/and species were marked in the same colors as those in Figure 2. The phylogenetic tree could be categorized into five clades and branches of different clades were marked with different colors. Red, green, blue, yellow, and purple branches represent Clade I to V, respectively. Transmembrane (TM) region topology across TLC proteins is also shown. Blue squares represent TM regions and red diamonds represent TRAM/LAG/CLN8 domains.
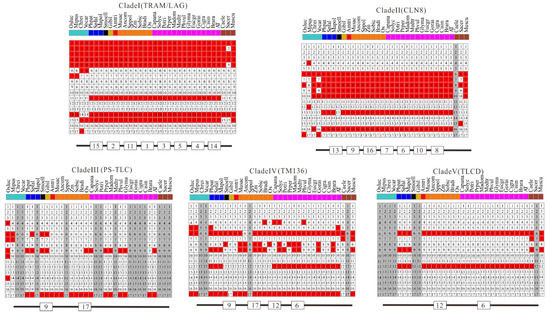
Figure 6.
Conserved motif composition of TLC proteins in five clades. Schematic representations of the 17 conserved protein motifs in TLC proteins from 31 different plant species and 3 outgroup species in five clades. Numbers in squares are motif accession numbers. The red and white indicate the presence of motifs or not. Gray means no sequences from the species could be found in corresponding clades.
2.5. TM Regions and Conserved Motif Organization in TLC Proteins within Different Clades
It is reported that TLCs have at least five TM α helices [4]. Our research first inspected TM region topology in TLC proteins with SMART (Figure 5). The above results highlight that TLC proteins in plant kingdoms could be subdivided to five well-supported clades. Results demonstrated that TLC proteins in different clades shared distinct, common, TM region composition. TLC proteins in Clade I consisted of five TM regions, with four TM regions forming the TLC domain and one in the N-terminal to the TLC domain. In Clade II, the majority of the TLC proteins harbored six predicted TM regions, with five TM regions forming the TLC domain and one N-terminal to the TLC domain. In Clade III, the number of predicted TM regions varied, with two to six TM regions constituting the TLC domain and one adjacent to the N-terminal of TLC domain. In Clade IV, the majority of the TLC domain consisted of two TM regions, with one TM region adjacent to its N-terminal. In Clade V, proteins had five predicted TM regions in the TLC domain, with two TM regions adjacent to the N-terminal of the TLC domain.
Additionally, all the protein sequences of TLCs were submitted to the MEME website simultaneously to decipher their conserved motif composition. These TLC sequences showed large motif composition divergence. Only when the motif number was set to as many as 17 could significant conservation be detected within most surveyed TLC sequences (Figure 6). Though high motif composition divergence was in TLC proteins across different clades, proteins within the same clades shared very similar conserved motif composition. Motif 1, 2, 3, 4, 5, 11, 14, and 15 were conserved in more than half of the TLC proteins in Clade I. Clade II had conserved motifs including motif 13, 9, 16, 7, 6, 10, and 8. Motif 9 and 17 were conserved in Clade III. Clade IV had conserved motif 9, 17, 12 and 6, while Clade V had conserved motif 12 and 6. From detailed analysis of the residues in motifs, the absolutely conserved Arg (R) residue mentioned in previous reports could be found in all five of the clades (Figure 7). However, the two consecutive histidine residues (“HH”) in previous reports, which may be related to catalysis or substrate binding, could only be detected in four of the five clades, except for Clade III, which only harbored plant TLCs [12].
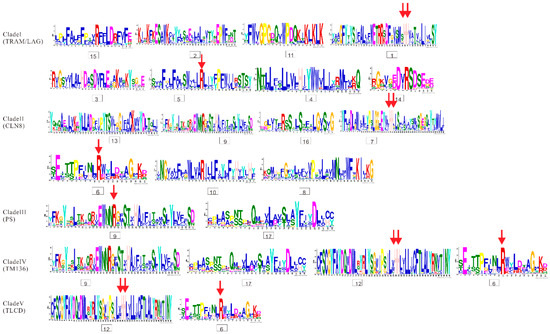
Figure 7.
Sequence logos for conserved motifs in proteins of five clades. The results were produced by the Multiple Em for Motif Elicitation (MEME) program. The conserved Arg (R) residue and two consecutive histidine residues are marked with red arrows.
2.6. Phylogeny Reconstruction and Intron/Exon Structure Analysis of Maize TLCs
Phylogeny reconstruction with TLC proteins from 22 representative plant families would be beneficial for the classification and evolutionary history of maize TLC proteins. In the above ML phylogenetic tree based on 34 species, Clade I, also named as TRAM/LAG Clade, harbored as many as seven maize TLC proteins, including ZmTLC1, -5, -8, -11, -12, -13, and -18. In Clade II, there were five maize TLC proteins, including ZmTLC4, -7, -10, -15, and -17. In addition, ZmTLC2, -3, and -9 clustered within Clade III, and ZmTLC14 clustered within Clade IV. ZmTLC6 and -16, could be identified in Clade V. These ZmTLCs within the same clade had very similar TM and motif composition features, consistent with the common properties we summarized from the above 34 species phylogenetic tree (Figure 5 and Figure 6). To confirm the reliability of the ML tree, we also constructed another phylogenetic tree, with only TLC proteins from maize (Figure 8A). As expected, maize TLC proteins displayed almost the same topological relationship between the two trees. The new tree could also be subdivided into five clades, in which ZmTLCs were distributed the same as the above ML phylogenetic tree. A similar intron/exon distribution pattern can be observed for ZmTLC proteins in each clade (Figure 8B). For example, genes in Clade I harbored five introns; TLC genes in Clade II had seven introns; TLC genes in Clade III have no or one intron; TLC genes in Clade IV contained two introns; TLC genes in Clade V contained three introns.
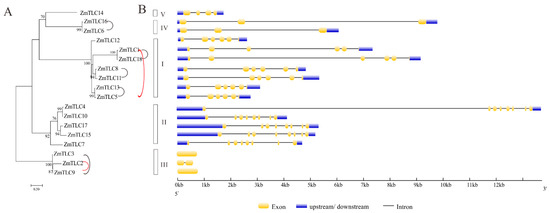
Figure 8.
The ML phylogenetic tree built by ZmTLC proteins (A) and their exon/intron composition (B). This ML phylogenetic tree could also be divided into five clades, in which ZmTLCs showed almost the same topological relationship as those in the ML tree in Figure 5. WGD TLC gene pairs are linked by black lines; TD gene pairs are linked by red lines.
2.7. Collinear Analysis of TLCs Across Maize and Three Other Species
Phylogenetic trees preliminarily revealed the homologous relationship between TLCs in maize and other species. Collinear or/and synteny analysis enabled us to better illustrate the origins of ZmTLCs [21] (Figure 3). Applied with two representative grass genomes, including O. sativa and S. bicolor, and one dicot genome, Arabidopsis, a synteny-based method was employed to explore collinearity and orthology between maize and other grass and dicot lineages. Surprisingly, no synteny communities of TLCs could be found between maize and Arabidopsis, showing their distant and obscurely orthologous relationship. However, TLC proteins were largely collinear across the grass lineages. Nine collinearity communities were discovered among maize and two other grass species, covering 77.78% (14 out of 18) ZmTLCs. One collinearity community was found only between maize and S. bicolor. These syntenic orthologs were likely to be descended from a common ancestral gene before speciation.
2.8. Population Genetics Analysis of ZmTLC in Inbred and Wild Maize
More and more re-sequencing data provides us with an unprecedented chance to perform molecular population genetics analysis, which could apply within- and between-population DNA sequence variation to trace evolutionary dynamics in maize populations. Re-sequencing data for 30 inbred and 22 wild maize were applied in the present study [22]. Nucleotide diversity (π) was firstly calculated using DnaSP to estimate the population mutation rate (Table 2). π presents the average number of nucleotide differences between two sequences within one population. Results showed the level of π varied across different TLC genes in both wild and inbred maize populations. In inbred maize, π ranged from 0 at ZmTLC1 to 0.08 at ZmTLC7, while π in wild maize ranged from 0 at ZmTLC1 to 0.7 at ZmTLC7 and -4. The average π (0.003) of all TLC loci in inbred maize population is lower than that (0.004) in the wild maize population. In five loci, ZmTLC4, -6, -10, -14, and -17, π within the inbred maize population is higher than that in the wild maize population. In seven loci, ZmTLC1, -5, -8, -12, -13, -16, and -18, π within the inbred maize population is equal to that in the wild maize population. Apparently, ZmTLC1 showed no single gene polymorphism (SNP) within both the inbred and wild maize population, indicating the genetic conservation in maize. At ZmTLC7, π is the highest in both inbred and wild maize, and it is the only locus at which π is higher in the inbred population than in the wild maize population.
Table 2.
Population genetics analysis of ZmTLCs within/between inbred and wild maize populations.
One neutrality test, the Tajima’D test, was performed to detect selection pressure under individual loci [23] (Table 2). The Tajima’D statistic is expected to be 0 according to the standard neutral equilibrium model. Positive D values imply an excess of intermediate frequency polymorphisms, while negative Tajima’D values speculate rare polymorphism. In the present study, mean Tajima’D values were 0.11 in the inbred maize population and −0.67 in the wild maize population. This is consistent with a previous study which found that SNP frequency in wild maize is skewed from neutral expectations, implying population expansion or subdivision [24]. As to individual loci, only one CLN8-type locus, ZmTLC10, showed a statistically significant (p < 0.05) Tajima’D value (−1.73). Moreover, the Tajima’D value of ZmTLC10 in inbred maize is the lowest among all surveyed loci, indicating positive selection or linkage to a swept gene.
Finally, an important parameter, Fst, the measurement of the genetic differentiation between inbred and wild maize populations, was also calculated (Table 2). Generally, the closer Fst is to 0, it implies a lower degree of divergence between two surveyed populations. The closer Fst is to 1, it indicates a higher degree of differentiation between populations. The average value of Fst between inbred and wild maize was 0.12 for ZmTLC genes, showing overall slight differentiation. Four loci showed statistically significant Fst values between these two maize populations, including ZmTLC4, -6, -8, and -10, indicating a high level of genetic differentiation at these four loci between two maize populations.
2.9. Expression Profiles of ZmTLC Genes in Different Tissues
In the present study, gene expression patterns of ZmTLCs were analyzed across 14 organs/tissues involved in 23 diverse developmental stages, to yield their high-resolution spatial expression profiles in the life cycles of maize and promote further functional analysis (Figure 9). ZmTLC genes displayed diverse tissue-specific expression patterns. ZmTLC1, -9, -16, and -18 were expressed in all tested developmental phases. ZmTLC8 and -10 showed a relatively high level of expression in almost all tested developmental phases (FPKM ≥ 10), while ZmTLC1, -3, -5, and -16 exhibited a relatively low level of expression in most surveyed developmental phases. ZmTLC15, -9, -17, -2, -4, and -10 were hardly expressed in endosperm. The expression level of most ZmTLCs in mature pollen was equal to zero, whereas ZmTLC17 was highly expressed in mature pollen. On the other hand, most ZmTLC genes within the same clade exhibited distinctive k means clustering of expression values, exhibiting expression pattern or functional diversity. Intriguingly, four of the five WGD duplicated pairs, ZmTLC1 and -18, -8 and -11, -6 and -16, -3 and -9, revealed significant diverse tissue-specific expression patterns (one-way ANOVA test, p < 0.01) [25] (Figure 9). Whereas the two transposed duplication pairs, ZmTLC1 and -5, -2 and -9, manifested expression profiles across tissues with no significant diversity (one-way ANOVA test, p > 0.05).
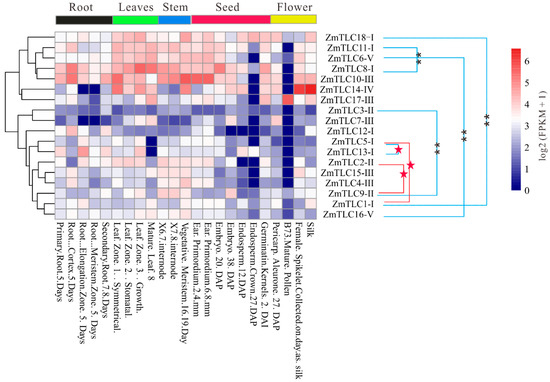
Figure 9.
Tissue-specific expression profiles of ZmTLC genes. Expression pattern divergence between WD/SD gene pairs (linked by blue lines) and TD gene pairs (linked by red lines) were estimated by one-way ANOVA test. ** represents highly significant divergence (p < 0.01) and red stars represent no significant divergence (p > 0.05).
2.10. The Relative Expression Levels of ZmTLC Genes in Response to FB1 Toxins and Pathogens
Previous experimental evidence proved that TLC genes played important roles in response to mycotoxins, including FB1. Maize is severely threatened by kinds of mycotoxins. Hence, we first evaluated the expression levels of ZmTLCs under FB1 irrigation in maize inbred B73 at four time points, to deduce the potential role of ZmTLCs in response to FB1 (Figure 10). Two of the eighteen ZmTLCs were up-regulated more than two-fold at one or several time points, including ZmTLC5, -10, and -13. As kinds of fungus could produce toxins [26], we also assessed the relative expression levels of ZmTLC genes after the infection of one fungus pathogen, Curvularia lunata, to B73 and another important inbred, chang7-2 (Figure 10). Additionally, one bacterial pathogen, Pantoea stewartii ssp. stewartii (Pnss) was used as a comparison and the expression levels of ZmTLCs were also detected in sweetcorn, T1, under the injection of Pnss. Consequently, the expression levels of ZmTLC -5, -12, -13, and -15 were highly induced under the injection of Curvularia lunata in two samples. On the contrary, all the ZmTLC genes were down-regulated under the induction of Pnss, which could cause bacterial blight disease in maize. Overall, ZmTLC5 was highly induced, both under the irrigation of FB1 or upon the infection of Curvularia lunata, implying its potential role in response to mycotoxins.
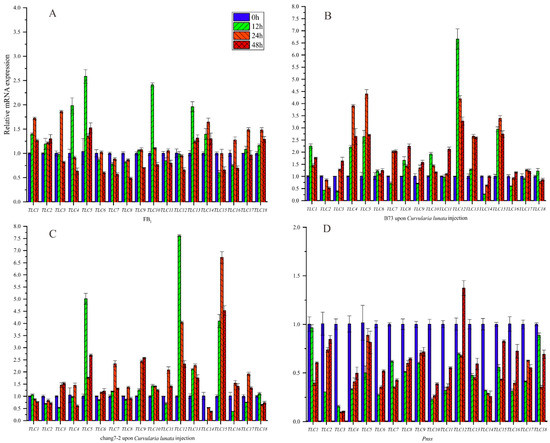
Figure 10.
Relative expression level of ZmTLC genes under different treatments at four time points. (A) Fumonisins B1 (FB1) injection into B73 inbred; (B) Curvularia lunata injection into B73; (C) Curvularia lunata injection into chang7-2; (D) Pnss injection into one sweetcorn.
3. Discussion
TLCs have been previously identified as TM proteins, mainly composed of TRAM, LAG, and CLN8 members. They are believed to participate in ceramide/lipid synthesis [5], functioning as ceramide synthase. Ceramide is an important skeleton of sphingolipids, which form a majority of membrane structure, regulate signaling pathways, and play an important role in response to biotic and abiotic stress [7]. Conforming to their functionally irreplaceability, TLC genes were evolutionarily conserved and have ancient origins across biology kingdoms, as TLC genes could be identified in all our surveyed species (Figure 2). On the other hand, in our results, TLC paralogs were of dramatic evolutionary diversity, and phylogeny reconstruction with TLC proteins from all surveyed species revealed that TLC proteins could be divided into five obvious clades, indicating evolutionary diversity. TRAM and LAG members clustered closely in Clade I, coinciding with the reports that TRAM and LAG genes shared high sequence similarity [9]. Additionally, previously identified Asc-1 from S. lycopersicum and ceramide synthase AtLOH1 (At3g25540), AtLOH2 (At1G13580) and AtLOH3 (AT3G19260) from Arabidopsis were also clustered within Clade I [11,27]. Four of the five clades, TRAM/LAG, CLN8, TM136, and TLCD type TLC genes, harbored TLC proteins from at least one species in the outgroups, implying their ancient origins and evolutionary conservation across biology kingdoms. The PS-TLC (Clade III) clade only had TLC members from plant species, implying that these TLC proteins were either lost in other biology kingdoms or recently evolved after the differentiation of plants with other biology, which may be involved in plant specialized metabolism [28].
Conserved motifs and domains shared by homologous genes were generally believed to be important functional elements or/and regulatory molecules [29]. TLC proteins showed TM regions and motif composition divergence among members in different clades, indicating functional diversity. Previously reported conserved consecutive “HH” residues could be identified in TRAM/LAG, CLN8, TM136, and TLCD type TLC proteins, which contained yeast or animal homology [4], while no such conserved consecutive “HH” was shared by PS-TLC proteins, implying their functional specialization. Interestingly, our results suggested that PS-TLC proteins, as well as TLCD TLC proteins, were likely to originate from divisions of conserved motifs in TM136-type proteins (Figure 6). In the duplication-degeneration-complementation (DDC) model, a division of regulatory modules to subunits would generally result in subfunctionalization [30]. Our results conformed to this hypothesis, indicating the subfunctionalization consequence. It is commonly believed that subfunctionalization is the primary mechanism underlying the substrate specialization processes [31]. In the enzyme evolution, the new copy and the old would have multiple distinct modes of activity control or substrate specificity, and finally specialize in either function after subfunctionalization [32]. Furthermore, subfunctionalization has also already been detected between two TRAM/LAG-type TLC genes, AtLOH1 and AtLOH3 [11]. Compared with TRAM/LAG and CLN8 TLC proteins, rare experimental and functional characterizations could be found for TLC proteins in the PS-TLC, TLCD and TM136 clades. These outcomes would provide predication in further in-depth analysis for these three types of TLC proteins.
The aforementioned analysis in plant kingdoms applied 31 plant and 3 outgroup species made sense to more easily classify and trace the evolutionary fate of the 18 TLC proteins in maize, which we emphasized in the present study. Maize TLC members shared common features across plant species, summarized based on the 34 species phylogenetic tree, no matter their topological relationships or TM regions and motif composition among or within clades. On the other hand, in our results, copy number variation and expansion occurred in TLCs of angiosperms. Gene duplication contributes to gene family variation and expansion in angiosperms, enabling raw genetic materials to be increased and followed by functionalization consequences, including redundancy, subfunctionalization, and neofunctionalization [31]. Our outcomes uncovered that the majority of TLC genes in angiosperms (40.5%) originated from WGD/SD events. Focusing on maize, 10 of 17 ZmTLC genes are WGD/SD duplicated gene pairs, while no LD duplicated ZmTLC genes were detected. Intriguingly, four of the five WGD ZmTLC pairs belonged to the TRAM/LAG-type. Three of the four TRAM/LAG-type WGD/SD ZmTLC pairs displayed significant distinct expression patterns (Figure 9), strongly indicating subfunctionalization or/and neofunctionalization, but not functional redundancy.
TD events are another important duplication mode and were found to frequently occur in gene families such as NBS-LRR and MADS-box, which are involved in environmental adaption and disease resistance [16,33]. Adopting four evolutionarily close species, two transposed duplicated pairs were detected in maize, including ZmTLC5 and -1, ZmTLC9 and -2. Herein, results indicated ZmTLC5 was an ancient parental copy and created ZmTLC1 by TD events. The intronless ZmTLC9 gene was more likely to be an evolutionarily ancient retrocopy, and itself may be generated by an ancient multiexon parental gene and subsequently created ZmTLC3 by WGD and ZmTLC2 by TD (Figure 3). Considering the presence of intron sequences in both ZmTLC2 and ZmTLC1 genes, they are most likely to be generated by DNA-based TD or transposon-mediated duplication [34]. These two transposed duplicated pairs shared significant similar expression levels in different tissues, indicating their distinct functional consequences compared with those WGD/SD gene pairs. Furthermore, it is fascinating that ZmTLC5 presented potential capacity in responding to environmental stimuli in our analysis. The expression level of ZmTLC5, which belonged to Clade I, was highly induced either upon infection by a fungus pathogen or fumonisins B1. Additionally, another transposed pair, ZmTLC9 and -2, belonged to plant-specific clades, which are more likely beneficial for plant-specific evolution. These results suggested that transposed duplication plays an important role in maize the evolution of TLC proteins in response to environmental stimuli or adaption. Finally, population genetic analysis revealed that a CLN8-type TLC locus, ZmTLC10, showed significant differentiation between wild and inbred maize populations and underwent significant positive/adaptive selection pressure in the inbred maize population, indicating its role in domestication. Overall, TD duplicated ZmTLC genes, as well as ZmTLC10 could be important candidates for further functional analysis.
4. Materials and Methods
4.1. Data Sources and Identification of TLC Proteins
Gene models and proteomes of 31 plant genomes were downloaded and utilized in the present study. Genome and annotation data of maize v4.41 were downloaded from the MaizeGDB website [35]. Genome Annotation resources of Ostreococcus lucimarinus, Micromonas pusilla, Volvox cartei, Chlamydomonas reinhardtii, Sphagnum fallax, Physcomitrella patens, Marchantia polymorpha, Selaginella moellendorffii, Amborella trichopoda, Spirodela polyrhiza, Musa acuminata, Ananas comosus, Sorghum bicolor, Brachypodium distachyon, Oryza sativa, S. lycopersicum, Capsicum annuum, Medicago truncatula, Phaseolus vulgaris, Glycine max, Prunus persica, Malus domestica, Populus trichocarpa, Eucalyptus grandis, Gossypium raimondii, Brassica rapa, Arabidopsis thaliana, Citrus maxima, and Citrus sinensis were downloaded from Phytozome (http://phytozome.jgi.doe.gov/pz/portal.html). Annotation of the Ginkgo biloba genome was downloaded from previous literature [36] (Table S1). Genome annotation of Mus musculus, Caenorhabditis elegans, and Saccharomyces cerevisiae was downloaded from the ensembl genome [37] (https://asia.ensembl.org/index.html) (Table S1). A local perl script “Pfam_scan perl” downloaded from HMMER3.1 was used to search all surveyed proteomes against local Pfam library (http://hmmer.org/). All hits were subjected to the Pfam database, with the E-value set to default. Candidate TLC proteins were selected with the TRAM_LAG1_CLN8 domain. The longest transcript of each candidate gene was selected as representative for further analysis if primary transcripts were not provided [38].
4.2. Collinearity and Gene Duplication mOdes Prediction
MCScanX package was utilized to detect collinearity within or cross species genomes, as well as duplication modes in which angiosperms TLC proteins involved [19]. MCScanX implemented whole-genome BLASTP results to compute synteny/collinearity blocks within or among species. This package can also efficiently classify the gene duplication mechanism underlying one gene family evolution, focusing on WGD/SD and local (proximal and tandem) duplication based on copy number and their genomic distribution. To detect transposed duplication in maize, MCScanX-transposed was applied [39]. Four monocot species, including O. sativa, S. italica, B. distachyon, and S. bicolor, were employed to be outgroups. To deduce collinear communities between maize, O. sativa, S. bicolor, and Arabidopsis, Synteny method was utilized [21].
4.3. Calculation of Synonymous to Non-Synonymous Ratio
Synonymous to non-synonymous ratio of duplicated TLC gene pairs was calculated to estimate selection pressure. Their nucleotide’s CDS was first selected and translated to amino acid sequences and aligned by clustalw2. The codon-based maximum likelihood (CodeML) method in the PAML4.0 package was used to estimate the average non-synonymous/synonymous mutation ratio (Ka/Ks ratio) with a one-ratio model [40].
4.4. Phylogenetic Analysis
TLC proteins from all surveyed species were selected and aligned with MAFFT, using auto strategy [41]. TrimAl v1.2 was utilized to identify and delete gaps and obscure aligned sequences, with the parameter of -automated1 [42]. Then aligned sequences were further tested in ProtTest3.4 to select the best-fit amino acid substitution model for the ML phylogenetic tree construction [43]. The best model according to AIC was JTT + G + F (-lnL = 67552.85). Finally, the trimmed aligned protein sequences were submit to phyML 3.0 to construct the ML phylogenetic tree [44]. Fast approximate likelihood-based measures of branch supports (Shimodaira–Hasegawa approximate likelihood ratio test, SH-aLRT) were used for the branches. Other parameters were set based on the results of ProtTest test (amino acid frequencies = observed; gamma shape = 1.698). Additionally, another ML tree with only maize TLC proteins was also constructed with the same method, while the best model according to AIC was JTT + G + I + F (-lnL = 69201.52, gamma shape = 3.686; Proportion of invariable sites = 0.012). Obtained trees were edited with ITOL and MEGA 7.0 [45].
4.5. Motif Composition and Gene Structure Analysis
To detect conserved motifs in TLC proteins, a local MEME program was utilized with the command line as follows: meme protein_sequnece.fas -o result -protein -evt 0.05 -maxsize 10000000 -nmotifs 17 [46]. Gene structures of ZmTLCs were drawn in the GSDS (v2.0) website [47].
4.6. Calling of Single Nucleotide Polymorphisms (SNPs) and Calculation of Genetic Parameters
Re-sequencing data of 30 inbred and 22 wild maize were downloaded from peazea [22], with sequencing depth ≥ 10 (Table S2). All the reads of selected samples were mapped against the maize reference genome (B73 v3.0) by BWA using default parameters [48]. Picard-MarkDuplicates (http://broadinstitute.github.io/picard/) and GATK-IndelRealigner were used to correct mapping results. Finally, GATK-UnifiedGenotyper was utilized to detect SNPs in each maize individual at corresponding gene loci. Nucleotide sequences of ZmTLC genes in each individual maize population were obtained by local perl script (Supplementary File 2). If the non-determined nucleotide (N) exceeds 10%, the sequence would be eliminated in further analysis due to low coverage. Furthermore, nucleotide variation was estimated as the ratio between SNP numbers and corresponding CDS length. Pair-wise fixation index (Fst) and Tajima’D were calculated by Arlequin3.1 [49].
4.7. Expression Profiles of ZmTLCs
The expression profiles were downloaded from the MaizeGDB website and dataset source is Walley 2016 (Briggs Labs) [35,50]. RNA was obtained from 23 distinct tissues. All reads were mapped by the STAR 2.5.3 aligner [51] and FPKM abundances were calculated by Cufflinks 2.2.1 with default settings [52].
4.8. Planting and Cultivation of Corn
Four maize lines were germinated in sand for 2 days at 28 °C, and then grown in pots to 4th leaf stage maize seedlings at 25–30 °C, under a usual photoperiod. The second and third leaves of maize seedlings were obtained after they were wiped with 75% alcohol. All the samples were frozen immediately in liquid nitrogen and stored at −80 °C for the extraction of RNA.
4.9. Pathogen Cultivation and Infection
One fungus pathogen, Curvularia lunata, and one bacterial pathogen, Pantoea stewartii (Pnss), were utilized in the present study. The Curvularia lunata strain was cultured on potato dextrose agar (PDA) for 4–5 days at 28 °C under darkness [53]. Then the fungus dishes were transferred into corn kernels which were soaked for 2 days and sterilized for 1 h at 121 °C for 1 week at 28 °C under darkness. The corn kernels were sterilized with UV for 1 h after the hyphae of their surface was washed with sterile water and then moisturizing cultured for 2–3 days at room temperature. The conidia spore suspension was prepared by eluting the conidia growth on corn kernels and adding it into distilled water. The spore concentration was determined by hemocytometer. The fungal fluid in tubes (50 mL) was centrifuged at 4000 rpm for 15 min at 4 °C to collect the conidia pellets. The spore suspension of 106 cfu/mL in 2% sucrose and 0.05% Tween-20 was sprayed on B73 and chang7-2, respectively, using air sprayers. At the same time, the project contained 2% sucrose and 0.02% Tween-20 which was used as a negative control. The leaves were sampled at 0, 12, 24, and 48 h after inoculation and three seedlings from each inbred line were obtained as samples.
The Pnss strain was streaked on nutrient agar (NA) for 3 days at 25 °C under darkness and a single colony was picked up and the culture was expanded for 48 h [54]. The bacteria was shifted into a liquid medium (50 mL) to oscillate at 25 °C (OD540 = 0.57). The bacterial fluid was centrifuged at 3000 rpm for 5 min at 4 °C to collect the bacterial cells. The bacterial suspension, which was 107–8 cfu/mL in phosphate buffer solution (PBS) and 0.05% Tween-20, was injected into the stalks of T1 using syringes. The negative control was injected with phosphate buffer solution (PBS) and 0.05% Tween-20. The leaves were sampled at 0, 12, 24, and 48 h after inoculation and three seedlings from each inbred line were obtained as samples.
4.10. Inoculation Method of Fumonisin B1
For fumonisin B1 (FB1) treatment, 10 µM FB1 was prepared with Fumonisin B1 Standard (>96%) and sterile water. The liquid was irrigated around the root of every B73 inbred line seedling to 20 mL. The leaves were sampled at 0, 12, 24, and 48 h after irrigation and three seedlings from each inbred line were obtained as controls.
4.11. RNA Extraction and RT-qPCR
RNA was extracted from pathogen or toxins treated leaves and the quality was evaluated by electrophoresis strips and spectrophotometric measurement [55,56]. Then obtained RNA was reverse transcripted to complementary DNA (cDNA) using a HiScript®IIIRT SuperMix for qPCR (+gDNA wiper) Kit (Vazyme). In RT-qPCR, each reaction had a total volume of 20 µL, consistind of 2 µL diluted cDNA, 10 µL of AceQ qPCR SYBR Green Master Mix (Vazyme), 1 µL forward and reverse primers, and 6 µL RNA-free water. Three technical replications were performed per sample. Cycling of qPCR validation was 95 °C 5 min, followed with 40 cycles of 95 °C for 10 s, 60 °C for 30 s. ZmActin1 (Zm00001d010159) and ZmGADPH (Zm00001d049641) were used as internal controls, and primers were designed with Primer Premier Software (v 5.0) [57] (Table S3). Primers were selected according to the following criteria: oligo length should be between 15 and 25 bases; melting temperature (Tm) should between 55 °C and 65 °C; no hairpins and heterodimers should exist between two primers. A BLAST alignment was performed in the MaizeGDB website to ensure the specificity of selected primers [35]. All available primers were listed in Table S3. The relative expression levels of these genes were calculated by the Delta-Delta Ct method with the geometric mean of the two reference genes [58]. Finally, results were displayed by Origin2018.
Supplementary Materials
The following are available online at https://www.mdpi.com/1422-0067/20/21/5484/s1, Supplementary File 1: Figure S1. Correlation analysis between TLC numbers with genome-wide protein-encoding gene numbers (A), genome size (B) and chromosome number (C). Figure S2. The ML phylogenetic tree built by TLC proteins from 31 plant species and 3 outgroup species. Table S1. Genome information of 31 plant species and 3 outgroup species. Table S2. Inbred and wild maize used in the present study. Table S3. Primer sequences used for RT-qPCR analysis. Table S4. Ka, Ks, and Ka/Ks ratio of WGD/SD and LD duplicated gene pairs in surveyed angiosperms. Supplementary File 2: Coding sequences of ZmTLCs assembled from inbred and wild resequencing data.
Author Contributions
Data curation, W.S. and T.H.; Funding acquisition, W.S., L.G. and T.D.; Investigation, W.S., T.H., Z.C. and T.D.; Methodology, W.S. and L.G.; Software, M.G. and Q.L.; Writing—original draft, W.S., T.H. and L.G.
Funding
Our work was supported by grants from National Natural Science Foundation of China (31701436), natural Science Foundation of Anhui Province (1908085QC106), National Key Research and Development Program of China (2017YFD0201106), Anhui natural science foundation of the colleges and universities (KJ2017A147).
Conflicts of Interest
The authors declare no conflict of interest.
References
- Jones, J.D. The use of control groups in music therapy research: A content analysis of articles in the Journal of Music Therapy. J. Music Ther. 2006, 43, 334–355. [Google Scholar] [CrossRef]
- Noman, A.; Aqeel, M.; Lou, Y. PRRs and NB-LRRs: From Signal Perception to Activation of Plant Innate Immunity. Int. J. Mol. Sci. 2019, 20, 1882. [Google Scholar] [CrossRef]
- Sekhwal, M.K.; Li, P.; Lam, I.; Wang, X.; Cloutier, S.; You, F.M. Disease Resistance Gene Analogs (RGAs) in Plants. Int. J. Mol. Sci. 2015, 16, 19248–19290. [Google Scholar] [CrossRef] [PubMed]
- Winter, E.; Ponting, C.P. TRAM, LAG1 and CLN8: Members of a novel family of lipid-sensing domains? Trends Biochem. Sci. 2002, 27, 381–383. [Google Scholar] [CrossRef]
- Teufel, A.; Maass, T.; Galle, P.R.; Malik, N. The longevity assurance homologue of yeast lag1 (Lass) gene family (review). Int. J. Mol. Med. 2009, 23, 135–140. [Google Scholar] [CrossRef] [PubMed]
- Brandwagt, B.F.; Mesbah, L.A.; Takken, F.L.; Laurent, P.L.; Kneppers, T.J.; Hille, J.; Nijkamp, H.J. A longevity assurance gene homolog of tomato mediates resistance to Alternaria alternata f. sp. lycopersici toxins and fumonisin B1. Proc. Natl. Acad. Sci. USA 2000, 97, 4961–4966. [Google Scholar] [CrossRef]
- Huby, E.; Napier, J.A.; Baillieul, F.; Michaelson, L.V.; Dhondt-Cordelier, S. Sphingolipids: Towards an integrated view of metabolism during the plant stress response. New Phytol. 2019. [Google Scholar] [CrossRef]
- Ranta, S.; Zhang, Y.; Ross, B.; Lonka, L.; Takkunen, E.; Messer, A.; Sharp, J.; Wheeler, R.; Kusumi, K.; Mole, S.; et al. The neuronal ceroid lipofuscinoses in human EPMR and mnd mutant mice are associated with mutations in CLN8. Nat. Genet. 1999, 23, 233–236. [Google Scholar] [CrossRef]
- Kageyama-Yahara, N.; Riezman, H. Transmembrane topology of ceramide synthase in yeast. Biochem. J. 2006, 398, 585–593. [Google Scholar] [CrossRef]
- Takahashi, Y.; Berberich, T.; Kanzaki, H.; Matsumura, H.; Saitoh, H.; Kusano, T.; Terauchi, R. Serine Palmitoyltransferase, the First Step Enzyme in Sphingolipid Biosynthesis, Is Involved in Nonhost Resistance. Mol. Plant Microbe Interact. 2009, 22, 31–38. [Google Scholar] [CrossRef]
- Luttgeharm, K.D.; Chen, M.; Mehra, A.; Cahoon, R.E.; Markham, J.E.; Cahoon, E.B. Overexpression of Arabidopsis Ceramide Synthases Differentially Affects Growth, Sphingolipid Metabolism, Programmed Cell Death, and Mycotoxin Resistance. Plant Physiol. 2015, 169, 1108–1117. [Google Scholar] [CrossRef] [PubMed]
- Tidhar, R.; Ben-Dor, S.; Wang, E.; Kelly, S.; Merrill, A.H., Jr.; Futerman, A.H. Acyl chain specificity of ceramide synthases is determined within a region of 150 residues in the Tram-Lag-CLN8 (TLC) domain. J. Biol. Chem. 2012, 287, 3197–3206. [Google Scholar] [CrossRef] [PubMed]
- Ranum, P.; Pena-Rosas, J.P.; García-Casal, M.N. Global maize production, utilization, and consumption. Ann. N. Y. Acad. Sci. 2014, 1312, 105–112. [Google Scholar] [CrossRef] [PubMed]
- Blacutt, A.A.; Gold, S.E.; Voss, K.A.; Gao, M.; Glenn, A.E. Fusarium verticillioides: Advancements in Understanding the Toxicity, Virulence, and Niche Adaptations of a Model Mycotoxigenic Pathogen of Maize. Phytopathology 2018, 108, 312–326. [Google Scholar] [CrossRef]
- Schnable, P.S.; Ware, D.; Fulton, R.S.; Stein, J.C.; Wei, F.; Pasternak, S.; Liang, C.; Zhang, J.; Fulton, L.; Graves, T.A.; et al. The B73 maize genome: Complexity, diversity, and dynamics. Science 2009, 326, 1112–1115. [Google Scholar] [CrossRef]
- Freeling, M. Bias in Plant Gene Content Following Different Sorts of Duplication: Tandem, Whole-Genome, Segmental, or by Transposition. Annu. Rev. Plant Biol. 2009, 60, 433–453. [Google Scholar] [CrossRef]
- Panchy, N.; Lehti-Shiu, M.D.; Shiu, S.-H. Evolution of Gene Duplication in Plants. Plant Physiol. 2016, 171, 2294–2316. [Google Scholar] [CrossRef]
- Jacob, A.; Lancaster, J.; Buhler, J.; Harris, B.; Chamberlain, R.D. Mercury BLASTP: Accelerating Protein Sequence Alignment. ACM Trans. Reconfig. Technol. Syst. 2008, 1, 9. [Google Scholar] [CrossRef]
- Wang, Y.; Tang, H.; DeBarry, J.D.; Tan, X.; Li, J.; Wang, X.; Lee, T.-H.; Jin, H.; Marler, B.; Guo, H.; et al. MCScanX: A toolkit for detection and evolutionary analysis of gene synteny and collinearity. Nucleic Acids Res. 2012, 40, e49. [Google Scholar] [CrossRef]
- Sasaki, N.; Yamauchi, H.; Tomohiro, N.; Agui, T. The telocentric tandem repeat at the p-arm is not conserved in Mus musculus subspecies. Gene 2013, 513, 214–218. [Google Scholar] [CrossRef]
- Zhao, T.; Holmer, R.; De Bruijn, S.; Angenent, G.C.; Burg, H.A.V.D.; Schranz, M.E. Phylogenomic Synteny Network Analysis of MADS-Box Transcription Factor Genes Reveals Lineage-Specific Transpositions, Ancient Tandem Duplications, and Deep Positional Conservation. Plant Cell 2017, 29, 1278–1292. [Google Scholar] [CrossRef]
- Zhao, W.; Canaran, P.; Jurkuta, R.; Fulton, T.; Glaubitz, J.; Buckler, E.; Doebley, J.; Gaut, B.; Goodman, M.; Holland, J.; et al. Panzea: A database and resource for molecular and functional diversity in the maize genome. Nucleic Acids Res. 2006, 34, D752–D757. [Google Scholar] [CrossRef]
- Tajima, F. Statistical method for testing the neutral mutation hypothesis by DNA polymorphism. Genetics 1989, 123, 585–595. [Google Scholar]
- Tenaillon, M.I.; U’Ren, J.; Tenaillon, O.; Gaut, B.S. Selection versus demography: A multilocus investigation of the domestication process in maize. Mol. Biol. Evol. 2004, 21, 1214–1225. [Google Scholar] [CrossRef]
- Feng, G.; Burleigh, J.G.; Braun, E.L.; Mei, W.; Barbazuk, W.B. Evolution of the 3R-MYB Gene Family in Plants. Genome Biol. Evol. 2017, 9, 1013–1029. [Google Scholar] [CrossRef]
- Brandwagt, B.F.; Kneppers, T.J.; Nijkamp, H.J.; Hille, J. Overexpression of the tomato Asc-1 gene mediates high insensitivity to AAL toxins and fumonisin B1 in tomato hairy roots and confers resistance to Alternaria alternata f. sp. lycopersici in Nicotiana umbratica plants. Mol. Plant Microbe Interact. 2002, 15, 35–42. [Google Scholar] [CrossRef]
- Ternes, P.; Feussner, K.; Werner, S.; Lerche, J.; Iven, T.; Heilmann, I.; Riezman, H.; Feussner, I. Disruption of the ceramide synthase LOH1 causes spontaneous cell death in Arabidopsis thaliana. New Phytol. 2011, 192, 841–854. [Google Scholar] [CrossRef]
- Barco, B.; Clay, N.K. Evolution of Glucosinolate Diversity via Whole-Genome Duplications, Gene Rearrangements, and Substrate Promiscuity. Annu. Rev. Plant Biol. 2019, 70, 585–604. [Google Scholar] [CrossRef]
- Bailey, T.L.; Williams, N.; Misleh, C.; Li, W.W. MEME: Discovering and analyzing DNA and protein sequence motifs. Nucleic Acids Res. 2006, 34, W369–W373. [Google Scholar] [CrossRef]
- Duarte, J.M.; Cui, L.; Wall, P.K.; Zhang, Q.; Zhang, X.; Leebens-Mack, J.; Ma, H.; Altman, N.; dePamphilis, C.W. Expression pattern shifts following duplication indicative of subfunctionalization and neofunctionalization in regulatory genes of Arabidopsis. Mol. Biol. Evol. 2006, 23, 469–478. [Google Scholar] [CrossRef]
- Noda-García, L.; Camacho-Zarco, A.R.; Medina-Ruíz, S.; Gaytán, P.; Carrillo-Tripp, M.; Fülöp, V.; Barona-Gómez, F. Evolution of Substrate Specificity in a Recipient’s Enzyme Following Horizontal Gene Transfer. Mol. Biol. Evol. 2013, 30, 2024–2034. [Google Scholar] [CrossRef][Green Version]
- Van Loo, B.; Bornberg-Bauer, E.; Loo, B. Enzyme sub-functionalization driven by regulation. EMBO Rep. 2017, 18, 1043–1045. [Google Scholar]
- Wang, Y.; Tan, X.; Paterson, A.H. Different patterns of gene structure divergence following gene duplication in Arabidopsis. BMC Genom. 2013, 14, 652. [Google Scholar] [CrossRef]
- Wang, Y.; Wang, X.; Tang, H.; Tan, X.; Ficklin, S.P.; Feltus, F.A.; Paterson, A.H. Modes of Gene Duplication Contribute Differently to Genetic Novelty and Redundancy, but Show Parallels across Divergent Angiosperms. PLoS ONE 2011, 6, e28150. [Google Scholar] [CrossRef]
- Portwood, J.L., 2nd; Woodhouse, M.R.; Cannon, E.K.; Gardiner, J.M.; Harper, L.C.; Schaeffer, M.L.; Walsh, J.R.; Sen, T.Z.; Cho, K.T.; Schott, D.A.; et al. MaizeGDB 2018: The maize multi-genome genetics and genomics database. Nucleic Acids Res. 2019, 47, D1146–D1154. [Google Scholar] [CrossRef]
- Guan, R.; Zhao, Y.; Zhang, H.; Fan, G.; Liu, X.; Zhou, W.; Shi, C.; Wang, J.; Liu, W.; Liang, X.; et al. Draft genome of the living fossil Ginkgo biloba. GigaScience 2016, 5, 49. [Google Scholar] [CrossRef]
- Hunt, S.E.; McLaren, W.; Gil, L.; Thormann, A.; Schuilenburg, H.; Sheppard, D.; Parton, A.; Armean, I.M.; Trevanion, S.J.; Flicek, P.; et al. Ensembl variation resources. Database 2018, 2018, bay119. [Google Scholar] [CrossRef]
- Xiao, J.; Hu, R.; Gu, T.; Han, J.; Qiu, D.; Su, P.; Feng, J.; Chang, J.; Yang, G.; He, G. Genome-wide identification and expression profiling of trihelix gene family under abiotic stresses in wheat. BMC Genom. 2019, 20, 287. [Google Scholar] [CrossRef]
- Wang, Y.; Li, J.; Paterson, A.H. MCScanX-transposed: Detecting transposed gene duplications based on multiple colinearity scans. Bioinformatics 2013, 29, 1458–1460. [Google Scholar] [CrossRef]
- Hurst, L.D. The Ka/Ks ratio: Diagnosing the form of sequence evolution. Trends Genet. 2002, 18, 486–487. [Google Scholar] [CrossRef]
- Katoh, K.; Misawa, K.; Kuma, K.; Miyata, T. MAFFT: A novel method for rapid multiple sequence alignment based on fast Fourier transform. Nucleic Acids Res. 2002, 30, 3059–3066. [Google Scholar] [CrossRef]
- Capella-Gutierrez, S.; Silla-Martinez, J.M.; Gabaldon, T. trimAl: A tool for automated alignment trimming in large-scale phylogenetic analyses. Bioinformatics 2009, 25, 1972–1973. [Google Scholar] [CrossRef]
- Darriba, D.; Taboada, G.L.; Doallo, R.; Posada, D. ProtTest 3: Fast selection of best-fit models of protein evolution. Bioinformatics 2011, 27, 1164–1165. [Google Scholar] [CrossRef]
- Guindon, S.; Lefort, V.; Anisimova, M.; Hordijk, W.; Gascuel, O.; Dufayard, J.-F. New Algorithms and Methods to Estimate Maximum-Likelihood Phylogenies: Assessing the Performance of PhyML 3.0. Syst. Biol. 2010, 59, 307–321. [Google Scholar] [CrossRef]
- Letunic, I.; Bork, P. Interactive tree of life (iTOL) v3: An online tool for the display and annotation of phylogenetic and other trees. Nucleic Acids Res. 2016, 44, W242–W245. [Google Scholar] [CrossRef]
- Bailey, T.L.; Boden, M.; Buske, F.A.; Frith, M.; Grant, C.E.; Clementi, L.; Ren, J.; Li, W.W.; Noble, W.S. MEME SUITE: Tools for motif discovery and searching. Nucleic Acids Res. 2009, 37, W202–W208. [Google Scholar] [CrossRef]
- Hu, B.; Jin, J.; Guo, A.Y.; Zhang, H.; Luo, J.; Gao, G. GSDS 2.0: An upgraded gene feature visualization server. Bioinformatics 2015, 31, 1296–1297. [Google Scholar] [CrossRef]
- Li, H.; Durbin, R. Fast and accurate short read alignment with Burrows-Wheeler transform. Bioinformatics 2009, 25, 1754–1760. [Google Scholar] [CrossRef]
- Excoffier, L.; Laval, G.; Schneider, S. Arlequin (version 3.0): An integrated software package for population genetics data analysis. Evol. Bioinform. Online 2007, 1, 47–50. [Google Scholar] [CrossRef]
- Walley, J.W.; Sartor, R.C.; Shen, Z.; Schmitz, R.J.; Wu, K.J.; Urich, M.A.; Nery, J.R.; Smith, L.G.; Schnable, J.C.; Ecker, J.R.; et al. Integration of omic networks in a developmental atlas of maize. Science 2016, 353, 814–818. [Google Scholar] [CrossRef]
- Dobin, A.; Davis, C.A.; Schlesinger, F.; Drenkow, J.; Zaleski, C.; Jha, S.; Batut, P.; Chaisson, M.; Gingeras, T.R. STAR: Ultrafast universal RNA-seq aligner. Bioinformatics 2013, 29, 15–21. [Google Scholar] [CrossRef]
- Trapnell, C.; Roberts, A.; Goff, L.; Pertea, G.; Kim, D.; Kelley, D.R.; Pimentel, H.; Salzberg, S.L.; Rinn, J.L.; Pachter, L. Differential gene and transcript expression analysis of RNA-seq experiments with TopHat and Cufflinks. Nat. Protoc. 2012, 7, 562–578. [Google Scholar] [CrossRef]
- Hou, J.; Ma, B.; Zuo, Y.; Guo, L.; Gao, S.; Wang, Y.; Liu, T. Rapid and sensitive detection of Curvularia lunata associated with maize leaf spot based on its Clg2p gene using semi-nested PCR. Lett. Appl. Microbiol. 2013, 56, 245–250. [Google Scholar] [CrossRef]
- Herrera, C.M.; Koutsoudis, M.D.; Wang, X.; Von Bodman, S.B. Pantoea stewartii subsp. stewartii Exhibits Surface Motility, Which is a Critical Aspect of Stewart’s Wilt Disease Development on Maize. Mol. Plant Microbe Interact. 2008, 21, 1359–1370. [Google Scholar] [CrossRef]
- Bustin, S.A.; Benes, V.; Garson, J.A.; Huggett, J.; Kubista, M.; Mueller, R.; Nolan, T.; Pfaffl, M.W.; Shipley, G.L.; Vandesompele, J.; et al. The MIQE Guidelines: Minimum Information for Publication of Quantitative Real-Time PCR Experiments. Clin. Chem. 2009, 55, 611–622. [Google Scholar] [CrossRef]
- Die, J.V.; Román, B. RNA quality assessment: A view from plant qPCR studies. J. Exp. Bot. 2012, 63, 6069–6077. [Google Scholar] [CrossRef]
- Zha, K.; Xie, H.; Ge, M.; Wang, Z.; Wang, Y.; Si, W.; Gu, L. Expression of Maize MADS Transcription Factor ZmES22 Negatively Modulates Starch Accumulation in Rice Endosperm. Int. J. Mol. Sci. 2019, 20, 483. [Google Scholar] [CrossRef]
- Vandesompele, J.; De Preter, K.; Pattyn, F.; Poppe, B.; Van Roy, N.; De Paepe, A.; Speleman, F. Accurate normalization of real-time quantitative RT-PCR data by geometric averaging of multiple internal control genes. Genome Biol. 2002, 3. [Google Scholar] [CrossRef]


© 2019 by the authors. Licensee MDPI, Basel, Switzerland. This article is an open access article distributed under the terms and conditions of the Creative Commons Attribution (CC BY) license (http://creativecommons.org/licenses/by/4.0/).