Article

Role of GOLPH3 and TPX2 in Neuroblastoma DNA Damage Response and Cell Resistance to Chemotherapy

1
Laboratorio Cellule Staminali Post Natali e Terapie Cellulari, IRCCS Giannina Gaslini, 16147 Genova, Italy
2
Divisione di Oncologia, IRCCS Giannina Gaslini, 16147 Genova, Italy
*
Authors to whom correspondence should be addressed.
Int. J. Mol. Sci. 2019, 20(19), 4764; https://doi.org/10.3390/ijms20194764
Submission received: 30 August 2019 / Revised: 16 September 2019 / Accepted: 20 September 2019 / Published: 25 September 2019
(This article belongs to the Section Molecular Oncology)

Abstract

:
Neuroblastoma (NB) is an aggressive, relapse-prone infancy tumor of the sympathetic nervous system and is the leading cause of death among preschool age diseases, so the search for novel therapeutic targets is crucial. Golgi phosphoprotein 3 (GOLPH3) has been reported to be involved in the development, and in the DNA damage response, of various human cancers. Golgi dispersal is a common feature of DNA damage response in mammalian cells. Understanding how cells react to DNA damage is essential in order to recognize the systems used to escape from elimination. We induced DNA damage in two human neuroblastoma cell lines by curcumin. The exposure of neuroblastoma cells to curcumin induced: (a) up-regulation of GOLPH3+ cells; (b) augmentation of double-strand breaks; (c) Golgi fragmentation and dispersal throughout the cytoplasm; (d) increase of apoptosis and autophagy; (e) increased expression of TPX2 oncoprotein, able to repair DNA damage. Primary neuroblastoma samples analysis confirmed these observations. Our findings suggest that GOLPH3 expression levels may represent a clinical marker of neuroblastoma patients’ responsiveness to DNA damaging therapies—and of possible resistance to them. Novel molecules able to interfere with GOLPH3 and TPX2 pathways may have therapeutic benefits when used in combination with standard DNA damaging therapeutic agents in neuroblastoma

1. Introduction

Neuroblastoma (NB), the most common extra-cranial solid cancer in children, originates from the precursors of the sympathetic nervous system [1]. The clinical courses of the disease are deeply heterogeneous: half of the tumors regresses spontaneously or after short therapies, while the other half is lethal in the majority of patients despite multiple stronger treatments. In the current treatment stratification system, the clinical and biological prognostic variables such as age at diagnosis, stage of disease, amplification of the proto-oncogene MYCN, and segmental chromosome copy number alterations are central for NB risk estimation [2,3,4,5,6]. However, a number of patients are deceased due to the resistance to chemotherapeutic drugs. Therefore, to prolong the survival of patients affected by NB, it is crucial to determine the mechanism underlying the occurrence of drug resistance and find an effective treatment method to increase drug sensitivity. Multidrug resistance is the major cause for treatment failure in cancer including NB [7,8,9,10,11,12,13,14,15]. NB cells can resist drugs taking advantage of apoptosis deregulation [9,10], the presence of cancer stem cells [11,12], alterations of drug targets [13], augmented capacity of DNA repair [14], and faster drug effluence [15]. Tumor cells can further enhance their drug resistance by exploiting autophagy mechanisms, a lysosomal degradation pathway responsible for the withdrawal of aged organelles and proteins [16]. Previous studies have indicated that therapeutic agents can induce autophagy, so facilitating cancer cell survival during drug-induced metabolic stress [16].
Golgi phosphoprotein 3 (GOLPH3) is a well conserved membrane protein located in the Golgi complex and is able to move between the Golgi and endosomal system, so that it is involved in Golgi trafficking and morphology preservation [17,18,19]. The GOLPH3 pathway is indispensable for vesicular trafficking from the Golgi to the plasma membrane [20]. GOLPH3 binds to MYO18A (Myosin XVIIIA) and, through this protein, it links Golgi to the actin cytoskeleton [21,22]. A side effect of GOLPH3 dependent trafficking is to create the extended ribbon shape of the Golgi. Disturbance of the pathway results in changes to both Golgi morphology and secretion, with functional consequences for the cell [17]. Field and colleagues reported that DNA dependent protein kinase complex, also known as DNA-PK, can phosphorylate GOLPH3 in response to DNA damage, and consequently, GOLPH3 increases its interaction with MYO18A and its tensile force on the Golgi, leading to Golgi vesiculation and dispersal throughout the cytoplasm [23]. The DNA-PK/GOLPH3/MYO18A pathway is necessary for cell survival after DNA damage, and therefore GOLPH3 over-expression gives resistance to elimination induced by DNA damaging agents [24,25,26,27]. Errors in DNA damage response contribute to genome instability, a hallmark of cancer, which, in turn, leads to tumor progression [28]. Previous research has demonstrated that GOLPH3 is a proto-oncogene [29,30,31,32,33,34]. The over-expression of GOLPH3 confers survival benefit to cancer cells, suggesting that Golgi fragmentation is necessary for cell survival. Thus, Golgi fragmentation may contribute to tumor development and maintenance, giving rise to an endless loop [35,36]. Understanding the cellular response to DNA damage is crucial for discerning the mechanism by which many chemotherapeutic agents kill tumor cells and the mechanism of escape from elimination [37].
Several studies have paid attention to the relationship between TPX2 and DNA damage response [38,39]. TPX2 is a protein involved in spindle apparatus assembly and specifically associated to cell microtubules [38]. The TPX2 gene is part of the signature of chromosomal instability from specific genes whose expression was consistently correlated with clinical outcome in multiple human cancers [40,41], and it has been identified as a driving oncogene in different kinds of neoplasm [42,43,44,45,46,47]. To the best of our knowledge, GOLPH3 associated resistance to chemotherapy and its underlying mechanism in human NB have not been previously reported. In this study, we show the linkage between DNA damage and GOLPH3 expression in NB, and how this can cause cell resistance even through higher levels of TPX2 oncogene expression.

2. Results

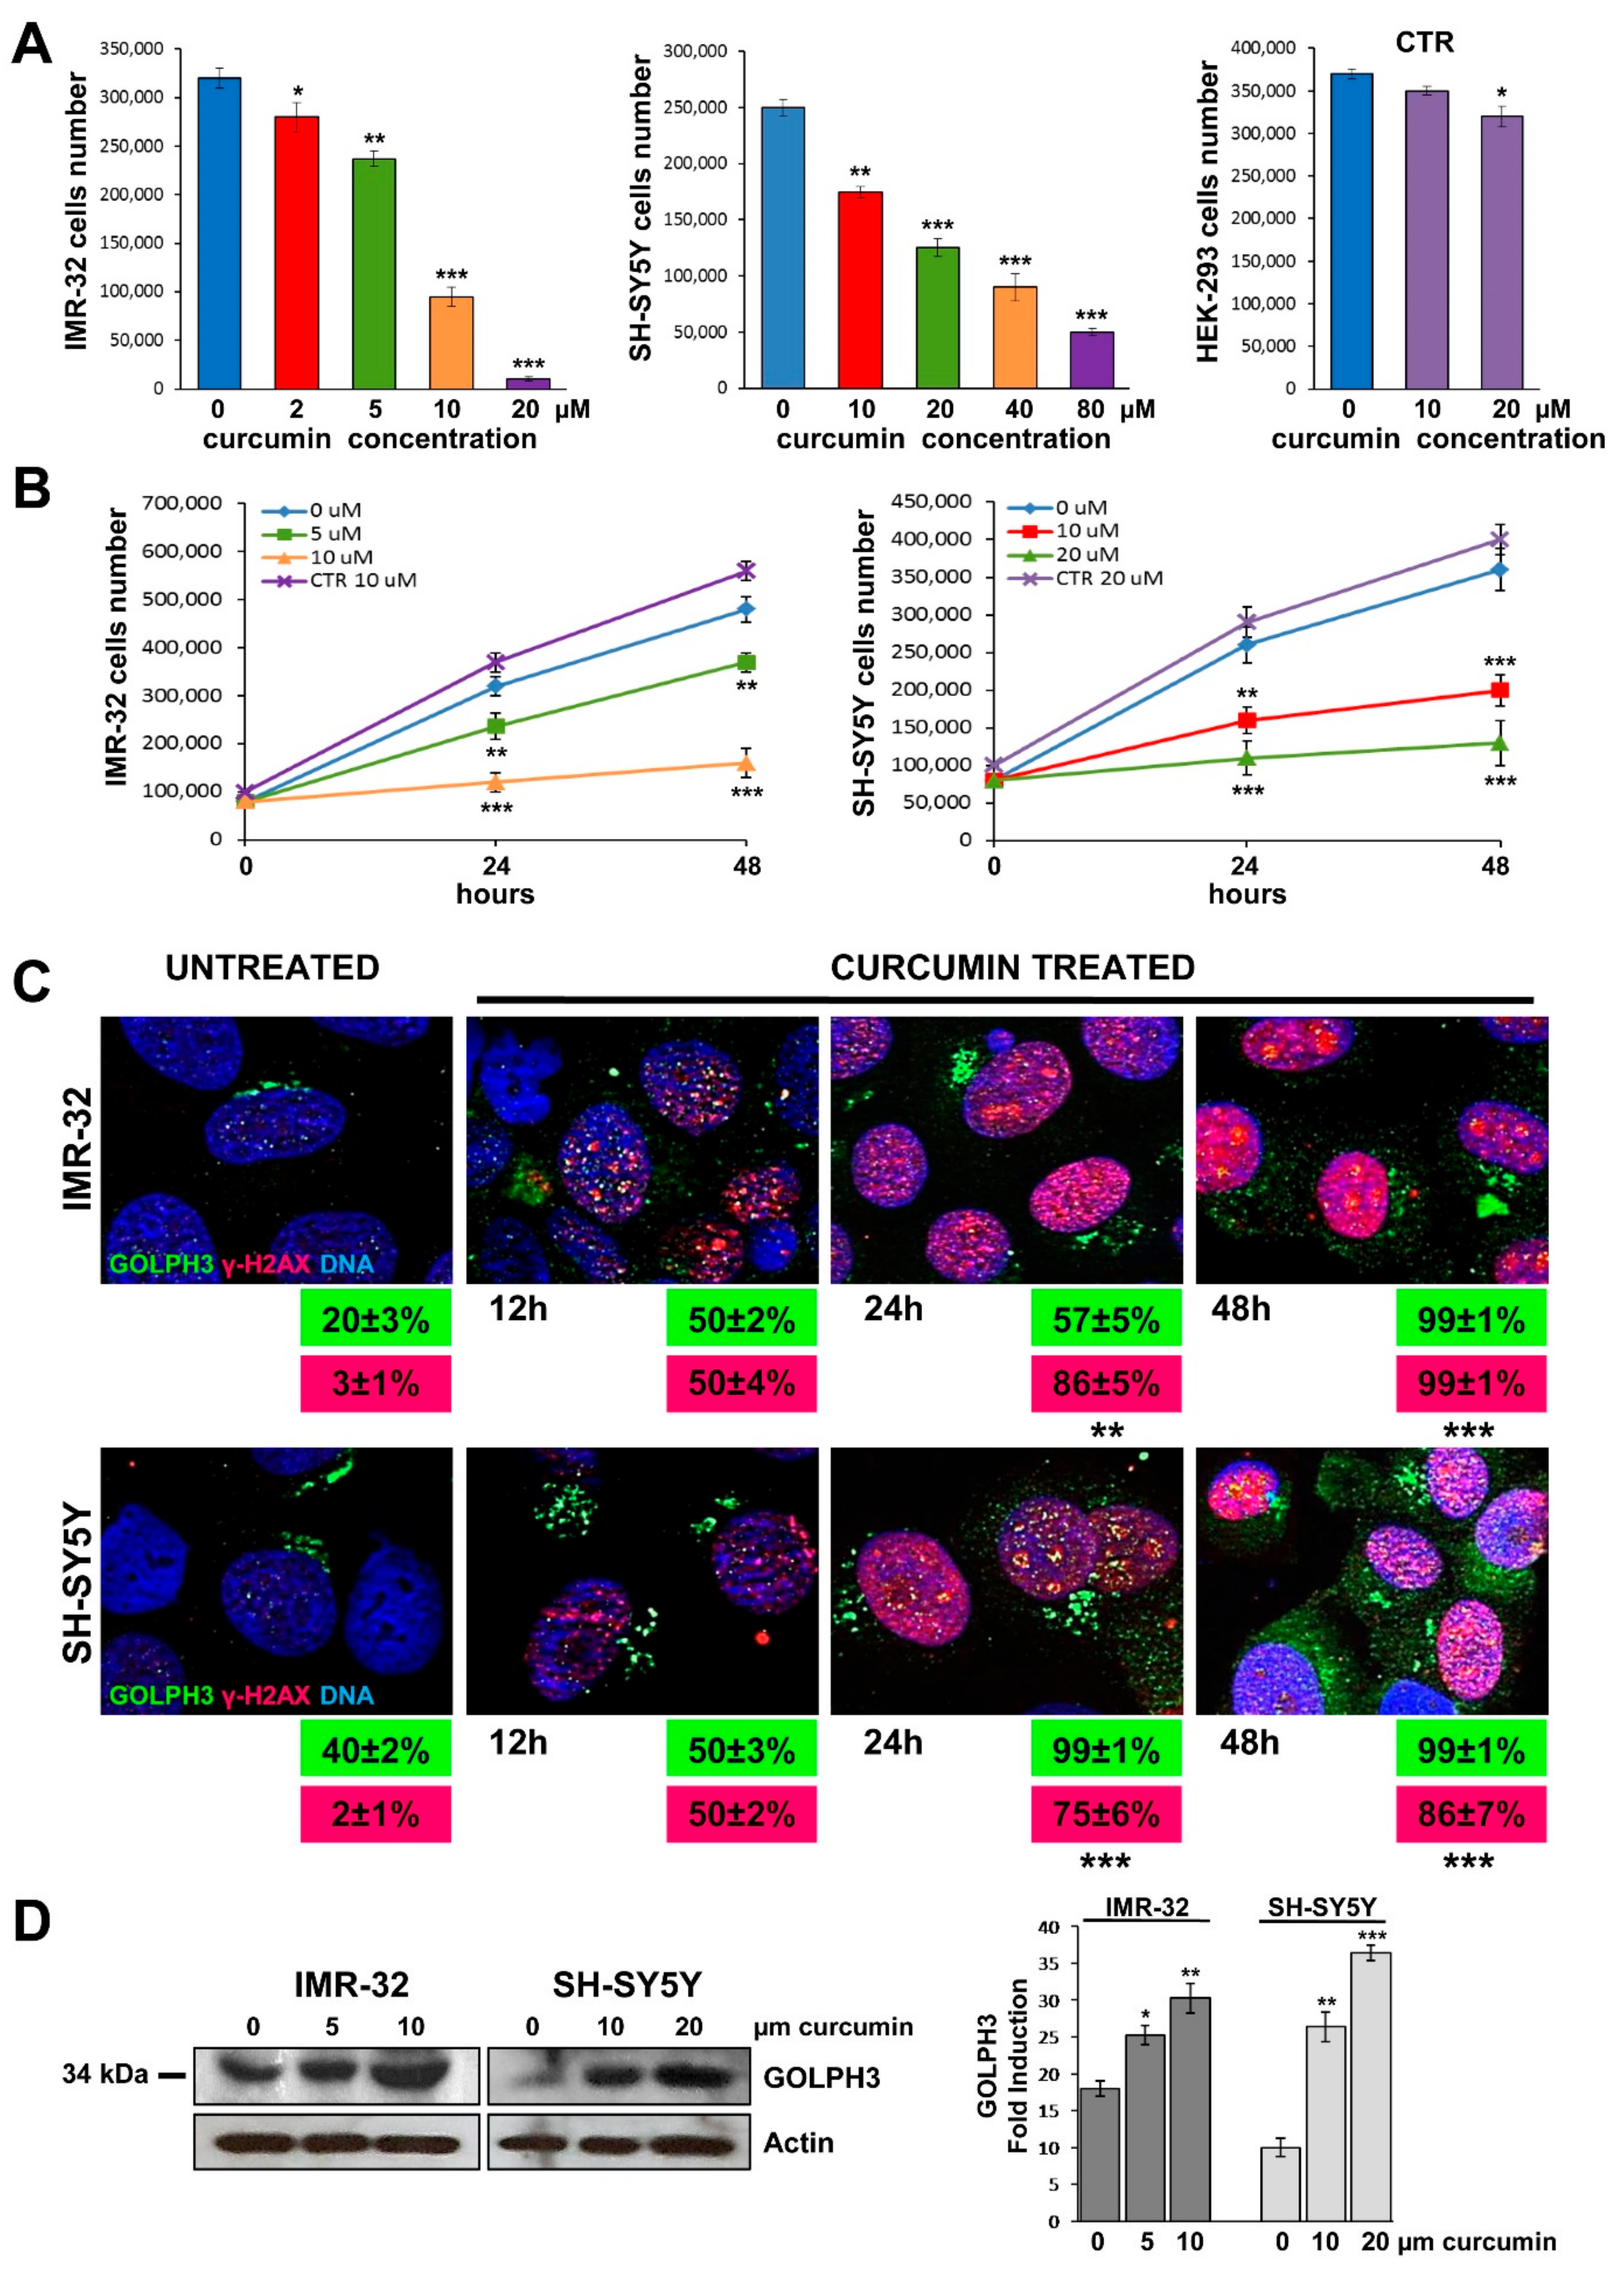
2.1. Cytotoxicity Induced by Curcumin

We induced DNA damage by treating with curcumin two NB cell lines IMR-32, MYCN amplified, and SH-SY5Y, MYCN single copy with strong c-MYC protein expression, in a dose dependent manner for 24 h at 37 °C. The cell viability was measured vs untreated cells as an indicator for cytotoxicity of the compound. Growth rate was sensibly lower with 5–10 µM of curcumin for IMR-32 cells, and with 10–20 µM of curcumin for SH-SY5Y cells. As a non-tumorigenic control cell line, we chose human embryonic kidney HEK-293 cells (see Materials and Methods), that were cultured for 24 h with the highest curcumin concentrations used for each NB cell line, with no effects on their viability (Figure 1A).
Next, we tested the effects of curcumin treatment on cells proliferation after 24 and 48 h, using the two most significant concentrations of the compound for each cell line. We observed a clear growth decline of treated NB cells vs. control cells after 48 h of incubation with 10 µM of curcumin for IMR-32 cells, or with 20 µM for SH-SY5Y cells (Figure 1B). Then we performed all the following experiments treating IMR-32 and SH-SY5Y cells for 48 h with curcumin 10 and 20 µM respectively.

2.2. Curcumin Induces DNA Damage in Neuroblastoma Cells

For further confirmation that curcumin reduced the percentage of total viable NB cells through the induction of DNA damage, we performed an analysis of γH2AX expression by immunofluorescence analysis on NB cells treated with curcumin. The histone H2AX is a highly conserved globular protein that is structurally involved in packaging and organizing DNA into chromatin. Upon phosphorylation of serine-139 near the C-terminus end, γH2AX fast localizes to DNA double-strand breaks [48]. As such, γH2AX is generally considered as a marker of DNA damage [49]. An example of γH2AX foci induced by treatment with curcumin is shown in Figure 1C. The results demonstrated a significant increase in number of DNA damage foci into the nucleus of curcumin treated NB cells compared with untreated cells. The percentage of γH2AX+ nuclei, that was almost absent in untreated cells, increased sensibly after 12 and 24 h and reached 86% or 100% after 48 h of curcumin treatment (p < 0.001) (Figure 1C). The non-tumorigenic control HEK-293 cell line cultured with curcumin 20 µM for 48 h displayed no double-strand breaks, so confirming that curcumin effect inducing DNA damage is specific for cancer cell lines (Supplementary Figure S1).

2.3. Curcumin Promotes GOLPH3 Up-Regulation and Dispersal of Golgi in Neuroblastoma Cells

We examined whether DNA damage affects Golgi morphology in NB cells. For this purpose we performed immunofluorescence analysis on NB cells treated with curcumin 10 µM for IMR-32 or 20 µM for SH-SY5Y for 12, 24 and 48 h. GOLPH3 expression increased over time together with DNA damage, and we observed an extended ribbon shape of the Golgi in association with augmentation of double-strand breaks γH2AX+(Figure 1C). Exposure to each treatment of curcumin caused Golgi morphology to change drastically from the usual perinuclear ribbon to punctuate fragments dispersed throughout the cytoplasm. The percentage of GOLPH3+ NB cells treated with curcumin in independent experiments increased, starting from 20% or 40% in untreated cells, to 100% after 48 h (p < 0.001) (Figure 1C).
Moreover, NB cells cultured in different concentrations of curcumin for 48 h were lysed and subjected to Western blot. GOLPH3 protein level resulted augmented after treatment with curcumin, especially when used more concentrated (Figure 1D).
We treated IMR-32 and SH-SY5Y cells with other three chemotherapy compounds, chosen for their known anti-proliferative actions on NB cells, in order to test their effect on inducing DNA damage and Golgi fragmentation: (a) Rapamycin, an inducer of autophagy by inhibiting mTOR, the Ser/Thr protein kinase that regulates cell growth and metabolism in response to environmental cues [50] (b) Bortezomib, a chemoterapic agent belonging to proteasome inhibitors family, with stabilizing effect on molecules able to block cell survival and cell cycle progression [51] and (c) Colchicine, a microtubule disrupting agent that induces apoptosis in NB cells [52]. The immunofluorescence analysis on cells treated with different concentrations of these compounds for 48 h showed a lower γH2AX and GOLPH3 positivity in comparison with the results obtained with curcumin, in terms of both number of positive cells and staining intensity (Supplementary Figure S2 and Appendix A). On this basis, we decided to carry on the experiments with curcumin, which causes evident DNA damage and Golgi fragmentation, and less cytotoxicity to NB cells.

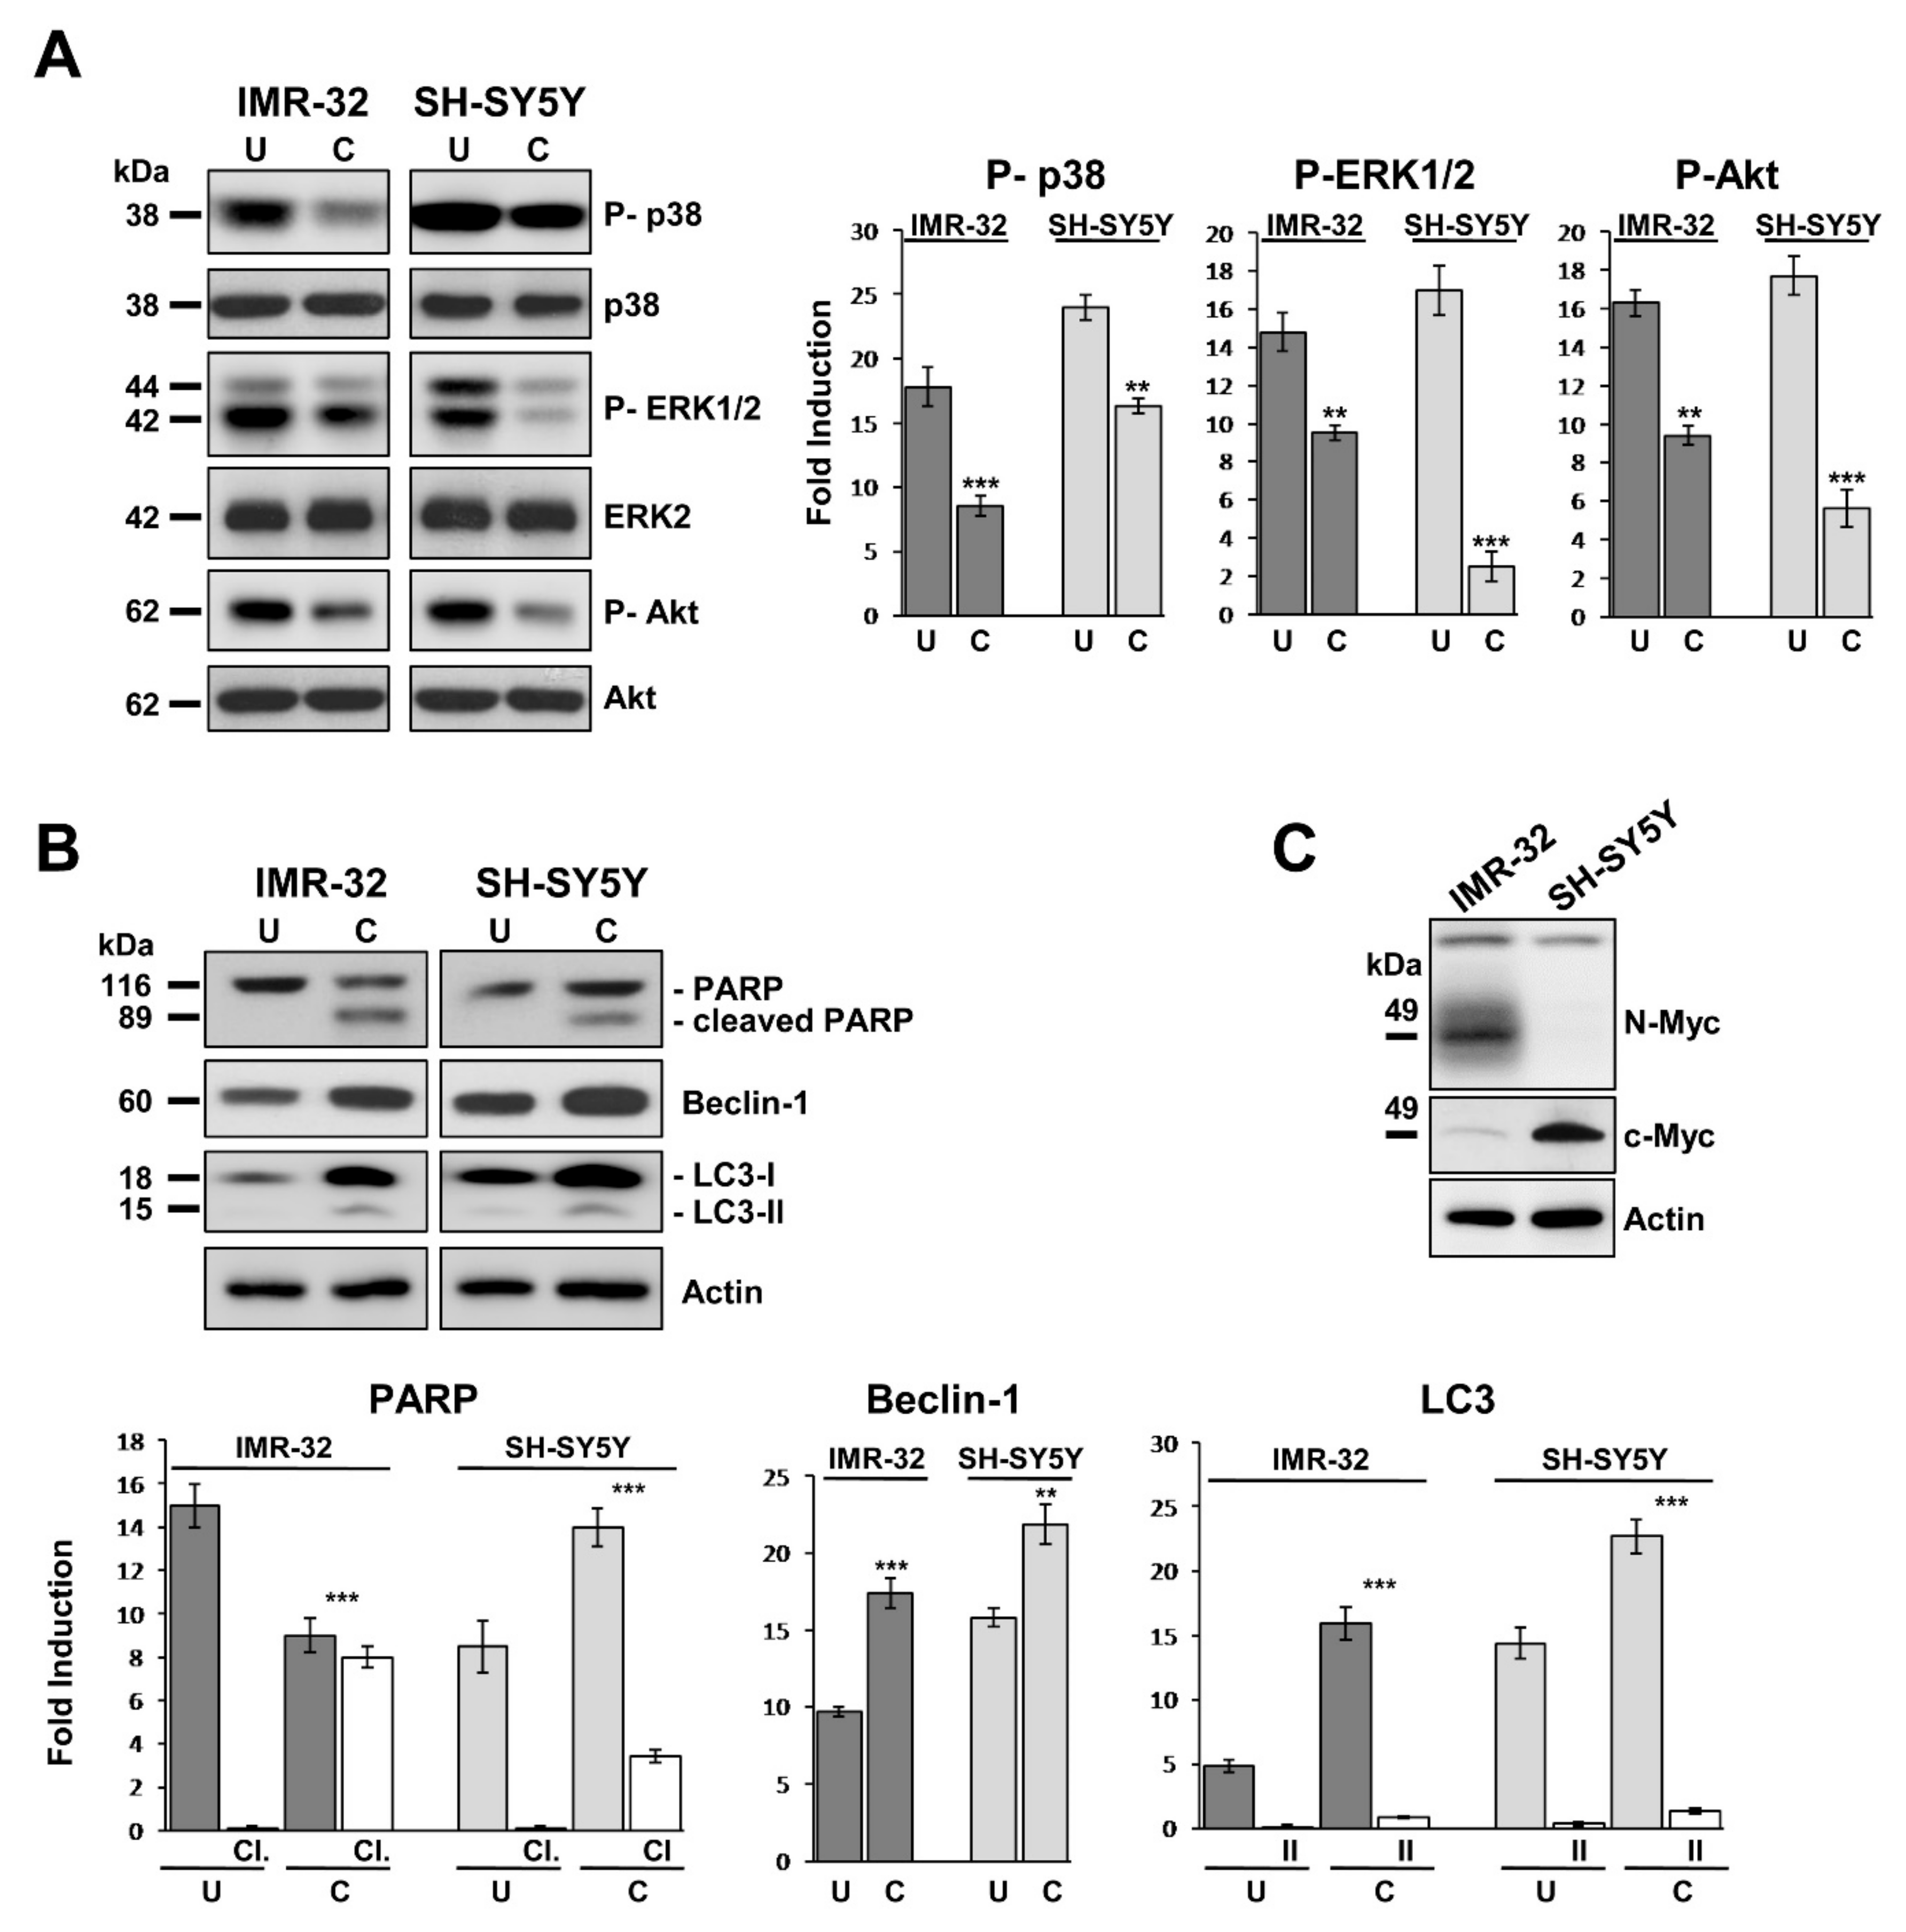
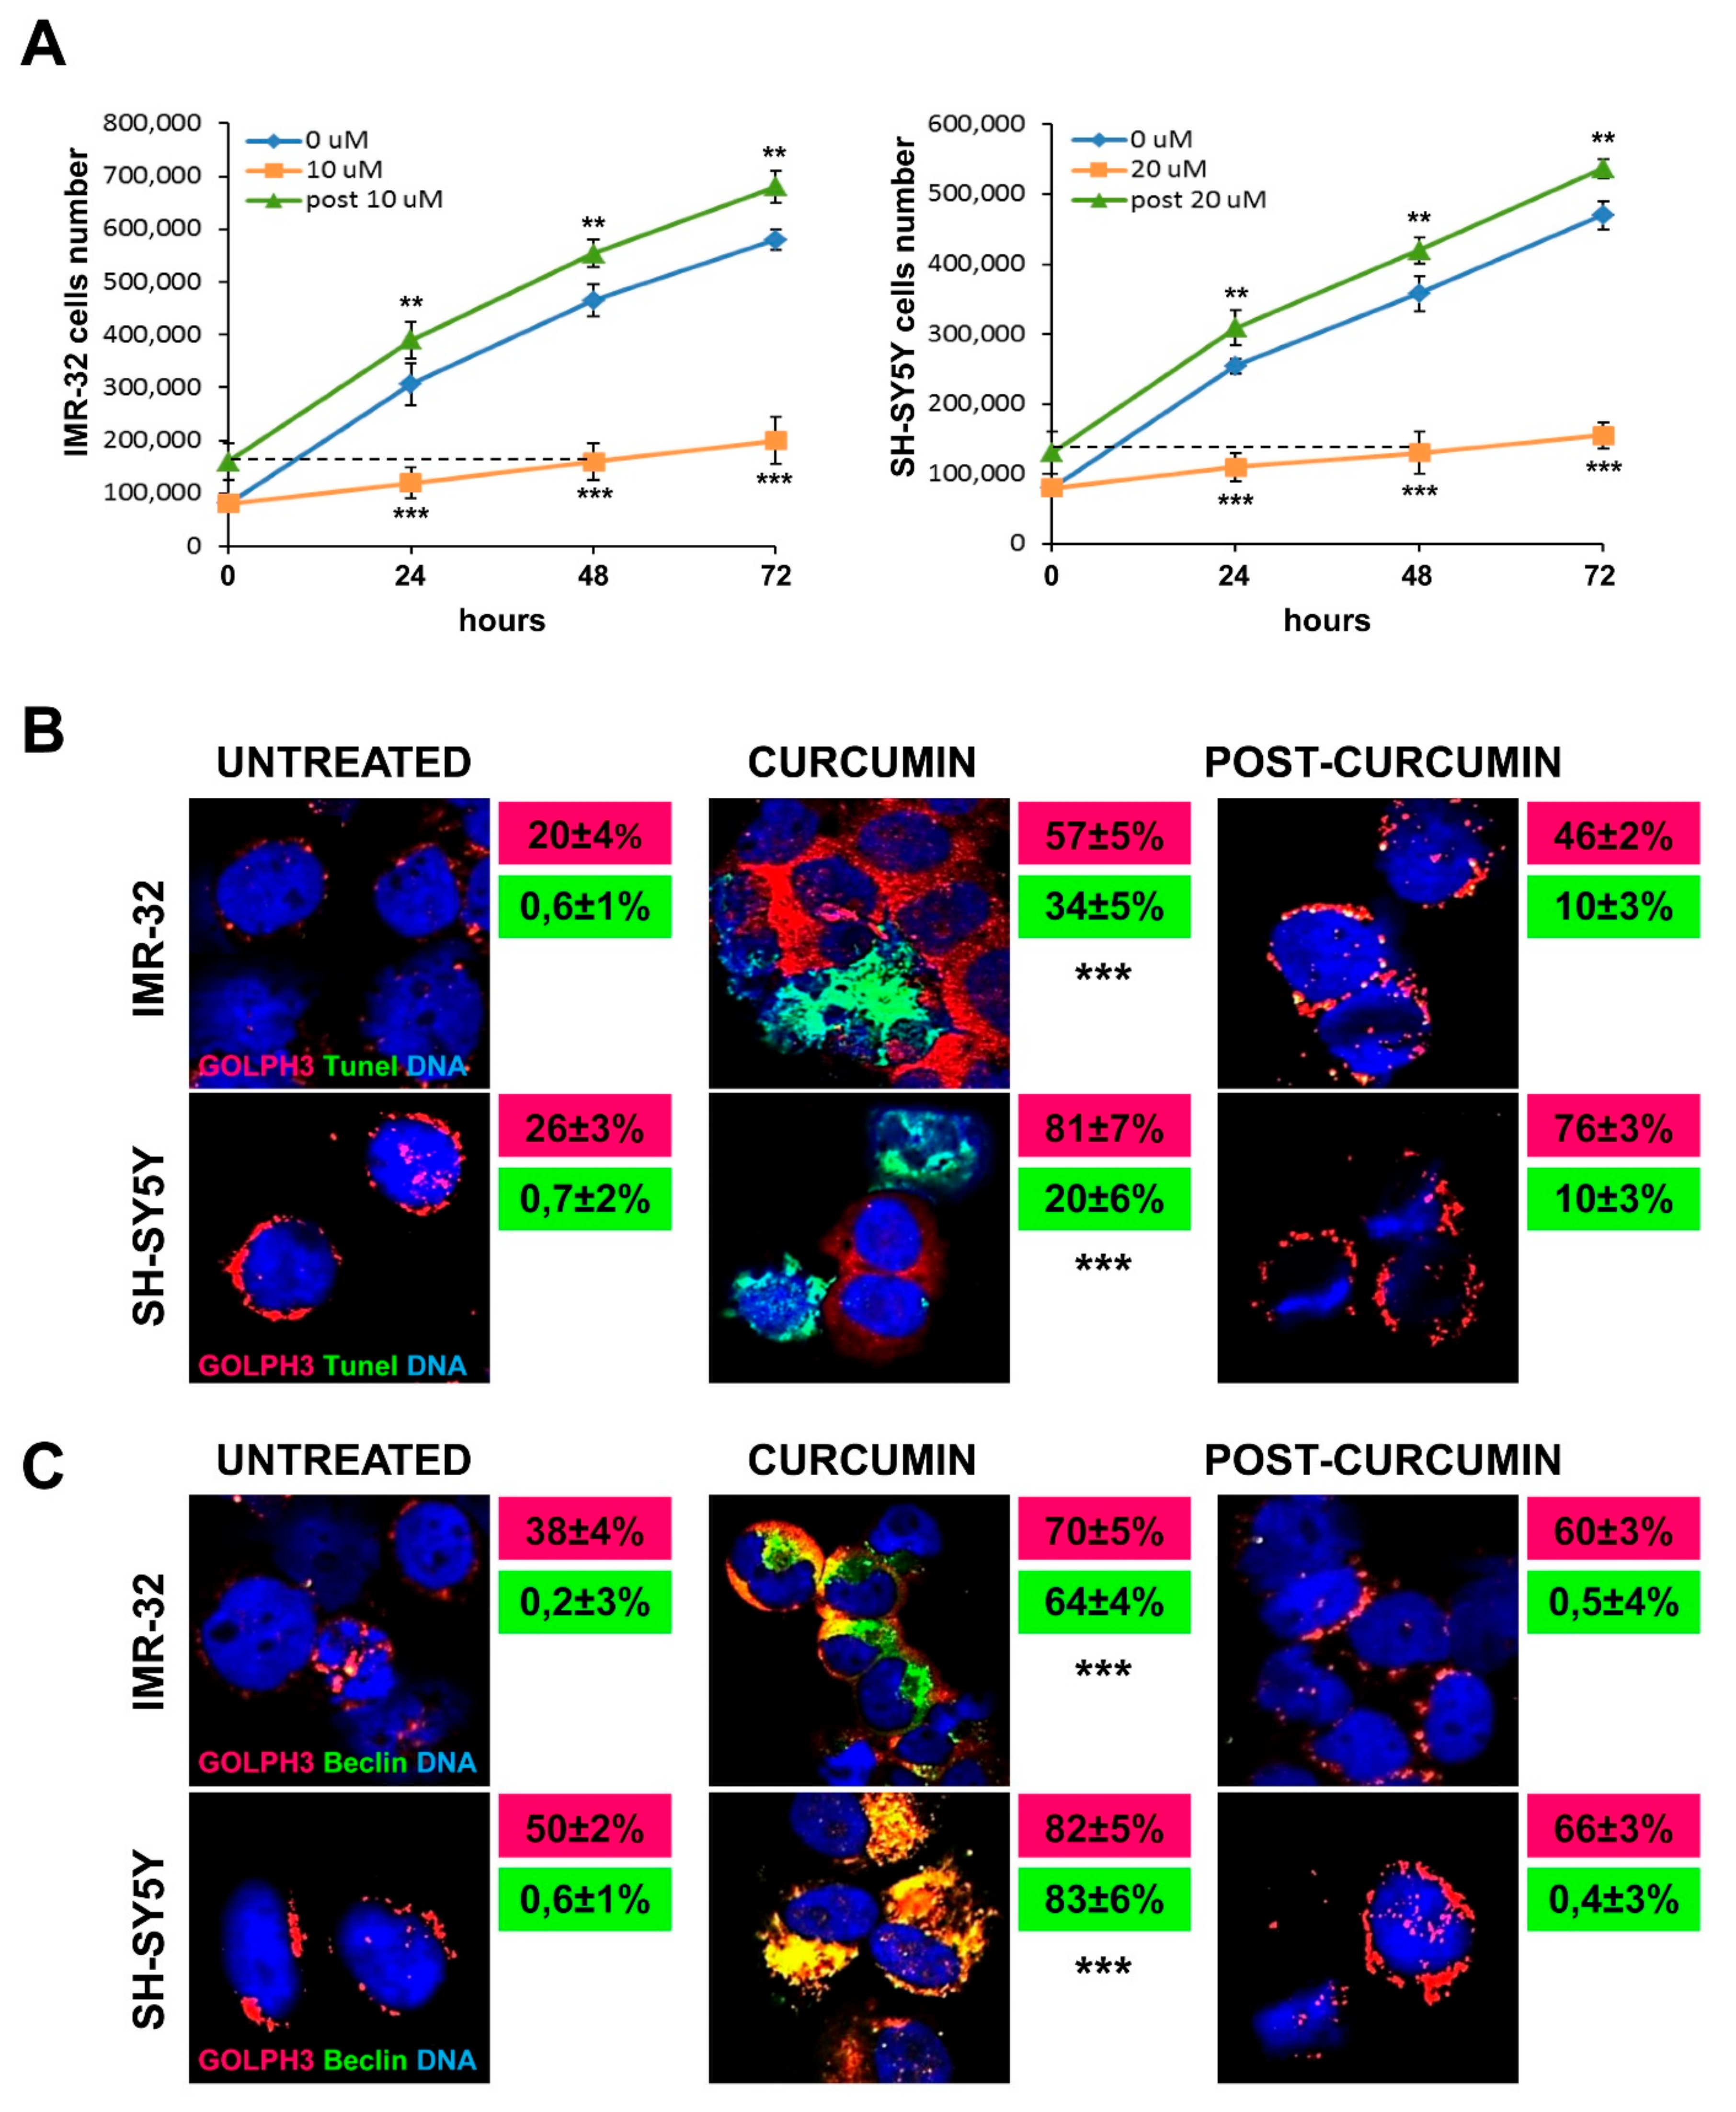
2.4. Curcumin Reduces Activation of MAP-Kinases and Induces Apoptosis and Autophagy in Neuroblastoma Cells

Next, we considered how curcumin inhibits NB cell proliferation by inducing DNA damage and Golgi dispersal. The reduced growth rate observed in Figure 1B was associated with decreased of phosphorylation of mitogen-activated protein kinases (MAPKs) (Figure 2A). Cells cultured in presence of curcumin for 48 h showed that p38 MAPK (p38) was 50% less activated than control for IMR-32, and 30% less for SH-SY5Y. In the same way, extracellular signal regulated kinase 1 and 2 (ERK1/2) resulted 36% less phosphorylated in treated IMR-32 cells and 85% less in treated SH-SY5Y than their respective controls (Figure 2A).
We evaluated the activation state of RAC-alpha serine-threonine-protein kinase (AKT), the major downstream effector of phosphoinositide 3-kinase (PI3K), to investigate the connection between curcumin effects and apoptosis in NB cells. The phosphorylation of Akt prevents apoptosis and induces cell proliferation and transformation. Treatment with curcumin caused in IMR-32 and SH-SY5Y cells a decrease of P-Akt by approximately 40% and 68% respectively in comparison to controls (Figure 2A). Apoptosis induction is proven by the DNA repair enzyme Poly ADP-Ribose Polymerase (PARP) cleavage, which was detectable exclusively in curcumin treated NB cells (Figure 2B). In addition, cells reaction to curcumin triggered autophagy, as evidenced by up-regulation of Beclin-1 and autophagic-vesicle-form LC3-II (Figure 2B). IMR-32 cells are MYCN amplified while SH-SY5Y cells are MYCN single copy with high c-MYC protein expression (Figure 2C).
Subsequently, we exposed NB cells to curcumin for 48 h to evaluate cells recovery degree after compound removal. To address this issue, we changed the medium with fresh complete DMEM and we counted viable cells after 24, 48 and 72 h. Cells growth, that was drastically fallen with curcumin treatment, started rapidly rising again already after 24 h from compound depletion for both IMR-32 and SH-SY5Y cells, and remaining constant over time. The comparison between the daily growth rate of untreated cells and the cells recovered from 48 h of curcumin treatment, indicated that the latter grew likewise the former, or even increasing their number every day of 10 cells more than controls, on average. On the contrary, during curcumin treatment NB cells increased themselves of 120–100 units less than controls on average every day. These experiments proved that curcumin affected proliferation without irreversibly compromising NB cells faculties, allowing cells to restore or actually to improve their growth rate (Figure 3A).
Immunofluorescence experiments revealed that in both IMR-32 and SH-SY5Y cells apoptosis induced by curcumin occurred not in concurrence with Golgi dispersal (Figure 3B). On the contrary, autophagy induced by curcumin treatment, showed by Beclin-1 expression, appeared co-localized with higher GOLPH3 expression (Figure 3C). Curcumin depletion after 48 h led to: (a) TUNEL-positive staining dramatically decreased; (b) slight downregulation of GOLPH3 expression; (c) rapid condensation of the Golgi apparatus around the nuclei; (d) inhibition of autophagy (Figure 3B,C).

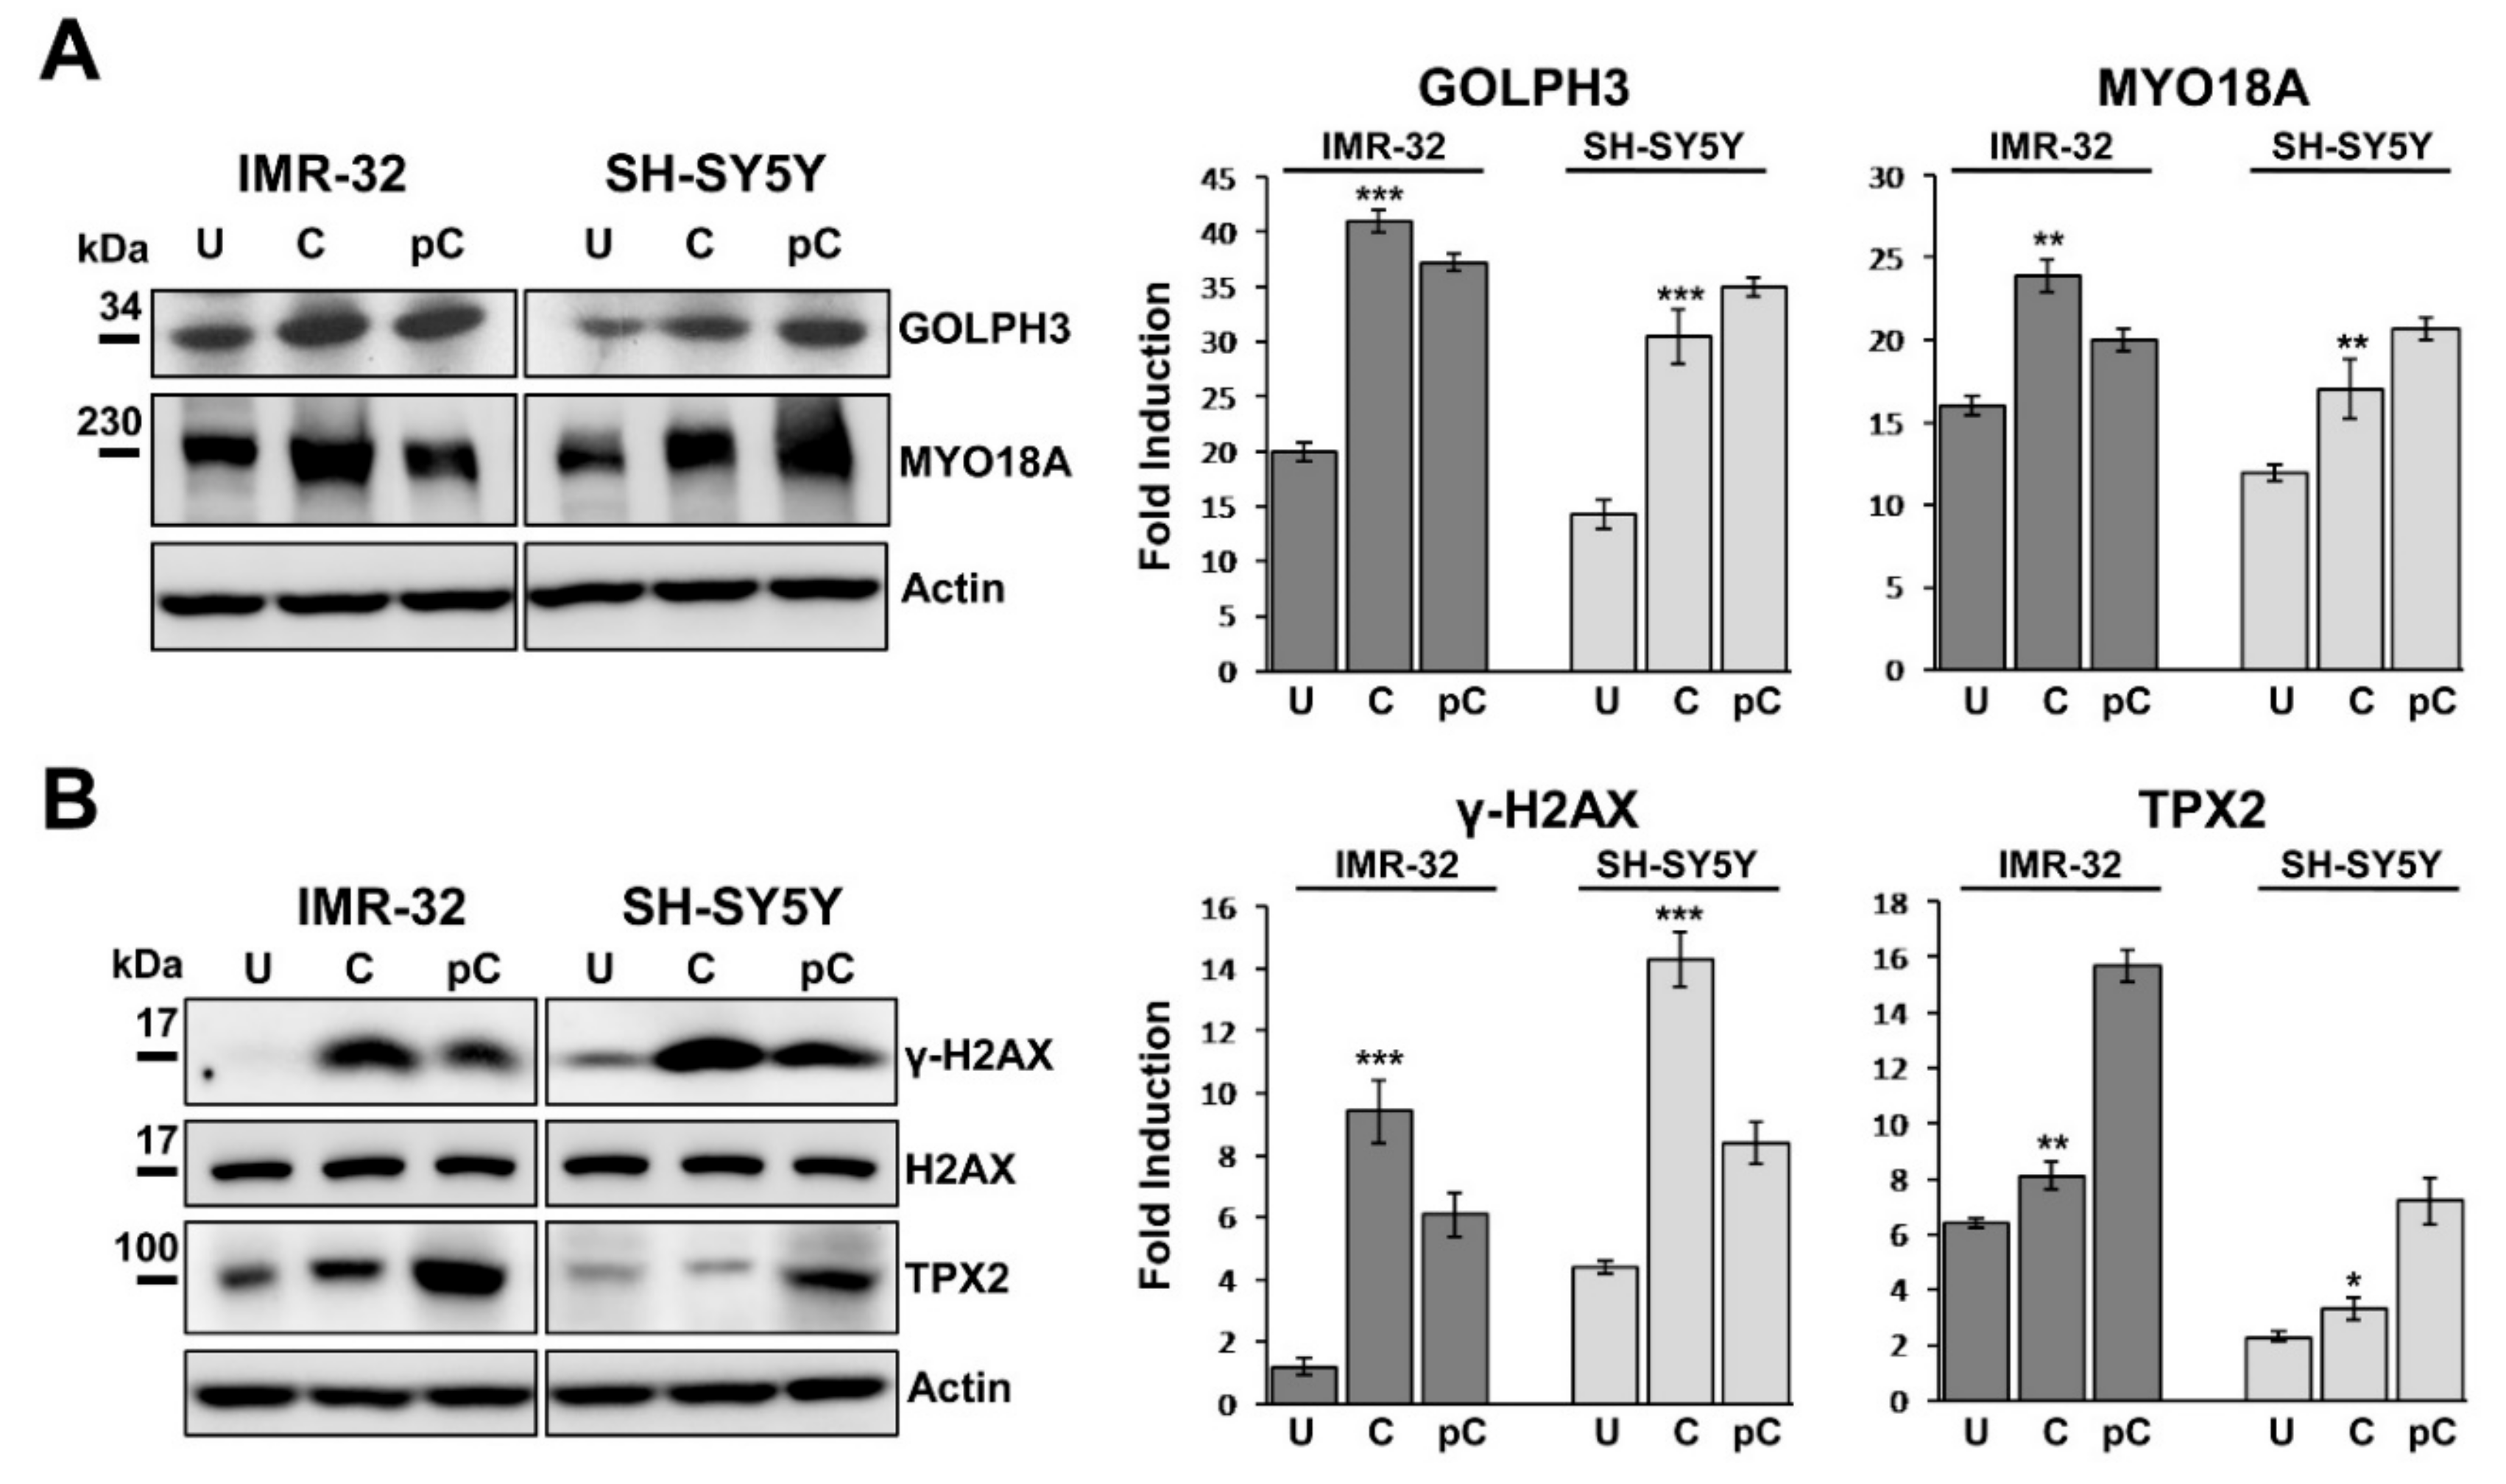
2.5. GOLPH3 Up-Regulation is Related With Higher Expression of MYO18A and TPX2 in Neuroblastoma Cells

The phosphorylation of GOLPH3 results in augmented interaction between GOLPH3 and MYO18A, a novel putative cancer driver, well known to be involved in the Golgi pathway [21,22,23]. We next examined by western blotting if the augmented expression of GOLPH3 in curcumin treated NB cells could be associated with MYO18A expression and Golgi dispersal. IMR-32 and SH-SY5Y cultured in presence of curcumin for 48 h indicated that MYO18A was clearly more expressed than in control cells, following GOLPH3 trend (Figure 4A). After 48 h since curcumin was removed from the growth medium, remarkable GOLPH3 and MYO18A expression was still maintained in both NB cell lines (Figure 4A).
The expression of γH2AX in cells cultured for 48 h with curcumin was extremely high, while it was almost undetectable in the untreated cells, as already observed in immunofluorescence (Figure 4B). After 48 h from curcumin depletion, γH2AX expression was halved (Figure 4B). Since TPX2 plays a principal function in the DNA damage response pathway and co-localizes with γ-H2AX at chromosomal double strand breakage sites [38,39], we analyzed the expression of TPX2 on the same cells and we found an opposite trend: TPX2 was activated by curcumin treatment but it resulted evidently up-regulated when the cells recovered from that treatment started growing again, indicating a proliferation comparable to control cells (Figure 3A, 4B). TPX2, by inducing DNA repair capacity, may help cells eliminating DNA breaks, so diminishing γH2AX level and increasing proliferation because of a restored cell physiology [53]. Augmented proliferation may be an effect of the autophagic reaction too, occurring in the resistant cells after curcumin treatment. We found different basal TPX2 protein expression in the two NB cell lines analyzed, which may be correlated to the fact that IMR32 cells are MYCN amplified and SH-SY5Y cells are MYCN single copy with strong c-MYC protein expression (Figure 2C, 4B).

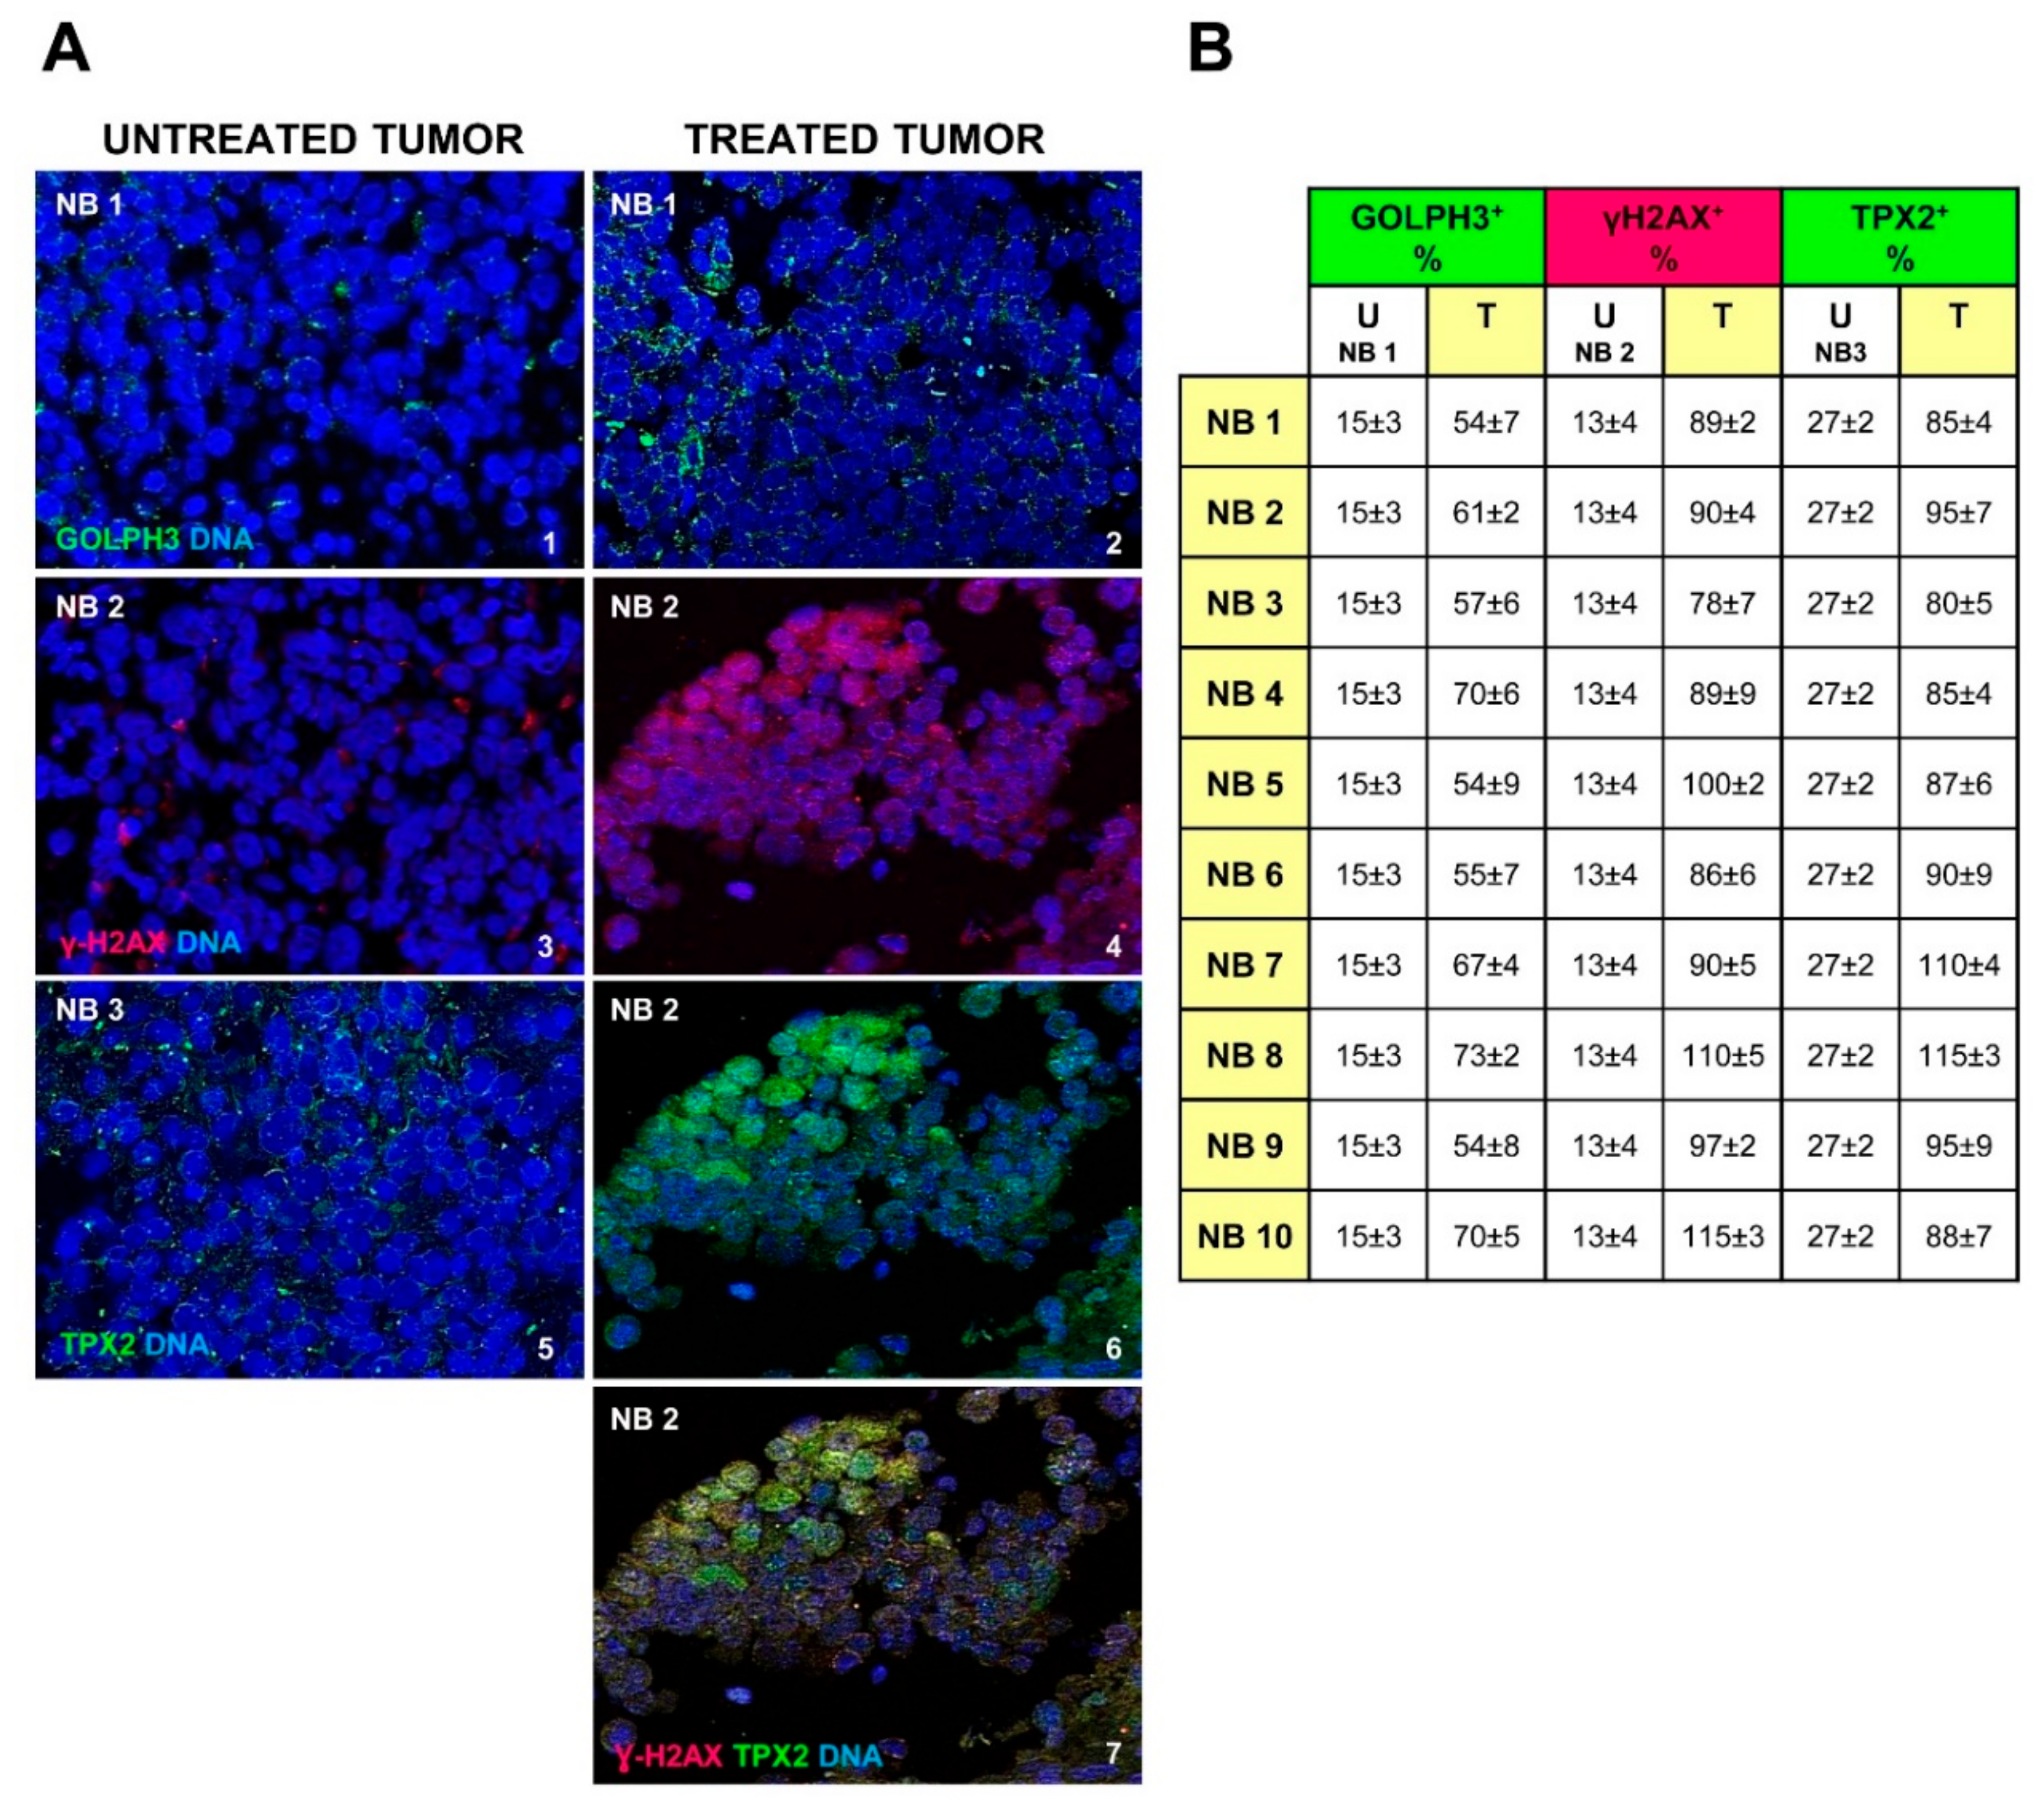
2.6. Chemotherapy Increases GOLPH3, γH2AX and TPX2 Expression in Neuroblastoma Cells

We stained by immunofluorescence 10 NB human tissue sections coming from post-chemotherapy surgical resection. The clinical characteristics of the examined NB tumors are detailed in Table 1. Anti-GOLPH3 staining showed an increase of this molecule expression, and dispersal of the Golgi in the cytoplasm (GOLPH3+ cells 62 ± 3% on average vs. 15 ± 3% in the untreated tumor; p < 0.001), denoting an effect very similar to that observed in curcumin treated NB cells (Figure 5A(1,2) and Figure 5B). In the same manner, we showed higher positivity of γH2AX in cell nuclei of post-chemotherapy tumors (Figure 5A(3,4) and Figure 5B) (γH2AX+ cells 94 ± 2% on average vs. 13 ± 4% in the untreated tumor; p < 0.001) indicating augmented DNA damage. All samples obtained from patients with high-risk disease after rapid COJEC chemotherapy treatment, exhibit TPX2 expression increased too (TPX2+ cells 93 ± 3% on average vs. 27 ± 2% in the untreated tumor; p < 0.001) (Figure 5A(5,6) and Figure 5B), suggesting that TPX2 protein level is closely connected to DNA damage response in NB, and can confer upon the resistant cells the capability to rescue and to reproduce themselves again (Figure 5A(7)).
The genomic profile analysis of DNA extracted from these NB tumors obtained by pre-chemotherapy surgical resection, performed with array-CGH, disclosed multiple segmental chromosome gains or losses, index of disease poor outcome [54], in all specimens. Partial chromosome losses were most often detected for chromosomes 1p and 11q, while partial chromosome gain for 17q, and MYCN amplification was observed in eight samples out of 10 (Table 1).

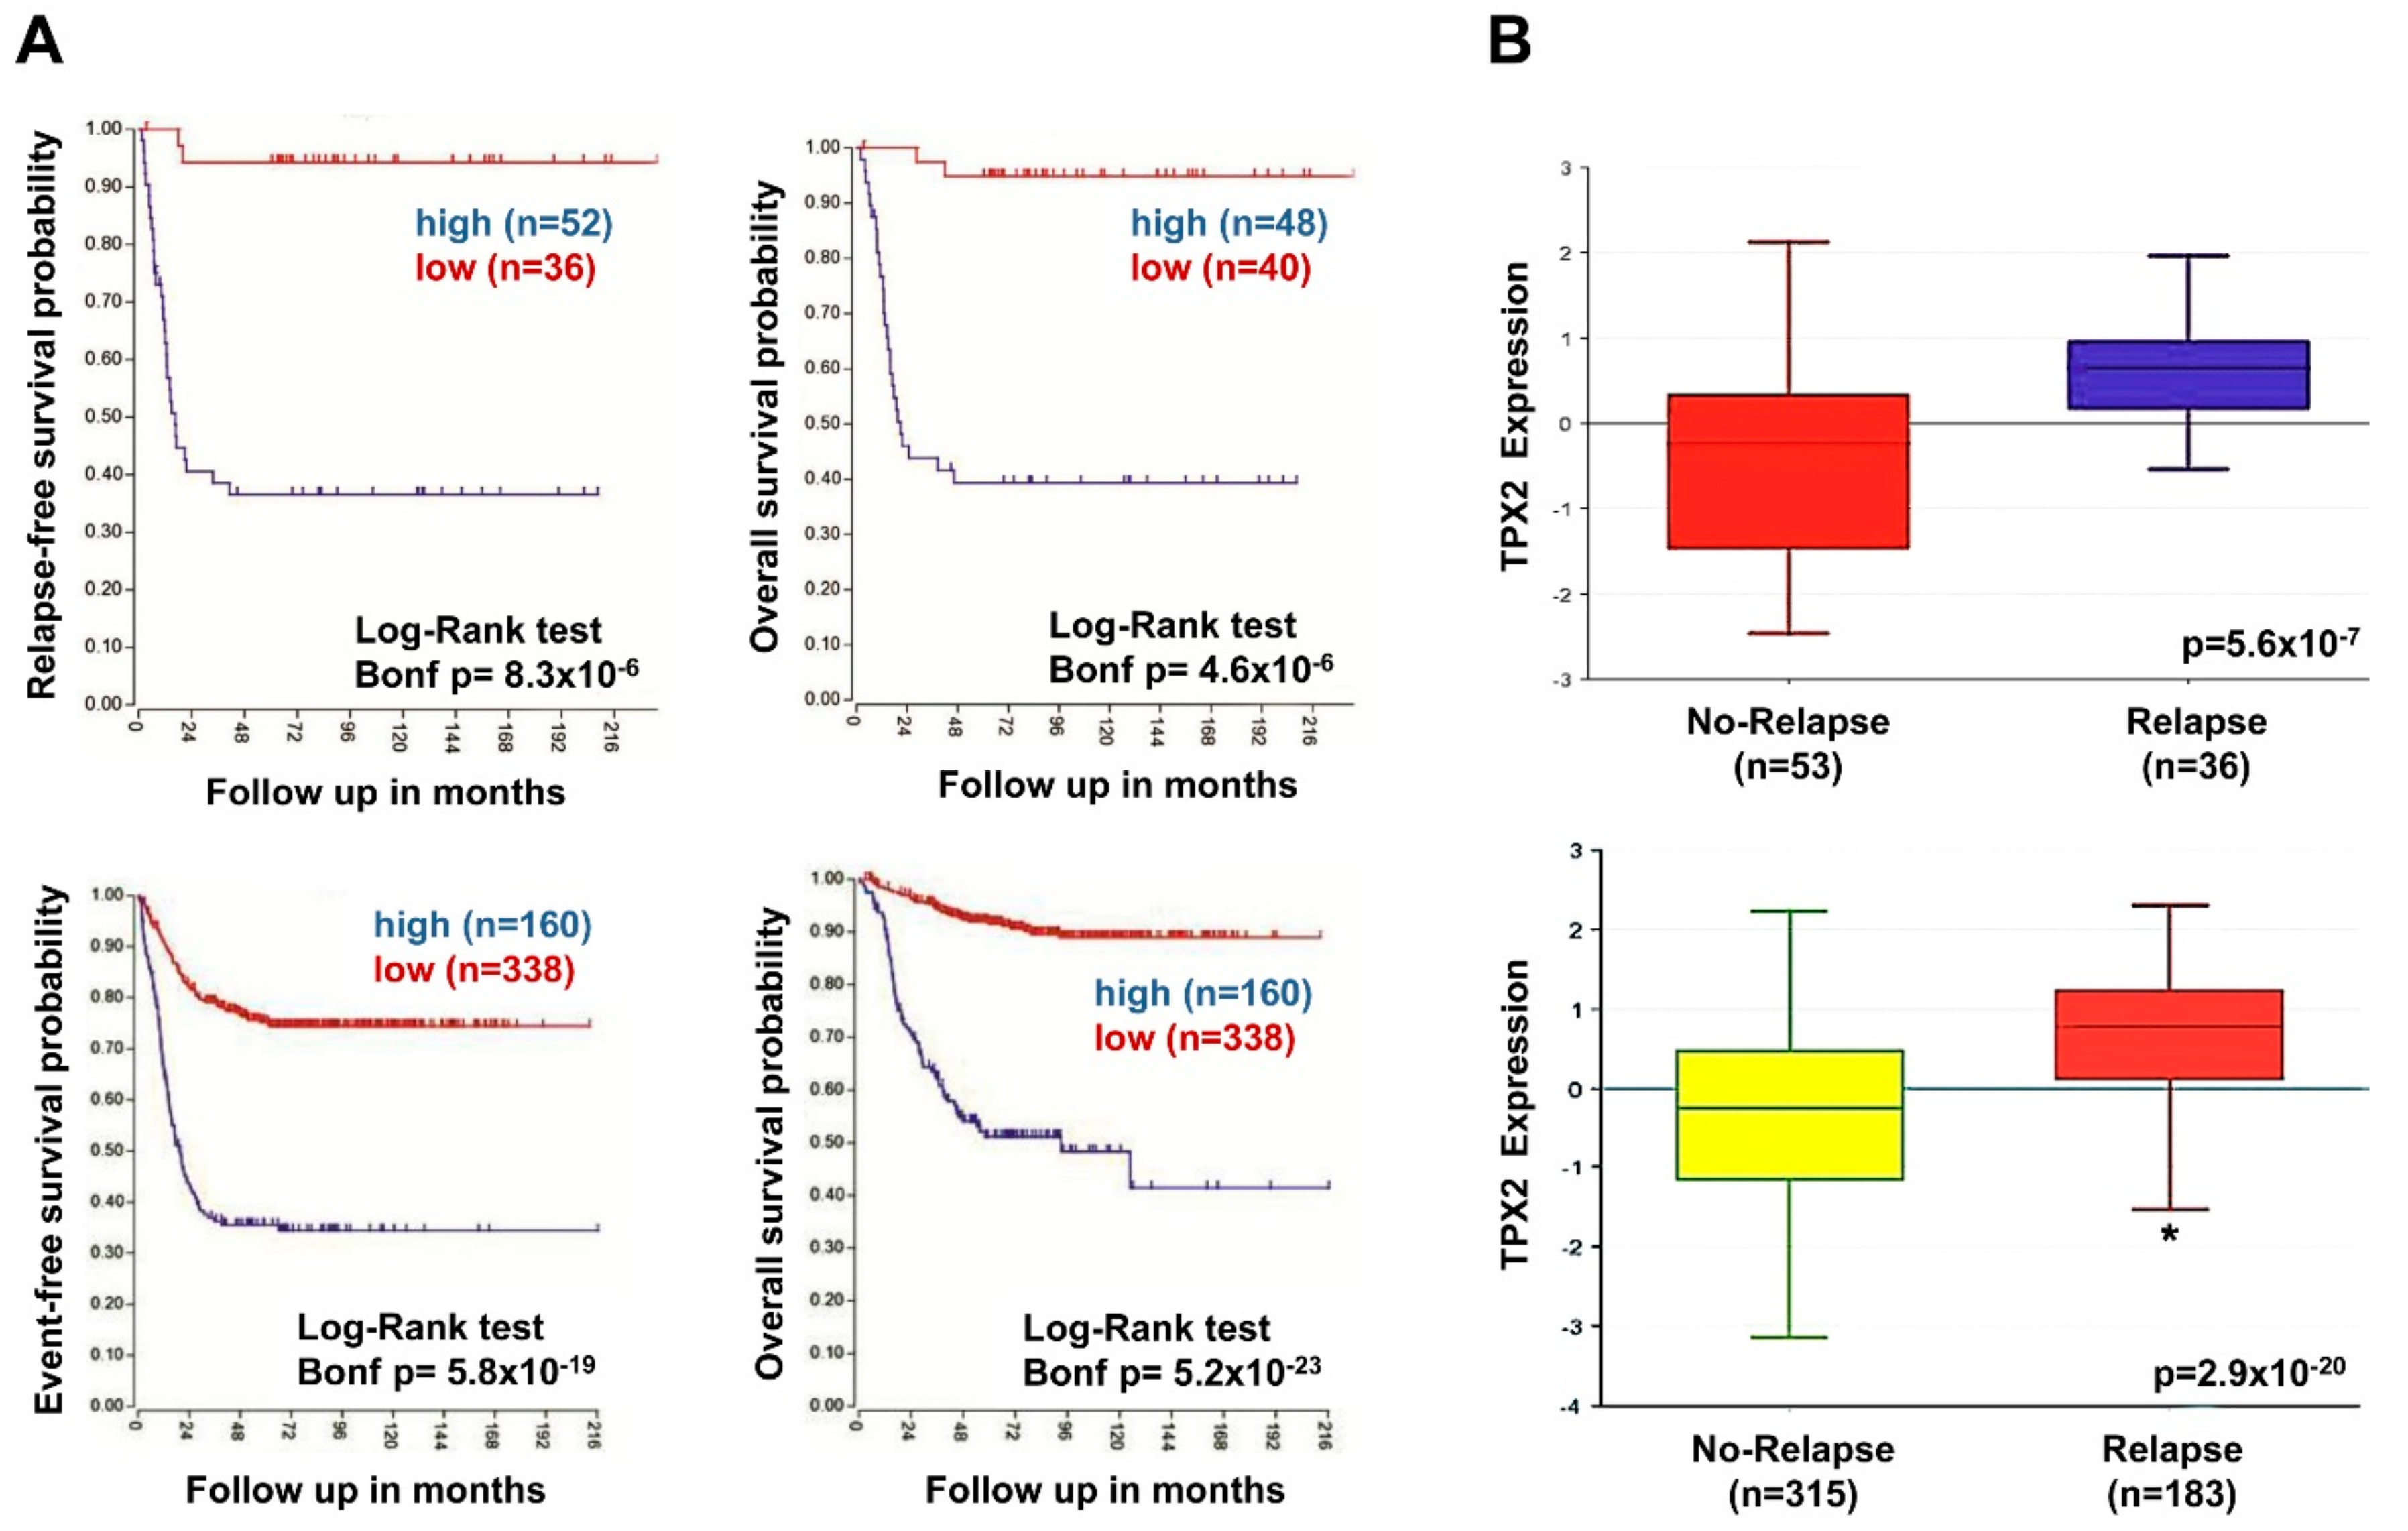
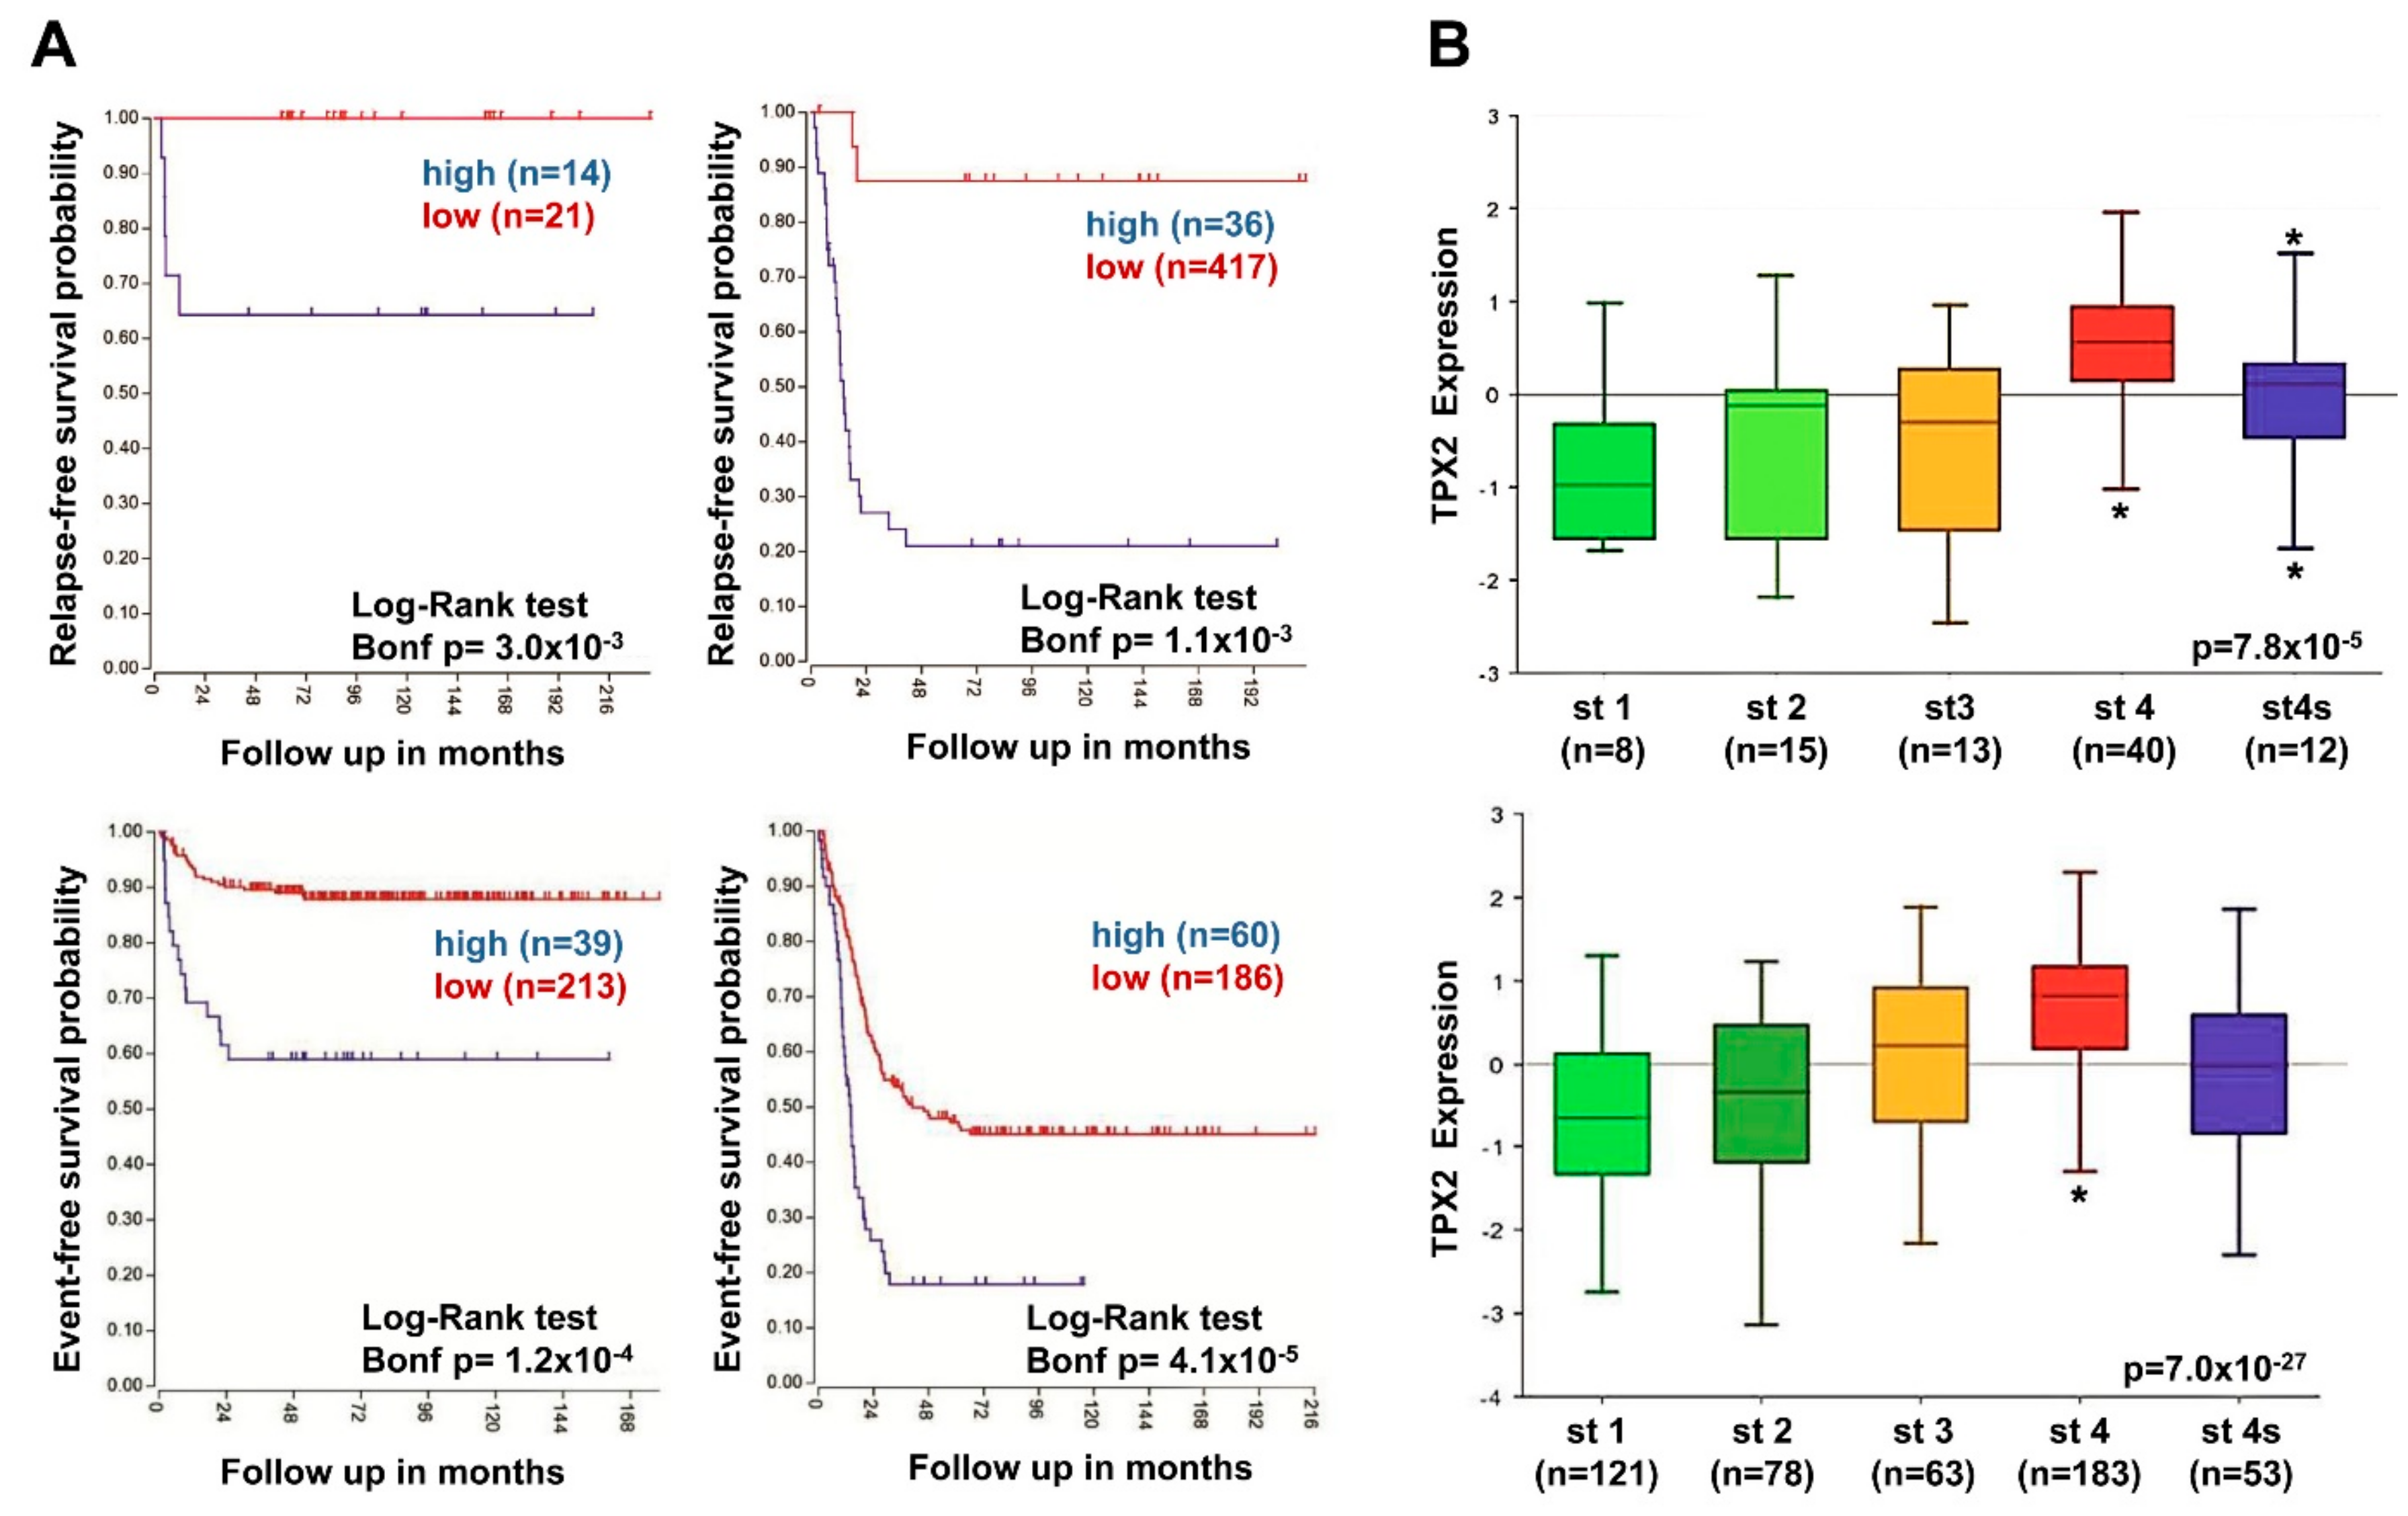
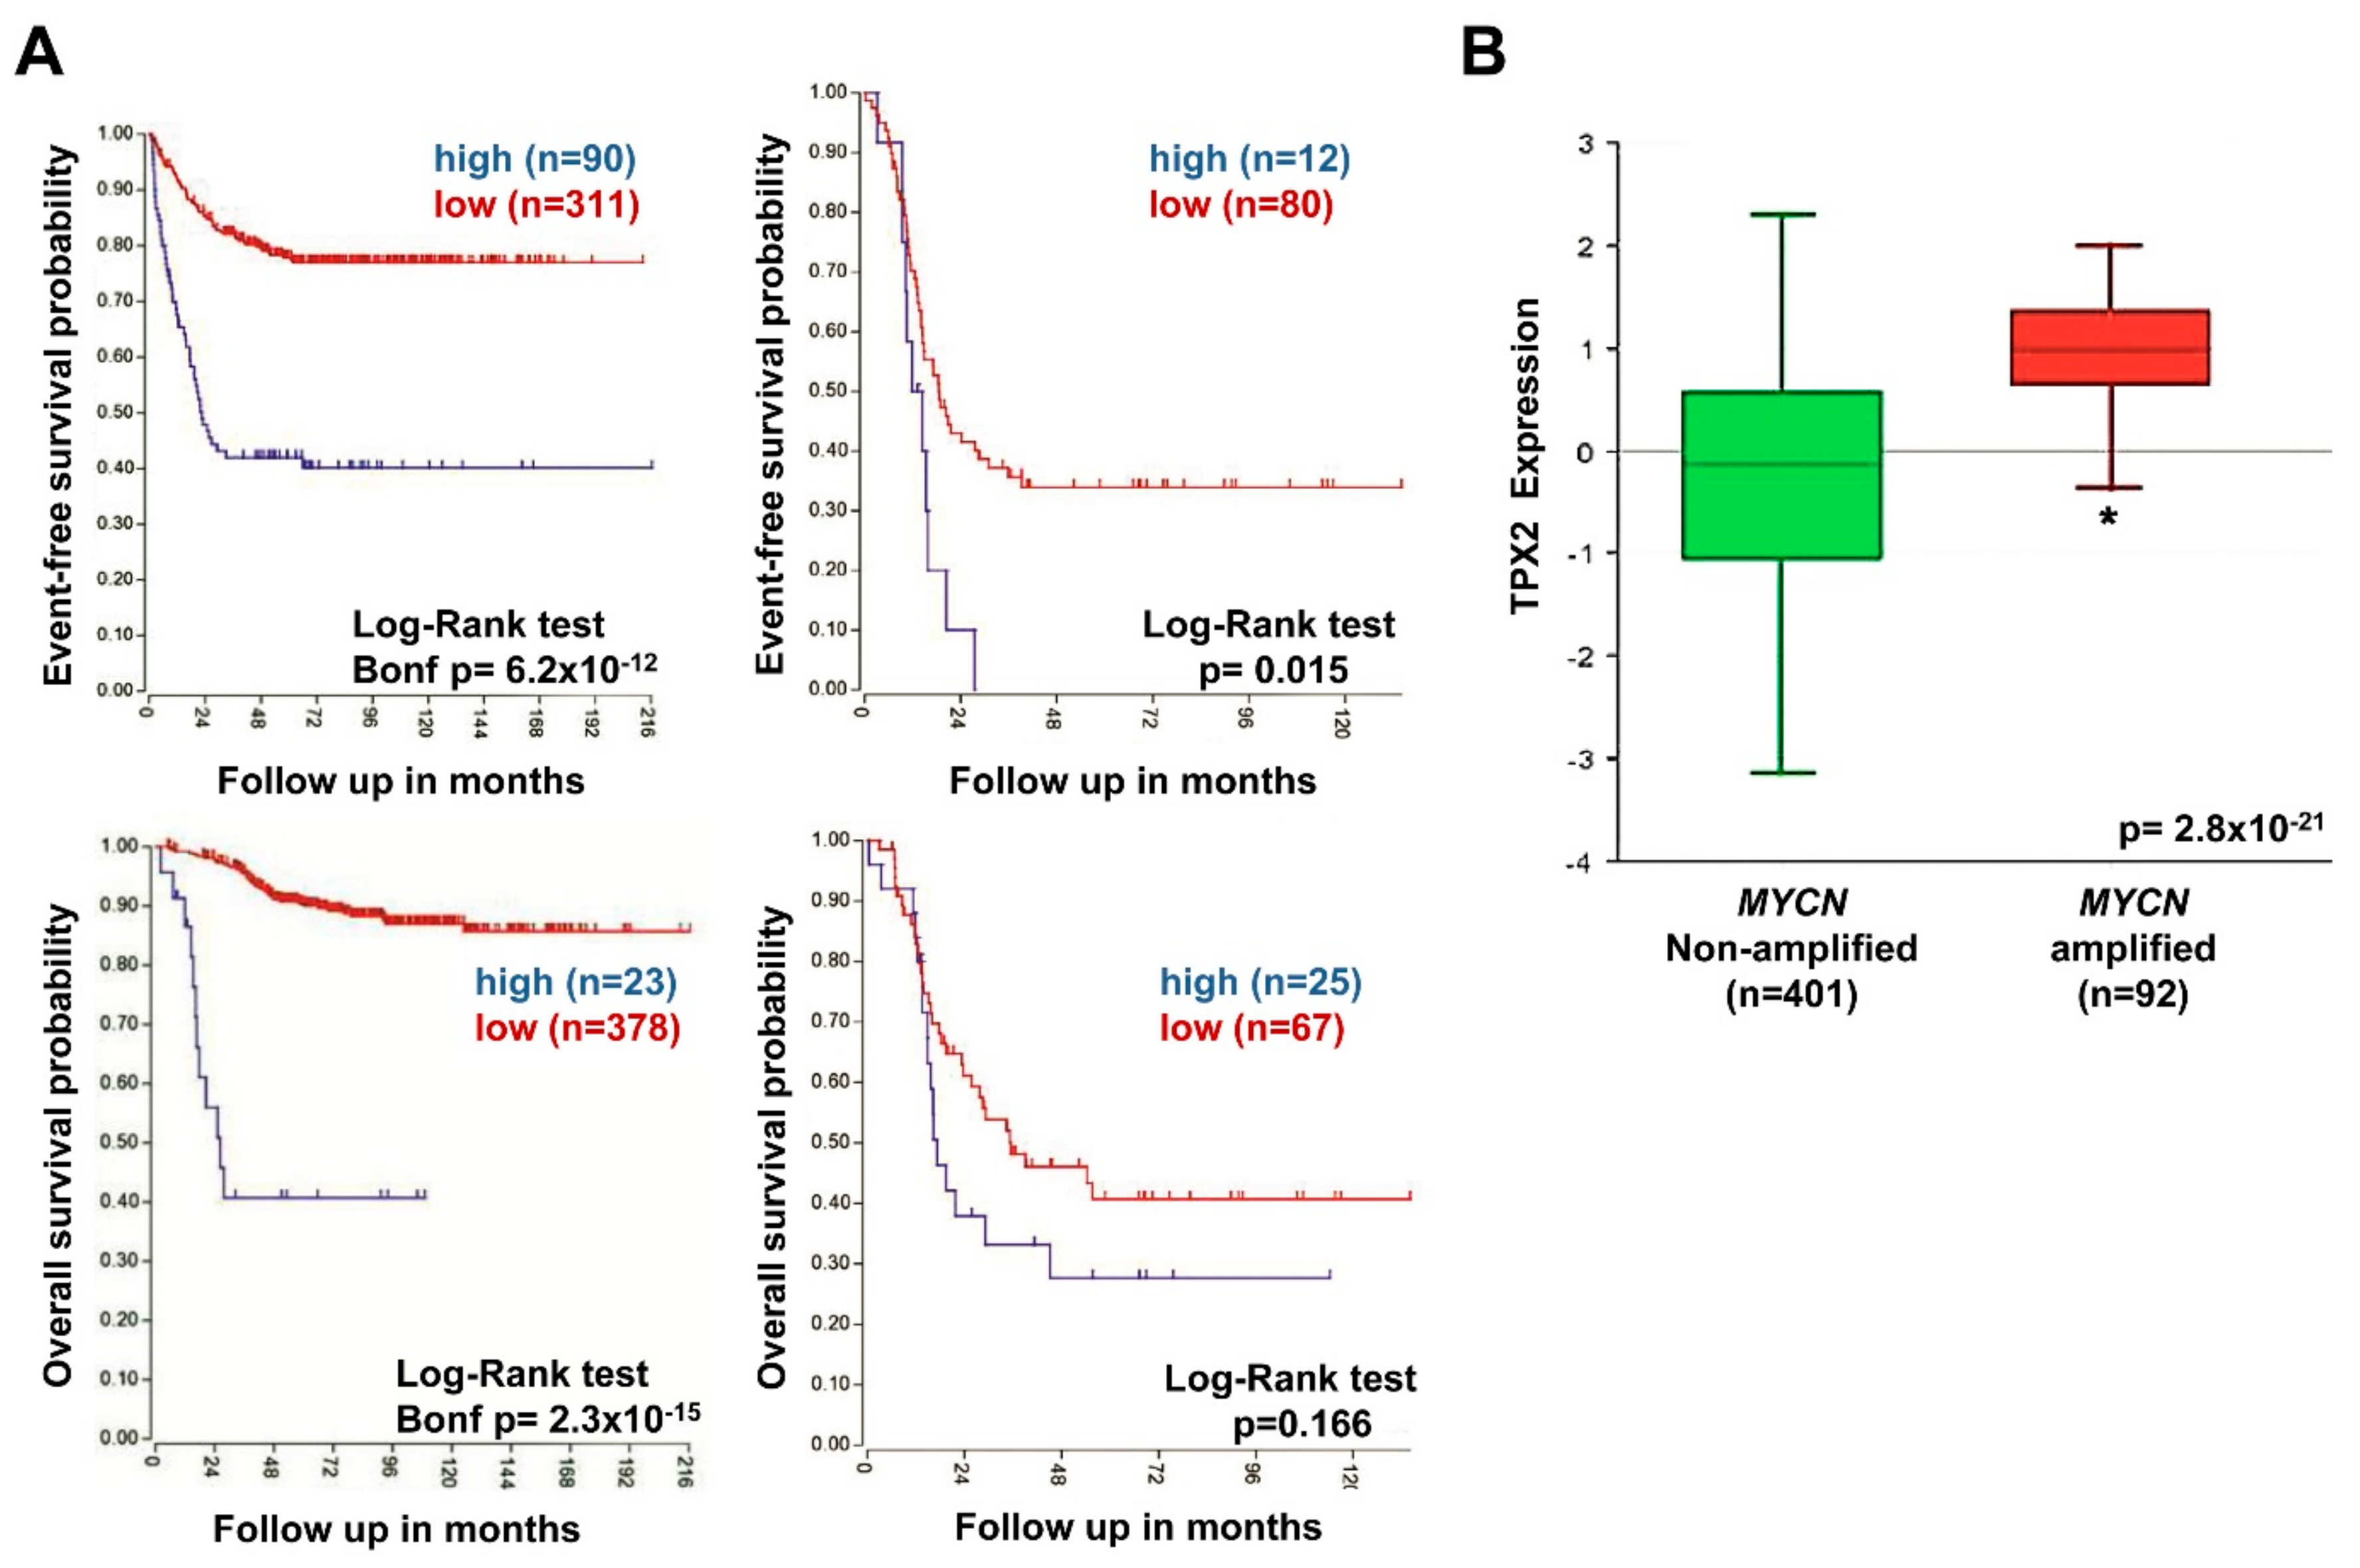
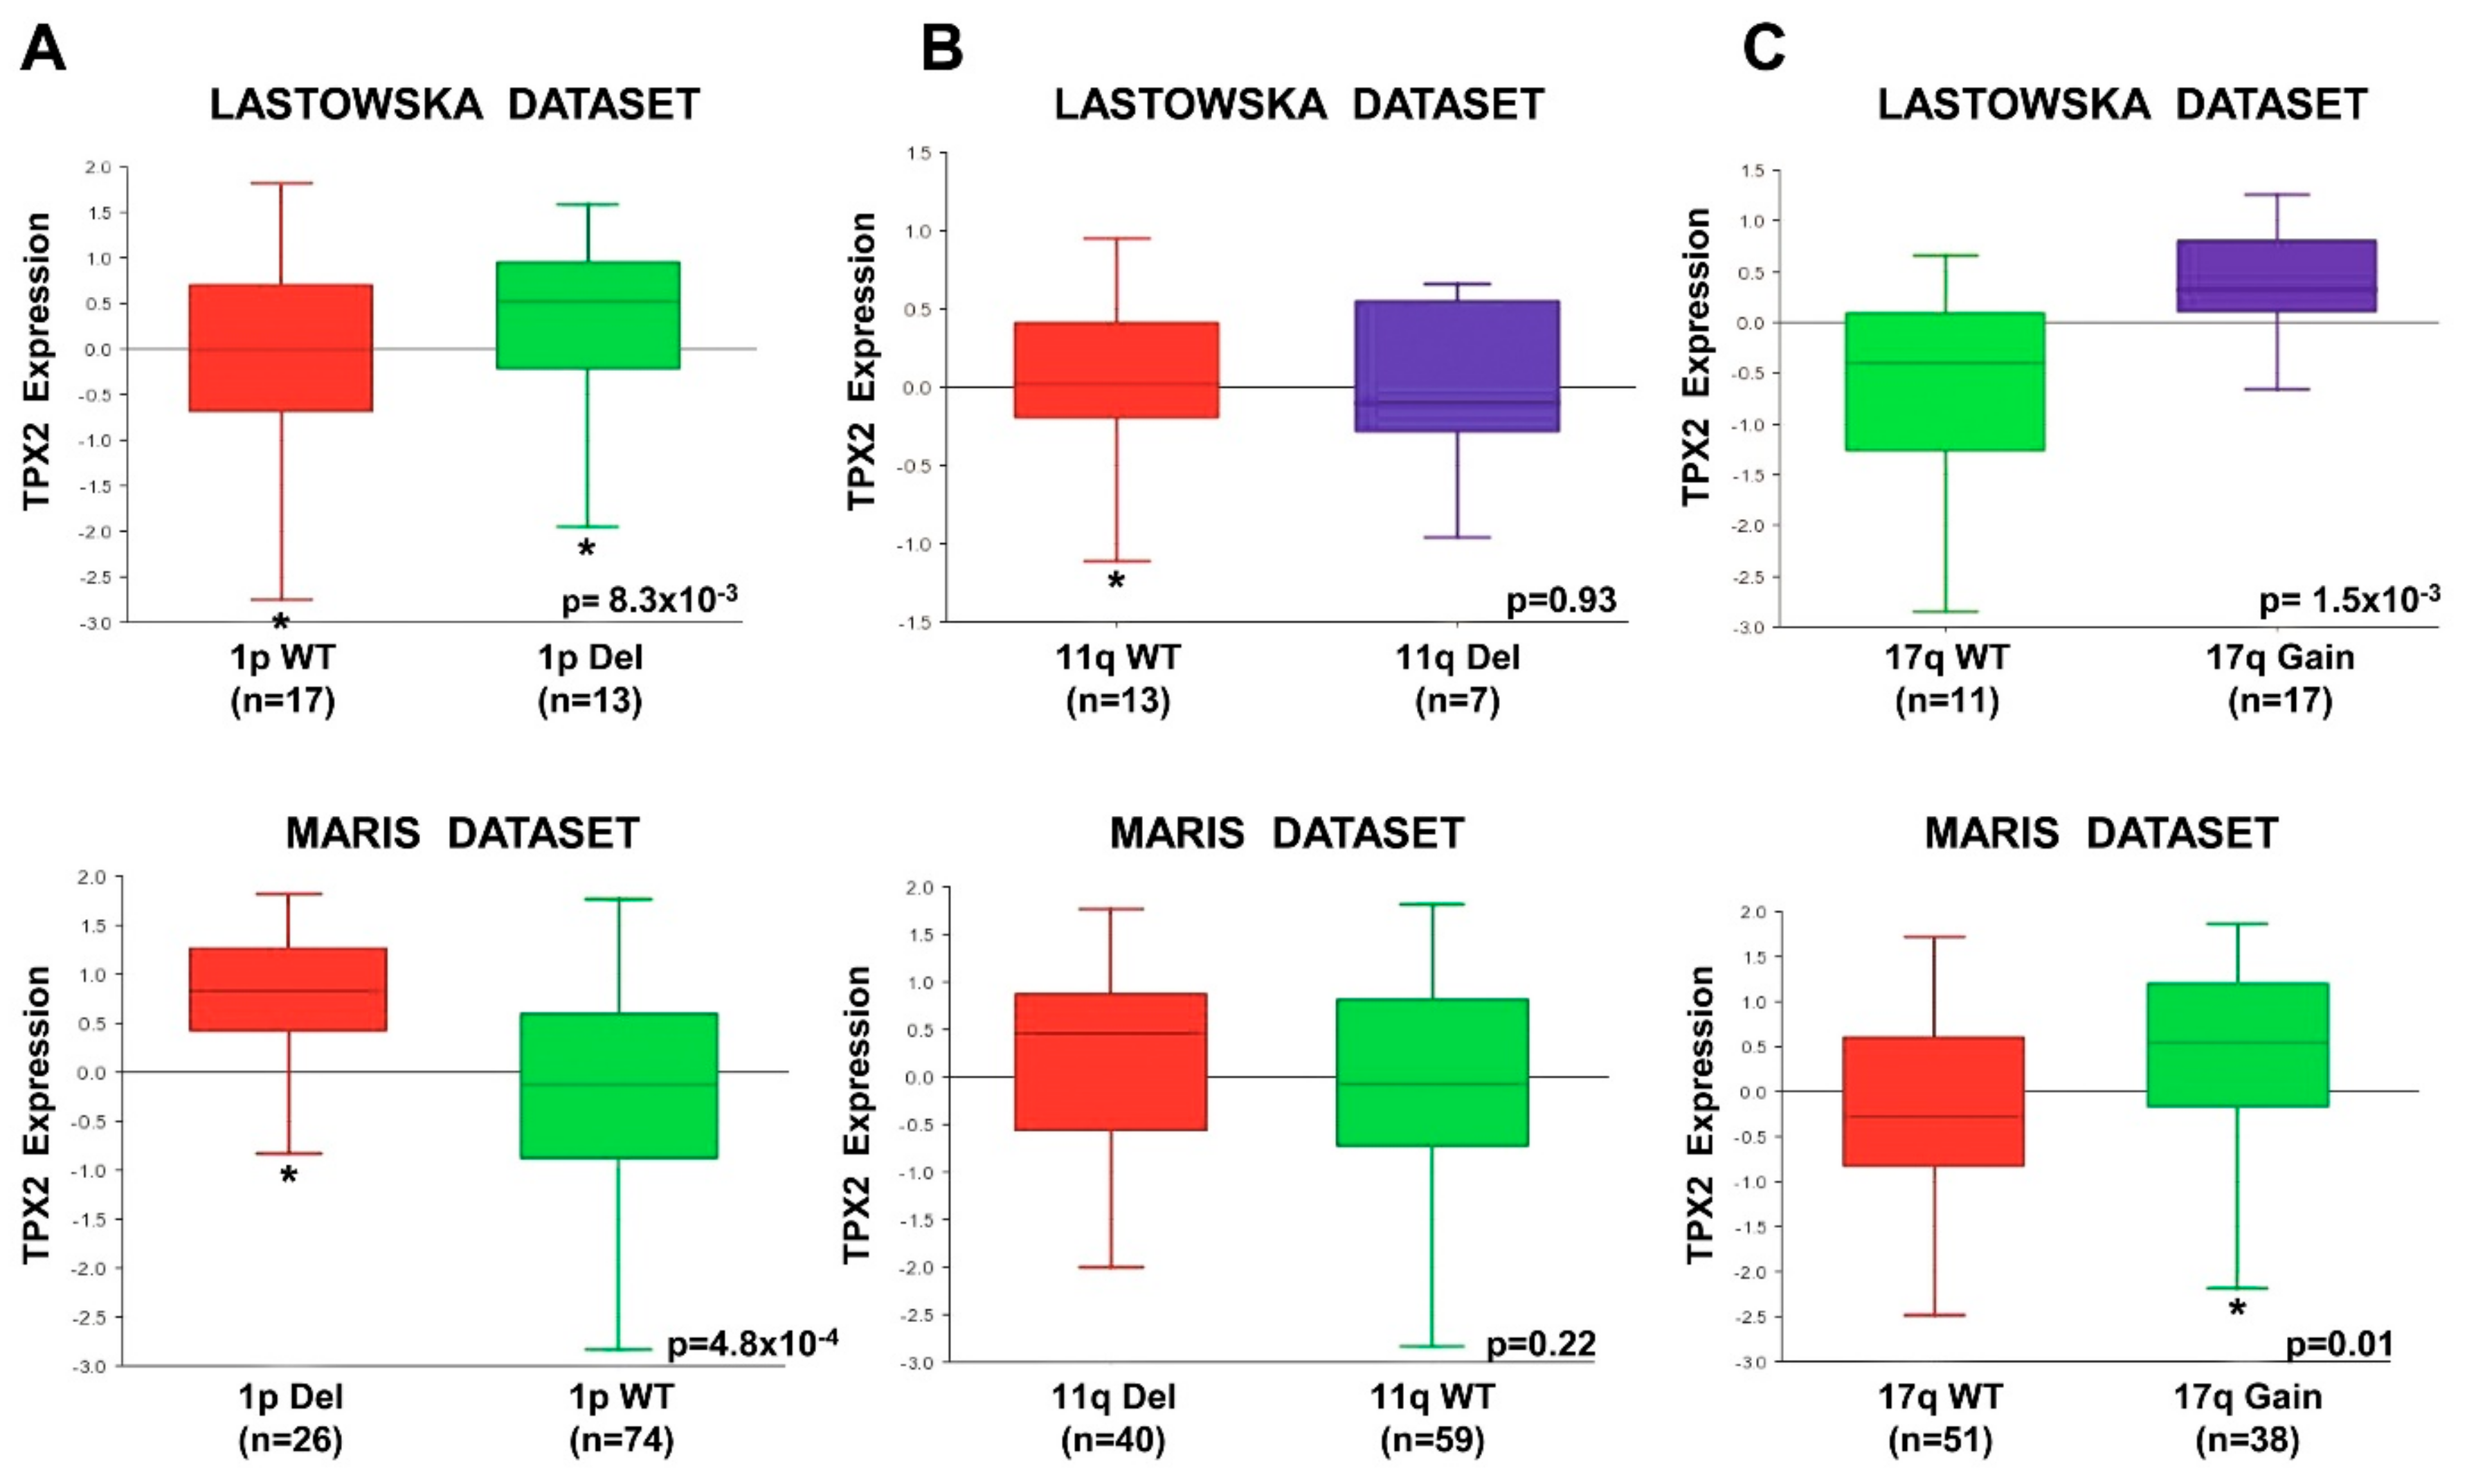
2.7. High TPX2 Gene Expression is Significantly Associated With Poor Prognosis in Neuroblastoma Patients
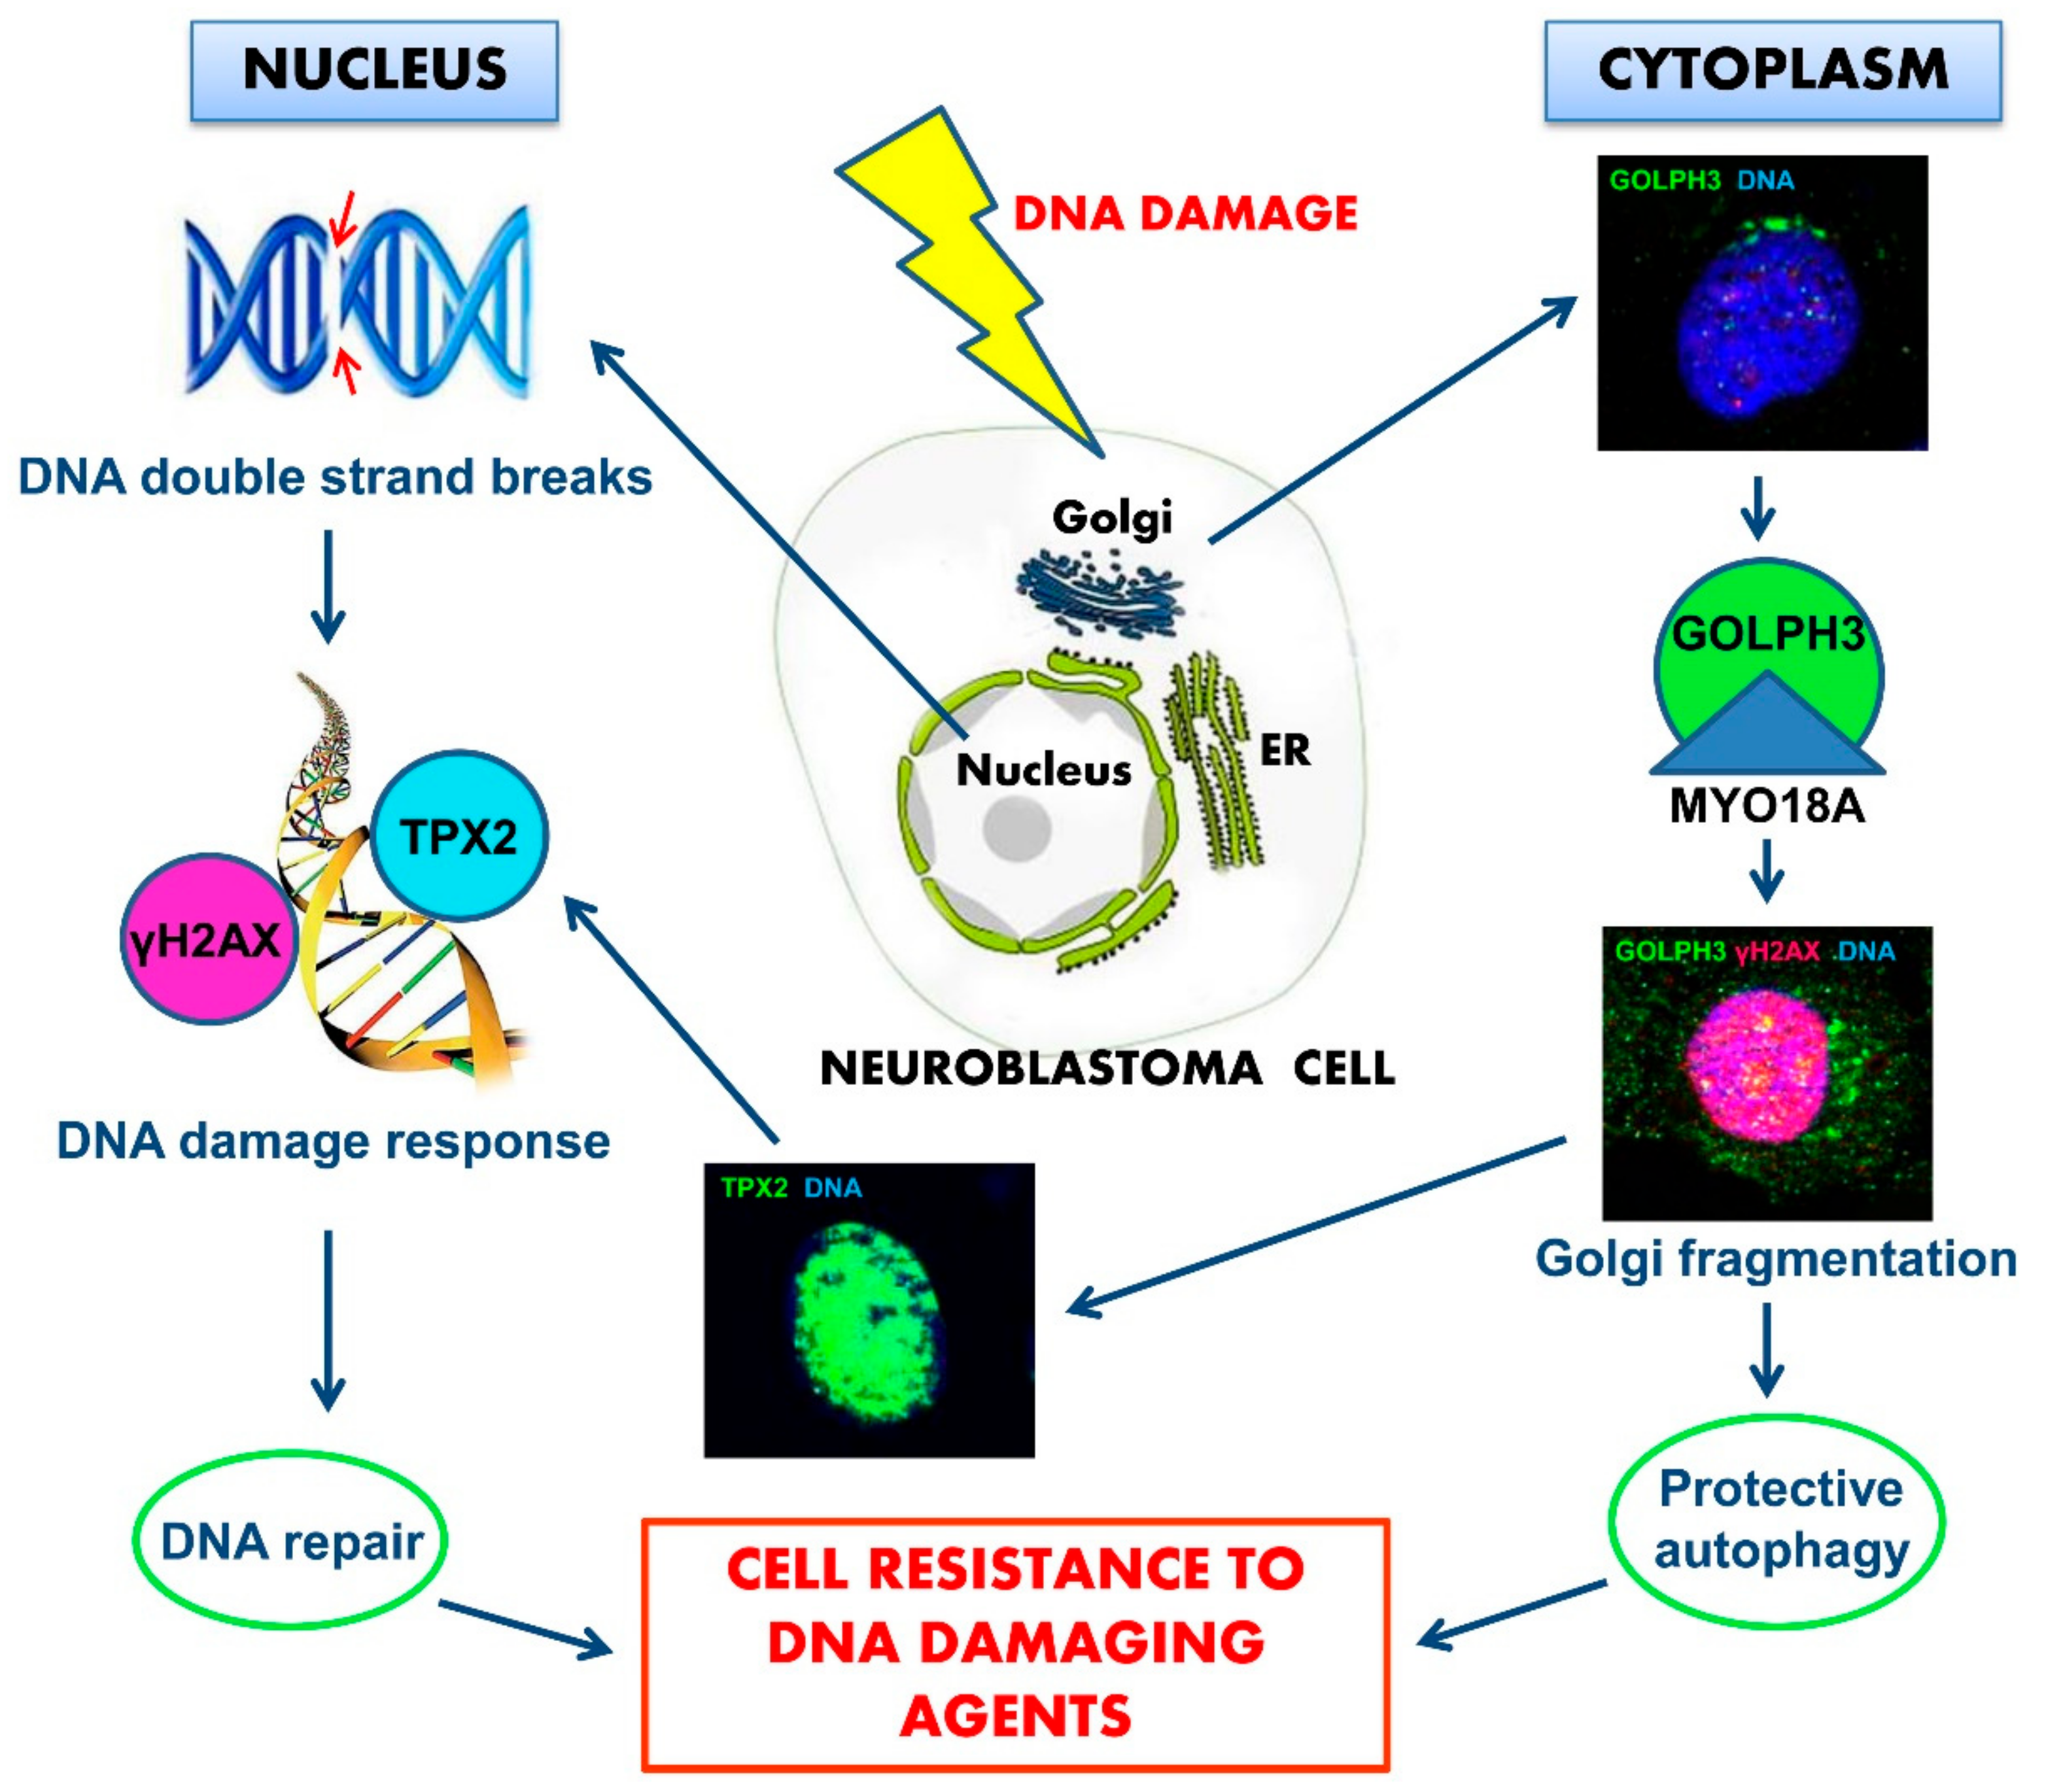
We analyzed the data from microarray results obtained for NB tumor samples from R2 Genomics Analysis and Visualization Platform (http://r2.amc.nl), using the SEQC-498, and Versteeg databases that included complete information about clinical data. High expression of the TPX2 gene was significantly linked with reduced event-free and overall survival in two different NB patient groups (Figure 6A). Furthermore, TPX2 gene expression was significantly higher among relapsed versus not relapsed patients (Figure 6B).
These results strongly suggested that high expression of TPX2 was related to augmented risk of relapse and death. In two NB patient groups belonging to all tumor stages, high TPX2 gene expression was associated with decreased relapse-free, and event-free survival rates (Figure 7A). It should be noted that TPX2 gene expression was significantly higher in patients with stage four disease compared to stages 1, 2, 3, and 4S (Figure 7B).
To evaluate the possible association between TPX2 expression and the outcome of patients with tumors carrying MYCN amplification and tumors with MYCN single copy, the two NB patient groups were stratified by the presence or lack of amplified MYCN. Patients with high TPX2 gene expression had reduced event-free and overall survival in groups with both MYCN amplified and non-amplified tumors (Figure 8A), but these trends did not reach statistical significance. Furthermore, TPX2 gene expression was also significantly higher in patients with MYCN amplified tumors compared to MYCN single copy tumors (Figure 8B). Our results demonstrate the association of augmented TPX2 gene expression with poor outcomes in all NB patients’ subsets.
In order to establish whether TPX2 gene expression was correlated to chromosome 1p deletion, 11q deletion, and 17q gain, abnormalities associated with poor NB patient outcomes [54], we analyzed the results from datasets using the R2 Genomics Analysis and Visualization Platform. In two independent datasets, TPX2 gene expression was significantly higher in the tumors from patients with chromosome 1p deletion, and 17q gain compared to those with normal chromosome (Figure 9). There was no difference in TPX2 gene expression with respect to 11q deletion or a normal chromosome (Figure 9).
Moreover, the patients of our dataset with augmented TPX2 expression had very poor outcomes, because all died of disease (Table 1).

3. Discussion

GOLPH3 is an oncogene often amplified and over-expressed in many human tumors, and its increased expression anticipates poor patient prognosis [29,30,31,32,33,34]. GOLPH3 is the first oncogene found involved in regulating Golgi secretory functions. It has been demonstrated that DNA damage triggers dramatic reorganization of the Golgi shape, resulting in its dispersal throughout the cytoplasm via Golgi protein GOLPH3 [23]. Because little was known regarding the effects of DNA damage on the Golgi, and about the Golgi shape in neuroblastic tumors, we focused on the underlying molecular mechanism of GOPLH3 in NB cells.
To investigate the mechanism of resistance of NB cells to elimination induced by DNA damaging agents, we used two inducible NB cell models: IMR-32 cell line with amplification of MYCN oncogene, and SH-SY5Y cell line with MYCN single copy but with high level of c-MYC expression. MYCN oncogene is associated with aggressive disease course and poor outcome of NB patients [1,2,3,4,5], and c-MYC is activated as a potent oncogene in a well-defined subset of high-risk NB cases too [55]. The clinical outcome of NB patients with high level of c-MYC expression is almost identical to that of NB patients with MYCN amplification [56].
DNA damage is well known to drive the activation of DNA repair, cell cycle arrest, and transcriptional changes [37,57,58]. We induced DNA damage in IMR-32 and SH-SY5Y human NB cell lines with curcumin, a polyphenol extracted from a tropical plant native to South and Southeast Asia that has been shown to have anti-inflammatory, anti-viral, and anticancer activities [59,60]. It has been demonstrated that curcumin enhanced the therapeutic efficacy of traditional chemotherapeutic drugs, cisplatin, doxorubicin, 5-fluorouracil, and gemcitabine, however, under some circumstances its effects can be contradictory [61]. Curcumin has been reported to demonstrate a good anti-proliferative activity on tumor cells by inducing apoptosis [62] in NB cells. DNA damage induced by topoisomerase II-mediated DNA cleavage is the mechanism through which curcumin induces apoptosis [63]. It is to be noted that in vitro studies have given direct evidence that curcumin induced G2/M arrest and DNA damage in tumor cells [64,65,66,67,68,69,70,71,72], but it acts as a protective agent for normal cells [73]. Moreover, curcumin modulates autophagy in NB cells [74]: the role of autophagy in NB is an emerging field of great interest in both biological and therapeutic aspects [75,76,77,78].
We found that GOLPH3 was over-expressed in NB cell lines after DNA damage caused by curcumin, and in primary NB human tissue sections from surgical resection post-chemotherapy treatment inducing DNA damage. Moreover, curcumin treatment reduced the activation of MAP-kinases, induces apoptosis, autophagy, and GOLPH3 fragmentation in NB cells. Furthermore, our results showed that DNA damage drastically induced Golgi dispersal throughout the cytoplasm in NB cells. DNA damage induces Golgi fragmentation in several human cell lines (HeLa, HEK293, NRK, MCF7, and MDA-MB-231), in primary human endothelial cells of the umbilical vein, as well as in primary mouse embryonic fibroblasts, and in mouse hepatocytes [23]. Thus, Golgi fragmentation is a common feature of DNA damage response in mammalian cells. Normally, the GOLPH3 pathway regulates the tensile forces upon Golgi complex, contributing to its right organization around the nucleus. Since this pathway appears conserved in many different species, determining Golgi shape could be just a side effect role of GOLPH3 dependent trafficking from Golgi to plasma membrane. We demonstrated that the Golgi fragmentation and dispersal throughout the cytoplasm is functionally important for NB cell survival after DNA damage. The Golgi dispersal is the demonstration that the GOLPH3 pathway is activated in response to DNA damage, with consequences for trafficking function, as well as for NB cell survival. Over-expression of GOLPH3 with Golgi fragmentation caused by DNA damage induced by curcumin seems to confer a survival advantage to NB cells. We have observed that cells drastically stop growing or die when incubated with curcumin for 48 h, but, if they survive, they rapidly recover after curcumin depletion, starting to grow again very rapidly, in spite of so detrimental a treatment. The GOLPH3 activation, together with Golgi dispersal throughout the cytoplasm, were co-localized with autophagy markers expression, that could be the process through which these cells better resist and survive. Over-expression of GOLPH3, by the way, is reported to promote proliferation and tumorigenicity in many other kinds of human cancer [29,30,31,32,33,34]. Changes in the Golgi to plasma membrane trafficking that happen upon Golgi fragmentation following DNA damage may be important for the enhanced survival benefit supporting this pathway, although the crucial resultants have not been identified yet in NB. The DNA damage response is a well-known driver of cancer progression [37]. In addition, the resistance consequent to the recovery from DNA damage given by GOLPH3 over-expression has specific relevance to tumor cells, as most standard therapeutic procedures include DNA damaging agents. Therefore, our findings support the use of GOLPH3 expression levels as a clinical marker to predict responsiveness to DNA damaging cancer therapies of NB patients. Whether GOLPH3 regulates chemo-resistance in NB needs to be investigated in further studies. Furthermore, novel molecules able to interfere with GOLPH3 pathway may produce some benefits when used in combination with standard DNA damage therapeutic factors.
The role of RAS/MAPK pathway signaling in NB tumor cells is poorly understood. Activating mutations in the genes components of RAS/MAPK pathway have been identified in a small group of NB tumors at diagnosis [79] and more frequently at relapse [80]. In addition, the expression of the gene for the Ras GTPase-activating protein (RasGAP) NF1 is also related with the NB patient outcome, suggesting a significant role for RAS/MAPK pathway in NB pathogenesis and disease relapse [81,82]. Patients with high-risk NB have very poor outcomes, and an extensive comprehension of the pathways involved in NB pathogenesis will help in the development of improved therapies. In this study, we demonstrate that DNA damage augmented the expression of TPX2, the molecule that controls microtubule nucleation around centrosome, where Golgi is normally clustered. A relation between Golgi and TPX2 protein has been described, according to which Golgi regulates mitotic spindle formation by promoting the activation of the spindle assembly factor TPX2 [83]. Our results demonstrate a connection between TPX2 protein related to DNA damage, and GOLPH3 that enhances cell survival in response to DNA damage in NB cells. Our experiments showed that the over-expression of MYCN and c-MYC proteins independently correlate with an augmented TPX2 expression. It has been described TPX2 as a co-regulator of MYC pathway too [84]. As TPX2 expression is associated with NB cell proliferation and NB patient outcome and prognostic features, we suggest a role for TPX2 as a novel oncoprotein in NB. Although we have demonstrated the association between TPX2 and a number of critical NB prognostic variables, other studies are indispensable to determine whether TPX2 expression is independently associated with NB patient outcomes. We have shown that NB cases with 1p deletion and 17q gain have higher TPX2 levels, suggesting that increased TPX2 gene expression may be the cause of the poor prognosis for this group of patients. Further studies are ongoing to identify whether other genetic or epigenetic events are responsible for regulation of TPX2 gene expression.
Definitely, we propose that in response to DNA damage, GOLPH3 is activated and its interaction with MYO18A is reinforced, leading to an increased tensile force on the Golgi and consequently to Golgi fragmentation and dispersal in the cytoplasm of NB cells. Then, while in the nucleus, the activation of TPX2 induces the DNA damage response and, in the cytoplasm, Golgi dispersal leads to altered cell trafficking. Moreover, Golgi fragmentation is accompanied by activation of protective autophagy so NB cell can repair DNA. Over-expression of GOLPH3 and TPX2 confers resistance to killing by DNA damaging agents and enhances survival of NB cells (Figure 10). This mechanism suggests physical continuity between DNA in the nucleus and Golgi in the cytoplasm. The upstream mechanism leading to the activation of the two intertwined processes that cause Golgi dispersal altered trafficking, and DNA repair in response to DNA damage, is yet to be determined.

4. Materials and Methods

4.1. Cell Cultures

Human certified NB cell lines IMR-32 and SH-SY5Y were obtained from ICLC-Interlab Cell Line Collection (San Martino-IST, Genova, Italy), while HEK-293 cell line was obtained from The Global Bioresource Center (ATCC, Manassas, VA, USA). HEK-293 cells, chosen as non-tumorigenic control cells because they show a neuronal lineage phenotype and express adrenergic markers [85], were utilized at low culturing passage, to avoid any possible tumorigenic properties [86]. Cells were cultured in DMEM High Glucose (EuroClone, Milano, Italy) supplemented with 10% FBS (Gibco, Waltham, MA, USA) and maintained at 37 °C in a humidified atmosphere of 95% air and 5% CO2. The genomic identity of each line was regularly established by array-CGH, and cell lines were always tested to certify lack of mycoplasma contamination.

4.2. Curcumin and Cells Growth

Curcumin (diferuloylmethane) [87] was purchased from Alfa Aesar (GmbH & Co KG, Karlsruhe, Germany), with a purity of 95%, dissolved in dimethyl sulfoxide (DMSO) at a final concentration of 100 mM and stored at −20 °C until used. For in vitro experiments, curcumin was diluted before use in complete medium to contain <0.1% DMSO. NB cell lines were treated with a series of concentrations of curcumin from 2 to 80 μM for 24 h at 37 °C to evaluate the effects on cell growth and survival in a dose dependent manner. The curcumin concentrations that gave a significant effect with low cytotoxicity were tested on 24 and 48 h treatment experiments. After 48 h of treatment with the most significant curcumin concentration, medium was changed with normal fresh DMEM and cells were counted after 1, 2 and 3 days to observe their recovery degree. At each harvest point, viable cells were trypsinized and counted in Trypan blue. Control cells were cultured in the same DMSO concentration (0.1%).

4.3. Western Blot Analysis

Cells were lysed in Staph-A buffer (1.6 mM NaH2PO4; 8.6 mM Na2HPO4; 1% Triton X-100; 0.1% SDS; 0.1% NaCl; 0.5% NaDoc; 2 mM AEBSF; 20 mg/mL each of aprotinin and leupeptin) and the obtained protein lysates (100 µg each) were subjected to SDS-PAGE electrophoresis and transferred to PVDF membrane (Millipore, Burlington, MA, USA). Blots were probed with the following monoclonal antibodies: anti-PARP (Abcam, Cambridge, MA, UK), anti-phospho-Histone γH2AX (Millipore), anti-TPX2 (Santa Cruz Biotechnology, Dallas, TX, USA), and anti-c-MYC (Santa Cruz Biotechnology); and polyclonal antibodies: anti-GOLPH3 (Abcam), anti-Beclin-1 (Novus Biologicals, Littleton, CO, USA), anti-LC3A (Cell Signaling Technology Inc., Danvers, MA, USA), anti-MYO18A (Abnova, Taipei, Taiwan), anti-Histone H2AX (Sigma, St Louis, MO, USA), and anti-MYCN (Novus Biologicals). Proteins were visualized by West Dura Extended chemiluminescent detection (Thermo Scientific, Carlsbad, CA, USA) using HRP-conjugated secondary antibodies (Thermo Scientific). Blots were re-probed with anti-β-actin (Santa Cruz Biotechnology) as loading control. Bands signal intensity was measured by densitometry using Image Lab 6.0 software (ChemiDoc, Bio-Rad, Hercules, CA, USA), and normalized to the loading control.

4.4. Kinase Activation Assay

Cells were starved 18 h and then lysed in order to assess the activated p38, ERK1/2, and Akt levels. Cell lysates were subjected to SDS-PAGE and transferred to PVDF membrane. The blots were then probed with a phospho-specific monoclonal antibody against P-p38 and with polyclonal antibodies against P-ERK1/2 and P-Akt (Cell Signaling Technology). To check the total amount of proteins loaded, the blots were re-probed with polyclonal antibodies against p38, ERK2 (Santa Cruz Biotechnology), and Akt (Cell Signaling Technology). Band signal intensity was measured by densitometry and normalized to each total protein expression.

4.5. Patients and Tumor Samples

The primary NB human tissue sections analyzed included three from pre-chemotherapy (NB1, NB2, NB3) and 10 from post-chemotherapy surgical resection (NB1 to NB10) (Table 1), all diagnosed by the Italian Association of Pediatric Hematology and Oncology (AIEOP). The post-chemotherapy surgical resections were obtained after induction with rapid COJEC. Rapid COJEC (two courses of carboplatin, etoposide, vincristine; four courses of cisplatin, vincristine; two courses of etoposide, cyclophosphamide) is a time-intensive chemotherapy regimen administered at 10-day intervals. These patients harbored chemotherapy resistant tumors. All surgical resections were taken from high-risk NB patients, as defined by the International Neuroblastoma Risk Group (INRG) classification system [88], enrolled in the HR-NBL-1 protocol (SIOPEN) [89]. Informed consent was obtained from all individual participants included in the study. This study was approved by the Institutional Ethics Committee of Regione Liguria (Prot. n° IGG-NCA-AP-2016; 12/15/2016).

4.6. Immunofluorescence Analysis

Immunofluorescence analysis was performed on formalin-fixed, paraffin-embedded NB specimens (4 μm-thick) or on cytospins as previously described [90]. The following antibodies were used: monoclonal anti-phospho-Histone γH2AX (1:20, Millipore) and anti-TPX2 (1:20, Santa Cruz Biotechnology); polyclonal anti-GOLPH3 (1:10, Abcam), and anti-Beclin-1 (1:30 Novus Biologicals). We used isotype matched non-binding mAbs in all antibody staining experiments to avoid nonspecific reactivity. Results were photographically documented using fluorescence microscope Axio Imager M2 equipped with ApoTome System (Carl Zeiss, Oberkoche, Germany). For cytospins, values represent percentages from at least 1000 counted positive and negative cells. For NB specimens, each tumor area tested contained malignant cells as assessed by histologic examination. Quantification of immunofluorescence positive tumor cells was performed on serial tissue sections, thus allowing quantification in tumor areas selected by the pathologist. Tumor cells were identified in each sample using the NB specific marker NCAM (NB56) [91]. The proportion of immunofluorescence positive cells counted was at least 100 to 1000 cells and reported in the percentage for the subsequent statistical analysis.

4.7. Detection of Apoptotic Cells

Apoptotic cells were detected using in situ Cell Death Detection Kit (Roche, Basel, Switzerland) as described previously [92]. The elements considered to estimate the apoptosis degree were chromatin condensation, the presence of cytoplasmic fragments (apoptotic bodies), and of intra- and extracellular chromatin fragments (micronuclei). Values represent percentages from at least 1000 counted apoptotic and non-apoptotic cells.

4.8. Genomic Profile Determination

We analyzed by array-CGH the genome wide copy number variations in the DNA extracted from the 10 NB samples here considered coming from pre-chemotherapy surgical resection using Human Genome CGH Microarray 4X 180K Kit (Agilent Technologies, Santa Clara, CA, USA), with a mean resolution of approximately 25 kb, as previously described [93]. Tumor DNAs were extracted using the QIAamp DNA Extraction Kit (Qiagen, Hilden, Germany), according to the manufacturer’s instructions. Images of the array were acquired with the Agilent C Scanner (Agilent Technologies), which were processed using the Agilent Feature Extraction 10.5 Software. The data were analyzed using the Genomic Workbench 7.0.40 software (Agilent), the altered chromosomal regions and breakpoints events were detected using the algorithm ADM-1 (threshold 10) with 0.5 Mb window size to reduce false positives [93]. The raw data are stored in the BIT-NB Bio Bank of IRCCS Gaslini.

4.9. TPX2 Gene Expression Analysis

We evaluated the association of TPX2 gene expression with NB patients outcomes, using public microarray data from two different NB patients datasets (SEQC-498 and Versteeg obtained from the R2 Genomic Analysis and Visualization Platform (http://r2.amc.nl) [94,95]. TPX2 gene probe-sets (SEQC-498 probe-set NM_012112; Versteeg probe-set 210052) in each database with the highest average signals were selected for analysis. The best cut-off for survival analyses was determined as the expression value where the statistic log-rank for the separation of survival curves reached its higher level.

4.10. Statistical Analysis

The microarray data generated from the R2 Genomic Analysis and Visualization Platform was examined using the R2 program for analysis and visualization of microarray data (http://r2.amc.nl). We performed on-line Kaplan-Meier analyses and evaluation of TPX2 expression comparing different patient subgroups for the two NB cohorts. Next, we downloaded the resulting survival curves, box plots, and p-values (obtained with log-rank test). The Mann-Whitney U test was used for the comparison of TPX2 expression among the different NB patients’ subgroups.
All experiments were performed at least three times. For all analyses, the significance of differences between experimental samples and controls was determined by ANOVA analysis with Bonferroni’s Multiple comparison Test (* p < 0.05; ** p < 0.01; *** p < 0.001).

5. Conclusions

Our findings suggest that GOLPH3 expression level may represent a possible clinical marker of NB patient responsiveness to DNA damaging therapies. Novel molecules able to interfere with the GOLPH3 pathway may produce therapeutic benefits when combined with standard DNA damaging therapeutic factors in NB. TPX2 too can therefore represent a molecular target for the development of new drugs. The results of this study provide several starting points for future investigations as part of the preclinical and clinical fight against NB.

Supplementary Materials

Supplementary materials can be found at https://www.mdpi.com/1422-0067/20/19/4764/s1.

Author Contributions

Conceptualization, A.P. and M.P.; Methodology, M.O. and A.P.; Statistical analysis, A.P; Validation, M.O. and A.P.; Formal analysis, M.O.; Investigation, M.O.; Resources, A.P. and A.G.; Data curation, M.O. and A.P.; Writing—original draft preparation, M.O. and A.P.; Writing—review and editing, M.O., A.P., M.P. and A.G.; Visualization, M.O.; Supervision, A.G.; Project administration, A.P.; Funding acquisition, A.P. and A.G.

Funding

This research was funded by the Cinque per mille dell’IRPEF Finanziamento della ricerca sanitaria; Finanziamento Ricerca Corrente 2018, Ministero della Salute (MSALRC18); Compagnia San Paolo (DLCA 92/16); Fondazione Maria Piaggio Casarsa (PR 299/13); and Fondazione Italiana Neuroblastoma.

Acknowledgments

We thank Angela Rita Sementa (Dipartimento di Anatomia Patologica, IRCCS Istituto Giannina Gaslini, Genova) for providing the primary NB tumor specimens.

Conflicts of Interest

The authors declare no conflict of interest. The funders had no role in the design of the study; in the collection, analyses, or interpretation of data; in the writing of the manuscript, or in the decision to publish the results.

Abbreviations

NBNeuroblastoma
MYCNv-myc myelocytomatosis viral related oncogene, neuroblastoma derived
GOLPH3Golgi phosphoprotein 3
MYO18AMyosin XVIIIA
H2AXH2A histone family, member X
TPX2microtubule-associated, homolog (Xenopus laevis)
DNA-PKDNA dependent protein kinase complex
MAPKsmitogen-activated protein kinases
p38p38 MAPK
ERK1/2extracellular signal-regulated kinase 1 and 2
AktRAC-alpha serine-threonine-protein kinase
RasRat Sarcoma family of GTP-ases
GAPGTPase-activating protein
PARPPoly ADP-Ribose Polymerase
LC3AMicrotubule Associated Protein 1 Light Chain 3 Alpha
ERendoplasmic reticulum
TUNELTerminal deoxynucleotidyl transferase dUTP nick end labeling
CGHComparative Genomic Hybridization
INSSInternational Neuroblastoma Staging System
INRGInternational Neuroblastoma Risk Group
SIOPENInternational Society of Pediatric Oncology European Neuroblastoma
AIEOPItalian Association of Pediatric Hematology and Oncology

Appendix A

Rapamycin, Bortezomib, and Colchicine Treatments

Rapamycin, Bortezomib and Colchicine were tested as DNA damage and Golgi fragmentation inducers for their known anti-proliferative and apoptotic effect on NB cells [50,51,52]. These compounds have been studied as possible drugs for NB therapy too [96,97,98], and, furthermore, all them have shown an involvement in autophagy induction, in NB or in other kind of human cancers [75,99,100]. Rapamycin was purchased from InvivoGen (San Diego, CA, USA), with a purity of more than 95%, and dissolved in DMSO at a final concentration of 10mM; Bortezomib was purchased from Cell Signaling Technology Inc. (Danvers, MA, USA), with a purity of 99%, and dissolved in DMSO at a final concentration of 1mM; Colchicine was purchased from InvivoGen with a purity of 95%, and dissolved in distilled water at a final concentration of 25mM. The drugs were divided into aliquots and stored at -20 °C until used for in vitro experiments, when they were diluted in complete medium. NB cell lines were treated with a series of drugs concentrations for 24 and 48 h at 37 °C to evaluate the dose that gave a significant effect with the lowest degree of cytotoxicity.

References

  1. Cheung, N.K.; Dyer, M.A. Neuroblastoma: Developmental biology, cancer genomics and immunotherapy. Nat. Rev. Cancer 2013, 13, 397–411. [Google Scholar] [CrossRef] [PubMed]
  2. Speleman, F.; Park, J.R.; Henderson, T.O. Neuroblastoma: A Tough Nut to Crack. Am. Soc. Clin. Oncol. Educ. Book 2016, 35, e548–e557. [Google Scholar] [CrossRef] [PubMed]
  3. Bosse, K.R.; Maris, J.M. Advances in the translational genomics of neuroblastoma: From improving risk stratification and revealing novel biology to identifying actionable genomic alterations. Cancer 2016, 122, 20–33. [Google Scholar] [CrossRef] [PubMed]
  4. Matthay, K.K.; Maris, J.M.; Schleiermacher, G.; Nakagawara, A.; Mackall, C.L.; Diller, L.; Weiss, W.A. Neuroblastoma. Nat. Rev. Dis. Primers 2016, 2, 16078. [Google Scholar] [CrossRef]
  5. Cohn, S.L.; Pearson, A.D.; London, W.B.; Monclair, T.; Ambros, P.F.; Brodeur, G.M.; Faldum, A.; Hero, B.; Iehara, T.; Machin, D.; et al. INRG Task Force. The International Neuroblastoma Risk Group (INRG) classification system: An INRG Task Force report. J. Clin. Oncol. 2009, 27, 289–297. [Google Scholar] [CrossRef] [PubMed]
  6. Monclair, T.; Brodeur, G.M.; Ambros, P.F.; Brisse, H.J.; Cecchetto, G.; Holmes, K.; Kaneko, M.; London, W.B.; Matthay, K.K.; Nuchtern, J.G.; et al. INRG Task Force. The International Neuroblastoma Risk Group (INRG) staging system: An INRG Task Force report. J. Clin. Oncol. 2009, 27, 298–303. [Google Scholar] [CrossRef]
  7. Louis, C.U.; Shohet, J.M. Neuroblastoma: Molecular pathogenesis and therapy. Annu. Rev. Med. 2015, 66, 49–63. [Google Scholar] [CrossRef] [PubMed]
  8. Holohan, C.; Van Schaeybroeck, S.; Longley, D.B.; Johnston, P.G. Cancer drug resistance: An evolving paradigm. Nat. Rev. Cancer 2013, 13, 714–726. [Google Scholar] [CrossRef] [PubMed]
  9. Ni Chonghaile, T.; Sarosiek, K.A.; Vo, T.T.; Ryan, J.A.; Tammareddi, A.; Moore, V.G.; Deng, J.; Anderson, K.C.; Richardson, P.; Tai, Y.T.; et al. Pretreatment mitochondrial priming correlates with clinical response to cytotoxic chemotherapy. Science 2011, 334, 1129–1133. [Google Scholar] [CrossRef]
  10. Keshelava, N.; Zuo, J.J.; Waidyaratne, N.S.; Triche, T.J.; Reynolds, C.P. p53 mutations and loss of p53 function confer multidrug resistance in neuroblastoma. Med. Pediatr. Oncol. 2000, 35, 563–568. [Google Scholar] [CrossRef]
  11. Khalil, M.A.; Hrabeta, J.; Cipro, S.; Stiborova, M.; Vicha, A.; Eckschlager, T. Neuroblastoma stem cells-mechanisms of chemoresistance and histone deacetylase inhibitors. Neoplasma 2012, 59, 737–746. [Google Scholar] [CrossRef] [PubMed]
  12. Khalil, M.A.; Hraběta, J.; Groh, T.; Procházka, P.; Doktorová, H.; Eckschlager, T. Valproic Acid Increases CD133 Positive Cells that Show Low Sensitivity to Cytostatics in Neuroblastoma. PLoS ONE 2016, 11, e0162916. [Google Scholar] [CrossRef] [PubMed]
  13. Bresler, S.C.; Weiser, D.A.; Huwe, P.J.; Park, J.H.; Krytska, K.; Ryles, H.; Laudenslager, M.; Rappaport, E.F.; Wood, A.C.; McGrady, P.W.; et al. ALK mutations confer differential oncogenic activation and sensitivity to ALK inhibition therapy in neuroblastoma. Cancer Cell 2014, 26, 682–694. [Google Scholar] [CrossRef] [PubMed]
  14. Murakami-Tonami, Y.; Ikeda, H.; Yamagishi, R.; Inayoshi, M.; Inagaki, S.; Kishida, S.; Komata, Y.; Koster, J.; Takeuchi, I.; Kondo, Y.; et al. SGO1 is involved in the DNA damage response in MYCN-amplified neuroblastoma cells. Sci. Rep. 2016, 6, 31615. [Google Scholar] [CrossRef] [PubMed]
  15. Gottesman, M.M.; Fojo, T.; Bates, S.E. Multidrug resistance in cancer: Role of ATP-dependent transporters. Nat. Rev. Cancer 2002, 2, 48–58. [Google Scholar] [CrossRef] [PubMed]
  16. White, E. Deconvoluting the context-dependent role for autophagy in cancer. Nat. Rev. Cancer 2012, 12, 401–410. [Google Scholar] [CrossRef] [PubMed] [Green Version]
  17. Dippold, H.C.; Ng, M.M.; Farber-Katz, S.E.; Lee, S.K.; Kerr, M.L.; Peterman, M.C.; Sim, R.; Wiharto, P.A.; Galbraith, K.A.; Madhavarapu, S.; et al. GOLPH3 bridges phosphatidylinositol-4- phosphate and actomyosin to stretch and shape the Golgi to promote budding. Cell 2009, 139, 337–351. [Google Scholar] [CrossRef] [PubMed]
  18. Bishé, B.; Syed, G.H.; Field, S.J.; Siddiqui, A. Role of phosphatidylinositol 4-phosphate (PI4P) and its binding protein GOLPH3 in hepatitis C virus secretion. J. Biol. Chem. 2012, 287, 27637–27647. [Google Scholar] [CrossRef] [PubMed]
  19. Ng, M.M.; Dippold, H.C.; Buschman, M.D.; Noakes, C.J.; Field, S.J. GOLPH3L antagonizes GOLPH3 to determine Golgi morphology. Mol. Biol. Cell 2013, 24, 796–808. [Google Scholar] [CrossRef]
  20. Makowski, S.L.; Tran, T.T.; Field, S.J. Emerging themes of regulation at the Golgi. Curr. Opin. Cell Biol. 2017, 45, 17–23. [Google Scholar] [CrossRef]
  21. Buschman, M.D.; Field, S.J. MYO18A: An unusual myosin. Adv. Biol. Regul. 2018, 67, 84–92. [Google Scholar] [CrossRef] [PubMed]
  22. Rahajeng, J.; Kuna, R.S.; Makowski, S.L.; Tran, T.T.T.; Buschman, M.D.; Li, S.; Cheng, N.; Ng, M.M.; Field, S.J. Efficient Golgi Forward Trafficking Requires GOLPH3-Driven, PI4P-Dependent Membrane Curvature. Dev. Cell. 2019, 19, 30451–30454. [Google Scholar] [CrossRef] [PubMed]
  23. Farber-Katz, S.E.; Dippold, H.C.; Buschman, M.D.; Peterman, M.C.; Xing, M.; Noakes, C.J.; Tat, J.; Ng, M.M.; Rahajeng, J.; Cowan, D.M.; et al. DNA damage triggers Golgi dispersal via DNA-PK and GOLPH3. Cell 2014, 156, 413–427. [Google Scholar] [CrossRef] [PubMed]
  24. Scott, K.L.; Chin, L. Signaling from the Golgi: Mechanisms and models for Golgi phosphoprotein 3-mediated oncogenesis. Clin. Cancer Res. 2010, 16, 2229–2234. [Google Scholar] [CrossRef] [PubMed]
  25. Scott, K.L.; Kabbarah, O.; Liang, M.C.; Ivanova, E.; Anagnostou, V.; Wu, J.; Dhakal, S.; Wu, M.; Chen, S.; Feinberg, T.; et al. GOLPH3 modulates mTOR signalling and rapamycin sensitivity in cancer. Nature 2009, 459, 1085–1090. [Google Scholar] [CrossRef] [PubMed] [Green Version]
  26. Petrosyan, A. Onco-Golgi: Is Fragmentation a Gate to Cancer Progression? Biochem. Mol. Biol. J. 2015, 1, 1–16. [Google Scholar] [CrossRef]
  27. Zhou, B.; Wang, G.; Gao, S.; Chen, Y.; Jin, C.; Wang, Z.; Yang, Y.; Ma, Z.; Zhang, W.; Feng, X. Expression of GOLPH3 protein in colon cancer tissues and its association with the prognosis of patients. Oncol. Lett. 2016, 12, 3936–3940. [Google Scholar] [CrossRef]
  28. Hanahan, D.; Weinberg, R.A. Hallmarks of cancer: The next generation. Cell. 2011, 144, 646–674. [Google Scholar] [CrossRef]
  29. Zeng, Z.; Lin, H.; Zhao, X.; Liu, G.; Wang, X.; Xu, R.; Chen, K.; Li, J.; Song, L. Overexpression of GOLPH3 promotes proliferation and tumorigenicity in breast cancer via suppression of the FOXO1 transcription factor. Clin. Cancer Res. 2012, 18, 4059–4069. [Google Scholar] [CrossRef]
  30. Kunigou, O.; Nagao, H.; Kawabata, N.; Ishidou, Y.; Nagano, S.; Maeda, S.; Komiya, S.; Setoguchi, T. Role of GOLPH3 and GOLPH3L in the proliferation of human rhabdomyosarcoma. Oncol. Rep. 2011, 26, 1337–1342. [Google Scholar] [CrossRef] [Green Version]
  31. Zhang, L.J.; Wang, K.B.; Liu, L.S.; Chen, L.Z.; Peng, B.G.; Liang, L.J.; Li, Z.; Xue, L.; Li, W.; Xia, J.T. Overexpression of GOLPH3 is associated with poor prognosis and clinical progression in pancreatic ductal adenocarcinoma. BMC Cancer 2014, 14, 571–577. [Google Scholar] [CrossRef] [PubMed]
  32. Zhang, Q.; Zhuang, J.; Deng, Y.; Zhao, X.; Tang, B.; Yao, D.; Zhao, W.; Chang, C.; Lu, Q.; Chen, W.; et al. GOLPH3 is a potential therapeutic target and a prognostic indicator of poor survival in bladder cancer treated by cystectomy. Oncotarget 2015, 6, 32177–32192. [Google Scholar] [CrossRef] [PubMed]
  33. Xue, Y.; Wu, G.; Liao, Y.; Xiao, G.; Ma, X.; Zou, X.; Zhang, G.; Xiao, R.; Wang, X.; Liu, Q.; et al. GOLPH3 is a novel marker of poor prognosis and a potential therapeutic target in human renal cell carcinoma. Br. J. Cancer 2014, 110, 2250–2260. [Google Scholar] [CrossRef] [PubMed]
  34. Ma, Y.; Wang, X.; Wu, Y.; Sun, B.; Lv, H.; Rong, F.; Zheng, X. Overexpression of GOLPH3 protein is associated with worse prognosis in patients with epithelial ovarian cancer. Tumour Biol. 2014, 35, 11845–11849. [Google Scholar] [CrossRef] [PubMed]
  35. Buschman, M.D.; Rahajeng, J.; Field, S.J. GOLPH3 links the Golgi, DNA damage, and cancer. Cancer Res. 2015, 75, 624–627. [Google Scholar] [CrossRef] [PubMed]
  36. Buschman, M.D.; Xing, M.; Field, S.J. The GOLPH3 pathway regulates Golgi shape and function and is activated by DNA damage. Front. Neurosci. 2015, 9, 362–365. [Google Scholar] [CrossRef] [PubMed]
  37. Lord, C.J.; Ashworth, A. The DNA damage response and cancer therapy. Nature 2012, 481, 287–294. [Google Scholar] [CrossRef] [PubMed]
  38. Neumayer, G.; Belzil, C.; Gruss, O.J.; Nguyen, M.D. TPX2: Of spindle assembly, DNA damage response, and cancer. Cell Mol. Life. Sci. 2014, 71, 3027–3047. [Google Scholar] [CrossRef] [PubMed]
  39. Neumayer, G.; Nguyen, M.D. TPX2 impacts acetylation of histone H4 at lysine 16: Implications for DNA damage response. PLoS ONE 2014, 9, e110994. [Google Scholar] [CrossRef]
  40. Carter, S.L.; Eklund, A.C.; Kohane, I.S.; Harris, L.N.; Szallasi, Z. A signature of chromosomal instability inferred from gene expression profiles predicts clinical outcome in multiple human cancers. Nat. Genet. 2006, 38, 1043–1048. [Google Scholar] [CrossRef] [PubMed]
  41. Aguirre-Portoles, C.; Bird, A.W.; Hyman, A.; Cañamero, M.; Pérez de Castro, I.; Malumbres, M. Tpx2 controls spindle integrity, genome stability, and tumor development. Cancer Res. 2012, 72, 1518–1528. [Google Scholar] [CrossRef] [PubMed]
  42. Liu, H.C.; Zhang, Y.; Wang, X.L.; Qin, W.S.; Liu, Y.H.; Zhang, L.; Zhu, C.L. Upregulation of the TPX2 gene is associated with enhanced tumor malignance of esophageal squamous cell carcinoma. Biomed. Pharmacother. 2013, 67, 751–755. [Google Scholar] [CrossRef] [PubMed]
  43. Chang, H.; Wang, J.; Tian, Y.; Xu, J.; Gou, X.; Cheng, J. The TPX2 gene is a promising diagnostic and therapeutic target for cervical cancer. Oncol. Rep. 2012, 27, 1353–1359. [Google Scholar] [CrossRef] [PubMed] [Green Version]
  44. Zou, Z.; Zheng, B.; Li, J.; Lv, X.; Zhang, H.; Yu, F.; Kong, L.; Li, Y.; Yu, M.; Fang, L.; et al. TPX2 level correlates with cholangiocarcinoma cell proliferation, apoptosis, and EMT. Biomed. Pharmacother. 2018, 107, 1286–1293. [Google Scholar] [CrossRef] [PubMed]
  45. Yao, Y.; Zuo, J.; Wei, Y. Targeting of TPX2 by miR-330-3p in melanoma inhibits proliferation. Biomed. Pharmacother. 2018, 107, 1020–1029. [Google Scholar] [CrossRef] [PubMed]
  46. Zou, J.; Huang, R.Y.; Jiang, F.N.; Chen, D.X.; Wang, C.; Han, Z.D.; Liang, Y.X.; Zhong, W.D. Overexpression of TPX2 is associated with progression and prognosis of prostate cancer. Oncol. Lett. 2018, 16, 2823–2832. [Google Scholar] [CrossRef] [PubMed]
  47. Wei, P.; Zhang, N.; Xu, Y.; Li, X.; Shi, D.; Wang, Y.; Li, D.; Cai, S. TPX2 is a novel prognostic marker for the growth and metastasis of colon cancer. J. Transl. Med. 2013, 11, 313–315. [Google Scholar] [CrossRef] [PubMed]
  48. Fernandez-Capetillo, O.; Lee, A.; Nussenzweig, M.; Nussenzweig, A. H2AX: The histone guardian of the genome. DNA Repair. 2004, 3, 959–967. [Google Scholar] [CrossRef]
  49. Ivashkevich, A.N.; Martin, O.A.; Smith, A.J.; Redon, C.E.; Bonner, W.M.; Martin, R.F.; Lobachevsky, P.N. γH2AX foci as a measure of DNA damage: A computational approach to automatic analysis. Mutat. Res. 2011, 711, 49–60. [Google Scholar] [CrossRef]
  50. Marimpietri, D.; Brignole, C.; Nico, B.; Pastorino, F.; Pezzolo, A.; Piccardi, F.; Cilli, M.; Di Paolo, D.; Pagnan, G.; Longo, L.; et al. Combined therapeutic effects of vinblastine and rapamycin on human neuroblastoma growth, apoptosis, and angiogenesis. Clin. Cancer Res. 2007, 13, 3977–3988. [Google Scholar] [CrossRef]
  51. Brignole, C.; Marimpietri, D.; Pastorino, F.; Nico, B.; Di Paolo, D.; Cioni, M.; Piccardi, F.; Cilli, M.; Pezzolo, A.; Corrias, M.V.; et al. Effect of bortezomib on human neuroblastoma cell growth, apoptosis, and angiogenesis. J. Natl. Cancer Inst. 2006, 98, 1142–1157. [Google Scholar] [CrossRef] [PubMed]
  52. Nakagawa-Yagi, Y. Induction of apoptotic cell death in differentiating neuroblastoma SH-SY5Y cells by colchicine. Biochem Biophys Res Commun. 1994, 199, 807–817. [Google Scholar] [CrossRef] [PubMed]
  53. Neumayer, G.; Helfricht, A.; Shim, S.Y.; Le, H.T.; Lundin, C.; Belzil, C.; Chansard, M.; Yu, Y.; Lees-Miller, S.P.; Gruss, O.J.; et al. Targeting protein for xenopus kinesin-like protein 2 (TPX2) regulates γ-histone 2AX (γ-H2AX) levels upon ionizing radiation. J. Biol. Chem. 2012, 287, 42206–42222. [Google Scholar] [CrossRef] [PubMed]
  54. Janoueix-Lerosey, I.; Schleiermacher, G.; Michels, E.; Mosseri, V.; Ribeiro, A.; Lequin, D.; Vermeulen, J.; Couturier, J.; Peuchmaur, M.; Valent, A.; et al. Overall genomic pattern is a predictor of outcome in neuroblastoma. J. Clin. Oncol. 2009, 27, 1026–1033. [Google Scholar] [CrossRef] [PubMed]
  55. Zimmerman, M.W.; Liu, Y.; He, S.; Durbin, A.D.; Abraham, B.J.; Easton, J.; Shao, Y.; Xu, B.; Zhu, S.; Zhang, X.; et al. MYC Drives a Subset of High-Risk Pediatric Neuroblastomas and Is Activated through Mechanisms Including Enhancer Hijacking and Focal Enhancer Amplification. Cancer Discov. 2018, 8, 320–335. [Google Scholar] [CrossRef] [PubMed]
  56. Huang, R.; Cheung, N.K.; Vider, J.; Cheung, I.Y.; Gerald, W.L.; Tickoo, S.K.; Holland, E.C.; Blasberg, R.G. MYCN and MYC regulate tumor proliferation and tumorigenesis directly through BMI1 in human neuroblastomas. FASEB J. 2011, 25, 4138–4149. [Google Scholar] [CrossRef] [PubMed] [Green Version]
  57. Ciccia, A.; Elledge, S.J. The DNA damage response: Making it safe to play with knives. Mol. Cell 2010, 40, 179–204. [Google Scholar] [CrossRef]
  58. Morandell, S.; Yaffe, M.B. Exploiting synthetic lethal interactions between DNA damage signaling, checkpoint control, and p53 for targeted cancer therapy. In Progress in Molecular Biology and Translational Science; Doetsch, P.V., Ed.; Academic Press: New York, NY, USA, 2012; Volume 110, pp. 289–314. [Google Scholar] [CrossRef]
  59. Shehzad, A.; Lee, Y.S. Molecular mechanisms of curcumin action: Signal transduction. BioFactors 2013, 39, 27–36. [Google Scholar] [CrossRef]
  60. Aggarwal, B.B.; Kumar, A.; Bharti, A.C. Anticancer potential of curcumin: Preclinical and clinical studies. Anticancer. Res. 2003, 23, 363–398. [Google Scholar]
  61. Epstein, J.; Sanderson, I.R.; Macdonald, T.T. Curcumin as a therapeutic agent: The evidence from in vitro, animal and human studies. Br. J. Nutr. 2010, 103, 1545–1557. [Google Scholar] [CrossRef] [PubMed]
  62. Freudlsperger, C.; Greten, J.; Schumacher, U. Curcumin induces apoptosis in human neuroblastoma cells via inhibition of NFkappaB. Anticancer Res. 2008, 28, 209–214. [Google Scholar] [PubMed]
  63. Ketron, A.C.; Gordon, O.N.; Schneider, C.; Osheroff, N. Oxidative metabolites of curcumin poison human type II topoisomerases. Biochemistry 2013, 52, 221–227. [Google Scholar] [CrossRef] [PubMed]
  64. Wang, C.; Song, X.; Shang, M.; Zou, W.; Zhang, M.; Wei, H.; Shao, H. Curcumin exerts cytotoxicity dependent on reactive oxygen species accumulation in non-small-cell lung cancer cells. Future Oncol. 2019, 15, 1243–1253. [Google Scholar] [CrossRef] [PubMed]
  65. Yin, H.; Zhou, Y.; Wen, C.; Zhou, C.; Zhang, W.; Hu, X.; Wang, L.; You, C.; Shao, J. Curcumin sensitizes glioblastoma to temozolomide by simultaneously generating ROS and disrupting AKT/mTOR signaling. Oncol. Rep. 2014, 32, 1610–1616. [Google Scholar] [CrossRef] [PubMed]
  66. Liontas, A.; Yeger, H. Curcumin and resveratrol induce apoptosis and nuclear translocation and activation of p53 in human neuroblastoma. Anticancer Res. 2004, 24, 987–998. [Google Scholar]
  67. Ting, C.Y.; Wang, H.E.; Yu, C.C.; Liu, H.C.; Liu, Y.C.; Chiang, I.T. Curcumin Triggers DNA Damage and Inhibits Expression of DNA Repair Proteins in Human Lung Cancer Cells. Anticancer Res. 2015, 35, 3867–3873. [Google Scholar]
  68. Ji, Z. Targeting DNA damage and repair by curcumin. Breast Cancer 2010, 4, 1–3. [Google Scholar]
  69. Blasiak, J.; Trzeciak, A.; Kowalik, J. Curcumin damages DNA in human gastric mucosa cells and lymphocytes. J. Environ. Pathol. Toxicol. Oncol. 1999, 18, 271–276. [Google Scholar]
  70. Cao, J.; Jia, L.; Zhou, H.M.; Liu, Y.; Zhong, L.F. Mitochondrial and nuclear DNA damage induced by curcumin in human hepatoma G2 cells. Toxicol. Sci. 2006, 91, 476–483. [Google Scholar] [CrossRef]
  71. Lu, J.J.; Cai, Y.J.; Ding, J. Curcumin induces DNA damage and caffeine-insensitive cell cycle arrest in colorectal carcinoma HCT116 cells. Mol. Cell. Biochem. 2011, 354, 247–252. [Google Scholar] [CrossRef] [PubMed]
  72. Rowe, D.L.; Ozbay, T.; O’Regan, R.M.; Nahta, R. Modulation of the BRCA1 Protein and Induction of Apoptosis in Triple Negative Breast Cancer Cell Lines by the Polyphenolic Compound Curcumin. Breast Cancer 2009, 3, 61–75. [Google Scholar] [CrossRef] [PubMed]
  73. Ravindran, J.; Prasad, S.; Aggarwal, B.B. Curcumin and cancer cells: How many ways can curry kill tumor cells selectively? AAPS J. 2009, 11, 495–510. [Google Scholar] [CrossRef] [PubMed]
  74. Jaroonwitchawan, T.; Chaicharoenaudomrung, N.; Namkaew, J.; Noisa, P. Curcumin attenuates paraquat-induced cell death in human neuroblastoma cells through modulating oxidative stress and autophagy. Neurosci. Lett. 2017, 636, 40–47. [Google Scholar] [CrossRef] [PubMed]
  75. Lin, X.; Han, L.; Weng, J.; Wang, K.; Chen, T. Rapamycin inhibits proliferation and induces autophagy in human neuroblastoma cells. Biosci. Rep. 2018, 38, 6. [Google Scholar] [CrossRef] [PubMed]
  76. Yu, Y.; Zhang, J.; Jin, Y.; Yang, Y.; Shi, J.; Chen, F.; Han, S.; Chu, P.; Lu, J.; Wang, H.; et al. MiR-20a-5p suppresses tumor proliferation by targeting autophagy-related gene 7 in neuroblastoma. Cancer Cell Int. 2018, 18, 5. [Google Scholar] [CrossRef] [PubMed]
  77. Cheng, X.; Xu, Q.; Zhang, Y.; Shen, M.; Zhang, S.; Mao, F.; Li, B.; Yan, X.; Shi, Z.; Wang, L.; et al. miR-34a inhibits progression of neuroblastoma by targeting autophagy-related gene 5. Eur. J. Pharmacol. 2019, 850, 53–63. [Google Scholar] [CrossRef]
  78. Shukla, N.; Ameur, N.; Yilmaz, I.; Nafa, K.; Lau, C.Y.; Marchetti, A.; Borsu, L.; Barr, F.G.; Ladanyi, M. Oncogene Mutation Profiling of Pediatric Solid Tumors Reveals Significant Subsets of Embryonal Rhabdomyosarcoma and Neuroblastoma With Mutated Genes in Growth Signaling Pathways. Clin. Cancer Res. 2011, 18, 748–757. [Google Scholar] [CrossRef]
  79. Eleveld, T.F.; Oldridge, D.A.; Bernard, V.; Koster, J.; Colmet Daage, L.; Diskin, S.J.; Schild, L.; Bentahar, N.B.; Bellini, A.; Chicard, M.; et al. Relapsed Neuroblastomas Show Frequent RAS-MAPK Pathway Mutations. Nat. Genet. 2015, 47, 864–873. [Google Scholar] [CrossRef]
  80. Holzel, M.; Huang, S.; Koster, J.; Ora, I.; Lakeman, A.; Caron, H.; Nijkamp, W.; Xie, J.; Callens, T.; Asgharzadeh, S.; et al. NF1 Is a Tumor Suppressor in Neuroblastoma that Determines Retinoic Acid Response and Disease Outcome. Cell 2010, 142, 218–229. [Google Scholar] [CrossRef] [Green Version]
  81. Woodfield, S.E.; Zhang, L.; Scorsone, K.; Liu, Y.; Zage, P.E. Binimetinib Inhibits MEK and is Effective Against Neuroblastoma Tumor Cells with Low NF1 Expression. BMC Cancer 2016, 16, 172. [Google Scholar] [CrossRef] [PubMed]
  82. Eleveld, T.F.; Schild, L.; Koster, J.; Zwijnenburg, D.A.; Alles, L.K.; Ebus, M.E.; Volckmann, R.; Tijtgat, G.A.; van Sluis, P.; Versteeg, R.; et al. RAS-MAPK Pathway-Driven Tumor Progression Is Associated with Loss of CIC and Other Genomic Aberrations in Neuroblastoma. Cancer Res. 2018, 78, 6297–6307. [Google Scholar] [CrossRef] [PubMed]
  83. Wei, J.H.; Zhang, Z.C.; Wynn, R.M.; Seemann, J. GM130 Regulates Golgi-Derived Spindle Assembly by Activating TPX2 and Capturing Microtubules. Cell 2015, 162, 287–299. [Google Scholar] [CrossRef] [PubMed] [Green Version]
  84. Takahashi, Y.; Sheridan, P.; Niida, A.; Sawada, G.; Uchi, R.; Mizuno, H.; Kurashige, J.; Sugimachi, K.; Sasaki, S.; Shimada, Y.; et al. The AURKA/TPX2 axis drives colon tumorigenesis cooperatively with MYC. Ann. Oncol. 2015, 26, 935–942. [Google Scholar] [CrossRef] [PubMed]
  85. Shaw, G.; Morse, S.; Ararat, M.; Graham, F.L. Preferential transformation of human neuronal cells by human adenoviruses and the origin of HEK 293 cells. FASEB J. 2002, 16, 869–871. [Google Scholar] [CrossRef] [PubMed]
  86. Shen, C.; Gu, M.; Song, C.; Miao, L.; Hu, L.; Liang, D.; Zheng, C. The tumorigenicity diversification in human embryonic kidney 293 cell line cultured in vitro. Biologicals 2008, 36, 263–268. [Google Scholar] [CrossRef]
  87. Shehzad, A.; Lee, Y.S. Curcumin: Multiple molecular targets mediate multiple pharmacological actions: A review. Drugs Fut. 2010, 35, 113–119. [Google Scholar] [CrossRef]
  88. Park, J.R.; Bagatell, R.; Cohn, S.L.; Pearson, A.D.; Villablanca, J.G.; Berthold, F.; Burchill, S.; Boubaker, A.; McHugh, K.; Nuchtern, J.G.; et al. Revisions to the International neuroblastoma response criteria: A consensus statement from the National Cancer Institute clinical trials planning meeting. J. Clin. Oncol. 2017, 35, 2580–2587. [Google Scholar] [CrossRef]
  89. Ladenstein, R.; Valteau-Couanet, D.; Brock, P.; Yaniv, I.; Castel, V.; Laureys, G.; Malis, J.; Papadakis, V.; Lacerda, A.; Ruud, E.; et al. Randomized Trial of prophylactic granulocyte colony-stimulating factor during rapid COJEC induction in pediatric patients with high-risk neuroblastoma: The European HR-NBL1/SIOPEN study. J. Clin. Oncol. 2010, 28, 3516–3524. [Google Scholar] [CrossRef]
  90. Pezzolo, A.; Parodi, F.; Marimpietri, D.; Raffaghello, L.; Cocco, C.; Pistorio, A.; Mosconi, M.; Gambini, C.; Cilli, M.; Deaglio, S.; et al. Oct-4+/Tenascin C+ neuroblastoma cells serve as progenitors of tumor-derived endothelial cells. Cell Res. 2011, 21, 1470–1486. [Google Scholar] [CrossRef]
  91. Ferreira-Facio, C.S.; Milito, C.; Botafogo, V.; Fontana, M.; Thiago, L.S.; Oliveira, E.; da Rocha-Filho, A.S.; Werneck, F.; Forny, D.N.; Dekermacher, S.; et al. Contribution of multiparameter flow cytometry immunophenotyping to the diagnostic screening and classification of pediatric cancer. PLoS ONE 2013, 8, e55534. [Google Scholar] [CrossRef] [PubMed]
  92. Ognibene, M.; Pagnan, G.; Marimpietri, D.; Cangelosi, D.; Cilli, M.; Benedetti, M.C.; Boldrini, R.; Garaventa, A.; Frassoni, F.; Eva, A.; et al. CHL1 gene acts as a tumor suppressor in human neuroblastoma. Oncotarget 2018, 9, 25903–25921. [Google Scholar] [CrossRef] [PubMed]
  93. Parodi, S.; Pistorio, A.; Erminio, G.; Ognibene, M.; Morini, M.; Garaventa, A.; Gigliotti, A.R.; Haupt, R.; Frassoni, F.; Pezzolo, A. Loss of whole chromosome X predicts prognosis of neuroblastoma patients with numerical genomic profile. Pediatr. Blood. Cancer. 2019, 66, e27635. [Google Scholar] [CrossRef] [PubMed]
  94. Zhang, W.; Yu, Y.; Hertwig, F.; Thierry-Mieg, J.; Thierry-Mieg, D.; Wang, J.; Furlanello, C.; Devanarayan, V.; Cheng, J.; Deng, Y.; et al. Comparison of RNA-seq and microarray-based models for clinical endpoint prediction. Genome Biol. 2015, 16, 133. [Google Scholar] [CrossRef] [PubMed]
  95. Valentijn, L.J.; Koster, J.; Haneveld, F.; Aissa, R.A.; van Sluis, P.; Broekmans, M.E.; Molenaar, J.J.; van Nes, J.; Versteeg, R. Functional MYCN signature predicts outcome of neuroblastoma irrespective of MYCN amplification. Proc. Natl. Acad. Sci. USA 2012, 109, 19190–19195. [Google Scholar] [CrossRef] [PubMed]
  96. Johnsen, J.I.; Segerström, L.; Orrego, A.; Elfman, L.; Henriksson, M.; Kågedal, B.; Eksborg, S.; Sveinbjörnsson, B.; Kogner, P. Inhibitors of mammalian target of rapamycin downregulate MYCN protein expression and inhibit neuroblastoma growth in vitro and in vivo. Oncogene 2008, 27, 2910–2922. [Google Scholar] [CrossRef] [PubMed]
  97. Mody, R.; Zhao, L.; Yanik, G.A.; Opipari, V. Phase I study of bortezomib in combination with irinotecan in patients with relapsed/refractory high-risk neuroblastoma. Pediatr. Blood. Cancer 2019, 64, e26563. [Google Scholar] [CrossRef] [PubMed]
  98. Massarotti, A.; Theeramunkong, S.; Mesenzani, O.; Caldarelli, A.; Genazzani, A.A.; Tron, G.C. Identification of novel antitubulin agents by using a virtual screening approach based on a 7-point pharmacophore model of the tubulin colchi-site. Chem. Biol. Drug Des. 2011, 78, 913–922. [Google Scholar] [CrossRef] [PubMed]
  99. Park, G.B.; Jin, D.H.; Kim, D. Sequential treatment with celecoxib and bortezomib enhances the ER stress-mediated autophagy-associated cell death of colon cancer cells. Oncol. Lett. 2018, 16, 4526–4536. [Google Scholar] [CrossRef] [PubMed]
  100. Bhattacharya, S.; Das, A.; Datta, S.; Ganguli, A.; Chakrabarti, G. Colchicine induces autophagy and senescence in lung cancer cells at clinically admissible concentration: Potential use of colchicine in combination with autophagy inhibitor in cancer therapy. Tumor Biol. 2016, 37, 10653–10664. [Google Scholar] [CrossRef]
Figure 1. Curcumin provoked DNA damage in neuroblastoma cells and up-regulation of GOLPH3 with Golgi dispersal. (A) IMR-32, SH-SY5Y and non-tumorigenic control HEK-293 (CTR) cell lines were cultured in presence of various concentrations of curcumin for 24 h. (B) Cells were cultured with two curcumin concentrations for 24 and 48 h. At each harvest point, cells were trypsinized and counted in Trypan blue. Untreated cells (curcumin 0 µM) were cultured with 0.1% DMSO. Non-tumorigenic control HEK-293 cells (CTR) were cultured with the highest curcumin concentrations used for each NB cell line. Data are representative of three independent experiments ± SD. (C) Immunofluorescence analysis of IMR-32 and SH-SY5Y cells cultured with 10 or 20 µM curcumin respectively for 12, 24 and 48 h using anti-GOLPH3 (green) and anti-γH2AX (red). Cells were counterstained with DAPI to visualize nuclei (blue). Untreated cells were cultured with 0.1% DMSO. (Magnification 40×). In green and red boxes are reported the percentages of GOLPH3 and γH2AX positive cells respectively. Data are representative of three independent experiments ± SD. (D) IMR-32 and SH-SY5Y cells were cultured in presence of two concentrations of curcumin for 48 h, lysed, subjected to Western blot analysis and probed with anti-GOLPH3 antibody. Controls (curcumin 0 µM) were treated with 0.1% DMSO. Protein level was quantified by densitometry, normalized to the content of the loading control protein (actin) and visualized by histogram. Data are representative of three independent experiments ± SD (* p < 0.05; ** p < 0.01; *** p < 0.001)).
Ijms 20 04764 g001
Figure 2. Curcumin reduces activation of MAP-kinases and induces apoptosis and autophagy in neuroblastoma cells. (A) Protein lysates from IMR-32 and SH-SY5Y cells cultured in 10 or 20 µM curcumin respectively for 48 h (C = curcumin) were collected and subjected to Western blot analysis with anti-phospho-p38, anti-phospho-ERK 1/2, and anti-phospho-Akt antibodies. (B) The same protein lysates were blotted again and probed with anti-PARP for apoptosis (cl = cleaved PARP), and anti-Beclin-1 or anti-LC3 antibodies for autophagy (II = LC3-II). Untreated cells (U) were cultured with 0.1% DMSO. Protein levels were quantified by densitometry, normalized to the content of the loading control protein (each total protein or actin) and visualized by histograms. Data are representative of three independent experiments ± SD. (C) MYCN and c-MYC expression in IMR-32 and SH-SY5Y cell lines displayed by Western blot (** p < 0.01; *** p < 0.001).
Ijms 20 04764 g002
Figure 3. Golgi fragmentation is related to autophagy, not to apoptosis in neuroblastoma cells. (A) Comparison among the daily growth rate of untreated cells, of cells treated with curcumin and of cells recovering from 48 h of curcumin treatment, during three days of observation. For the recovery experiment (indicated as post 10 µM and post 20 µM) cells were incubated for 48 h with curcumin 10 or 20 µM and then washed and cultured in drug-free medium for 24, 48 and 72 h. The dashed line indicates the starting point of the recovery experiment observation, corresponding to the 48 h of curcumin treatment. At each harvest point, cells were trypsinized and counted in Trypan blue. Controls (curcumin 0 µM) were treated with 0.1% DMSO. Data are representative of three independent experiments ± SD. (B) Immunofluorescence analysis of IMR-32 and SH-SY5Y cells cultured with 10 or 20 µM curcumin respectively for 48 h and after 48 h post-Curcumin depletion, using anti-GOLPH3 (red) and TUNEL staining (green) to reveal chromatin condensation. In red and green boxes are reported the percentages of GOLPH3 and tunel positive cells respectively. (C) Immunofluorescence analysis of IMR-32 and SH-SY5Y cells using anti-GOLPH3 (red) and anti-Beclin-1 (green). In red and green boxes are reported the percentages of GOLPH3 and Beclin-1 positive cells respectively. Cells were counterstained with DAPI to visualize nuclei (blue). Untreated cells were cultured with 0.1% DMSO. (Magnification 40×). Data are representative of three independent experiments ± SD (** p < 0.01; *** p < 0.001).
Ijms 20 04764 g003
Figure 4. Curcumin treatment induces MYO18A up-regulation and TPX2 activation in neuroblastoma cells. (A) Protein lysates from IMR-32 and SH-SY5Y cells cultured in 10 or 20 µM curcumin respectively for 48 h (C = curcumin) and lysates from the same cells collected 48 h after curcumin depletion (pC = post-curcumin), were subjected to Western blot analysis with anti-GOLPH3 and anti-MYO18A antibodies. (B) The same lysates were subjected to Western blot analysis with anti-γH2AX and anti-TPX2 antibody. Untreated cells (U) were cultured with 0.1% DMSO. Protein levels were quantified by densitometry, normalized to the content of the loading control protein (total H2AX or actin) and visualized by histograms. Data are representative of three independent experiments ± SD (* p < 0.05; ** p < 0.01; *** p < 0.001).
Ijms 20 04764 g004
Figure 5. Golgi dispersal, DNA damage and expression of TPX2 oncogene are effects of chemotherapy in neuroblastoma (NB) patients. (A) Representative images of immunofluorescence analysis of NB tumor samples before (NB1, NB2, NB3) (1,3,5) and after chemotherapy (NB1, NB2) (2,4,6), by anti-GOLPH3 antibody (green) (1,2), anti-γH2AX antibody (red) (3,4) and anti-TPX2 antibody (green) (5,6). Image 7 comes from image 4 merged with image 6, to show the co-localized expression of the two proteins. Cells nuclei are counterstained with DAPI (blue). (Magnification 40×). (B) In the table are reported the percentages of GOLPH3, γH2AX and TPX2 positive cells observed in the 10 NB chemotherapy treated samples (NB1 to NB10), compared to a not treated NB specimen (NB1, NB2 and NB3) (U = untreated tumor; T = chemotherapy treated tumor). Data are representative of three independent observations ± SD.
Ijms 20 04764 g005
Figure 6. Neuroblastoma patient outcomes based on TPX2 expression. (A) Using the neuroblastoma Versteeg (top) and SEQC (bottom) patient datasets in the R2 Genomics Analysis and Visualization Platform (http://r2.amc.nl), patients were divided into high (blue) and low (red) TPX2 gene expression groups and survival curves were generated. Relapse-free survival (top left), event-free survival (bottom left) and overall survival (right) curves are shown with patient numbers in parentheses. (B) Relative TPX2 expression levels were plotted for patients without and with relapse from the Versteeg (top) and SEQC (bottom) patient data sets, with patient numbers shown in parentheses (* p < 0.05).
Ijms 20 04764 g006
Figure 7. Neuroblastoma patient outcomes based on TPX2 expression and disease stage. (A) Using the neuroblastoma Versteeg (top) and SEQC (bottom) patient datasets, survival curves were generated for patients with stage 1, 2, and 4S tumors (left) and with stage 3 and 4 tumors (right). Relapse-free survival (top) and event-free survival (bottom) curves are shown, with patient numbers in parentheses. (B) Relative TPX2 expression levels from the Versteeg (top) and SEQC (bottom) patient data sets were plotted in patients with disease stage (st) 1, 2, 3, 4, and 4S, respectively, with patient numbers shown in parentheses (* p < 0.05).
Ijms 20 04764 g007
Figure 8. Neuroblastoma patient outcomes based on TPX2 expression and MYCN amplification. (A) Using the neuroblastoma SEQC patient data-set in the R2 Genomics Analysis and Visualization Platform (http://r2.amc.nl), patients were divided into high (blue) and low (red) TPX2 gene expression groups by median-centered Log2 ratios and survival curves were generated for patients with MYCN non-amplified tumors (left) and with MYCN amplified tumors (right). Event-free survival (top) and overall survival (bottom) curves are shown, with patient numbers in parentheses. (B) Relative TPX2 expression levels were plotted in patients with MYCN non-amplified and amplified tumors (* p < 0.05).
Ijms 20 04764 g008
Figure 9. TPX2 Expression Compared to Chromosome 1p, 11q, and 17q status. Using the R2 Genomics Analysis and Visualization Platform, TPX2 gene expression in the Lastowska (upper) and Maris (lower) data sets was compared in patients with wild-type chromosome 1p or with 1p deletion (A), in patients with wild-type chromosome 11q or with 11q deletion (B), and in patients with wild-type chromosome 17q or with 17q gain (C). Patients’ numbers are shown in parentheses. (WT = Wild Type; Del = Deletion) (* p < 0.05).
Ijms 20 04764 g009
Figure 10. Schematic model of the proposed neuroblastoma (NB) cells resistance to death induced by DNA damaging agents. DNA damage agents induce chromosomal double-strand breaks in the nucleus, where chromatin is physically connected to the nuclear envelope, which is continuous with endoplasmic reticulum (ER). Membrane areas of close apposition connect ER with Golgi apparatus and with the plasma membrane. DNA double-strand breaks generate a signal leading to augmented Golgi protein GOLPH3 interaction with MYO18A, inducing Golgi dispersal and impaired intracellular trafficking with functional consequences for the cell. In the cytoplasm, Golgi fragmentation is accompanied by activation of protective autophagy. In the nucleus, over-expression of TPX2 induces DNA damage response with resulting DNA repair. The combined effects of the two intertwined mechanisms can support enhanced survival and NB cell resistance to chemotherapy.
Ijms 20 04764 g010
Table 1. Clinicopathological characteristics of Neuroblastoma (NB) patients and post-chemotherapy tumor samples examined.
CaseAge MonthsStage INSSTherapy ProtocolMYCN StatusDel 1pDel 11qGain 17qChemotherapy (Rapid COJEC)Immunotherapy (Anti-GD2) Response to Chemotherapy RelapseOverall Survival
NB 1663HR-NBL-1AmplifiedYYYYNPartialYDead of disease
NB 2703HR-NBL-1AmplifiedNNYYNPartialYDead of disease
NB 31783HR-NBL-1AmplifiedNYYYNPartialYDead of disease
NB 4803HR-NBL-1AmplifiedYYYYNPartialYDead of disease
NB 5534HR-NBL-1AmplifiedYNYYNPartialYDead of disease
NB 6204HR-NBL-1AmplifiedYNYYYPartialYDead of disease
NB 7373HR-NBL-1AmplifiedYYYYNPartialYDead of disease
NB 8654HR-NBL-1Non-AmplifiedNNYYYPartialYDead of disease
NB 9634HR-NBL-1Non-AmplifiedNYYYNPartialNDead of disease
NB1074HR-NBL-1AmplifiedYNYYNPartialYDead of disease
INSS = International Neuroblastoma Staging System; Y = yes; N = no; Del = Deletion; 1p, 11q, 17q = chromosomes arms affected by deletion or gain in NB.

