Abstract
Phylogenetic framework for the closely related Ancylodiscoidinae and Ancyrocephalinae subfamilies remains contentious. As this issue was never studied using a large molecular marker, we sequenced the first two Ancylodiscoidinae mitogenomes: Thaparocleidus asoti and Thaparocleidus varicus. Both mitogenomes had two non-coding regions (NCRs) that contained a number of repetitive hairpin-forming elements (RHE). Due to these, the mitogenome of T. asoti (16,074 bp) is the longest among the Monogenea; especially large is its major NCR, with 3500 bp, approximately 1500 bp of which could not be sequenced (thus, the total mitogenome size is ≈ 17,600 bp). Although RHEs have been identified in other monopisthocotyleans, they appear to be independently derived in different taxa. The presence of RHEs may have contributed to the high gene order rearrangement rate observed in the two mitogenomes, including the first report of a transposition of rRNA genes within the Neodermata. Phylogenetic analyses using mitogenomic dataset produced Dactylogyrinae embedded within the Ancyrocephalinae (paraphyly), whereas Ancylodiscoidinae formed a sister-group with them. This was also supported by the gene order analysis. 28S rDNA dataset produced polyphyletic Dactylogyridae and Ancyrocephalinae. The phylogeny of the two subfamilies shall have to be further evaluated with more data.
1. Background
Species from the genus Thaparocleidus (Ancylodiscoidinae or Ancylodiscoididae, see below) are common monogenean parasites found in catfishes, but their phylogeny remains debated. Half a century ago, in Bychowsky’s classification [1], this genus (and other genera nowadays putatively assigned to Ancylodiscoidinae) was originally assigned to the subfamily Ancyrocephalinae, family Dactylogyridae. Price [2] and Gusev [3] later assigned some of the genera from Ancyrocephalinae to three new subfamilies within the Dactylogyridae: Ancylodiscoidinae, Heteronchocleidinae and Anacanthorinae. Later, Bychowsky and Nagibina [4] excluded Ancyrocephalinae from the family Dactylogyridae, and gave it the family status (Ancyrocephalidae). They also assigned Ancylodiscoidinae into this newly established family. However, Kritsky and Boeger [5] found that Ancyrocephalidae was not a monophyletic group, and suggested placing all subfamilies within this family back into the family Dactylogyridae, as well as reverting the Ancyrocephalidae back to the subfamily status (within the Dactylogyridae). Finally, Lim, et al. [6] proposed to elevate the Ancylodiscoidinae to the family status. These incompatible classifications demonstrate the deeply complex and unresolved relationship of Ancylodiscoidinae and Ancyrocephalinae. However, as all of the above studies were based on morphological data, several studies later attempted to resolve the phylogenetic relationships within the family Dactylogyridae using molecular data: 18S rDNA [7], 28S rDNA [8], and a combination of 18S, 28S and 16S rDNA [9]. In these studies, predominantly marine Ancyrocephalinae species (with a few freshwater outliers, see clade B in [8]) constantly clustered with the Dactylogyrinae and Pseudodactylogyrinae species (M-clade henceforth). However, Ancylodiscoidinae either formed a sister-clade with freshwater Ancyrocephalinae species [7,9,10], or grouped with Ancyrocephalinae species that parasitize on Siluriformes (AA-clade, henceforth) [8]. In the latter results, M-clade formed a sister-clade with AA-clade (but with low support), whereas freshwater Ancyrocephalinae were basal to them, i.e., formed a sister-clade with the former two groups. Therefore, both morphological and molecular studies failed to obtain monophyletic Ancyrocephalinae, and the relationship of Ancylodiscoidinae and Ancyrocephalinae remains unresolved.
Several previous studies suggest that morphological characters are a poor phylogenetic marker in many microscopic parasitic animals, often exhibiting host-specific morphological variability [11,12,13]. It is likely that at least part of the underlying cause for the multiple incongruent hypotheses inferred using morphological data. Small molecular markers often also have limited resolving power [14], but relationships of Ancylodiscoidinae and Ancyrocephalinae have not been studied using a large molecular marker (previous molecular studies employed 1 to 3 genes), comprised of multiple concatenated genes, due to unavailability of suitable data. Although such markers can also produce conflicting and homoplastic signals [15,16], and despite the fact that there may not exist such a thing as the ‘accurate’ phylogenetic tree [17], the high resolution that they carry may help us shed some light on the contentious relationships of Ancylodiscoidinae and Ancyrocephalinae. Due to a number of peculiarities that make them a suitable candidate for such tasks, mitochondrial genomes (mitogenomes) have become a popular tool in population genetics [18], phylogenetics [19,20] and diagnostics [21] studies.
Among the monogenean mitogenomes available in the GenBank, Ancyrocephalinae are relatively well-represented with seven mitogenomes, but Ancylodiscoidinae currently remain unrepresented. This scarcity of data has thus far hampered studies of the phylogeny of Ancylodiscoidinae and Ancyrocephalinae subfamilies from the mitogenomic perspective. To address this, we sequenced and characterized the mitogenomes of two Ancylodiscoidinae species: Thaparocleidus asoti and Thaparocleidus varicus. Here, we used the newly sequenced mitogenomes and the data available from public databases to investigate phylogenetic relationships of the two subfamilies, and their position within the family Dactylogyridae.
2. Results
2.1. Genome Organization and Base Composition
The complete mitogenome of Thaparocleidus varicus (MN151339) was 14,088 bp in size, and the nearly complete mitogenome of Thaparocleidus asoti (MN151340) was 16,074 bp in size (Figure 1). Both mitogenomes contain the standard [22] 36 flatworm mitochondrial genes, including 12 protein-encoding genes (PCGs; atp8 is absent), 22 tRNA genes and two rRNA genes (Table 1 and Figure 1). Majority of PCGs of the two studied mitogenomes used standard initial codons for the genetic code 9 (echinoderm and flatworm mitochondrion): ATG or GTG. However, it proved difficult to determine the initial codons of the nad4 and cox1 genes in T. varicus. Canonical stop codons for the genetic code 9 (echinoderm and flatworm mitochondrion), TAA and TAG, were found in all 12 PCGs, except for cox2 in T. asoti, which used the abbreviated T-- codon (Table 1). The architecture and similarity of orthologous sequences for the two studied mitogenomes are summarized in Table 1. Average sequence similarity of PCGs between the two studied Thaparocleidus mitogenomes ranged from 68.89% (nad4L) to 84.22% (cytb) (Table 1). We also investigated the codon usage, RSCU, and codon family (corresponding to the amino acids) proportions between the two Thaparocleidus species (Supplementary Figure S1). Leu2, Phe, Ile and Val were the most common codon families, predominantly encoded by adenosine and thymine-rich codons, such as TTA in Leu2, TTT in Phe, ATT and ATA in Ile (Supplementary Figure S1).
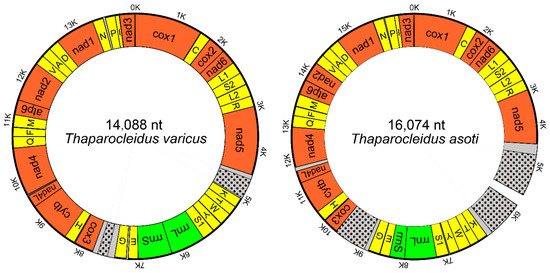
Figure 1.
Maps of the circular mitochondrial genomes of Thaparocleidus asoti and Thaparocleidus varicus. Protein-coding genes are red, tRNAs are yellow, rRNAs are green, and non-coding regions (NCR) are grey. The location of the highly repetitive regions (HRR) within NCR are shown with black spot. The unsequenced gap is shown in the in the NCR of T. asoti.

Table 1.
Comparison of the annotated mitochondrial genomes of Thaparocleidus asoti and Thaparocleidus varicus. Negative values in the ‘Intergenic Nucleotides’ column indicate overlaps.
2.2. Non-Coding Regions
Two large non-coding regions (NCR1 and NCR2) were found in both mitogenomes (Figure 2). NCR1 was located between nad5 and trnK genes, whereas NCR2 was positioned between trnG and cox3 (Figure 2). NCR1 of T. varicus was 478 bp in size. We managed to sequence only 2020 bp of the NCR1 of T. asoti, but we have successfully amplified it and estimated its size to be approximately 3500 bp. Therefore, we estimate that around 1480 bp remains unsequenced. NCR2 was 792 bp and 416 bp in size in T. asoti and T. varicus, respectively.
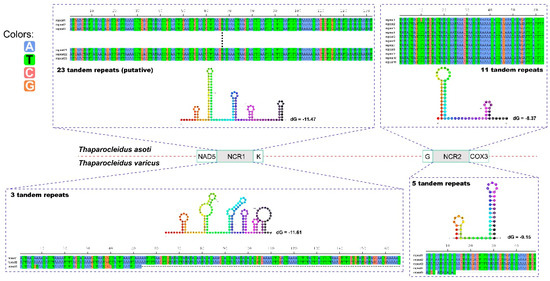
Figure 2.
Stem-loop structures of the consensus repeat patterns in repetitive regions of the non-coding regions of Thaparocleidus asoti and Thaparocleidus varicus. Thermodynamic energy values (dG) are shown next to the secondary structures. The nucleotide A is blue, T is green, C is deep pink and D is orange.
All the NCRs contained highly repetitive regions (HRR). As the sequencing gap of T. asoti was located in the central of HRR of the NCR1, we hypothesized that the gap was probably composed of tandem repeats (TRs). In this way, counting the unsequenced gap, the HRR of NCR1 in T. asoti probably contained 23 uninterrupted TRs, assuming identical repeat units (132 bp, Figure 2). The HRR of NCR2 in T. asoti was comprised of 11 uninterrupted TRs, where repeat units 2–11 were identical (63 bp), whereas unit 1 exhibited one nucleotide mutation at the tenth position (Figure 2). Similarly, HRR of NCR1 in T. varicus was composed of three 166 bp-long TRs, where repeat unit 3 was severely truncated to only 53 bp (lost 113 nucleotides at the 3′ end), and had a nucleotide mutation at the seventh, eighth and 40th positions (Figure 2). The HRR of NCR2 in T. varicus was composed of five TRs, where repeat units 1–4 were identical (48 bp), whereas unit 5 only contained the first 13 nucleotides of the TR, and it exhibited one A to C mutation at the third position and one nucleotide deletion at the fifth position (Figure 2). The consensus repeat patterns of all HRRs in T. asoti and T. varicus are capable of forming double to hexa stem-loop structures (Figure 2).
2.3. Phylogeny
Regardless of the method used, Bayesian inference (BI) and maximum likelihood (ML) produced identical topologies (Figure 3). Gyrodactylidea was placed at the base of Monopisthocotylea, whereas the rest of monopisthocotyleans were split into two clades: Tetraonchidea and Dactylogyridea + Capsalidea. Most of the nodes exhibited high support values, except for some internal nodes of Dactylogyridae (Figure 3). Despite these low support values, among the three Dactylogyridae subfamilies, Ancyrocephalinae was rendered paraphyletic by the embedded Dactylogyrinae, whereas Ancylodiscoidinae formed a sister-group with them, with maximum support values (BI/ML = 1/100) (Figure 3). 28S rDNA data also failed to resolve the Ancyrocephalinae/Ancylodiscoidinae debate, as both BI and ML analyses produced instable topologies, with polyphyletic Dactylogyridae and Ancyrocephalinae, and Ancylodiscoidinae embedded within the Ancyrocephalinae (Supplementary Figure S2).
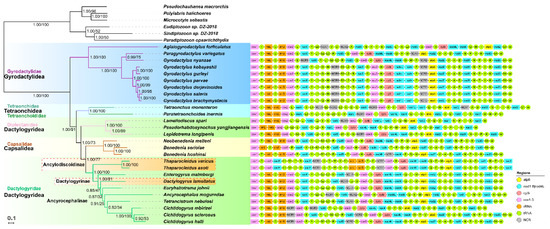
Figure 3.
A phylogram reconstructed using mitogenomes of 33 monogeneans and the mtZOA model. Scale bar corresponds to the estimated number of substitutions per site. Statistical support values of Bayesian analyses and maximum likelihood are shown by the nodes (left/right, respectively). Taxonomic families and orders are shown in different colors. Gene orders and non-coding regions (grey boxes) are shown to the right of the tree.
2.4. Gene Orders
The gene orders (GO) of the two studied Thaparocleidus species are identical, but notably different from other monogeneans, exhibiting many tRNA and rRNA genes’ rearrangements (Figure 3). However, the GO between trnG to trnI is conserved. The high rate of GO rearrangements in the two Thaparocleidus species was further corroborated by the low similarity values produced by pairwise comparisons with other monogeneans: values ranged from 102 (compared with Paratetraonchoides inermis) to 326 (compared with Cichlidogyrus sclerosus), where the value of 1254 indicates identical GOs (Table 2).
Table 2.
Pairwise common interval comparison of mitochondrial gene orders among 12 monopisthocotylean species (only one representative is shown for species with identical gene orders), based on the order of all 36 genes. Scores indicate the similarity between gene orders, where 1254 represents an identical gene order. Shading indicates the level of similarity: light to dark = similar to dissimilar.
3. Discussion
Despite the sequencing gap in the non-coding region, the mitogenome of T. asoti is the longest monogenean mitogenome reported so far. Unlike T. varicus and most other monopisthocotyleans, which have an overlap between nad4L and nad4 genes, T. asoti had an 87 bp gap between them (Supplementary Table S1). The A+T content of the two Thaparocleidus species was relatively high among the 33 selected monogeneans (Supplementary Table S2), and it was notably higher than in other dactylogyrids (Figure 4). The AT skewness of the two Thaparocleidus species was similar to other dactylogyrids, except for Tetrancistrum nebulosi, Ancyrocephalus mogurndae and Euryhaliotrema johnii, which were outliers, with a somewhat lesser magnitude of (negative AT) skews (Figure 4). On the basis of results reported in other related species (Supplementary Table S3), as a working hypothesis, we propose TTG as the initial codon of nad4, and ATT as the start codon of cox1. TTG was proposed as an alternative start codon for flatworm mitogenomes before [23]. Noteworthy, all codons from the four prominent codon families used thymine in the second position. In addition, the second position of the PCGs exhibited the highest negative AT skewness (i.e., T preference) in comparison to other mitogenomic elements (Figure 4). This is probably a reflection of the fact that codons for hydrophobic amino acid residues, which are functionally preferred for conformational stability of mitochondrial proteins, mostly have T in the second codon position [24].
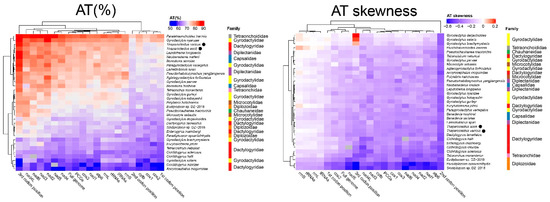
Figure 4.
Hierarchical clustering of the A+T content and AT-skewness of various mitogenomic elements among the monogenean mitogenomes.
The size of the NCRs in T. asoti was much larger than that in T. varicus, resulting in approximately 25% larger mitochondrial genome in this species (Table 3). Repetitive stem-loop elements are not uncommon within the subclass Monopisthocotylea; they were also found in Dactylogyrus lamellatus [25], diplectanids [26] and Tetraonchus monenteron [27]. However, as these species are phylogenetically distant and secondary structures and nucleotide composition of the stem-loop elements were largely different among different species, this suggests multiple independent invasions [28] of these features. These findings consistently reject the hypothesis that monopisthocotylids possess fewer and smaller (in size) TRs in the LNCR than polyopisthocotylids [29]. Since NCRs with repetitive features are believed to indicate control regions [28], and the presence of tandem repeats forming stable secondary structure is often associated with the initiation of replication in mitochondria [20,30,31], it appears likely that these repeat regions are embedded within the control region. Given that the non-sequenced gap in T. asoti was located within the TR region, this would also explain why we failed to sequence this segment, as it is likely that HRRs in this segment formed complex structures that interfered with the sequencing [32,33].
Table 3.
Nucleotide composition and skewness comparison of different elements of the mitochondrial genomes of Thaparocleidus asoti and Thaparocleidus varicus. PCGs: protein-encoding genes.
The ordinal relationships obtained in this study were similar to the topology obtained in an earlier mitogenomic study [26]. Notably, Capsalidea was embedded within the Dactylogyridea order, thus causing paraphyly of the latter order (Figure 3), which was discussed before [26]. With regards to the three Dactylogyridae subfamilies, the results suggest a closer relationship between Ancyrocephalinae and Dactylogyrinae than between Ancylodiscoidinae and Ancyrocephalinae subfamilies, which contradicts some of the morphology-based hypotheses that grouped the species of Ancylodiscoidinae within the Ancyrocephalid(n)ae (sub)family [1,4]. Beyond the Thaparocleidus species and the mesoparasitic Enterogyrus malmbergi, the rest of dactylogyrids belonged to the M-clade (see Background section) [8,10]. However, the freshwater A. mogurndae (Ancyrocephalinae) was embedded within a clade that contained marine E. johnii and T. nebulosi, and freshwater Cichlidogyrus mbirizei, C. sclerosus and C. halli, thus contradicting previous molecular studies, which placed A. mogurndae within the clade containing Pseudodactylogyrinae and Dactylogyrinae [8,10]. However, due to the limited taxon sampling (only 1/7 representatives of the speciose Dactylogyrinae/Ancyrocephalinae subfamilies were available, respectively; and only three of the nine subfamilies within the Dactylogyridae were represented), we cannot infer the relationships of the three subfamilies (Ancylodiscoidinae, Ancyrocephalinae and Dactylogyrinae) with confidence. The instable result indicates that 28S rDNA has too low a resolution to resolve the phylogeny of Dactylogyridae. However, the closer relationship between Ancyrocephalinae and Dactylogyrinae than between Ancylodiscoidinae and Ancyrocephalinae was also supported by our gene order analysis.
The rearrangement of rRNA genes is the first reported within the subphylum Neodermata. In all other neodermatans, these two genes are located between cox1 and cox2 genes [34], but in the two newly-sequenced Thaparocleidus species, they are translocated to the position between nad5 and cox3, together with several tRNA genes (Figure 3). Noteworthy, in dactylogyrideans, tetraonchideans (Figure 3) and cestodes [35], the major NCR is usually found in the region between nad5 and cox3. As we hypothesized that the NCRs of these two Thaparocleidus species harbor the control regions (see “Non-coding regions” section), our results are in agreement with the hypothesis that genes adjacent to the control region exhibit higher rates of rearrangements [36]. This is probably associated with the fact that hairpin elements can facilitate recombination and rearrangement events in the mitogenome [28]. Noteworthy, the GO most similar to that of Thaparocleidus was the putative ancestral neodermatan GO (AN-GO henceforth) [34]. According to the hypothesis proposed by Zhang, et al. [34], the GO of the common ancestor of all Dactylogyridae species most probably possessed the AN-GO, as this gene order was probably retained throughout all of the common ancestors leading to the extant species possessing the AN-GO in the Dactylogyridae clade: C. sclerosus, T. nebulosi and Enterogyrus malmbergi (Figure 3). This is also supported by the hypothesis proposed by Boore [37]: GOs are unlikely to revert to a primitive condition.
The highly rearranged GO of the two Thaparocleidus species may have uncovered a new group of monopisthocotylean monogeneans that exhibit fast-evolving GOs. Other monopisthocotyleans that exhibit elevated mitogenomic GO rearrangement rates include diplectanids [26], tetraonchideans [11] and Aglaiogyrodactylus forficulatus within the gyrodactylids [38] (Figure 3 and Table 2). However, the GOs of these groups of species exhibit low mutual similarity (Table 2), which indicates that all of these accelerations of GO evolution occurred independently, and share few common rearrangement patterns. This consistently confirms the hypothesis that evolution of mitogenomic GO arrangements is discontinuous in monogeneans [11,26], as GOs in a proportion of monogenean taxa are highly variable, whereas the remaining are conserved (Table 2 and Figure 3). Sequencing of future mitogenomes shall show whether the GO pattern exhibited by these two Thaparocleidus species may represent the synapomorphic arrangement of the subfamily Ancylodiscoidinae, and whether the GOs can be used to resolve some of the taxonomic and phylogenetic debates discussed herein. For example, the GO analysis supported the phylogenetic results that separated Ancylodiscoidinae from the two closely related Ancyrocephalinae and Dactylogyrinae (Figure 3). However, GOs should be used with utmost caution for phylogenetic purposes, as the discontinuity in GO rearrangements in monogeneans might produce misleading evolutionary signals and cause long-branch attraction artifacts [34].
4. Materials and methods
4.1. Specimen Collection and Identification
Thaparocleidus asoti and T. varicus were obtained from the gills of a single Silurus meridionalis (Chen, 1977) (Siluriformes: Siluridae) specimen, bought at a local market in the Wuhan city, Hubei Province on 6 May, 2017. They were morphologically identified by the hard parts of the haptor and reproductive organs as described in Wu, et al. [39]. Additionally, to confirm the taxonomic identity from the molecular perspective, their 28S rRNA genes were amplified using the C1 (5′-ACCCGCTGAATTTAAGCAT-3′) and D2 (5′-TGGTCCGTGTTTCAAGAC-3′) primer pair [40]. Both species share a very high identity with corresponding conspecific homologs available in the GenBank: 99.35% (762/767 bp) for T. varicus (DQ157668), and 100% (800/800 bp) for T. asoti (MG601546). All sampled and identified parasites were first washed in 0.6% saline and then stored in 100% ethanol at 4 °C.
4.2. DNA Extraction, Amplification and Sequencing
To ensure a sufficient amount of DNA for amplification and sequencing of these small parasites, we used two types of DNA for amplification and sequencing: mixture DNA (extracted from 20 specimens) and individual DNA (a single specimen). Both were extracted using TIANamp MicroDNA Kit (Tiangen Biotech, Beijing, China). First, we selected 14 monogenean mitogenomes from GenBank, aligned them using ClustalX [41], designed degenerate primer pairs (Supplementary Table S4) matching the generally conserved regions of mitochondrial genes, and amplified the whole mitogenome using the mixture DNA. Specific primers, based on these obtained fragments, were then designed using Primer Premier 5 [42], and the remaining mitogenome was amplified and sequenced in several PCR steps. PCR products were sequenced bi-directionally using both degenerate and specific primers mentioned above on an ABI 3730 automatic sequencer (Sanger sequencing). All obtained fragments were BLASTed [43] to confirm that the amplicon is the actual target sequence. We carefully examined the chromatograms, paying close attention to double peaks or any other sign of the existence of two different sequences. To address the possibility of intraspecific sequence variation present in the mixture DNA, we then used individual DNA and long-range PCR to re-sequence the mitogneomes. If the two sequences differed, we used the DNA extracted from a single specimen to assemble the final mitogenome, thereby ensuring that each sequence belongs to a single specimen.
4.3. Sequence Annotation and Analyses
Both mitogenomes were assembled and annotated following the procedure described before [11,25,35,44] using DNAstar v7.1 software [45], MITOS [46] and ARWEN [47] web tools: after assembling with the help of DNAstar, MITOS was used to annotate the mitogenome, Protein-coding genes (PCGs) were determined by searching for ORFs using genetic code 9 (echinoderm and flatworm mitochondrion) and aligning with homologs, two rRNA genes were also confirmed by the alignment with homologs, and tRNAs were identified by combining the results of ARWEN and MITOS. An in-house PhyloSuite software [48] was used to parse and extract the annotations recorded in Word documents, as well as create GenBank submission files and organization tables for mitogenomes. The same software was used to make genomic statistics of the mitogenome of monogeneans. Codon usage, amino acid proportion and relative synonymous codon usage (RSCU) for 12 protein-encoding genes (PCGs) of the two studied Thaparocleidus species were calculated and sorted using PhyloSuite, and finally the RSCU figure drawn using ggplot2 [49] plugin. Hierarchical clustering and heatmap analyses were drawn using the ComplexHeatmap package [50] implemented in R, with the help of the statistics file generated by PhyloSuite. Tandem Repeats Finder [51] was invoked to find tandem repeats in the non-coding regions, and their secondary structures were predicted by Mfold software [52]. Genetic distances (identity) among mitogenomic sequences were computed with the “DistanceCalculator” function in Biopython [53] using “identity” model.
4.4. Phylogenetic Analyses
Phylogenetic analyses were conducted using the two newly sequenced Thaparocleidus mitogenomes and 31 monogenean mitogenomes available in the GenBank (5/7/2019). Six polyopisthocotylid monogeneans were used as outgroups (Supplementary Table S2). We used a dataset comprised of concatenated amino acid sequences of all 12 protein-coding genes for the phylogenetic analysis. Additionally, to get a nuclear perspective on the topic, a 28S gene dataset that closely matched the taxonomic composition of the mitogenomic dataset was also used to conduct phylogenetic analyses (Supplementary Table S5). ModelFinder [54] plugin integrated into PhyloSuite was used to calculate the Best-fit model. mtZOA+F+I+G4 was selected as the optimal model for the mitogenomic dataset, whereas GTR+F+G4 was chosen for the 28S dataset. Phylogenetic analyses were performed using two different algorithms: ML and BI. ML analysis for both datasets was carried out in RAxML [55] using a ML+rapid bootstrap (BS) algorithm with 1000 replicates. Bayesian inference with GTR+F+G4 model for 28S dataset was conducted in MrBayes 3.2.6 [56] plugin in PhyloSuite. MrBayes was run with default settings, and 5 × 10⁶ metropolis-coupled MCMC generations. Stationarity was considered to be reached when the average standard deviation of split frequencies was < 0.01, ESS (estimated sample size) value > 200, and PSRF (potential scale reduction factor) approached 1. Bayesian inference analyses for amino acid dataset were conducted using the empirical MTZOA model and PhyloBayes (PB) MPI 1.5a [57]. For each analysis, two MCMC chains were run after the removal of invariable sites from the alignment, and the analysis was stopped when the conditions considered to indicate a good run (PhyloBayes manual) were reached: maxdiff < 0.1 and minimum effective size > 300. Non-coding regions of the selected monopisthocotyleans were identified and extracted from GenBank files using PhyloSuite, with the threshold set at 200 bp. iTOL dataset files produced by PhyloSuite were then used to visualize and annotate the phylograms and gene orders in iTOL [58].
5. Conclusions
Mitogenomes of both T. asoti and T. varicus contain two large non-coding regions, which were comprised of a number of repetitive hairpin-forming elements (RHE). The number of repeats varied between the two species, resulting in the exceptionally large genome of T. asoti (although incomplete), the largest among all available monogeneans. The gene order exhibited by both species was notably different from other monogeneans, with the first rearrangement of rRNA genes reported among the subphylum Neodermata thus far. Ancyrocephalinae and Dactylogyrinae were closely related in the phylogenetic results using mitogenome dataset, whereas Ancylodiscoidinae formed a sister-group with them. This relationship was also supported by the gene order. 28S rDNA-based analyses failed to produce monophyletic Ancyrocephalinae and Dactylogyridae. Our phylogenetic results inferred using mitogenomic dataset contradict previous phylogenetic studies (morphology and molecular marker-based). Limited availability of mitogenomes (only three of nine subfamilies of Dactylogyridae were available, and some with too few representatives) and weakly supported topology prevent us from making conclusions with confidence. Sequencing of additional molecular data, such as mitogenomes, transcriptomes or multiple nuclear genes, will be needed to resolve the interrelationships of Dactylogyridae.
Supplementary Materials
Supplementary materials can be found at https://www.mdpi.com/1422-0067/20/17/4214/s1.
Author Contributions
G.T.W., W.X.L. and D.Z. have designed the study. D.Z., H.Z., J.Z. and R.C. have conducted the experiments. D.Z. has conducted the data analysis. D.Z., W.X.L., I.J., S.G.W. and M.L. have written the paper. All authors have revised the manuscript critically for important intellectual content and approved the final version of the manuscript.
Funding
This work was funded by the National Natural Science Foundation of China (31872604) and the Earmarked Fund for China Agriculture Research System (CARS-45-15).
Acknowledgments
The authors would like to thank Pei-pei Fu and Cong-jie Hua for their assistance in sampling the monogeneans. We would also like to thank the editor and the two anonymous reviewers for the time they invested in reviewing our manuscript.
Conflicts of Interest
The authors declare that they have no conflict of interest.
References
- Bychowsky, B.E. Monogenetic Trematodes, Their Systematics and Phylogeny; Academy of Sciences: Moscow, Leningrad, USSR, Russia, 1957; p. 509. [Google Scholar]
- Price, C. Two New Subfamilies of Monogenenetic Trematodes. Q. J. Fla. Acad. Sci. 1966, 29, 199–201. [Google Scholar]
- Gusev, A.V. The new subfamily of monogenean parasites Monogenoidea. Dokl. Akad. Nauk. 1961, 139, 1480–1482. [Google Scholar]
- Bychowsky, B.; Nagibina, L. Revision of Ancyrocephalinae Bychowsky, 1937. Parazitol. Sb. 1978, 28, 5–15. [Google Scholar]
- Kritsky, D.C.; Boeger, W.A. The phylogenetic status of the Ancyrocephalidae Bychowsky, 1937 (Monogenea: Dactylogyroidea). J. Parasitol. 1989, 75, 207–211. [Google Scholar] [CrossRef] [PubMed]
- Lim, L.H.S.; Timofeeva, T.A.; Gibson, D.I. Dactylogyridean monogeneans of the siluriform fishes of the Old World. Syst. Parasitol. 2001, 50, 159–197. [Google Scholar] [CrossRef] [PubMed]
- Simkova, A.; Plaisance, L.; Matejusova, I.; Morand, S.; Verneau, O. Phylogenetic relationships of the Dactylogyridae Bychowsky, 1933 (Monogenea: Dactylogyridea): The need for the systematic revision of the Ancyrocephalinae Bychowsky, 1937. Syst. Parasitol. 2003, 54, 1–11. [Google Scholar] [CrossRef]
- Mendoza-Palmero, C.A.; Blasco-Costa, I.; Scholz, T. Molecular phylogeny of Neotropical monogeneans (Platyhelminthes: Monogenea) from catfishes (Siluriformes). Parasit. Vectors 2015, 8, 164. [Google Scholar] [CrossRef]
- Plaisance, L.; Littlewood, D.T.J.; Olson, P.D.; Morand, S. Molecular phylogeny of gill monogeneans (Platyhelminthes, Monogenea, Dactylogyridae) and colonization of Indo-West Pacific butterflyfish hosts (Perciformes, Chaetodontidae). Zool. Scr. 2005, 34, 425–436. [Google Scholar] [CrossRef]
- Blasco-Costa, I.; Miguez-Lozano, R.; Sarabeev, V.; Balbuena, J.A. Molecular phylogeny of species of Ligophorus (Monogenea: Dactylogyridae) and their affinities within the Dactylogyridae. Parasitol. Int. 2012, 61, 619–627. [Google Scholar] [CrossRef]
- Zhang, D.; Zou, H.; Wu, S.G.; Li, M.; Jakovlić, I.; Zhang, J.; Chen, R.; Wang, G.T.; Li, W.X. Sequencing of the complete mitochondrial genome of a fish-parasitic flatworm Paratetraonchoides inermis (Platyhelminthes: Monogenea): tRNA gene arrangement reshuffling and implications for phylogeny. Parasit. Vectors 2017, 10, 462. [Google Scholar] [CrossRef]
- Perkins, E.M.; Donnellan, S.C.; Bertozzi, T.; Chisholm, L.A.; Whittington, I.D. Looks can deceive: Molecular phylogeny of a family of flatworm ectoparasites (Monogenea: Capsalidae) does not reflect current morphological classification. Mol. Phylogenet. Evol. 2009, 52, 705–714. [Google Scholar] [CrossRef] [PubMed]
- Poulin, R.; Morand, S. The diversity of parasites. Q. Rev. Biol. 2000, 75, 277–293. [Google Scholar] [CrossRef]
- Huyse, T.; Plaisance, L.; Webster, B.L.; Mo, T.A.; Bakke, T.A.; Bachmann, L.; Littlewood, D.T. The mitochondrial genome of Gyrodactylus salaris (Platyhelminthes: Monogenea), a pathogen of Atlantic salmon (Salmo salar). Parasitology 2007, 134, 739–747. [Google Scholar] [CrossRef] [PubMed]
- Philippe, H.; Brinkmann, H.; Lavrov, D.V.; Littlewood, D.T.J.; Manuel, M.; Wörheide, G.; Baurain, D. Resolving difficult phylogenetic questions: Why more sequences are not enough. Plos Biol. 2011, 9, e1000602. [Google Scholar] [CrossRef] [PubMed]
- Zhang, D.; Zou, H.; Hua, C.-J.; Li, W.-X.; Mahboob, S.; Al-Ghanim, K.A.; Al-Misned, F.; Jakovlić, I.; Wang, G.-T. Mitochondrial architecture rearrangements produce asymmetrical nonadaptive mutational pressures that subvert the phylogenetic reconstruction in Isopoda. Genome Biol. Evol. 2019, 11, 1797–1812. [Google Scholar] [CrossRef]
- Doolittle, W.F. The practice of classification and the theory of evolution, and what the demise of Charles Darwin’s tree of life hypothesis means for both of them. Philos. Trans. R. Soc. Lond. B Biol. Sci. 2009, 364, 2221–2228. [Google Scholar] [CrossRef]
- Shao, R.; Barker, S. Mitochondrial genomes of parasitic arthropods: Implications for studies of population genetics and evolution. Parasitology 2007, 134, 153–167. [Google Scholar] [CrossRef]
- Perkins, E.M.; Donnellan, S.C.; Bertozzi, T.; Whittington, I.D. Closing the mitochondrial circle on paraphyly of the Monogenea (Platyhelminthes) infers evolution in the diet of parasitic flatworms. Int. J. Parasitol. 2010, 40, 1237–1245. [Google Scholar] [CrossRef]
- Park, J.K.; Kim, K.H.; Kang, S.; Kim, W.; Eom, K.S.; Littlewood, D.T. A common origin of complex life cycles in parasitic flatworms: Evidence from the complete mitochondrial genome of Microcotyle sebastis (Monogenea: Platyhelminthes). Bmc Evol. Biol. 2007, 7, 11. [Google Scholar] [CrossRef]
- Huyse, T.; Buchmann, K.; Littlewood, D.T. The mitochondrial genome of Gyrodactylus derjavinoides (Platyhelminthes: Monogenea) – a mitogenomic approach for Gyrodactylus species and strain identification. Gene 2008, 417, 27–34. [Google Scholar] [CrossRef]
- Wey-Fabrizius, A.R.; Podsiadlowski, L.; Herlyn, H.; Hankeln, T. Platyzoan mitochondrial genomes. Mol. Phylogenet. Evol. 2013, 69, 365–375. [Google Scholar] [CrossRef] [PubMed]
- Ross, E.; Blair, D.; Guerrero-Hernandez, C.; Sanchez Alvarado, A. Comparative and transcriptome analyses uncover key aspects of coding-and long noncoding RNAs in flatworm mitochondrial genomes. G3 (Bethesda) 2016, 6, 1191–1200. [Google Scholar] [CrossRef] [PubMed]
- Naylor, G.J.; Collins, T.M.; Brown, W.M. Hydrophobicity and phylogeny. Nature 1995, 373, 565–566. [Google Scholar] [CrossRef] [PubMed][Green Version]
- Zhang, D.; Zou, H.; Wu, S.G.; Li, M.; Jakovlic, I.; Zhang, J.; Chen, R.; Wang, G.T.; Li, W.X. Sequencing, characterization and phylogenomics of the complete mitochondrial genome of Dactylogyrus lamellatus (Monogenea: Dactylogyridae). J. Helminthol. 2018, 92, 455–466. [Google Scholar] [CrossRef] [PubMed]
- Zhang, D.; Li, W.X.; Zou, H.; Wu, S.G.; Li, M.; Jakovlic, I.; Zhang, J.; Chen, R.; Wang, G.T. Mitochondrial genomes of two diplectanids (Platyhelminthes: Monogenea) expose paraphyly of the order Dactylogyridea and extensive tRNA gene rearrangements. Parasit. Vectors 2018, 11, 601. [Google Scholar] [CrossRef] [PubMed]
- Zhang, D.; Li, W.X.; Zou, H.; Wu, S.G.; Li, M.; Jakovlic, I.; Zhang, J.; Chen, R.; Wang, G.T. Mitochondrial genomes and 28S rDNA contradict the proposed obsoletion of the order Tetraonchidea (Platyhelminthes: Monogenea). Int. J. Biol. Macromol. 2019. under review. [Google Scholar]
- Erpenbeck, D.; Voigt, O.; Worheide, G.; Lavrov, D.V. The mitochondrial genomes of sponges provide evidence for multiple invasions by Repetitive Hairpin-forming Elements (RHE). BMC Genom. 2009, 10, 591. [Google Scholar] [CrossRef]
- Zhang, J.; Wu, X.; Xie, M.; Li, A. The complete mitochondrial genome of Pseudochauhanea macrorchis (Monogenea: Chauhaneidae) revealed a highly repetitive region and a gene rearrangement hot spot in Polyopisthocotylea. Mol. Biol. Rep. 2012, 39, 8115–8125. [Google Scholar] [CrossRef]
- Le, T.H.; Blair, D.; McManus, D.P. Mitochondrial genomes of parasitic flatworms. Trends Parasitol. 2002, 18, 206–213. [Google Scholar] [CrossRef]
- Fumagalli, L.; Taberlet, P.; Favre, L.; Hausser, J. Origin and evolution of homologous repeated sequences in the mitochondrial DNA control region of shrews. Mol. Biol. Evol. 1996, 13, 31–46. [Google Scholar] [CrossRef]
- McMurray, A.A.; Sulston, J.E.; Quail, M.A. Short-insert libraries as a method of problem solving in genome sequencing. Genome Res. 1998, 8, 562–566. [Google Scholar] [CrossRef] [PubMed][Green Version]
- Hu, M.; Jex, A.R.; Campbell, B.E.; Gasser, R.B. Long PCR amplification of the entire mitochondrial genome from individual helminths for direct sequencing. Nat. Protoc. 2007, 2, 2339–2344. [Google Scholar] [CrossRef] [PubMed]
- Zhang, D.; Li, W.X.; Zou, H.; Wu, S.G.; Li, M.; Jakovlić, I.; Zhang, J.; Chen, R.; Wang, G.T. Homoplasy or plesiomorphy? Reconstruction of the evolutionary history of mitochondrial gene order rearrangements in the subphylum Neodermata. Int. J. Parasitol. 2019, 49, 819–829. [Google Scholar] [CrossRef] [PubMed]
- Li, W.X.; Zhang, D.; Boyce, K.; Xi, B.W.; Zou, H.; Wu, S.G.; Li, M.; Wang, G.T. The complete mitochondrial DNA of three monozoic tapeworms in the Caryophyllidea: A mitogenomic perspective on the phylogeny of eucestodes. Parasit. Vectors 2017, 10, 314. [Google Scholar] [CrossRef] [PubMed]
- Cameron, S.L. Insect mitochondrial genomics: Implications for evolution and phylogeny. Annu. Rev. Entomol. 2014, 59, 95–117. [Google Scholar] [CrossRef] [PubMed]
- Boore, J. The use of genome-level characters for phylogenetic reconstruction. Trends Ecol. Evol. 2006, 21, 439–446. [Google Scholar] [CrossRef] [PubMed]
- Bachmann, L.; Fromm, B.; de Azambuja, L.P.; Boeger, W.A. The mitochondrial genome of the egg-laying flatworm Aglaiogyrodactylus forficulatus (Platyhelminthes: Monogenoidea). Parasit. Vectors 2016, 9, 285. [Google Scholar] [CrossRef]
- Wu, B.H.; Lang, S.; Wang, W.J. Fauna Sinica: Platyhelminthes: Monogenea; Science Press: Beijing, China, 2000. [Google Scholar]
- Hassouna, N.; Mithot, B.; Bachellerie, J.-P. The complete nucleotide sequence of mouse 28S rRNA gene. Implications for the process of size increase of the large subunit rRNA in higher eukaryotes. Nucleic Acids Res. 1984, 12, 3563–3583. [Google Scholar] [CrossRef] [PubMed]
- Thompson, J.D.; Gibson, T.J.; Higgins, D.G. Multiple sequence alignment using ClustalW and ClustalX. Curr. Protoc. Bioinform. 2002, Chapter 2. Unit 2.3. [Google Scholar] [CrossRef]
- Lalitha, S. Primer Premier 5. Biot. Soft. Int. Rep. 2000, 1, 270–272. [Google Scholar] [CrossRef]
- Altschul, S.F.; Gish, W.; Miller, W.; Myers, E.W.; Lipman, D.J. Basic local alignment search tool. J. Mol. Biol. 1990, 215, 403–410. [Google Scholar] [CrossRef]
- Zou, H.; Jakovlic, I.; Chen, R.; Zhang, D.; Zhang, J.; Li, W.X.; Wang, G.T. The complete mitochondrial genome of parasitic nematode Camallanus cotti: Extreme discontinuity in the rate of mitogenomic architecture evolution within the Chromadorea class. BMC Genom. 2017, 18, 840. [Google Scholar] [CrossRef] [PubMed]
- Burland, T.G. DNASTAR’s Lasergene sequence analysis software. Methods Mol. Biol. 2000, 132, 71–91. [Google Scholar] [PubMed]
- Bernt, M.; Donath, A.; Juhling, F.; Externbrink, F.; Florentz, C.; Fritzsch, G.; Putz, J.; Middendorf, M.; Stadler, P.F. MITOS: Improved de novo metazoan mitochondrial genome annotation. Mol. Phylogenet. Evol. 2013, 69, 313–319. [Google Scholar] [CrossRef] [PubMed]
- Laslett, D.; Canback, B. ARWEN: A program to detect tRNA genes in metazoan mitochondrial nucleotide sequences. Bioinformatics 2008, 24, 172–175. [Google Scholar] [CrossRef] [PubMed]
- Zhang, D.; Gao, F.; Li, W.X.; Jakovlić, I.; Zou, H.; Zhang, J.; Wang, G.T. PhyloSuite: An integrated and scalable desktop platform for streamlined molecular sequence data management and evolutionary phylogenetics studies. bioRxiv 2018. [Google Scholar] [CrossRef]
- Hadley, W. ggplot2: Elegant Graphics for Data Analysis; Springer: New York, NY, USA, 2009. [Google Scholar]
- Gu, Z.; Eils, R.; Schlesner, M. Complex heatmaps reveal patterns and correlations in multidimensional genomic data. Bioinformatics 2016, 32, 2847–2849. [Google Scholar] [CrossRef] [PubMed]
- Benson, G. Tandem repeats finder: A program to analyze DNA sequences. Nucleic Acids Res. 1999, 27, 573. [Google Scholar] [CrossRef]
- Zuker, M. Mfold web server for nucleic acid folding and hybridization prediction. Nucleic Acids Res. 2003, 31, 3406–3415. [Google Scholar] [CrossRef]
- Cock, P.J.; Antao, T.; Chang, J.T.; Chapman, B.A.; Cox, C.J.; Dalke, A.; Friedberg, I.; Hamelryck, T.; Kauff, F.; Wilczynski, B.; et al. Biopython: Freely available Python tools for computational molecular biology and bioinformatics. Bioinformatics 2009, 25, 1422–1423. [Google Scholar] [CrossRef]
- Kalyaanamoorthy, S.; Minh, B.Q.; Wong, T.K.F.; von Haeseler, A.; Jermiin, L.S. ModelFinder: Fast model selection for accurate phylogenetic estimates. Nat. Methods 2017, 14, 587–589. [Google Scholar] [CrossRef] [PubMed]
- Stamatakis, A. RAxML version 8: A tool for phylogenetic analysis and post-analysis of large phylogenies. Bioinformatics 2014, 30, 1312–1313. [Google Scholar] [CrossRef] [PubMed]
- Ronquist, F.; Teslenko, M.; Mark, P.V.D.; Ayres, D.L.; Darling, A.; Höhna, S. MrBayes 3.2: Efficient Bayesian phylogenetic inference and model choice across a large model space. Syst. Biol. 2012, 61, 539–542. [Google Scholar] [CrossRef] [PubMed]
- Lartillot, N.; Rodrigue, N.; Stubbs, D.; Richer, J. PhyloBayes MPI: Phylogenetic reconstruction with infinite mixtures of profiles in a parallel environment. Syst. Biol. 2013, 62, 611–615. [Google Scholar] [CrossRef] [PubMed]
- Letunic, I.; Bork, P. Interactive tree of life (iTOL) v3: An online tool for the display and annotation of phylogenetic and other trees. Nucleic Acids Res. 2016, 44, W242–W245. [Google Scholar] [CrossRef] [PubMed]
© 2019 by the authors. Licensee MDPI, Basel, Switzerland. This article is an open access article distributed under the terms and conditions of the Creative Commons Attribution (CC BY) license (http://creativecommons.org/licenses/by/4.0/).