Article

Transcriptome Profiling of Placenta through Pregnancy Reveals Dysregulation of Bile Acids Transport and Detoxification Function

1
Key Laboratory for Animal Disease Resistance Nutrition of the Ministry of Education, Animal Nutrition Institute, Sichuan Agricultural University, Chengdu 611130, China
2
USDA/ARS Children’s Nutrition Research Center, Section of Gastroenterology, Hepatology and Nutrition, Department of Pediatrics, Baylor College of Medicine, Houston, TX 77030, USA
*
Author to whom correspondence should be addressed.
These authors contributed equally to this work.
Int. J. Mol. Sci. 2019, 20(17), 4099; https://doi.org/10.3390/ijms20174099
Submission received: 11 June 2019 / Revised: 17 August 2019 / Accepted: 19 August 2019 / Published: 22 August 2019
(This article belongs to the Section Molecular Genetics and Genomics)

Abstract

:
Placenta performs the function of several adult organs for the fetus during intrauterine life. Because of the dramatic physiological and metabolic changes during pregnancy and the strong association between maternal metabolism and placental function, the possibility that variation in gene expression patterns during pregnancy might be linked to fetal health warrants investigation. Here, next-generation RNA sequencing was used to investigate the expression profile, including mRNAs and long non-coding RNAs (lncRNAs) of placentas on day 60 of gestation (G60), day 90 of gestation (G90), and on the farrowing day (L0) in pregnant swine. Bioinformatics analysis of differentially expressed mRNAs and lncRNAs consistently showed dysregulation of bile acids transport and detoxification as pregnancy progress. We found the differentially expressed mRNAs, particularly bile salt export pump (ABCB11), organic anion-transporting polypeptide 1A2 (OATP1A2), carbonic anhydrase II (CA2), Na+-HCO3 cotransporter (NBC1), and hydroxysteroid sulfotransferases (SULT2A1) play an important role in bile acids transport and sulfation in placentas during pregnancy. We also found the potential regulation role of ALDBSSCG0000000220 and XLOC_1301271 on placental SULT2A1. These findings have uncovered a previously unclear function and its genetic basis for bile acids metabolism in developing placentas and have important implications for exploring the potential physiological and pathological pathway to improve fetal outcomes.

1. Introduction

Placenta is a temporary organ supporting the normal growth and development of the fetus during pregnancy. During this period, placenta is not only responsible for exchange of oxygen, iron, and substrate transfer such as sugar and amino acids, but also participates in proteins and peptide hormones synthesis and placental immunology [1,2]. Moreover, placenta also performs the function of several adult organs for the fetus during intrauterine life [3]. For example, toxic endogenous compounds including bile acids (BA) are transformed and eliminated by the hepatobiliary system with the collaboration of the kidney in adult [4]. However, the situation is different for the fetus during pregnancy. Owing to its immaturity, fetal liver can produce BA, but is not able to eliminate them into bile [5,6,7,8,9]. Placenta is the major organ responsible for fetal BA and biliary pigments transport. Then, the BA and biliary pigments of fetal origin are eliminated into feces and urine after biotransformation through maternal liver and, to a lesser extent, maternal kidney [9]. Noteworthy, several pregnancy-associated liver diseases are associated with impaired placental function, especially in intrahepatic cholestasis of pregnancy (ICP). Placental BA transport function is impaired in ICP patients and thus has adverse effect on fetal pregnancy outcomes through limiting fetal BA excretion [10,11,12]. Thus, maintaining proper function of placentas has great implication for fetal health [13].
Pregnancy is commonly associated with extensive physiological and metabolic changes to accommodate the growing needs of fetuses [14]. A typical example is the progressive increase of serum BA during pregnancy, especially in the second and the third trimester [15,16], and a subset of women with serum BA level above reference ranges (≥11 μmol/L) develop intrahepatic cholestasis of pregnancy (ICP) [17]. Studies in ICP patients and maternal cholestasis model during pregnancy have shown the impaired placental function, including the reduced fetal BA transport from fetuses to mother [18] and placental oxidative stress and apoptosis (19) [19]. Consistent with results in pregnant women [15], maternal BA metabolism in pregnant swine was dysregulated with the advance of pregnancy [8]. In addition, our recent study also indicated the impairment of placental BA transport function as pregnancy advanced, which further affected the BA homeostasis of fetuses [8]. However, the genetic and molecular basis for placenta to perform preprogrammed function, particularly BA metabolism, is largely undetermined as pregnancy advances. Next generation high-throughput RNA-Sequencing (RNA-Seq) has become a popular and comprehensively informative approach to study transcriptional changes of placentas [20,21,22]. Recent studies have revealed that lncRNAs participate in modulation of biological functions, through regulating gene expression during chromatin remodeling, transcription, and post-transcription, and thus could be a potential therapeutic target [23,24,25]. Therefore, our aim in this study was to identify the key mRNAs and lncRNAs, especially enriched in BA metabolism, of placentas with the advance of pregnancy in swine through RNA-Seq. Our data revealed the key genes responsible for dysregulation of BA transport and detoxification in placentas with the advance of pregnancy.

2. Results

2.1. RNA Sequencing and Identification of mRNAs in All Porcine Placentas

RNA-Seq methods were used to detect mRNA and lncRNA transcripts. RNA-Seq data showed an average of 109,932,040 raw reads and 106,071,702 clean reads per sample were obtained, and an average of 71.08% were mapped to a reference sus scrofa genome (Table S1). The percentage of reads mapped to the reference genome were similar between groups, suggesting that there were no sequencing biases in the data.
The expression levels were calculated and presented as a box plot of logarithmic transformed FPKM+1 values for each sample separately (Figure S1A), and the FPKM density distribution is shown in Figure S1B.

2.2. RNA Sequencing and Identification of Long Non-Coding RNAs (lncRNAs) in All Porcine Placentas

A total of 24,578 novel lncRNAs were assembled by Cufflinks and basic Scripture (Figure S2). As the identification of transcripts involved potential protein–coding fragments, Coding Potential Calculator (CPC), Pfam-scan (PFAM), phylogenetic codon substitution frequency (phyloCSF) and Coding-Non-Coding-Index (CNCI) were used to remove potential coding transcripts, and 15,342 putative lncRNAs were retained (Figure 1). The ALDB database was chosen as the lncRNA annotation reference, and 1220 lncRNAs were identified in the ALDB lncRNA annotation, indicating the presence of many novel lncRNAs (Figure S3).

2.3. Comparison of Features of mRNAs and Long Non-Coding RNAs (lncRNAs)

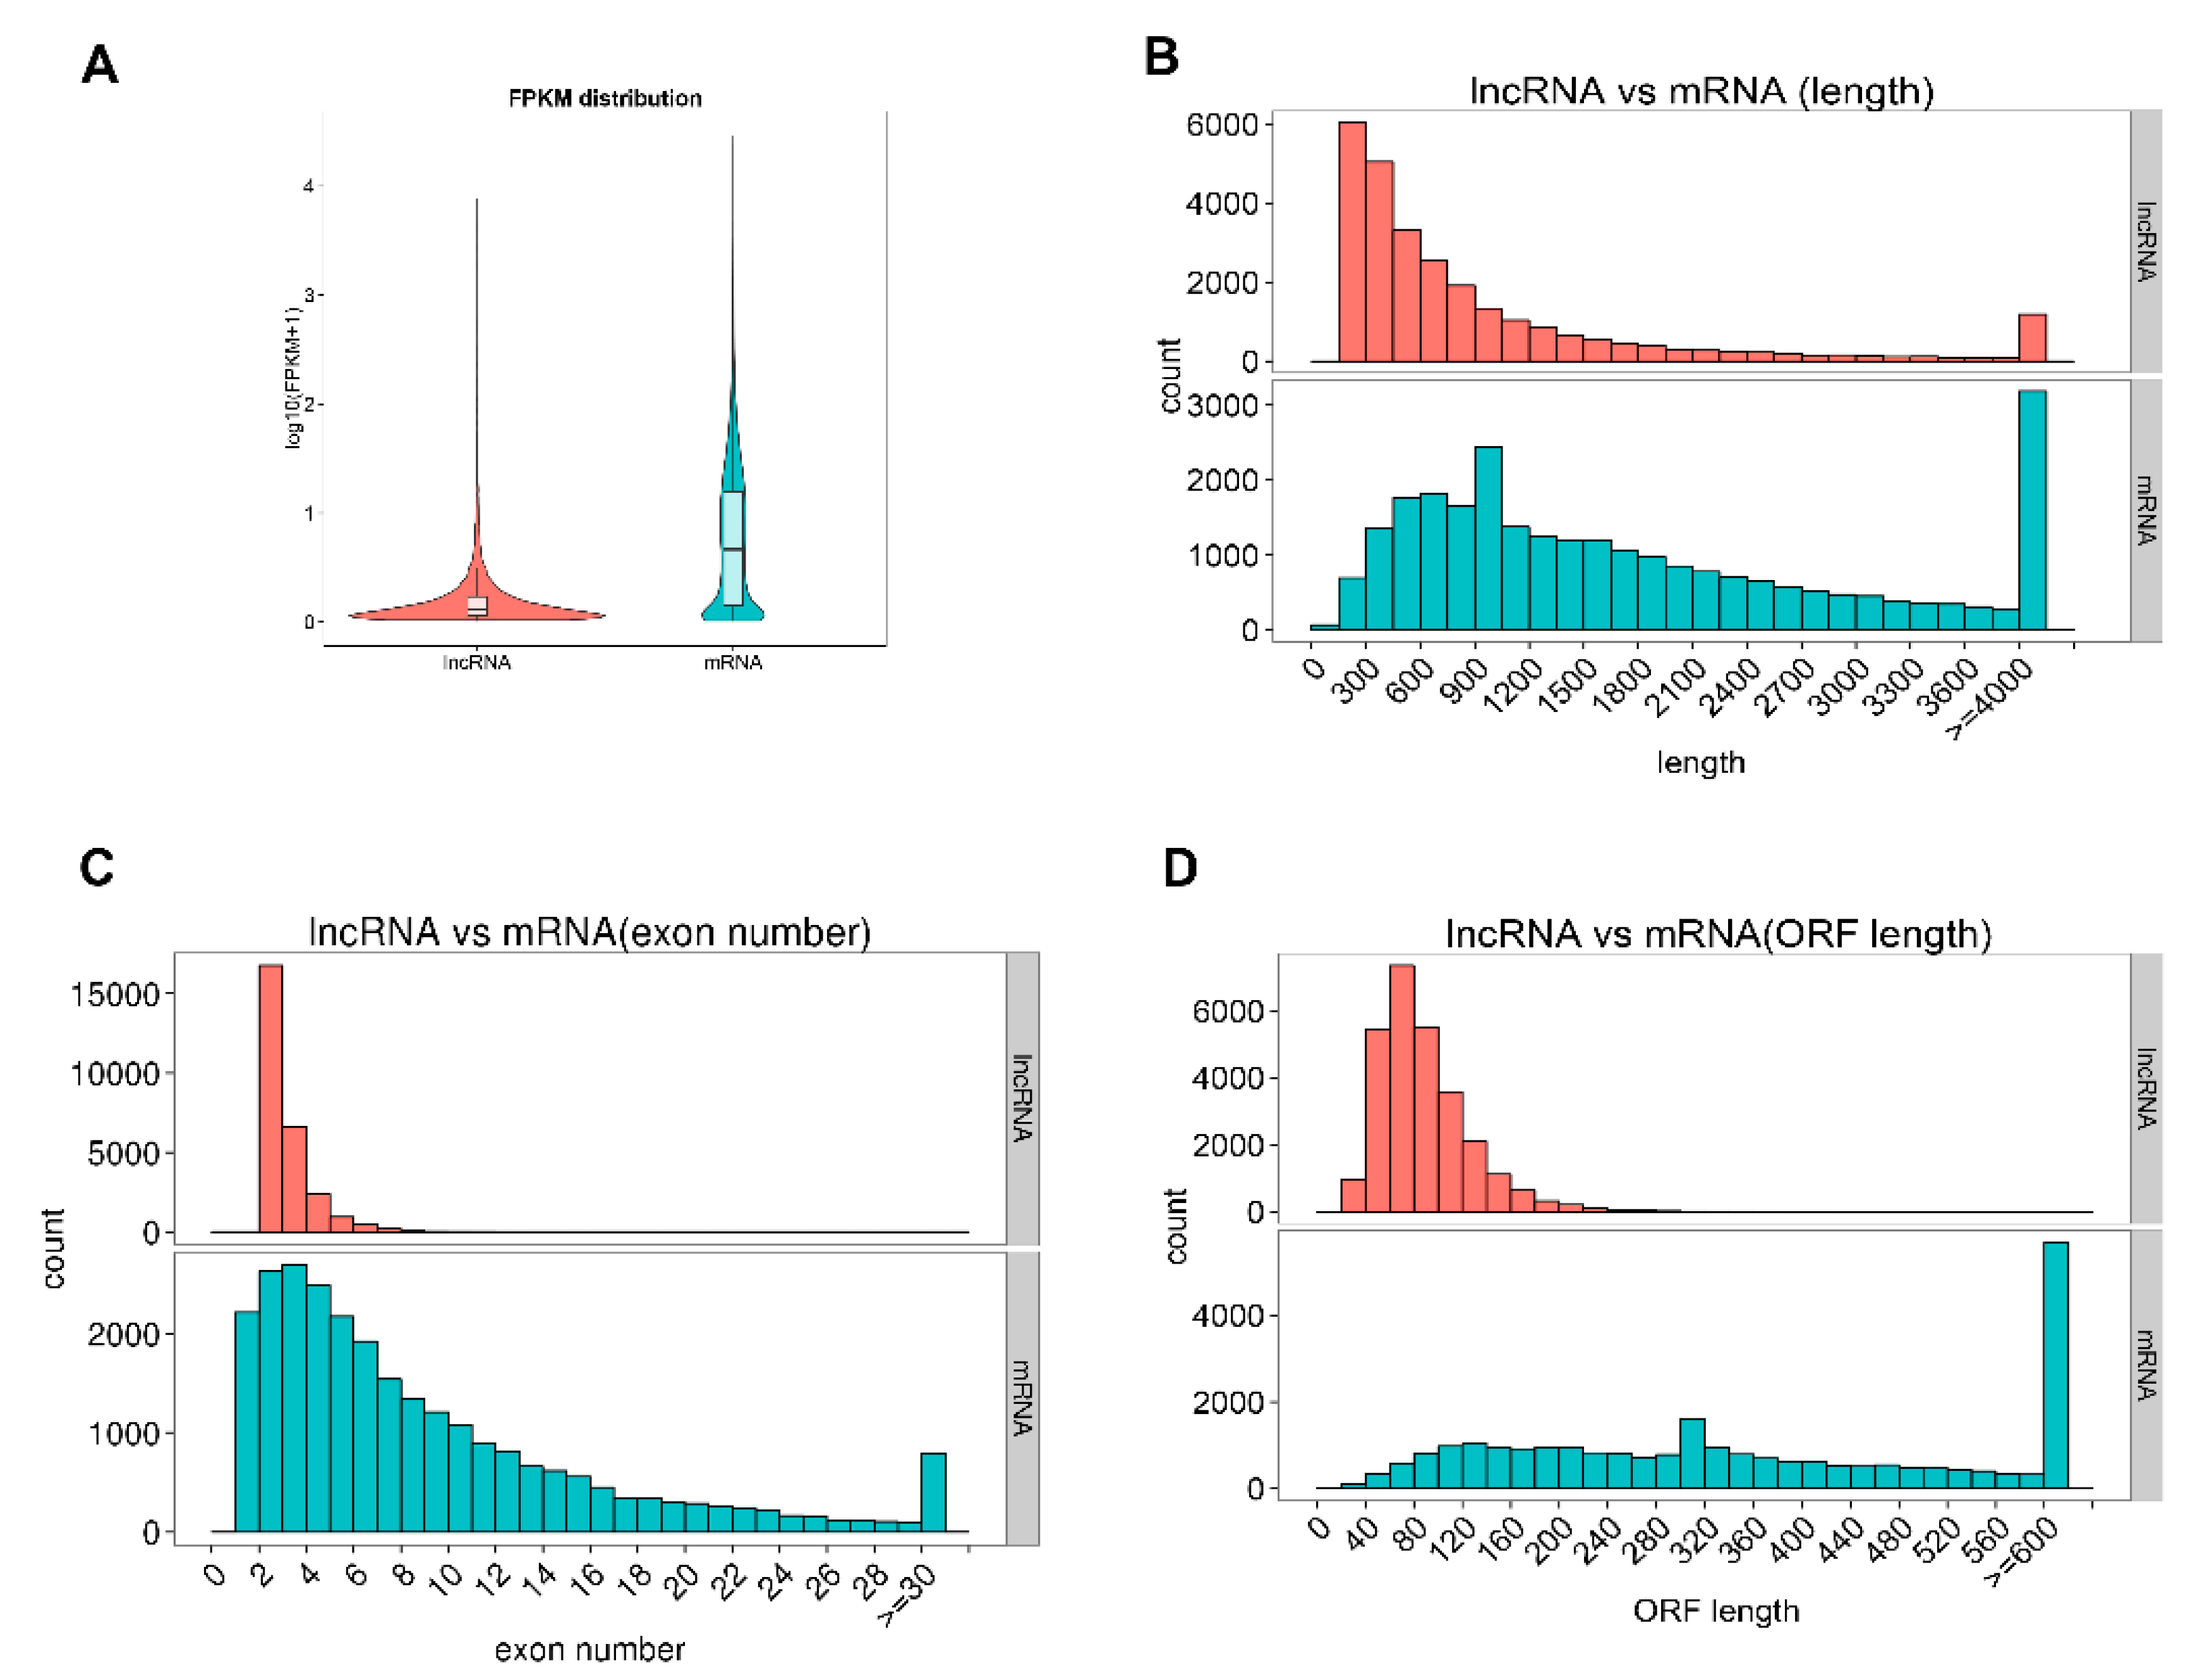
In this study, we characterized the basic feature of the lncRNAs and compared them with mRNAs. Our results showed that average lncRNAs expression level was lower than mRNAs and the identified lncRNAs were shorter in length than mRNAs, and they tended to have fewer exons (Figure 2A–C). The average length and exon of lncRNAs were 1045.84 bp long and 2.64 exons, respectively, while the mRNAs were 1982.69 bp long and 8.71 exons, respectively. Furthermore, the identified lncRNAs tended to be shorter in ORF length than mRNAs and most lncRNAs were less conserved than mRNAs (Figure 2D, Figure S4).

2.4. Placentas at Different Time of Pregnancy Have Distinct Gene Expression Profiles and Cluster Separately

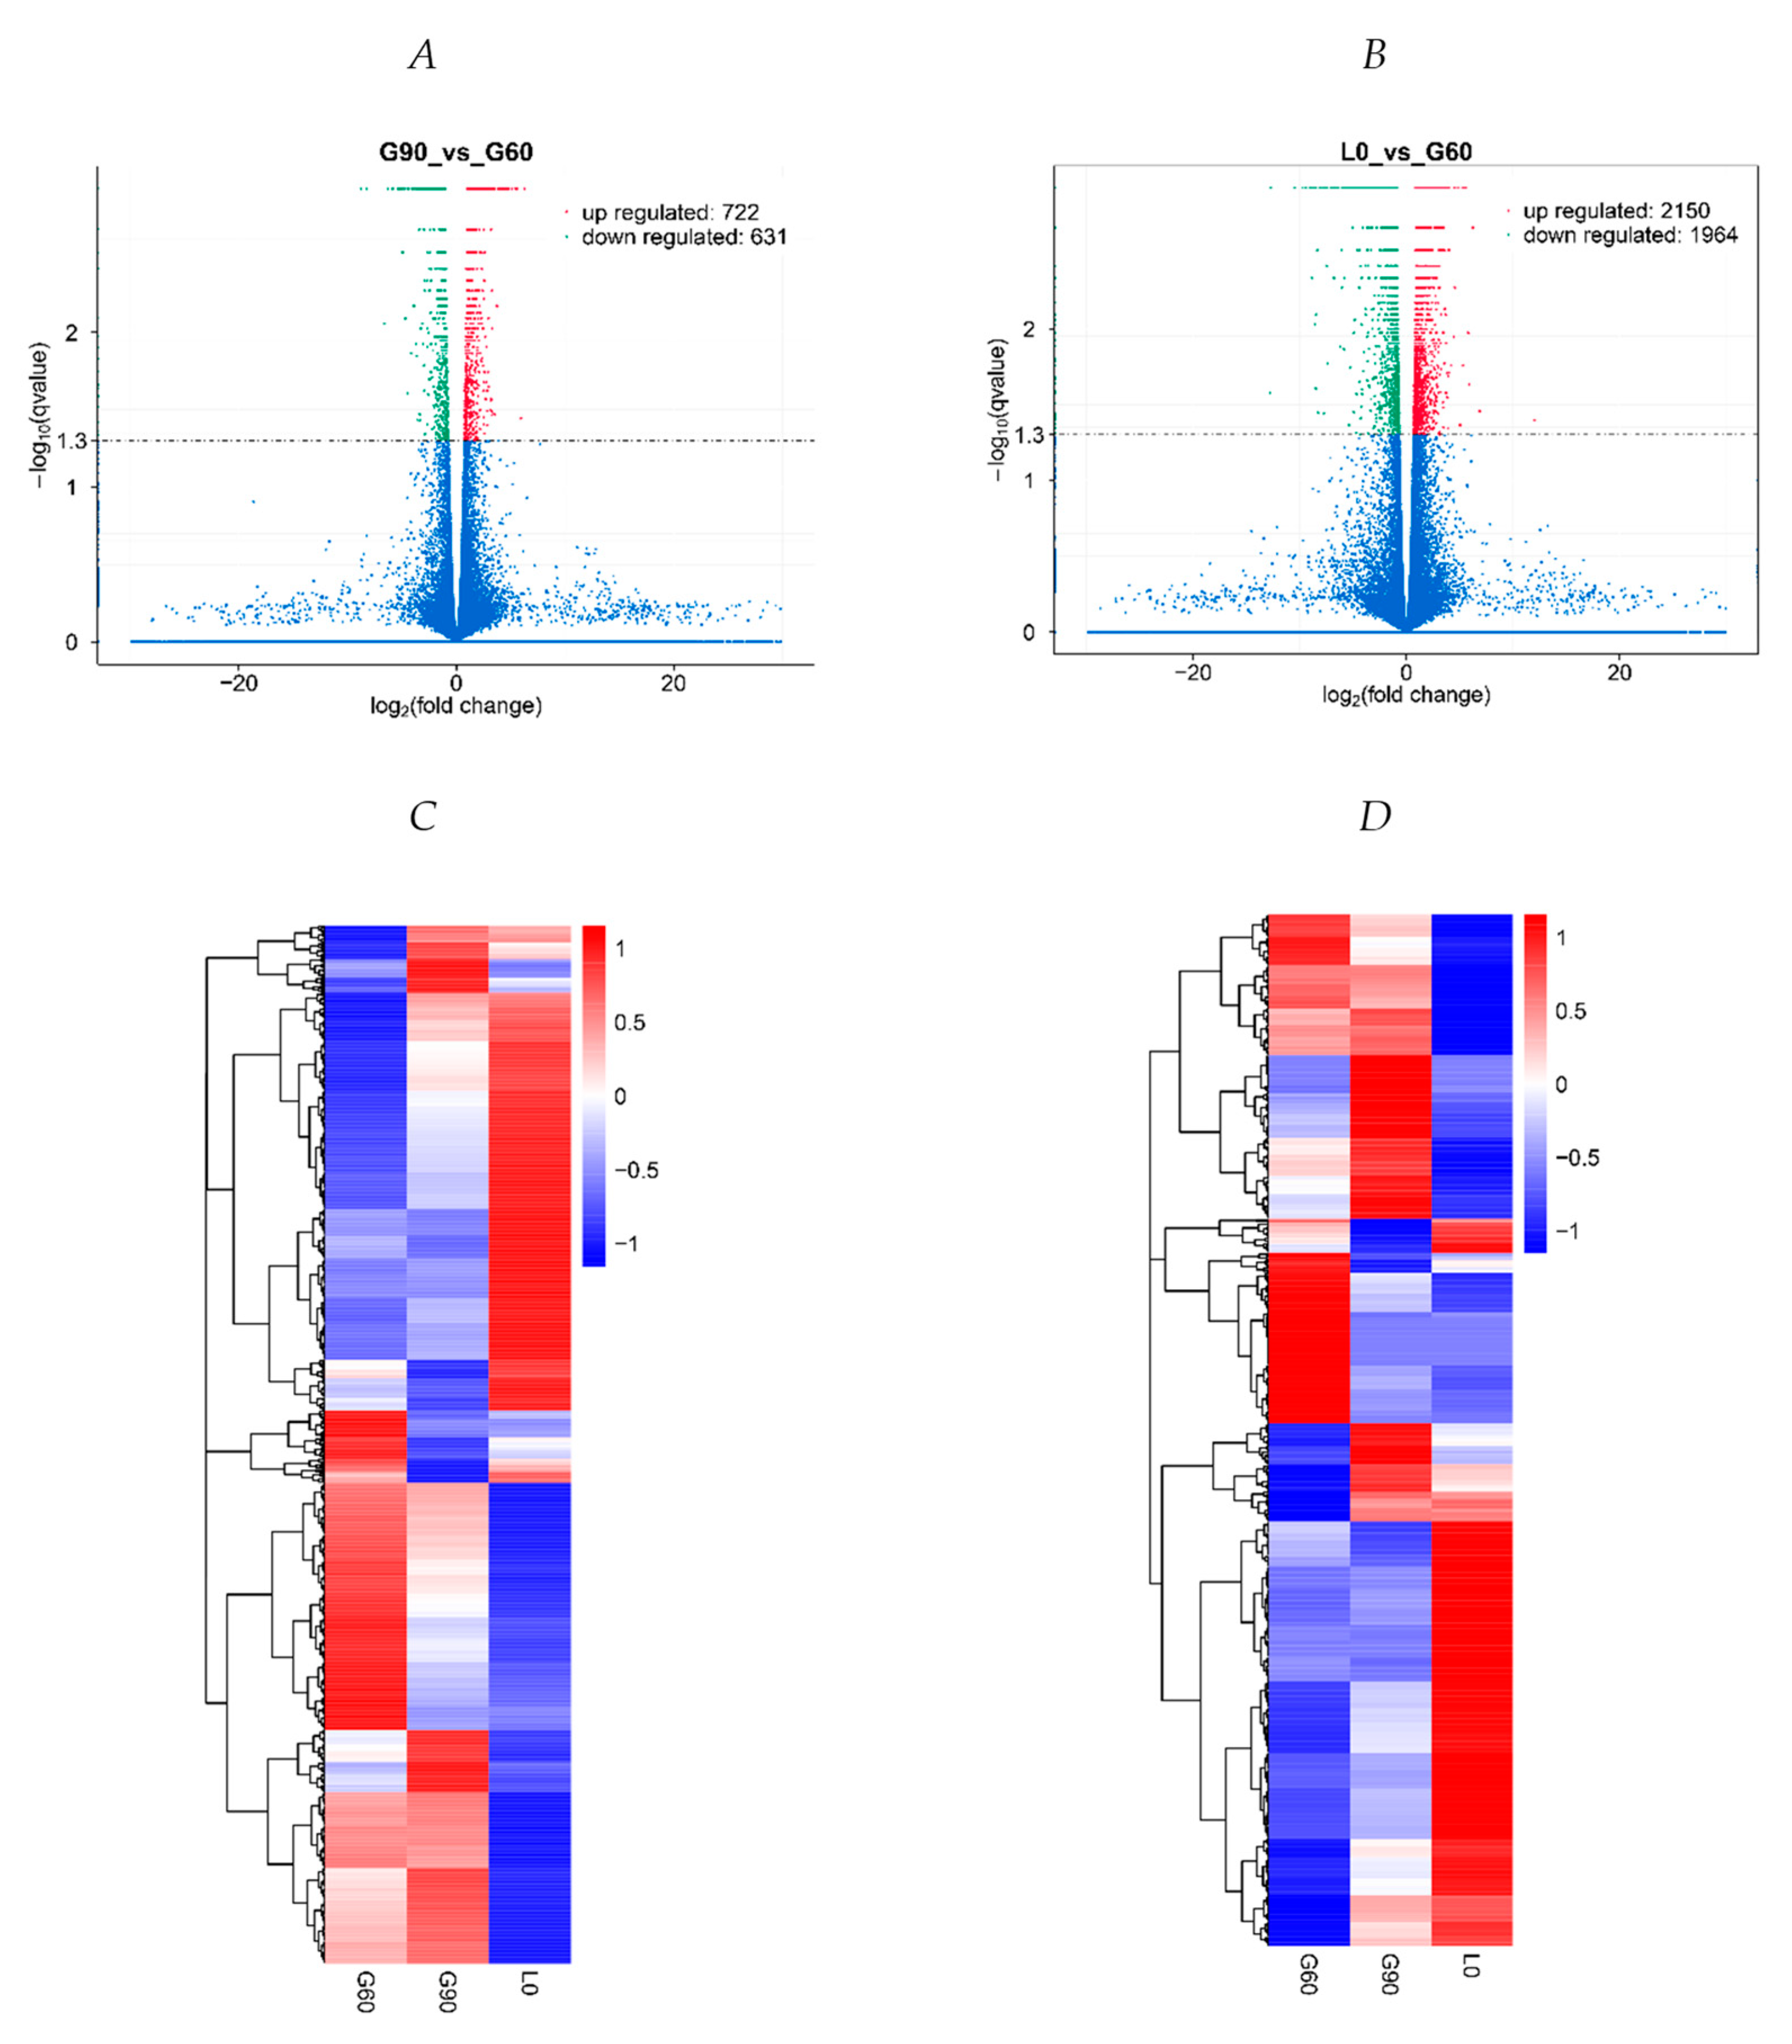
Compared with G60 placentas, 1079 mRNA transcripts (552 up-regulated and 527 down-regulated) and 274 lncRNA transcripts (170 up-regulated and 104 down-regulated) were differentially expressed in G90 placentas (p < 0.01, corrected p < 0.05) (Figure 3A, Table S2), whereas 3291 mRNA transcripts (1602 up-regulated and 1689 down-regulated) and 823 lncRNA transcripts (548 up-regulated and 275 down-regulated) were differentially expressed in L0 gilts (p < 0.005, corrected p < 0.05) (Figure 3B, Table S3). In unsupervised hierarchical clustering analysis, heat maps were generated using the differentially expressed lncRNAs and mRNAs, respectively, and they clearly self-segregated into G60, G90, and L0 (Figure 3C,D). These results reflect distinct lncRNAs and mRNAs expression profiles between different stages of pregnancy. Six mRNAs and three novel lncRNAs were chosen for quantitative RT-PCR to confirm the reliability of RNA-Seq (Figure S5). The relative expression of mRNAs and lncRNAs determined by qRT-PCR showed consistent changes with RNA-seq results.

2.5. Dysfunction of Bile Acid Transport and Detoxification Are the Central Characteristics with the Advance of Pregnancy

To ascertain the functions of the differentially expressed mRNAs and connections among them, we performed GO term and KEGG pathway enrichment analysis between groups. In GO analysis of the differentially expressed mRNAs between G60 and G90, the significantly over represented terms are shown in Table S4, including apical plasma membrane, apical part of cell, cell surface, and extracellular region in cellular component; transporter activity and hydrolase activity in molecular function; biological process, metabolic process, transport, single-organism transport, transmembrane transport, bicarbonate transport, regulation of transport, and cellular process in biological process. KEGG pathway analysis on G90 vs. G60 showed that bile secretion and complement and coagulation cascades were the most enriched terms (p < 0.01, corrected p < 0.05) (Figure 4, Figure S6).
In the enriched bile secretion pathway, a total of 15 genes were significantly (p < 0.01, corrected p < 0.05) altered in G90 placentas compared with G60 placentas (Figure 4). The expression of bile salt export pump (ABCB11, also known as BSEP), located in the apical membrane of human and rat hepatocytes and reported to export BA in ATP-dependent manner [26,27], were higher at G90 and L0 than at G60 (Figure 5A). The expression of organic anion-transporting polypeptide 1A2 (SLCO1A2, also known as OATP-A), mediating hepatocellular uptake of organic anions, including conjugated BA and estrone-3-sulfate, accompanied by bicarbonate efflux [28,29,30], was higher at G90 than at G60, while lower at L0 than at G60 (Figure 5B). It was noteworthy that carbonic anhydrase II (CA2), catalyzing the conversion of CO2 to the bicarbonate ion and protons [31], and Na+-HCO3 cotransporter (NBC1, also known as SLC4A4) (Figure 5C,D), which participates in bicarbonate production and uptake [32,33], were significantly down-regulated at G90 and L0 compared with that at G60, suggesting impairment of BA exchange between fetal and maternal units. These observations suggested the availability of bicarbonate might be limited, which may lead to the metabolic derangement in patients with cholestatic liver diseases [34] and thus may impair the ability of placentas to transport fetal BA into maternal circulation.
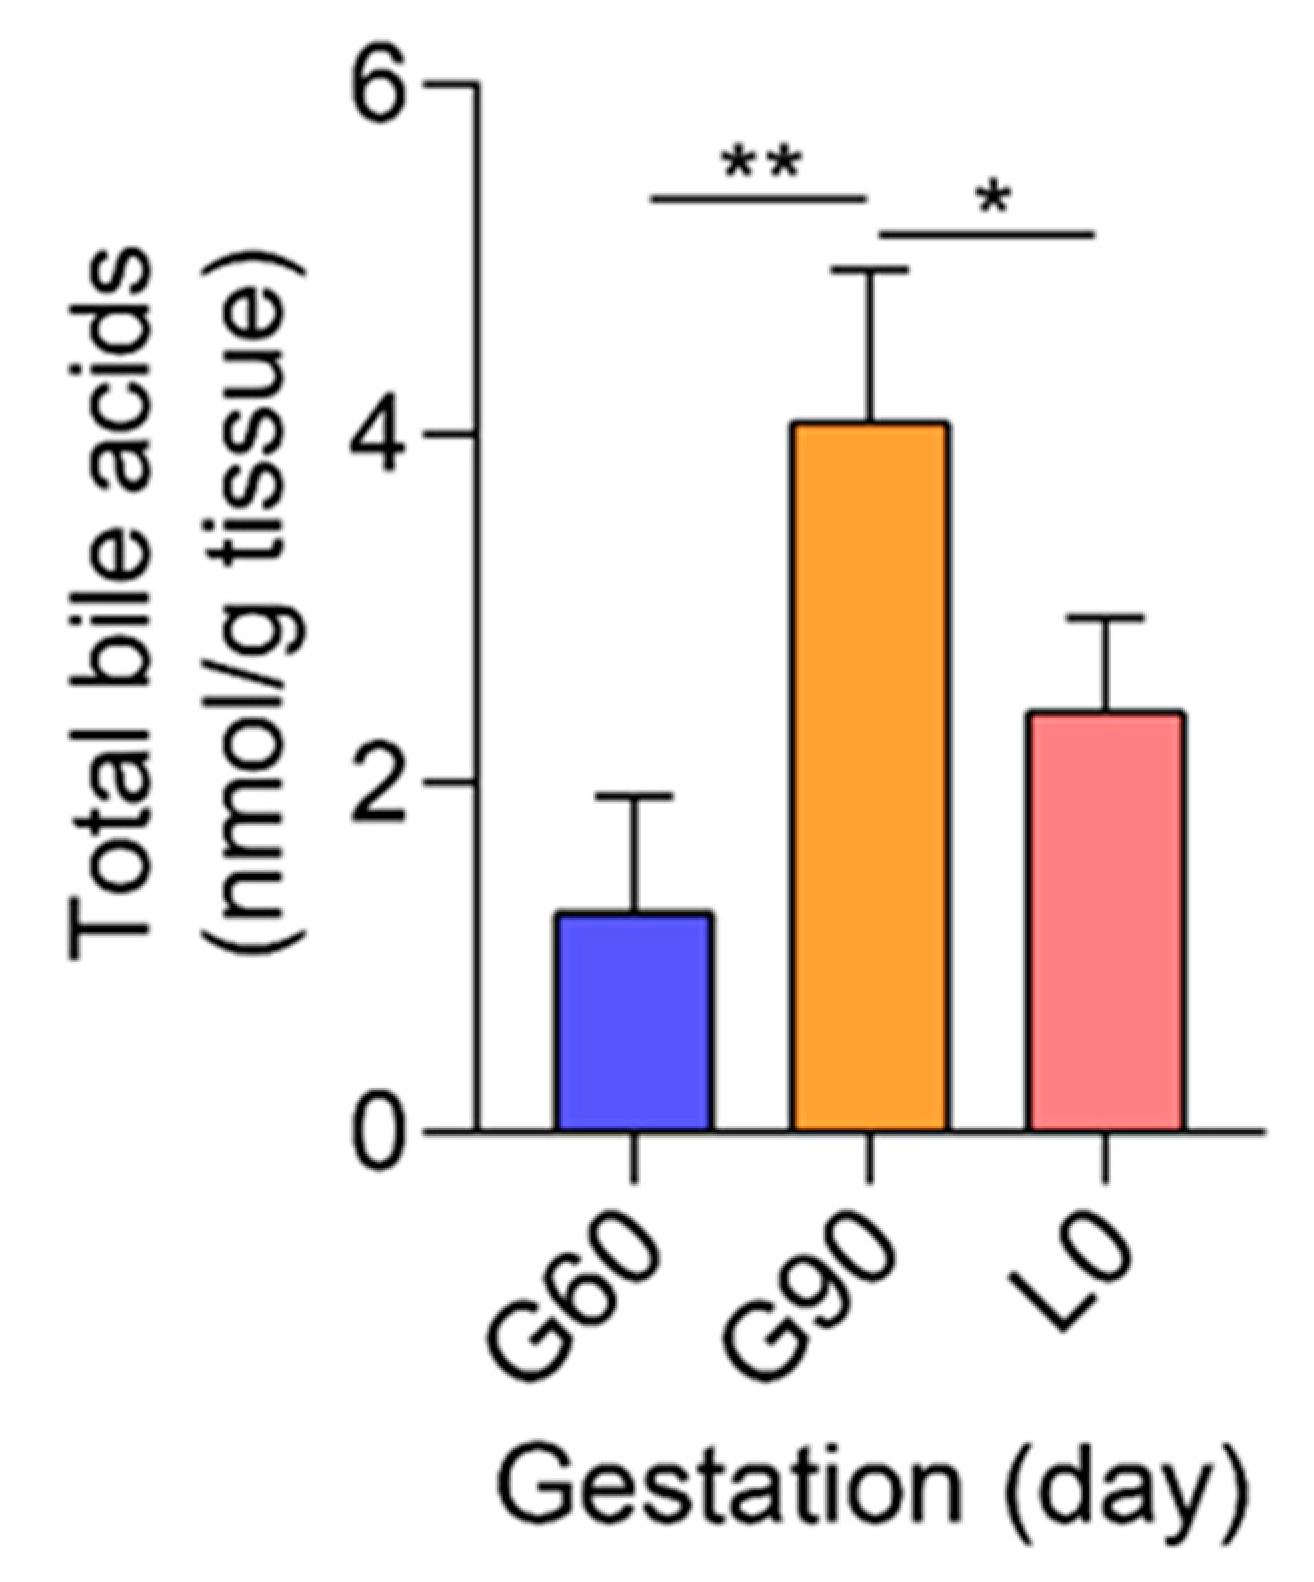
Sulfation is an important pathway for the detoxification and elimination of BA during cholestatic liver diseases [35,36,37]. As a member of cytosolic sulfotransferases enzymes (SULTs), hydroxysteroid sulfotransferases (SULT2A1) mediates sulfo-conjugation of BA [38], leading to increased water solubility and thus facilitating BA elimination [35]. Placental expression of SULT2A1 was higher at G90 than at G60, indicating the improved detoxification function of placentas, but was significantly decreased at L0 compared with that at G60 or G90 (Figure 5E). FXR, also known as NR1H4, can be activated by BA [39], especially CDCA, DCA, and LCA, and plays an important role in SULT2A1 expression in liver [40] and a protective role in maternal cholestasis induced damage and oxidative stress [41]. Unexpectedly, the expression of FXR was not significantly different between G60 and G90 placentas and reached undetectable level in L0 placentas (Figure 5F). Consistent with KEGG pathway analysis, the TBA concentrations of placentas used for RNA-Seq were significantly increased from G60 to G90, and not significantly different between G60 and L0 (Figure 6). Further investigation showed that maternal serum TBA had a trend pattern similar with that in placentas (Figure S7).
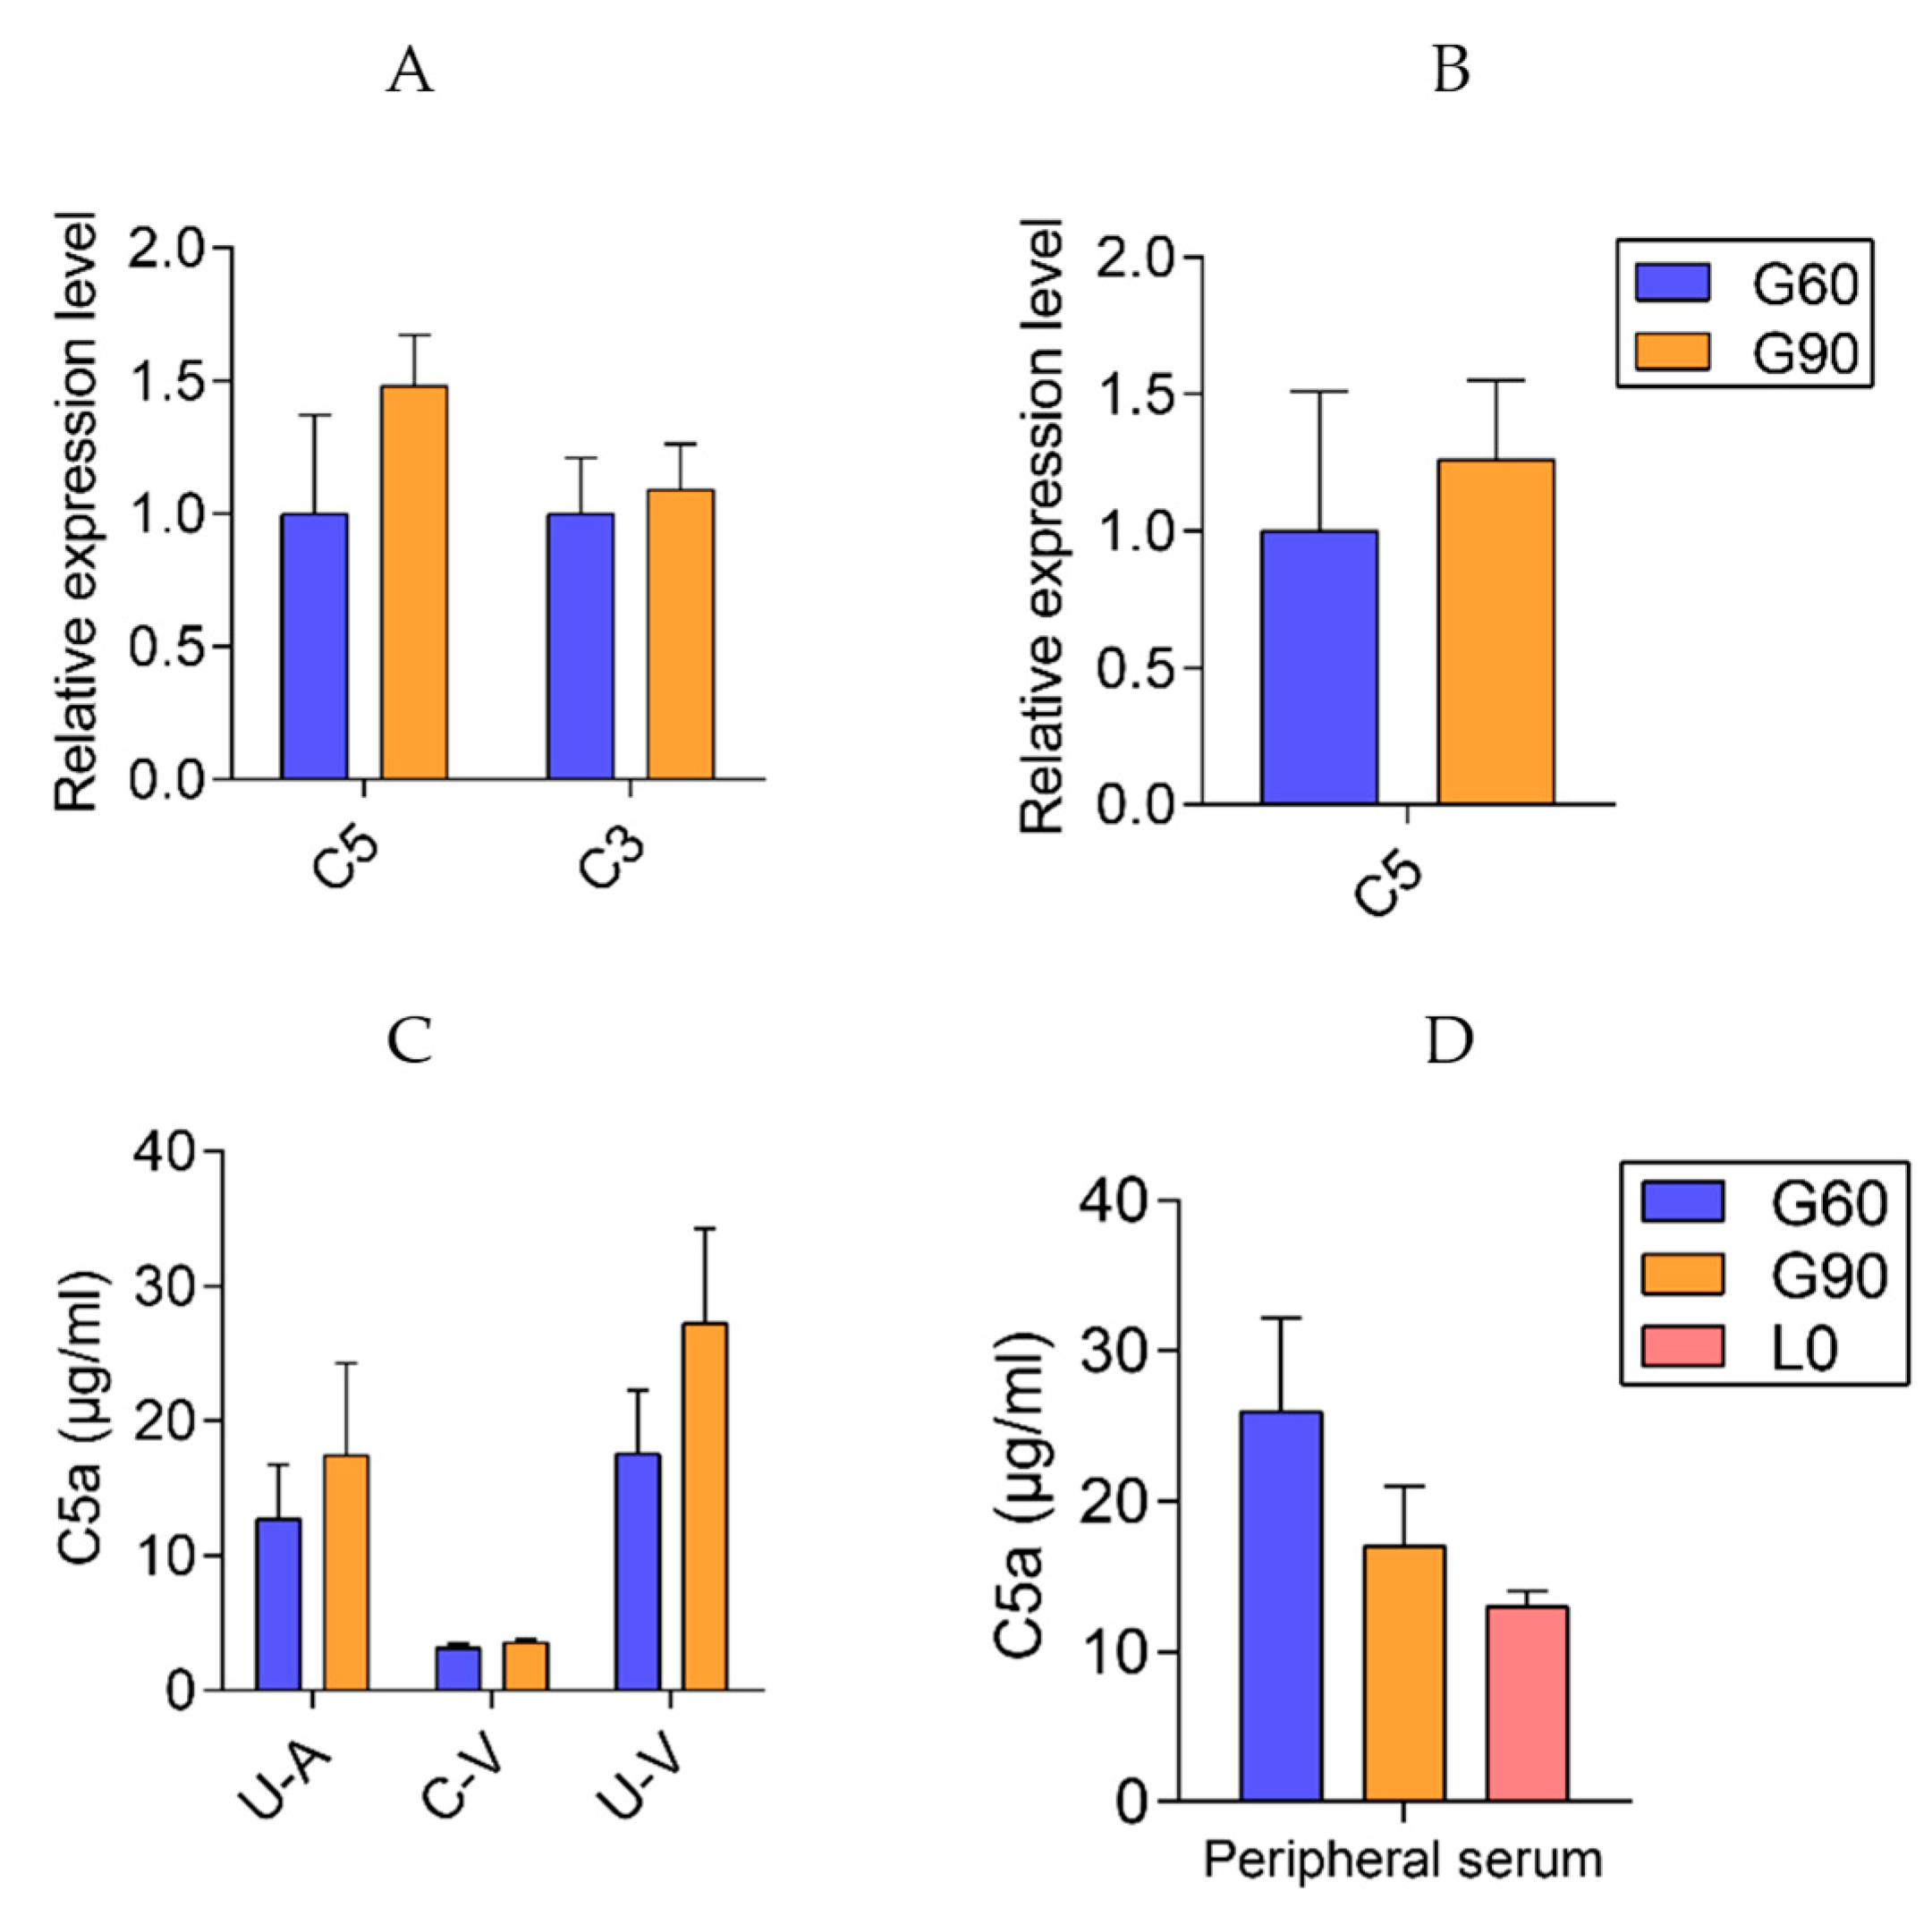
In the enriched complement and coagulation cascades pathway, a total of 16 genes were differentially expressed (p < 0.01, corrected p < 0.05) in G90 placentas compared with that in G60 placentas (Figure 4). Remarkably, placental C5aR1 (C5R1, CD88) expression at G90 was twice that at G60, and the higher C5aR1 expression was maintained till L0 when maternal TBA levels restored to the levels at G60 (Figure 4, Figure S5). As the main source of C5a, the ligand of C5aR1, C5 expression did not differ between G90 and G60 placentas (Figure 7B). Placental C3 is an upstream of C5 in complement system, and, interestingly, the expression of ENSSSCG00000030385, complement C3 precursor showed a lower expression at G90 than at G60 (Figure 4). The upregulation of complement factor H (CFH), which promotes dissociation of the C3 convertase enzyme [42] and protects against complement attack [43], might account for the decreased expression of C3 in G90 placentas. Expression of high levels of complement regulatory proteins including membrane cofactor decay accelerating factor (DAF, also known as CD55) was reported to be critical for the trophoblast to prevent excessive complement activation in the placentas [44]. It would appear that the higher placental expression of CD55 at G90 than at G60 might be an adaptive response to activated complement system. In support of this notion, the gene F2, encoding for thrombin protein which is capable of generating the complement activation product C5a in the absence of C3 [45], showed a lower expression at G90 than at G60 placentas. Collectively, placental mRNA levels of genes on which we focused seemed not applicable to explain the up-regulated C5aR1. Given that 80–90% of the complement proteins are produced by the liver [46], we further tested the C3 and C5 expression in liver tissues and C5a concentrations in maternal peripheral serum and U-A, C-V, and U-C serum. No differences were observed in hepatic C3 and C5 expression and in serum C5a concentrations with the advance of gestation stage (Figure 7A,C,D).
Analyzing the differentially expressed mRNAs between L0 and G60, we found no significantly enriched terms in KEGG pathway (Figure S8A), although there existed plenty of GO enrichment terms, including regulation of transport, ATP synthesis coupled proton transport, transport, regulation of intracellular transport, sulfur compound metabolic process in biological process, and sulfur compound binding and catalytic activity in molecular function (Table S5).

2.6. Prediction of Long Non-Coded RNAs (LncRNAs) Function

Recent studies have demonstrated that lncRNAs can regulate the expression of nearby and remote protein-coding genes in cis and trans, respectively [47,48]. The genomic feature of lncRNAs are shown in Figure S2. We performed the GO enrichment and KEGG pathway analysis of cis-mRNAs to predict the function of dysregulated lncRNAs between G90 and G60, no significant enrichment (corrected p > 0.05) was found since the number of cis-mRNAs was relatively small. There was also no significant enrichment (corrected p > 0.05) in GO analysis between L0 and G60, except “membrane-bound organelle”, which belongs to cellular component terms. We performed GO analysis on their trans-regulated target lncRNAs in two comparison groups. In GO terms, the significantly over-represented terms are shown in Tables S6 and S7 (p < 0.001, corrected p < 0.05). Although the existence of many common GO terms, no significantly enriched KEGG pathway was found between L0 and G60 (Figure S8B). We performed KEGG pathway analysis on their trans-regulated target lncRNAs between G90 and G60 (Figure 8). The significantly over-represented terms (p < 0.01, corrected p < 0.05) between G90 and G60 were olfactory transduction, bile secretion, staphylococcus aureus infection, and complement and coagulation cascades (corrected p = 0.08). The predicted function “bile secretion” and “complement and coagulation cascades” were same with mRNA, indicating the potential strong connection and interaction between lncRNAs and mRNAs. Remarkably, the up-regulated XLOC_1301271 and ALDBSSCG0000000220 were matched with SULT2A1 (Figure 7B,C). The increased expression of XLOC_1301271 and ALDBSSCG0000000220 might affect expression of SULT2A1 and therefore be involved in the BA metabolism in placentas. Moreover, there were some significantly enriched KEGG pathways different from mRNA results, including olfactory transduction and staphylococcus aureus infection (corrected p < 0.05). A recent study indicates that BA are natural ligands of olfactory systems [49]. However, the detailed relationship between these remained to be elucidated yet.

3. Discussion

Raised maternal serum BA is one of the most common phenomena among humans, rodents, and pigs during pregnancy [8,50,51,52]. High levels of maternal serum BA have been implicated in high levels of fetal BA through impairing transplacental export of BA from fetal into maternal system, especially when the fetal liver was able to synthesis BA, but not able to eliminate it, thus resulting in high risk of fetal death [10,53,54]. Previous reviews have summarized the hepatobiliary-like excretory role of placenta during pregnancy [55], however, the detailed placental function and its genetic basis during pregnancy are poorly understood. We here show novel findings in gilts demonstrating the dysregulated BA transport and metabolism and its genetic basis during pregnancy through mRNAs and lncRNAs analysis of placental function in developing placentas.
Consistent with impaired BA transport system of placentas in ICP patients and complete obstructive cholestasis in rats [12,18], our data showed that BA transport function of placentas was also impaired with the advance of pregnancy. Transporters, export pumps, and nuclear receptors involved in the liver excretory function may play a similar role in the placentas [56]. Studies in isolated membrane vesicles of human and rat placentas [57,58] have revealed the ATP-dependent transport system for BA across the TPMa plays an important role in the control of the overall fetal-maternal BA traffic. The multidrug resistance protein 2 (MRP2, also known as ABCC2), transports BA [59] and bilirubin glucuronides in ATP-dependent manner [60], and multidrug resistance protein 3 (MRP3, also known as ABCC3), also transports BA in ATP-dependent manner [61]. Consistent with the existence of ABCC2 and ABCC3 in rat placenta [55], our data showed the expression of ABCC2 and ABCC3 from G60 to L0, but their expression were not significantly different among G60, G90 and L0 (Tables S2 and S3). On the contrary, the expression of ABCB11 was continuously increased from G60 to L0, and might be the main BA transport carrier located in the TPMa during pregnancy [55]. Moreover, in response to raised maternal BA at G90 compared with that at G60, the equivalent maternal BA input into placenta and output from placenta to mother [8] further verified the BA transport role of ABCB11 in TPMa.
Studies in isolated membrane vesicles of human and rat placentas [62,63] have revealed that bicarbonate plays a critical role for BA exchange in the TPMb. In this study, SLC01A2, mediating hepatocellular uptake of organic anions including conjugated BA, accompanied by bicarbonate efflux [28,29,30], may be the main gene located in the TPMb and responsible for fetal BA excretion during pregnancy [9,55]. We further revealed the expression of SLC01A2, an orthologue of human OATP1A2 [64], was highly correlated with maternal serum and placental TBA, as indicated by the expression of SLC01A2 which was up-regulated from G60 to G90 when the maternal and placental TBA were increased, whereas was down-regulated from G90 to L0 when the maternal and placental TBA were decreased. These observations were consistent with the report that OATP was up-regulated by BA [28]. Interestingly, the expression of SLC01A2 was not regulated by fetal serum BA, as fetal serum BA was continuously increased from G60 to L0. This observation may be explained by our previous results that placental TBA was of maternal origin, but not of fetal origin [8]. Unexpectedly, placental bicarbonate concentration was likely to decrease with the advance of pregnancy, which could be explained by two aspects. Firstly, placental expression of CA2 and SLC4A4, responsible for bicarbonate production and uptake, respectively, were continuously decreased from G60 to L0. Secondly, carbonic anhydrase (CA), including bovine CA and human CA1 and CA2, were potently inhibited by bile salts [34] and showed BA species dependent effect [65,66,67]. In consideration of that CO2 diffuses across placenta predominantly in the molecular form rather than as bicarbonate ion [33] and the bicarbonate in mother was higher than in fetal unit in normal pregnancy [68], the decreased bicarbonate in placenta may limit BA exchange between fetus and mother in the TPMb.
In addition, our data also revealed the regulated BA metabolism in developing placentas. In humans, the hydrosteroid SULT (SULT2) family is comprised of two subfamilies, SULT2A1 and SULT2B1. SULT2A1 mediates sulfo-conjugation of endogenous molecules, including androgens, estrogens, and glucocorticoids, as well as BA, and thus facilitating BA detoxification and elimination [35], whereas SULT2B1 does not work in this way [38]. In this study, the expression of SULT2A1 was significantly increased from G60 to G90, whereas it decreased from G90 to L0. Maternal serum sulfated BA being higher at G90 than at G60, and not significantly different between G90 and L0, further verified the BA sulfation function of placental SULT2A1, especially when the expression of SULT2A1 in liver was not significantly different [8]. Furthermore, recent studies have revealed that lncRNAs, such as lnc-HC and MEG3, participate in BA metabolism, through regulating cholesterol 7α-hydroxylase (CYP7A1) and small heterodimer partner (SHP) [69,70]. In this study, the high consistency between function of dysregulated mRNAs and predicted functions of dysregulated lncRNAs suggests that lncRNAs play a critical role in regulating the expression of mRNAs, especially the potential regulation role of ALDBSSCG0000000220 and XLOC_1301271 on placental SULT2A1.
Bile acids have also been reported to induce placental inflammation by activating G protein-coupled bile acid receptor 1(Gpbar1)/ nuclear factor kappa B (NF-κB) [71], and placental damage, oxidative stress and apoptosis through tumor necrosis factor (TNF, also known as TNFα) and FXR [41,72]. The expression of these genes was not significantly different among G60, G90, and L0 (Tables S2 and S3), implying that the gestation stage-dependent increase of placental bile acids may be not sufficient to evoke placental inflammation and oxidative stress.
In summary, genes encoding proteins responsible for placental BA transport and detoxification were dysregulated as pregnancy advanced. The high consistency between mRNAs and predicted functions of dysregulated lncRNAs implies that lncRNAs may play an important role in regulating the expression of mRNAs during pregnancy. These findings have uncovered a previously unclear function and its genetic basis in developing placentas and have important implications for exploring the potential physiological and pathological pathway to improve fetal outcomes.

4. Materials and Methods

4.1. Experimental Design and Sampling

A total of 10 placentas were sampled as described [73] from 10 LY (Landrace × Yorkshire) gilts on day 60 of gestation (G60), day 90 of gestation (G90), and the farrowing day (L0), respectively (n = 3, 3, and 4, respectively). Briefly, the placentas were collected 5 cm away from the umbilical cord and selected from fetuses with average body weight. The number of fetuses at G60, G90, and L0 is shown in Table S8. In consideration of that, serum BA levels were greatly affected by the postprandial time, which reached the peak levels at around 2 h after a meal and returned to base-line levels within 4 h in human [74,75], whereas it reached the peak levels at around 2 h after a meal and returned to base-line levels within 8 h in sows in our unpublished data, placentas, maternal livers, blood of uterine artery (U-A), uterine vein (U-V), and umbilical cord vein (C-V) were sampled after 8-h fasting when sows were laparotomized and under deep isoflurane-induced anesthesia at G60 and G90, respectively. Placental samples and peripheral blood samples were also collected at L0 during delivery. The peripheral blood samples of mothers were collected via catheters implanted at cephalic vein as described [76] after 12-h fasting or via ear vein when catheters did not work. All samples were immediately stored at −80 °C until analysis. The nutrient requirement of sows in every stage were determined according to the National Swine Nutrition Guide (NSNG, 2010, Ames, IA, USA) and the diet composition and feeding regimen were the same as we previously described [8]. The protocol of this study was approved by the Animal Care and Use Committee of Animal Nutrition Institute, Sichuan Agricultural University, and was carried out in accordance with the National Research Council’s Guide for the Care and Use of Laboratory Animals, Chinese Order No.676 of the State Council, date (1 March 2017).

4.2. Total Bile Acids

The total BA (TBA) were measured by the enzymatic cycling method assay kits in 7020 automatic biochemical analyzer (Hitachi, Tokyo, Japan) as described.

4.3. RNA Sequencing and Data Analysis of the Porcine Placentas

Total RNAs were isolated and quality controlled. Ribosomal RNA (rRNA) and rRNA free residue were removed by Epicentre Ribo-zero™ rRNA Removal Kit (Epicentre, Madison, WI, USA) and ethanol precipitation, respectively. RNA-Seq was performed on an Illumina Hiseq 2000 platform and 150 bp paired-end reads were generated according to Illumina’s protocol. Sequencing libraries were generated using the rRNA-depleted RNA by NEBNext® Ultra™ Directional RNA Library Prep Kit for Illumina® (NEB, Ipswich, MA, USA) following manufacturer’s recommendations. Products were purified by AMPure XP system (Beckman Coulter, Orange County, CA, USA) and library quality was assessed on the Agilent Bioanalyzer 2100 system (Agilent, Santa Clara, CA, USA). The data were analyzed and annotated by a pipeline developed in-house. Briefly, high quality clean reads were aligned to the reference genome using TopHat v2.0.9 (Washington, DC, USA). The mapped read were assembled by both Scripture (beta2, Cambridge, MA, USA) [77] and Cufflinks (v2.1.1, College Park, MD, USA) [78]. The candidate set of lncRNAs were filtered by CNCI (Coding-Non-Coding-Index) (v2, Beijing, China), CPC (Coding Potential Calculator), (0.9-r2, Beijing, China), Pfam Scan (v1.3, Hinxton, UK) and PhyloCSF (phylogenetic codon substitution frequency) (v20121028, Cambridge, MA, USA) tools. The differential expression analysis of mRNAs and lncRNAs was performed by Cufdiff based on the negative binomial distribution [78], with an p-adjust < 0.05 were assigned as differentially expressed. GOseq R package (Release 2.12, Melbourne, Australia) and KOBAS software (v2.0, Beijing, China) were used to perform the Gene Ontology (GO) and KEGG enrichment analysis of differential expression genes or lncRNAs target gene, respectively.

4.4. Real-Time RT-PCR

Total RNA was extracted from the frozen samples using the RNAiso Plus reagent (Takara Bio, Ltd., Dalian, China) according to the manufacturer’s specifications. The complementary DNA (cDNA) was synthesized using a reverse transcription kit (Takara Bio, Ltd., Dalian, China) and stored at 4 °C prior to real-time quantitative PCR (q PCR). Real-time PCR was performed on a QuanStudioTM 6 Flex Real-Time PCR system (Applied Biosystems, Foster City, CA, USA) to quantify mRNAs or lncRNA expression with a commercial SYBR Green kit (Takara Bio, Inc., Dalian, China). Specific primers were designed using the software of primer BLAST from NCBI (Table S9). Amplification efficiency was controlled by the use of an internal control (β-actin). Relative quantification of target mRNAs or lncRNAs were calculated and normalized to β-actin expression. The gene expression levels of different samples was compared by the 2−ΔΔCT method [79,80].

4.5. Measurement of C5a

The C5a level of uterine artery, umbilical cord vein, uterine vein, and maternal vein serum were measured using the Elisa assay kits (Nanjing JianCheng Bioengineering Institute, Nanjing, China) following the manufacturer’s instruction.

4.6. Data Analysis

All data were analyzed by using the SAS statistical package (V9.4, SAS Institute Inc., Cary, NC, USA), except for the RNA-seq result. All values were expressed as means ± SE. Significant differences were analyzed by PROC GLM and least significant difference test or using the NPAR1WAY procedure of SAS 9.4 test for samples that were not normally distributed or homogeneous variances. p < 0.05 was considered statistically significant.

Supplementary Materials

Supplementary materials can be found at https://www.mdpi.com/1422-0067/20/17/4099/s1.

Author Contributions

P.W., Y.S. and H.Z. performed and analyzed the experiments and drafted the manuscript. S.L., X.Z. and J.L. performed experiments and edited the manuscript. L.C., B.F., Y.L., S.X. and Y.Z. performed the analysis of the BA data. D.W. and D.G.B. supervised the experiment and edited the manuscript. Z.F. conceptualized, designed, performed and analyzed the experiments and wrote the manuscript. All authors have seen and approved the final version.

Funding

Supported by the National Natural Science Foundation of China (31472109), and Sichuan Agricultural University Foundation for Fostering Youths Talents (00924104).

Acknowledgments

All sequencing data that support the findings of this study have been deposited in the National Center for Biotechnology Information Gene Expression Omnibus (GEO) and are accessible through the GEO Series accession number GSE110414.

Conflicts of Interest

The authors declare no conflict of interest.

Abbreviations

ICPIntrahepatic cholestasis of pregnancy
RNA-SeqRNA sequencing
BABile acid
LncRNALong non-coding RNA
ABCB11/BSEPBile salt export pump
OATP1A2/SLCO1A2Organic anion-transporting polypeptide 1A2
TPMaApical plasma membrane of the trophoblast
TPMbBasal plasma membrane of the trophoblast
NBC1/SLC4A4Na+-HCO3 cotransporter
SULT2A1Hydroxysteroid sulfotransferases
CA2Carbonate anhydrase 2
FXR/NR1H4Farnesoid X receptor

References

  1. Battaglia, F.; Meschia, G. Principal substrates of fetal metabolism. Physiol. Rev. 1978, 58, 499–527. [Google Scholar] [CrossRef] [PubMed]
  2. Carter, A.M. Evolution of placental function in mammals: The molecular basis of gas and nutrient transfer, hormone secretion, and immune responses. Physiol. Rev. 2012, 92, 1543–1576. [Google Scholar] [CrossRef] [PubMed]
  3. Sood, R.; Zehnder, J.L.; Druzin, M.L.; Brown, P.O. Gene expression patterns in human placenta. Proc. Natl. Acad. Sci. USA 2006, 103, 5478–5483. [Google Scholar] [CrossRef] [PubMed] [Green Version]
  4. Marin, J.J.; Macias, R.I.; Briz, O.; Perez, M.J.; Blazquez, A.G.; Arrese, M.; Serrano, M.A. Molecular bases of the fetal liver-placenta-maternal liver excretory pathway for cholephilic compounds. Liver Int. 2008, 28, 435–454. [Google Scholar] [CrossRef] [PubMed]
  5. Barth, A.; Fleck, C.; Klinger, W. Development of organic anion transport in the liver. Exp. Toxicol. Pathol. 1996, 48, 421–432. [Google Scholar] [CrossRef]
  6. Setchell, K.D.; Dumaswala, R.; Colombo, C.; Ronchi, M. Hepatic bile acid metabolism during early development revealed from the analysis of human fetal gallbladder bile. J. Biol. Chem. 1988, 263, 16637–16644. [Google Scholar]
  7. Colombo, C.; Zuliani, G.; Ronchi, M.; Breidenstein, J.; Setchell, K.D. Biliary bile acid composition of the human fetus in early gestation. Pediatr. Res. 1987, 21, 197–200. [Google Scholar] [CrossRef] [PubMed]
  8. Wang, P.; Zhong, H.; Song, Y.; Yuan, P.; Li, Y.; Lin, S.; Zhang, X.; Li, J.; Che, L.; Feng, B.; et al. Targeted metabolomics analysis of maternal-placental-fetal metabolism in pregnant swine reveals links in fetal bile acid homeostasis and sulfation capacity. Am. J. Physiol. Gastrointest. Liver Physiol. 2019, 317, 8–16. [Google Scholar] [CrossRef]
  9. Macias, R.I.; Marin, J.J.; Serrano, M.A. Excretion of biliary compounds during intrauterine life. World J. Gastroenterol. 2009, 15, 817–828. [Google Scholar] [CrossRef]
  10. Glantz, A.; Marschall, H.U.; Mattsson, L.A. Intrahepatic cholestasis of pregnancy: Relationships between bile acid levels and fetal complication rates. Hepatology 2004, 40, 467–474. [Google Scholar] [CrossRef]
  11. Geenes, V.; Williamson, C. Intrahepatic cholestasis of pregnancy. World J. Gastroenterol. 2009, 15, 2049–2066. [Google Scholar] [CrossRef] [PubMed] [Green Version]
  12. Macias, R.I.; Pascual, M.J.; Bravo, A.; Alcalde, M.P.; Larena, M.G.; St-Pierre, M.V.; Serrano, M.A.; Marin, J.J. Effect of maternal cholestasis on bile acid transfer across the rat placenta-maternal liver tandem. Hepatology 2000, 31, 975–983. [Google Scholar] [CrossRef] [PubMed]
  13. Gude, N.M.; Roberts, C.T.; Kalionis, B.; King, R.G. Growth and function of the normal human placenta. Thromb. Res. 2004, 114, 397–407. [Google Scholar] [CrossRef] [PubMed]
  14. Pataia, V.; Dixon, P.H.; Williamson, C. Pregnancy and bile acid disorders. Am. J. Physiol. Gastrointest. Liver Physiol. 2017, 313, 1–6. [Google Scholar] [CrossRef]
  15. McIlvride, S.; Dixon, P.H.; Williamson, C. Bile acids and gestation. Mol. Asp. Med. 2017, 56, 90–100. [Google Scholar] [CrossRef]
  16. Tribe, R.M.; Dann, A.T.; Kenyon, A.P.; Seed, P.; Shennan, A.H.; Mallet, A. Longitudinal profiles of 15 serum bile acids in patients with intrahepatic cholestasis of pregnancy. Am. J. Gastroenterol. 2010, 105, 585–595. [Google Scholar] [CrossRef]
  17. Beuers, U.; Boberg, K.M.; Chapman, R.W.; Chazouilleres, O.; Invernizzi, P.; Jones, D.E.J.; Lammert, F.; Pares, A.; Trauner, M.; European Association for the Study of the Liver. EASL Clinical Practice Guidelines: Management of cholestatic liver diseases. J. Hepatol. 2009, 51, 237–267. [Google Scholar]
  18. Serrano, M.A.; Brites, D.; Larena, M.G.; Monte, M.J.; Bravo, M.P.; Oliveira, N.; Marin, J.J. Beneficial effect of ursodeoxycholic acid on alterations induced by cholestasis of pregnancy in bile acid transport across the human placenta. J. Hepatol. 1998, 28, 829–839. [Google Scholar] [CrossRef]
  19. Perez, M.J.; Macias, R.I.; Marin, J.J. Maternal cholestasis induces placental oxidative stress and apoptosis. Protective effect of ursodeoxycholic acid. Placenta 2006, 27, 34–41. [Google Scholar] [CrossRef]
  20. Majewska, M.; Lipka, A.; Paukszto, L.; Jastrzebski, J.P.; Gowkielewicz, M.; Jozwik, M.; Majewski, M.K. Preliminary RNA-Seq Analysis of Long Non-Coding RNAs Expressed in Human Term Placenta. Int. J. Mol. Sci. 2018, 19, 1894. [Google Scholar] [CrossRef]
  21. Ackerman, W.; Buhimschi, I.A.; Summerfield, T.; Zhao, G.; Landon, M.B.; Buhimschi, C.S. Global transcriptomic analysis of human placenta in the setting of intrauterine growth restriction (IUGR) using RNA sequencing (RNA-Seq). Am. J. Obstet. Gynecol. 2017, 216, 140. [Google Scholar] [CrossRef]
  22. Saben, J.; Kang, P.; Zhong, Y.; Thakali, K.M.; Gomez-Acevedo, H.; Borengasser, S.J.; Andres, A.; Badger, T.M.; Shankar, K. RNA-seq analysis of the rat placentation site reveals maternal obesity-associated changes in placental and offspring thyroid hormone signaling. Placenta 2014, 35, 1013–1020. [Google Scholar] [CrossRef] [PubMed] [Green Version]
  23. Ananthanarayanan, M. A novel long noncoding RNA regulating cholesterol and bile acid homeostasis: A new kid on the block and a potential therapeutic target? Hepatology 2016, 64, 16–18. [Google Scholar] [CrossRef] [PubMed] [Green Version]
  24. Li, P.; Ruan, X.; Yang, L.; Kiesewetter, K.; Zhao, Y.; Luo, H.; Chen, Y.; Gucek, M.; Zhu, J.; Cao, H. A liver-enriched long non-coding RNA, lncLSTR, regulates systemic lipid metabolism in mice. Cell Metab. 2015, 21, 455–467. [Google Scholar] [CrossRef] [PubMed]
  25. Machtinger, R.; Zhong, J.; Mansur, A.; Adir, M.; Racowsky, C.; Hauser, R.; Brennan, K.; Karlsson, O.; Baccarelli, A.A. Placental lncRNA Expression Is Associated With Prenatal Phthalate Exposure. Toxicol. Sci. 2018, 163, 116–122. [Google Scholar] [CrossRef] [PubMed] [Green Version]
  26. Strautnieks, S.S.; Bull, L.N.; Knisely, A.S.; Kocoshis, S.; Dahl, N.; Arnell, H.; Sokal, E.M.; Dahan, K.; Childs, S.; Ling, V.; et al. A gene encoding a liver-specific ABC transporter is mutated in progressive familial intrahepatic cholestasis. Nat. Genet. 1998, 20, 233–238. [Google Scholar] [CrossRef] [PubMed]
  27. Gerloff, T.; Stieger, B.; Hagenbuch, B.; Madon, J.; Landmann, L.; Roth, J.; Hofmann, A.F.; Meier, P.J. The sister of P-glycoprotein represents the canalicular bile salt export pump of mammalian liver. J. Biol. Chem. 1998, 273, 10046–10050. [Google Scholar] [CrossRef]
  28. Kullakublick, G.A.; Beuers, U.; Fahney, C.; Hagenbuch, B.; Meier, P.; Paumgartner, G. Identification and functional characterization of the promoter region of the human organic anion transporting polypeptide gene. Hepatology 1997, 26, 991–997. [Google Scholar] [CrossRef]
  29. Halilbasic, E.; Claudel, T.; Trauner, M. Bile acid transporters and regulatory nuclear receptors in the liver and beyond. J. Hepatol. 2013, 58, 155–168. [Google Scholar] [CrossRef] [Green Version]
  30. Leuthold, S.; Hagenbuch, B.; Mohebbi, N.; Wagner, C.A.; Meier, P.J.; Stieger, B. Mechanisms of pH-gradient driven transport mediated by organic anion polypeptide transporters. Am. J. Physiol. Cell Physiol. 2008, 296, 570–582. [Google Scholar] [CrossRef]
  31. Supuran, C.T. Carbonic anhydrases: Novel therapeutic applications for inhibitors and activators. Nat. Rev. Drug Discov. 2008, 7, 168–181. [Google Scholar] [CrossRef] [PubMed]
  32. Jacob, P.; Christiani, S.; Rossmann, H.; Lamprecht, G.; Vieillardbaron, D.; Muller, R.; Gregor, M.; Seidler, U. Role of Na(+)HCO(3)(-) cotransporter NBC1, Na(+)/H(+) exchanger NHE1, and carbonic anhydrase in rabbit duodenal bicarbonate secretion. Gastroenterology 2000, 119, 406–419. [Google Scholar] [CrossRef] [PubMed]
  33. Longo, L.D.; Delivoriapapadopoulos, M.; Nd, F.R. Placental CO2 transfer after fetal carbonic anhydrase inhibition. Am. J. Physiol. 1974, 226, 703. [Google Scholar] [CrossRef] [PubMed]
  34. Milov, D.E.; Jou, W.; Shireman, R.B.; Chun, P.W. The effect of bile salts on carbonic anhydrase. Hepatology 1992, 15, 288–296. [Google Scholar] [CrossRef] [PubMed]
  35. Alnouti, Y. Bile acid sulfation: A pathway of bile acid elimination and detoxification. Toxicol. Sci. 2009, 108, 225–246. [Google Scholar] [CrossRef] [PubMed]
  36. Henegouwen, G.P.V.B.; Brandt, K.H.; Eyssen, H.; Parmentier, G. Sulphated and unsulphated bile acids in serum, bile, and urine of patients with cholestasis. Gut 1976, 17, 861–869. [Google Scholar] [CrossRef] [PubMed]
  37. Radominska, A.; Comer, K.A.; Zimniak, P.; Falany, J.; Iscan, M.; Falany, C.N. Human liver steroid sulphotransferase sulphates bile acids. Biochem. J. 1990, 272, 597–604. [Google Scholar] [CrossRef] [Green Version]
  38. Huang, J.; Bathena, S.; Tong, J.; Roth, M.; Hagenbuch, B.; Alnouti, Y. Kinetic analysis of bile acid sulfation by stably expressed human sulfotransferase 2A1 (SULT2A1). Xenobiotica 2010, 40, 184–194. [Google Scholar] [CrossRef]
  39. Makishima, M.; Okamoto, A.Y.; Repa, J.J.; Tu, H.; Learned, R.M.; Luk, A.; Hull, M.V.; Lustig, K.D.; Mangelsdorf, D.J.; Shan, B. Identification of a nuclear receptor for bile acids. Science 1999, 284, 1362–1365. [Google Scholar] [CrossRef]
  40. Kitada, H.; Miyata, M.; Nakamura, T.; Tozawa, A.; Honma, W.; Shimada, M.; Nagata, K.; Sinal, C.J.; Guo, G.L.; Gonzalez, F.J. Protective role of hydroxysteroid sulfotransferase in lithocholic acid-induced liver toxicity. J. Biol. Chem. 2003, 278, 17838–17844. [Google Scholar] [CrossRef]
  41. Wu, W.B.; Xu, Y.Y.; Cheng, W.W.; Wang, Y.X.; Liu, Y.; Huang, D.; Zhang, H.J. Agonist of farnesoid X receptor protects against bile acid induced damage and oxidative stress in mouse placenta - A study on maternal cholestasis model. Placenta 2015, 36, 545–551. [Google Scholar] [CrossRef] [PubMed]
  42. Pickering, M.C.; Cook, H.T.; Warren, J.; Bygrave, A.E.; Moss, J.; Walport, M.J.; Botto, M. Uncontrolled C3 activation causes membranoproliferative glomerulonephritis in mice deficient in complement factor H. Nat. Genet. 2002, 31, 424–428. [Google Scholar] [CrossRef] [PubMed]
  43. Sakaue, T.; Takeuchi, K.; Maeda, T.; Yamamoto, Y.; Nishi, K.; Ohkubo, I. Factor H in porcine seminal plasma protects sperm against complement attack in genital tracts. J. Biol. Chem. 2010, 285, 2184–2192. [Google Scholar] [CrossRef] [PubMed]
  44. Tedesco, F.; Narchi, G.; Radillo, O.; Meri, S.; Ferrone, S.; Betterle, C. Susceptibility of human trophoblast to killing by human complement and the role of the complement regulatory proteins. J. Immunol. 1993, 151, 1562–1570. [Google Scholar] [PubMed]
  45. Huberlang, M.; Sarma, J.V.; Zetoune, F.S.; Rittirsch, D.; Neff, T.A.; Mcguire, S.R.; Lambris, J.D.; Warner, R.L.; Flierl, M.A.; Hoesel, L.M. Generation of C5a in the absence of C3: A new complement activation pathway. Nat. Med. 2006, 12, 682–687. [Google Scholar] [CrossRef] [PubMed]
  46. Gao, B.; Jeong, W.I.; Tian, Z. Liver: An organ with predominant innate immunity. Hepatology 2008, 47, 729–736. [Google Scholar] [CrossRef] [PubMed]
  47. Wang, K.C.; Chang, H.Y. Molecular mechanisms of long noncoding RNAs. Mol. Cell 2011, 43, 904–914. [Google Scholar] [CrossRef] [PubMed]
  48. Fatica, A.; Bozzoni, I. Long non-coding RNAs: New players in cell differentiation and development. Nat. Rev. Genet. 2014, 15, 7–21. [Google Scholar] [CrossRef]
  49. Doyle, W.I.; Dinser, J.A.; Cansler, H.L.; Zhang, X.; Dinh, D.D.; Browder, N.S.; Riddington, I.M.; Meeks, J.P. Faecal bile acids are natural ligands of the mouse accessory olfactory system. Nat. Commun. 2016, 7, 11936. [Google Scholar] [CrossRef] [Green Version]
  50. Ovadia, C.; Perdones-Montero, A.; Spagou, K.; Smith, A.; Sarafian, M.H.; Gomez Romero, M.; Bellafante, E.; Clarke, L.C.; Sadiq, F.; Nikolova, V.; et al. Enhanced microbial bile acid deconjugation and impaired ileal uptake in pregnancy repress intestinal regulation of bile acid synthesis. Hepatology 2019, 7, 276–293. [Google Scholar] [CrossRef]
  51. Milona, A.; Owen, B.M.; Cobbold, J.F.L.; Willemsen, E.C.L.; Cox, I.J.; Boudjelal, M.; Cairns, W.; Schoonjans, K.; Taylor-Robinson, S.D.; Klomp, L.W.J.; et al. Raised Hepatic Bile Acid Concentrations During Pregnancy in Mice Are Associated with Reduced Farnesoid X Receptor Function. Hepatology 2010, 52, 1341–1349. [Google Scholar] [CrossRef] [PubMed]
  52. Pascual, M.J.; Serrano, M.A.; Elmir, M.Y.; Macias, R.I.R.; Jimenez, F.; Marin, J.J.G. Relationship between asymptomatic hypercholanaemia of pregnancy and progesterone metabolism. Clin. Sci. 2002, 102, 587–593. [Google Scholar] [CrossRef] [PubMed] [Green Version]
  53. Zhang, Y.; Li, F.; Wang, Y.; Pitre, A.; Fang, Z.-Z.; Frank, M.W.; Calabrese, C.; Krausz, K.W.; Neale, G.; Frase, S.; et al. Maternal bile acid transporter deficiency promotes neonatal demise. Nat. Commun. 2015, 6, 8186. [Google Scholar] [CrossRef] [PubMed] [Green Version]
  54. Estiu, M.C.; Monte, M.J.; Rivas, L.; Moiron, M.; Gomez-Rodriguez, L.; Rodriguez-Bravo, T.; Marin, J.J.G.; Macias, R.I.R. Effect of ursodeoxycholic acid treatment on the altered progesterone and bile acid homeostasis in the mother-placenta-foetus trio during cholestasis of pregnancy. Br. J. Clin. Pharmacol. 2015, 79, 316–329. [Google Scholar] [CrossRef] [PubMed]
  55. Marin, J.J.; Macias, R.I.; Serrano, M.A. The hepatobiliary-like excretory function of the placenta. A review. Placenta 2003, 24, 431–438. [Google Scholar] [CrossRef] [PubMed]
  56. Serrano, M.A.; Macias, R.I.R.; Briz, O.; Monte, M.J.; Blazquez, A.G.; Williamson, C.; Kubitz, R.; Marin, J.J.G. Expression in human trophoblast and choriocarcinoma cell lines, BeWo, Jeg-3 and JAr of genes involved in the hepatobiliary-like excretory function of the placenta. Placenta 2007, 28, 107–117. [Google Scholar] [CrossRef] [PubMed]
  57. Marin, J.J.; Bravo, P.; el-Mir, M.Y.; Serrano, M.A. ATP-dependent bile acid transport across microvillous membrane of human term trophoblast. Am. J. Physiol. 1995, 268, 685–694. [Google Scholar] [CrossRef]
  58. Bravo, P.; Marin, J.J.; Beveridge, M.J.; Novak, D.A. Reconstitution and characterization of ATP-dependent bile acid transport in human and rat placenta. Biochem. J. 1995, 311, 479–485. [Google Scholar] [CrossRef] [Green Version]
  59. Shoda, J.; Miura, T.; Utsunomiya, H.; Oda, K.; Yamamoto, M.; Kano, M.; Ikegami, T.; Tanaka, N.; Akita, H.; Ito, K. Genipin enhances Mrp2 (Abcc2)-mediated bile formation and organic anion transport in rat liver. Hepatology 2004, 39, 167–178. [Google Scholar] [CrossRef]
  60. Cui, Y.; Konig, J.; Buchholz, J.K.; Spring, H.; Leier, I.; Keppler, D. Drug resistance and ATP-dependent conjugate transport mediated by the apical multidrug resistance protein, MRP2, permanently expressed in human and canine cells. Mol. Pharmacol. 1999, 55, 929–937. [Google Scholar]
  61. Hirohashi, T.; Suzuki, H.; Takikawa, H.; Sugiyama, Y. ATP-dependent transport of bile salts by rat multidrug resistance-associated protein 3 (Mrp3). J. Biol. Chem. 2000, 275, 2905–2910. [Google Scholar] [CrossRef] [PubMed]
  62. Elmir, M.Y.; Eleno, N.; Serrano, M.A.; Bravo, P.; Marin, J.J. Bicarbonate-induced activation of taurocholate transport across the basal plasma membrane of human term trophoblast. Am. J. Physiol. 1991, 260, 887–894. [Google Scholar]
  63. Marin, J.J.; Serrano, M.A.; el-Mir, M.Y.; Eleno, N.; Boyd, C.A. Bile acid transport by basal membrane vesicles of human term placental trophoblast. Gastroenterology 1990, 99, 1431–1438. [Google Scholar] [CrossRef]
  64. Yu, Y.; Liu, X.; Zhang, Z.; Xiao, Y.; Hong, M. Cloning and functional characterization of the pig (Sus scrofa) organic anion transporting polypeptide 1a2. Xenobiotica 2013, 43, 738–744. [Google Scholar] [CrossRef] [PubMed]
  65. Salomoni, M.; Zuccato, E.; Granelli, P.; Montorsi, W.; Doldi, S.B.; Germiniani, R.; Mussini, E. Effect of bile salts on carbonic anhydrase from rat and human gastric mucosa. Scand. J. Gastroenterol. 1989, 24, 28–32. [Google Scholar] [CrossRef] [PubMed]
  66. Boone, C.D.; Tu, C.; Mckenna, R. Structural elucidation of the hormonal inhibition mechanism of the bile acid cholate on human carbonic anhydrase II. Acta Crystallogr. Sect. D 2014, 70, 1758–1763. [Google Scholar] [CrossRef] [PubMed] [Green Version]
  67. Trifunovic, J.; Borcic, V.; Mikov, M. Bile acids and their oxo derivatives: Potential inhibitors of carbonic anhydrase I and II, androgen receptor antagonists and CYP3A4 substrates. Biomed. Chromatogr. 2017, 31, e3870. [Google Scholar] [CrossRef]
  68. Longo, L.D. Respiratory Gas Exchange in the Placenta. In Handbook of Physiology. The Respiratory System, Gas Exchange; American Physiological Society: Bethesda, MD, USA, 1987; pp. 351–401. [Google Scholar]
  69. Lan, X.; Yan, J.; Ren, J.; Zhong, B.; Li, J.; Li, Y.; Liu, L.; Yi, J.; Sun, Q.; Yang, X. A novel long noncoding RNA Lnc-HC binds hnRNPA2B1 to regulate expressions of Cyp7a1 and Abca1 in hepatocytic cholesterol metabolism. Hepatology 2016, 64, 58–72. [Google Scholar] [CrossRef]
  70. Zhang, L.; Yang, Z.; Trottier, J.; Barbier, O.; Wang, L. Long noncoding RNA MEG3 induces cholestatic liver injury by interaction with PTBP1 to facilitate shp mRNA decay. Hepatology 2017, 65, 604–615. [Google Scholar] [CrossRef]
  71. Zhang, Y.; Pan, Y.; Lin, C.; Zheng, Y.; Sun, H.; Zhang, H.; Wang, J.; Yuan, M.; Duan, T.; Du, Q.; et al. Bile acids evoke placental inflammation by activating Gpbar1/NF-kappaB pathway in intrahepatic cholestasis of pregnancy. J. Mol. Cell Biol. 2016, 8, 530–541. [Google Scholar] [CrossRef]
  72. Du, Q.; Zhang, Y.; Pan, Y.; Duan, T. Lithocholic acid-induced placental tumor necrosis factor-α upregulation and syncytiotrophoblast cell apoptosis in intrahepatic cholestasis of pregnancy. Hepatol. Res. 2014, 44, 532–541. [Google Scholar] [CrossRef] [PubMed]
  73. Che, L.; Yang, Z.G.; Xu, M.M.; Xu, S.Y.; Che, L.Q.; Lin, Y.; Fang, Z.F.; Feng, B.; Li, J.; Chen, D.W.; et al. Maternal nutrition modulates fetal development by inducing placental efficiency changes in gilts. BMC Genom. 2017, 18, 14. [Google Scholar] [CrossRef] [PubMed]
  74. LARusso, N.F.; Korman, M.G.; Hoffman, N.E.; Hofmann, A.F. Dynamics of the enterohepatic circulation of bile acids: Postprandial serum concentrations of conjugates of cholic acid in health, cholecystectomized patients, and patients with bile acid malabsorption. N. Engl. J. Med. 1974, 291, 689–692. [Google Scholar] [CrossRef] [PubMed]
  75. Sonne, D.P.; Van Nierop, F.S.; Kulik, W.; Soeters, M.R.; Vilsboll, T.; Knop, F.K. Postprandial Plasma Concentrations of Individual Bile Acids and FGF-19 in Patients With Type 2 Diabetes. J. Clin. Endocrinol. Metab. 2016, 101, 3002–3009. [Google Scholar] [CrossRef] [PubMed]
  76. Takken, A.; Williams, K.C. A simplified procedure for long-term catheterisation of the anterior vena cava in adult pigs. Aust. Vet. J. 1981, 57, 17–20. [Google Scholar] [CrossRef]
  77. Guttman, M.; Garber, M.; Levin, J.Z.; Donaghey, J.; Robinson, J.T.; Adiconis, X.; Fan, L.; Koziol, M.J.; Gnirke, A.; Nusbaum, C. Ab initio reconstruction of cell type-specific transcriptomes in mouse reveals the conserved multi-exonic structure of lincRNAs. Nat. Biotechnol. 2010, 28, 503–510. [Google Scholar] [CrossRef]
  78. Trapnell, C.; Williams, B.A.; Pertea, G.; Mortazavi, A.; Kwan, G.; Van Baren, M.J.; Salzberg, S.L.; Wold, B.J.; Pachter, L. Transcript assembly and quantification by RNA-Seq reveals unannotated transcripts and isoform switching during cell differentiation. Nat. Biotechnol. 2010, 28, 511–515. [Google Scholar] [CrossRef] [Green Version]
  79. Vandesompele, J.; de, P.K.; Pattyn, F.; Poppe, B.; van, R.N.; de, P.A.; Speleman, F. Accurate normalization of real-time quantitative RT-PCR data by geometric averaging of multiple internal control genes. Genome Biol. 2002, 3, 1. [Google Scholar] [CrossRef]
  80. Zhuo, Y.; Hua, L.; Feng, B.; Jiang, X.M.; Li, J.; Jiang, D.D.; Huang, X.H.; Zhu, Y.G.; Li, Z.; Yan, L.J.; et al. Fibroblast growth factor 21 coordinates adiponectin to mediate the beneficial effects of low-protein diet on primordial follicle reserve. Ebiomedicine 2019, 41, 623–635. [Google Scholar] [CrossRef] [Green Version]
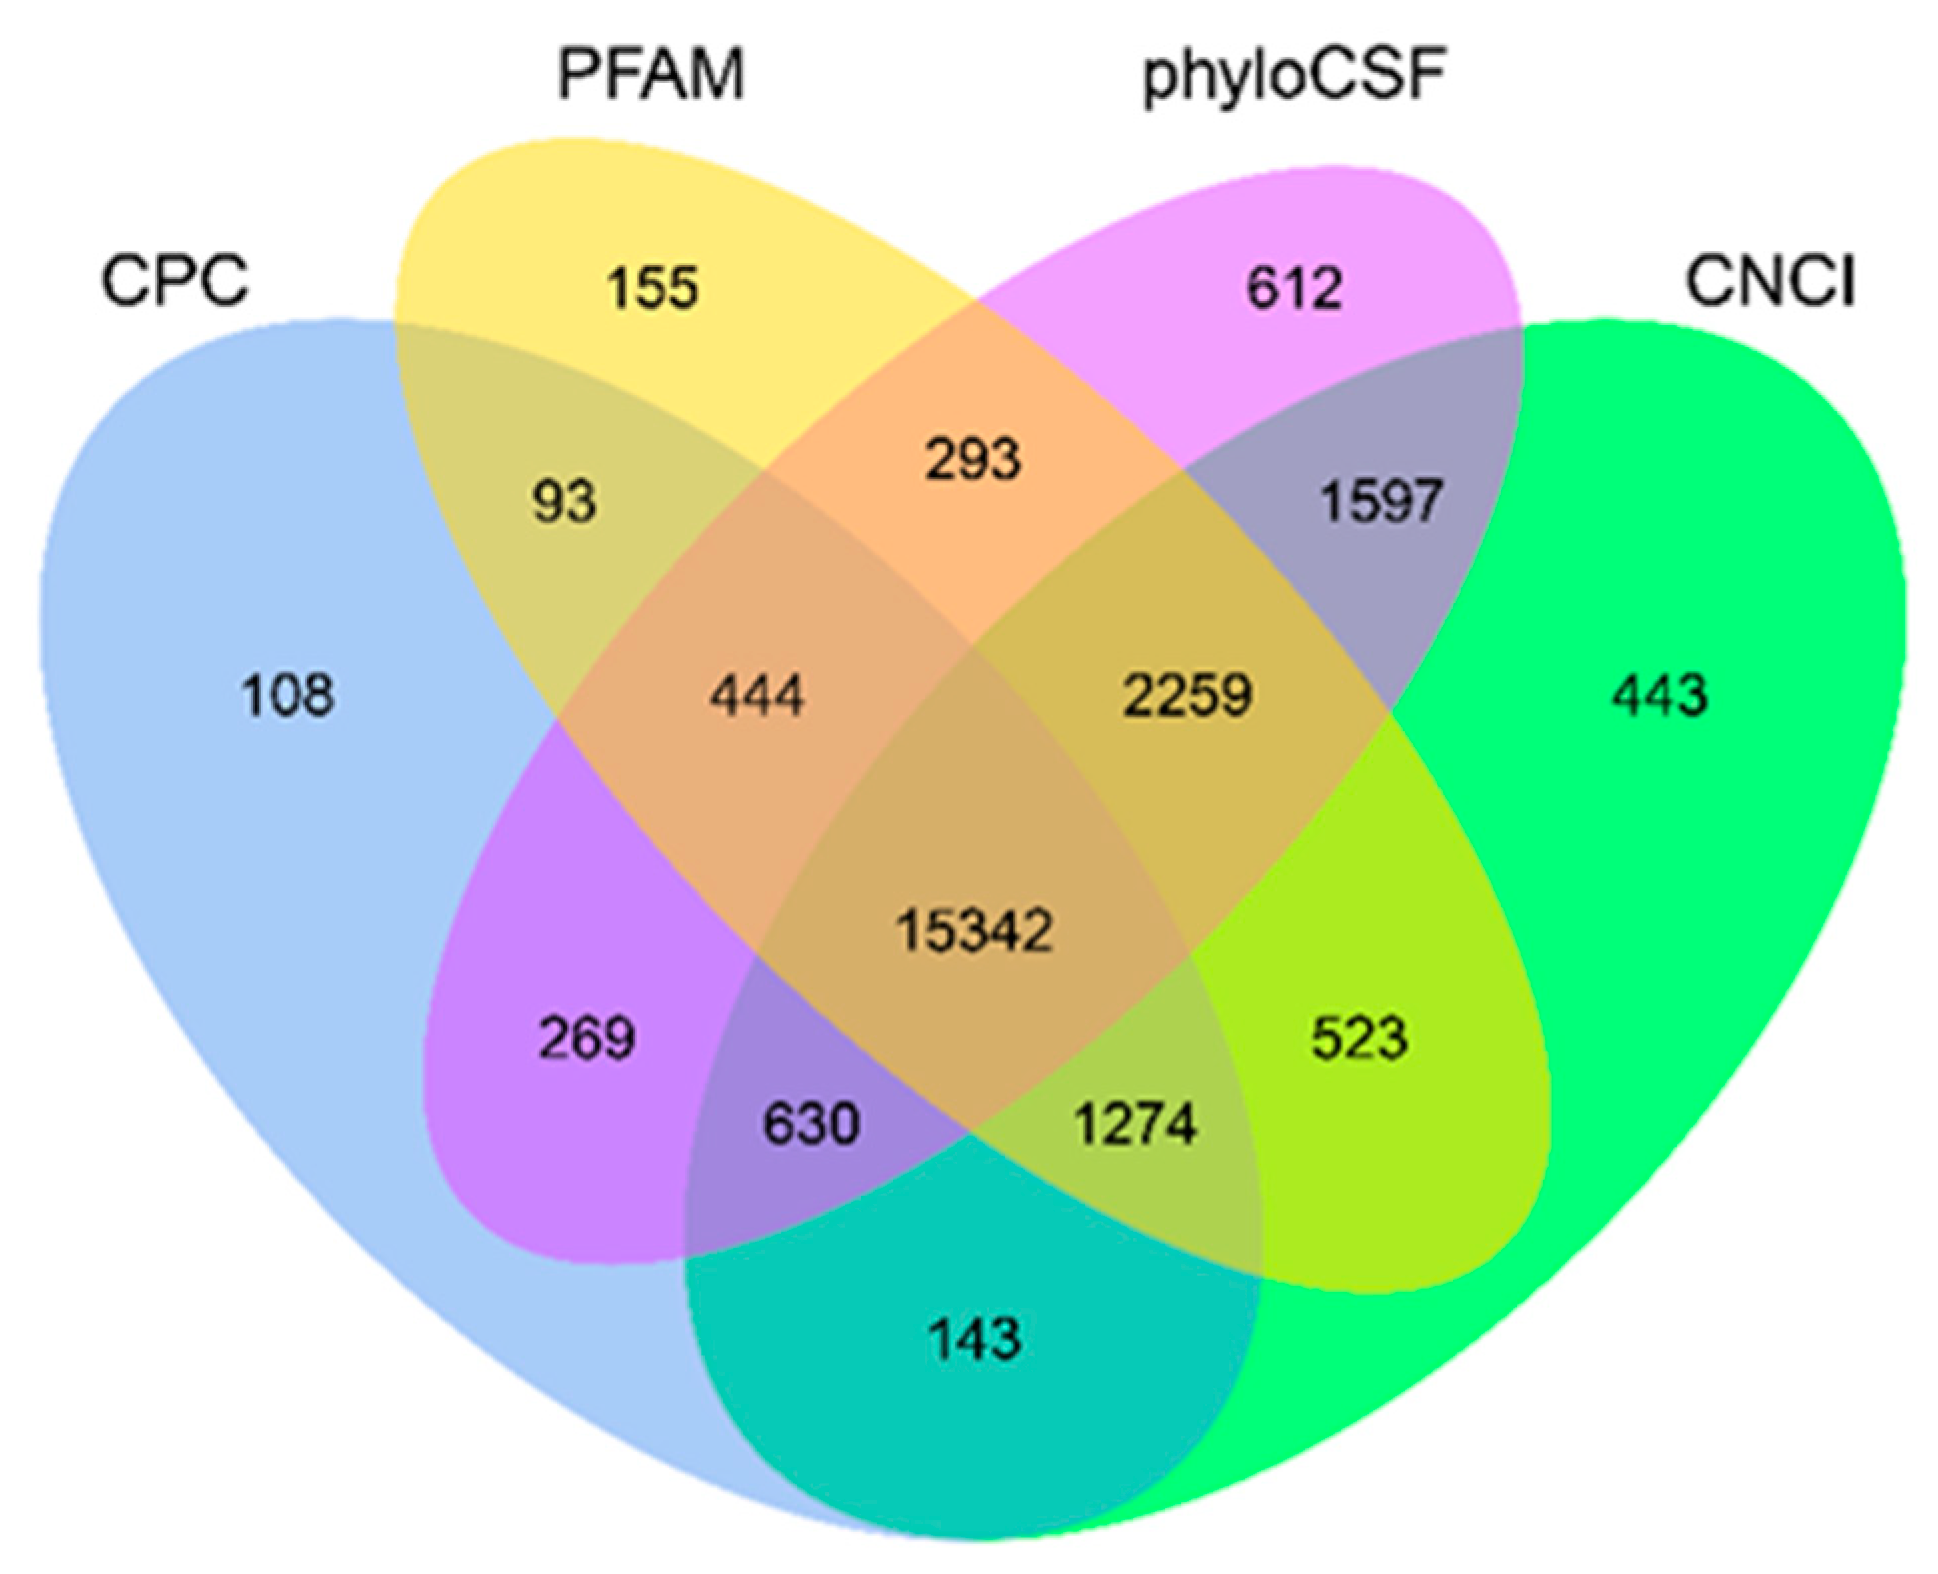
Figure 1. Screening of the candidate long non-coding RNAs (lncRNAs) in placenta transcriptome. Coding Potential Calculator (CPC), Coding-Non-Coding-Index (CNCI), Pfam-scan (PFAM) and phylogenetic codon substitution frequency (phyloCSF) were used to analyze the coding potential of lncRNAs. CPC, Coding Potential Calculator; PFAM, Pfamscan; PhyloCSF, phylogenetic codon substitution frequency; CNCI, Coding-Non-Coding-Index.
Ijms 20 04099 g001
Figure 2. Comparison of expression levels and genomic feature of predicted long non-coding RNAs (lncRNAs) and mRNAs in pregnant swine placentas. (A) The expression levels (log10 (FPKM+1)) of mRNAs and lncRNAs; The (B) length, (C) exon number, (D) Open reading frame (ORF) length of mRNAs and lncRNAs, respectively.
Ijms 20 04099 g002
Figure 3. Transcriptome profile of RNA-seq data at G60, G90, and L0. (A) A volcano plot of differentially expressed transcripts, including mRNAs and long non-coding RNAs (lncRNAs), between G60 and G90, and (B) between G60 and L0. (C) Unsupervised hierarchical clustering of the expression profile of significant genes of mRNAs, and (D) lncRNAs among G60, G90, and L0.
Ijms 20 04099 g003
Figure 4. Unsupervised hierarchical clustering of the expression profile of significant genes enriched in bile secretion between G60 and G90 placentas.
Ijms 20 04099 g004
Figure 5. The differentially expressed genes involved in bile secretion at G60, G90, and L0 placentas. (A) The relative expression levels of ABCB11, (B) organic anion-transporting polypeptide 1A2 (OATP1A2), (C) carbonic anhydrase II (CA2), (D) SLC4A4, (E) hydroxysteroid sulfotransferases (SULT2A1), and (F) FXR determined by RNA-Seq at G60, G90, and L0. Data are shown as means ± SE, * p < 0.05, ** p < 0.01.
Ijms 20 04099 g005
Figure 6. The total bile acids (TBA) of placentas used for RNA-Seq at G60, G90, and L0. n = 3–4/group. Data are shown as means ± SE, * p < 0.05, ** p < 0.01.
Ijms 20 04099 g006
Figure 7. The complement system in livers and placentas. The expression of hepatic complement C3 and C5 (A) and placental complement C5 (B) between G60 and G90 determined by qRT-PCR, n = 3–6/group. (C) The concentrations of complement C5a in U-A, U-V, C-V serum between G60 and G90, n = 5–6/group. (D)The concentrations of complement C5a in maternal peripheral serum, n = 10/group. U-A, uterine artery, C-V, umbilical cord vein, U-V, uterine vein. Data are shown as means ± SE.
Ijms 20 04099 g007
Figure 8. The significantly enriched Kyoto Encyclopendia of Genes and Genomes (KEGG) pathway of predicted trans-regulated targeted protein-coding genes of differentially expressed lncRNAs between G60 and G90. (A) The significantly enriched KEGG pathway of significantly differentially expressed mRNAs between G60 and G90. (B) A scatterplot of XLOC_1301271 and SULT2A1 expression levels in individual placental samples determined by RNA-Seq. (C) A scatterplot of ALDBSSCG0000000220 and SULT2A1 expression levels in individual placental samples determined by RNA-Seq. PCC, Pearson Correlation Coefficient; n = 3–4/group.
Ijms 20 04099 g008