High and Low Molecular Weight Hyaluronic Acid Differentially Influences Oxylipins Synthesis in Course of Neuroinflammation

 ,
,
Abstract
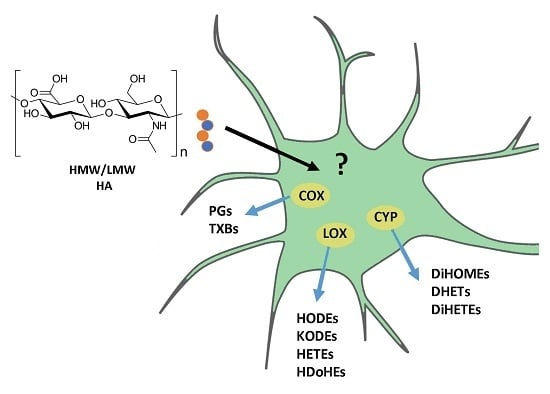
1. Introduction
2. Results
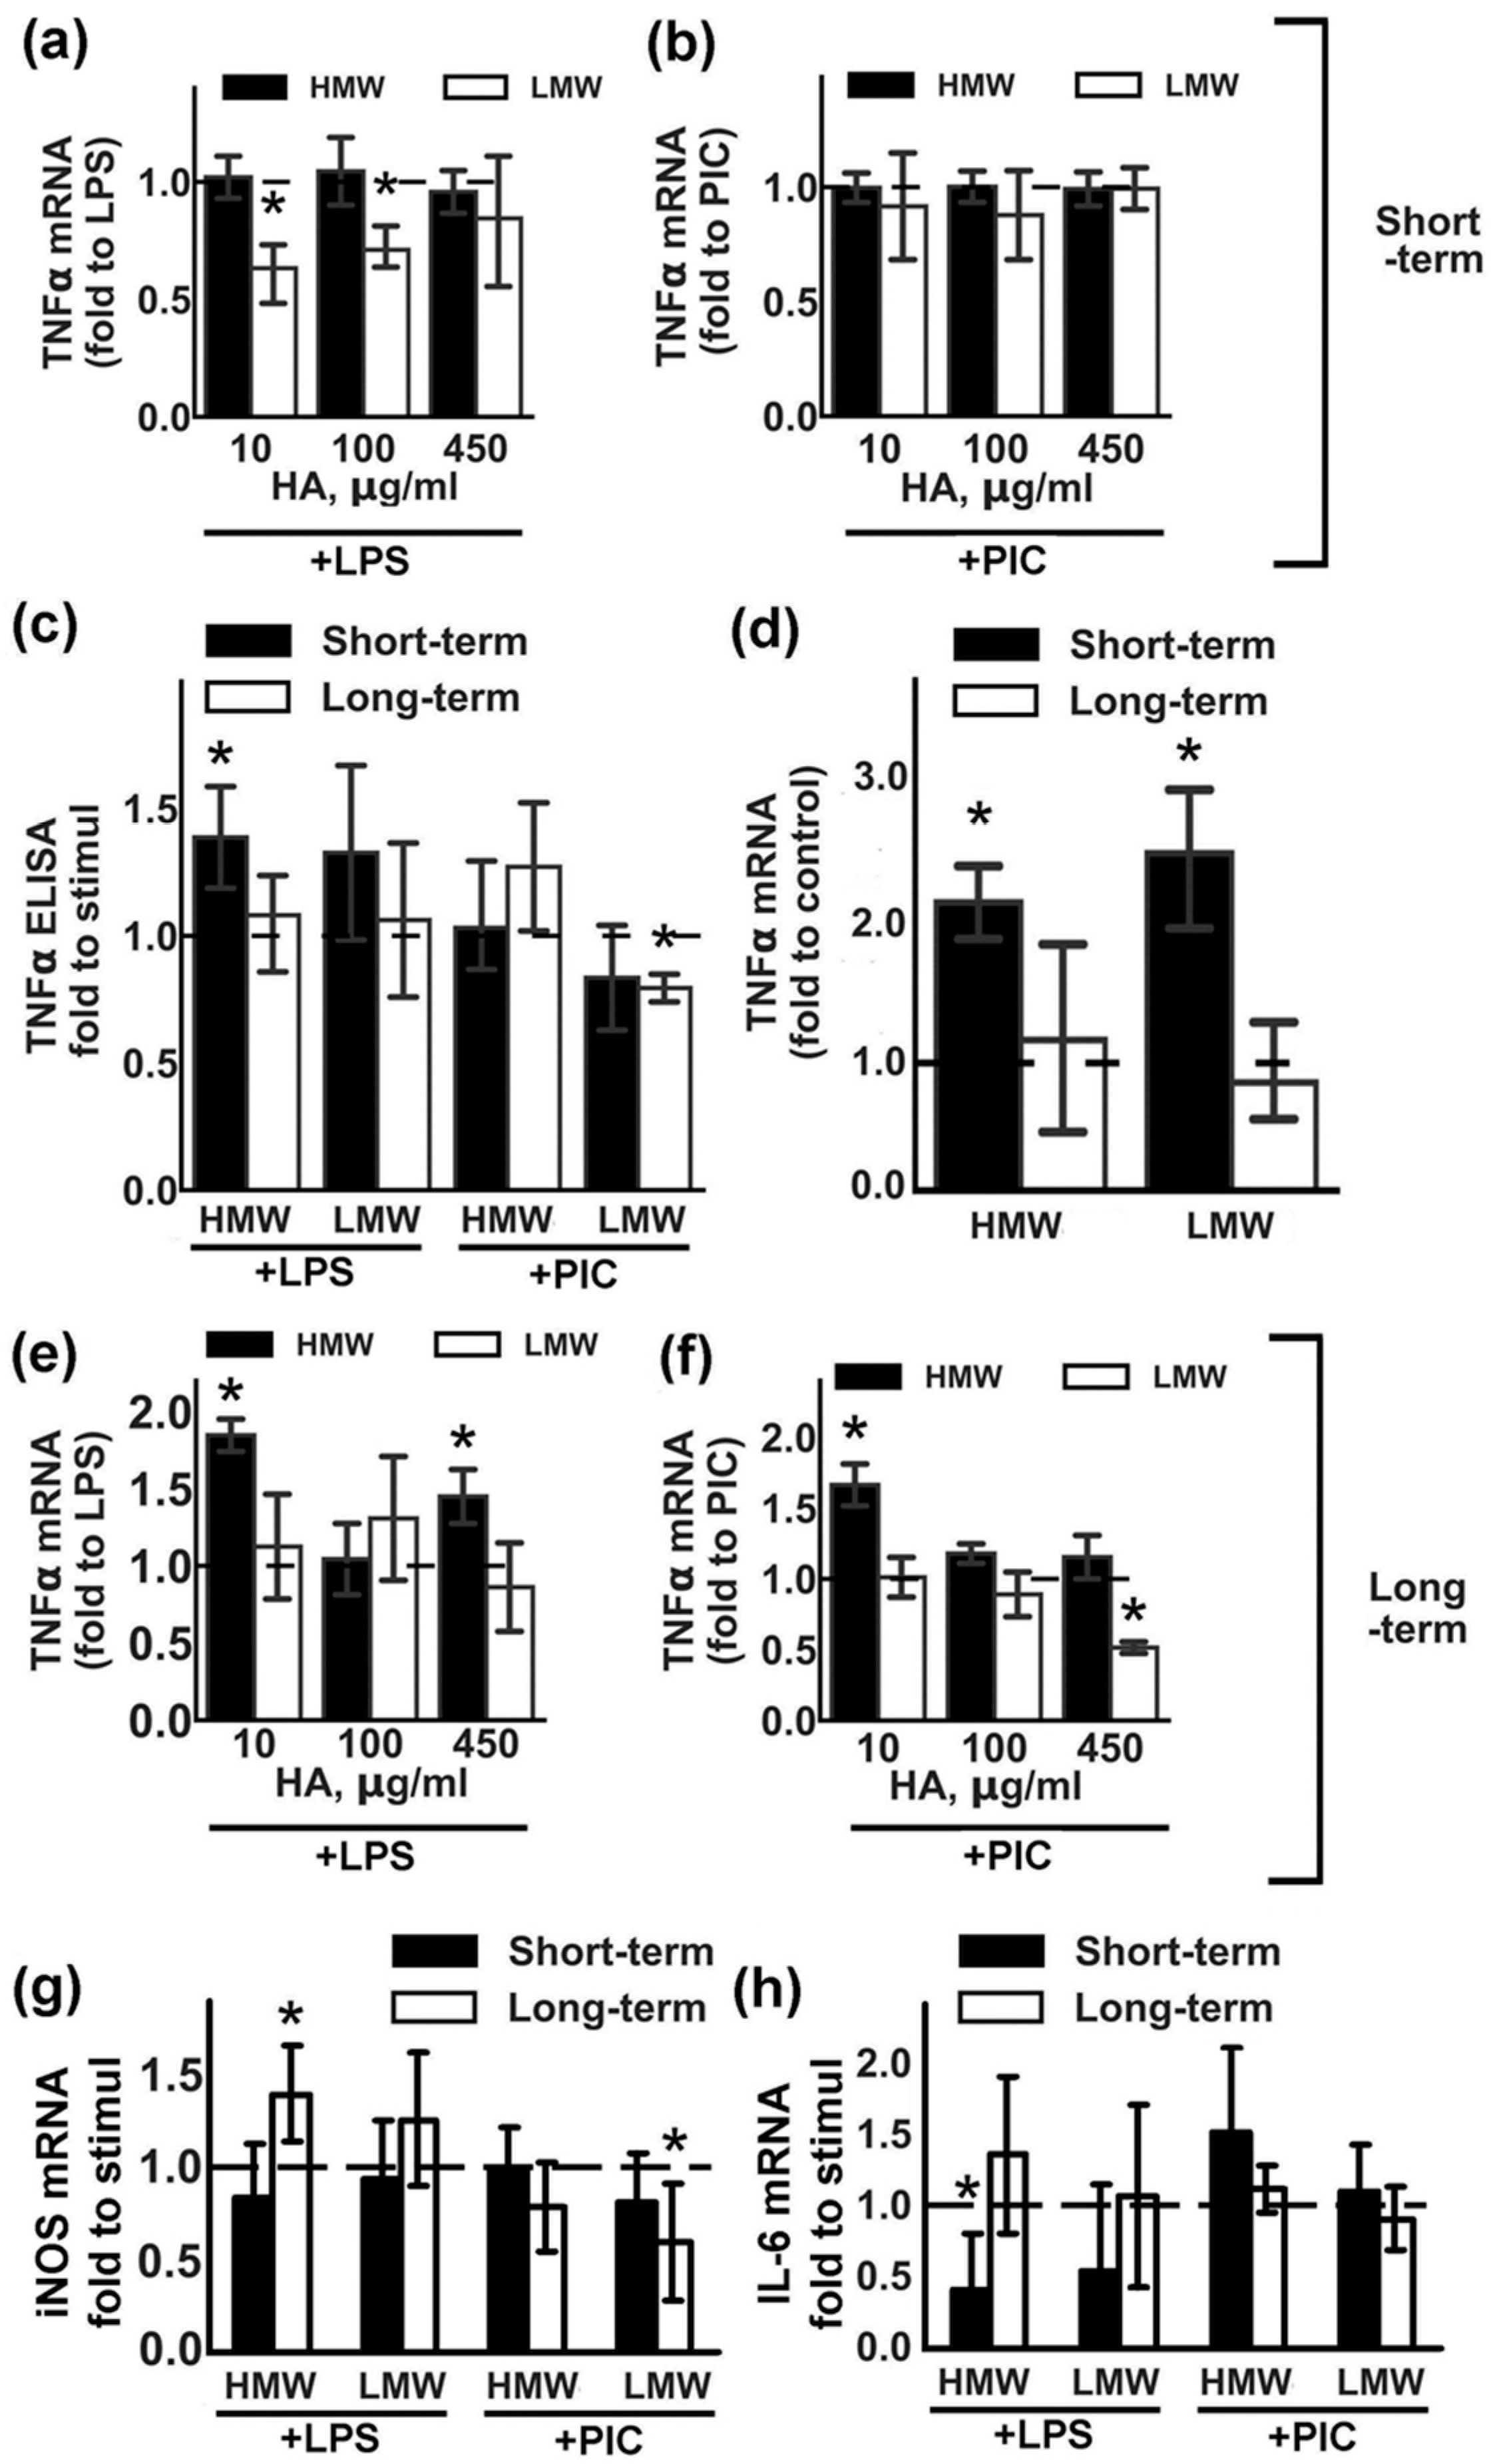
2.1. Modulation of Pro-Inflammatory Cytokine TNFα Expression by HMW and LMW HAs
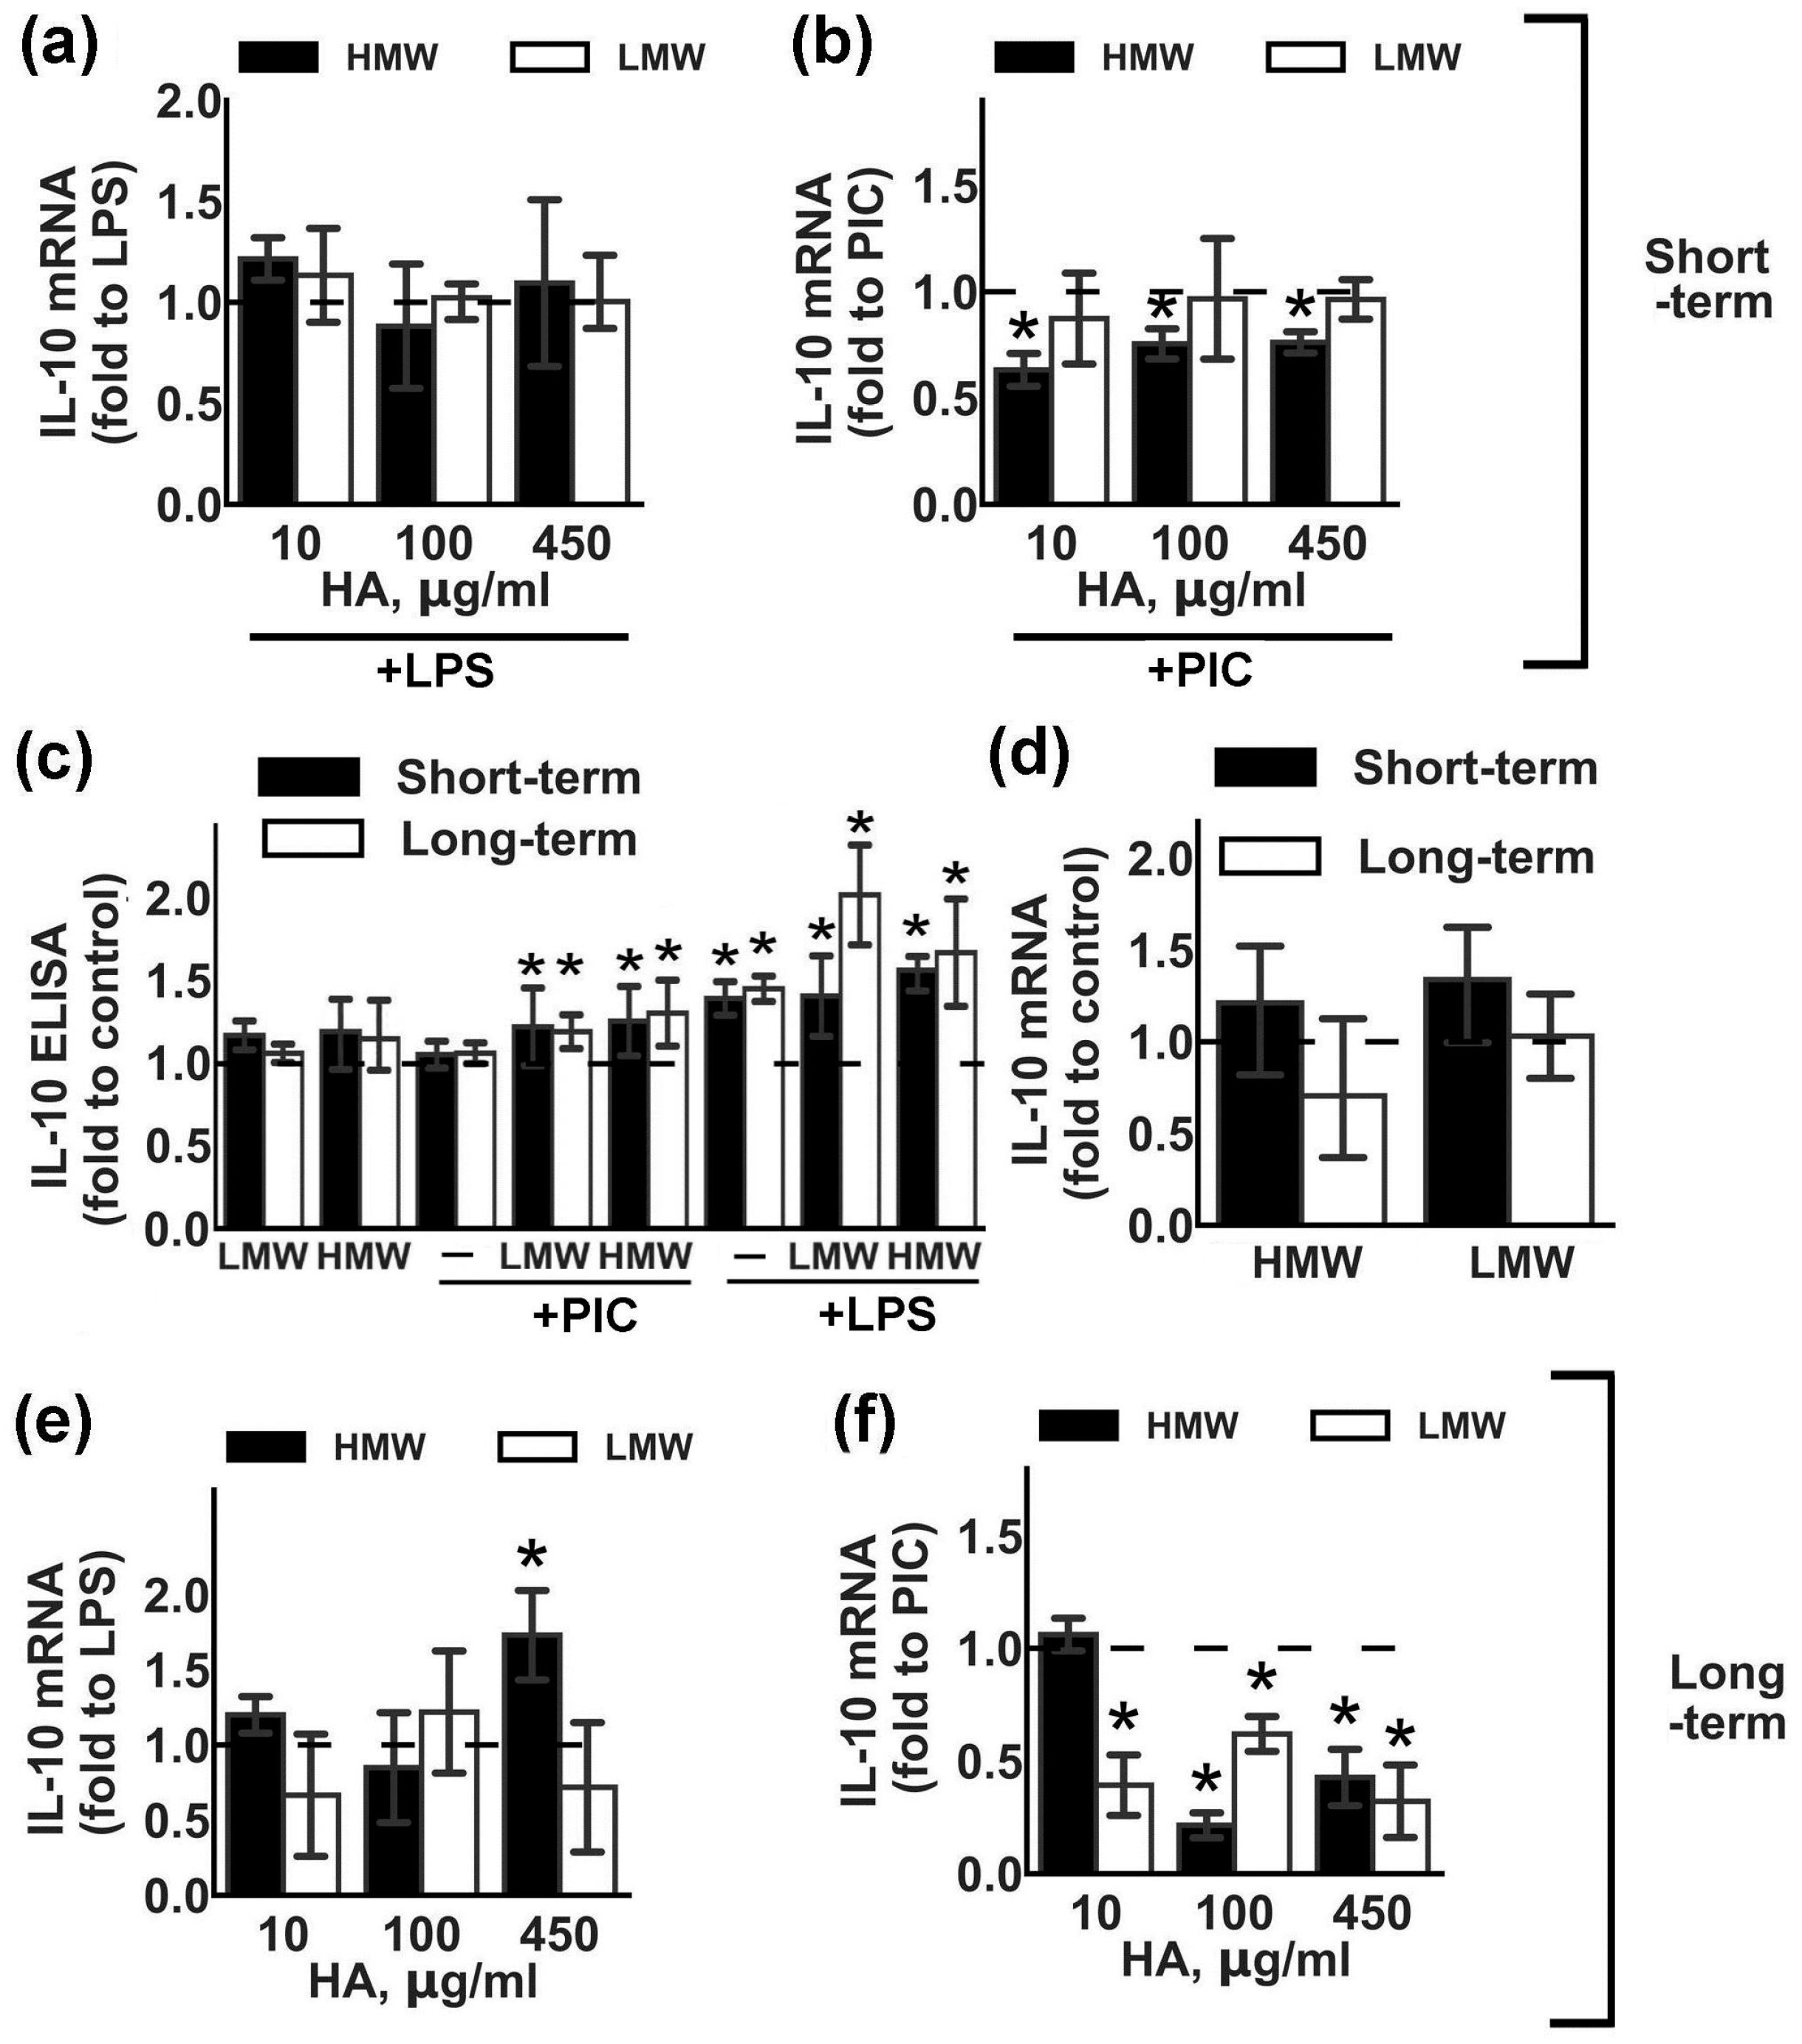
2.2. Modulation of Anti-Inflammatory Cytokine IL-10 Expression by HMW and LMW HA.
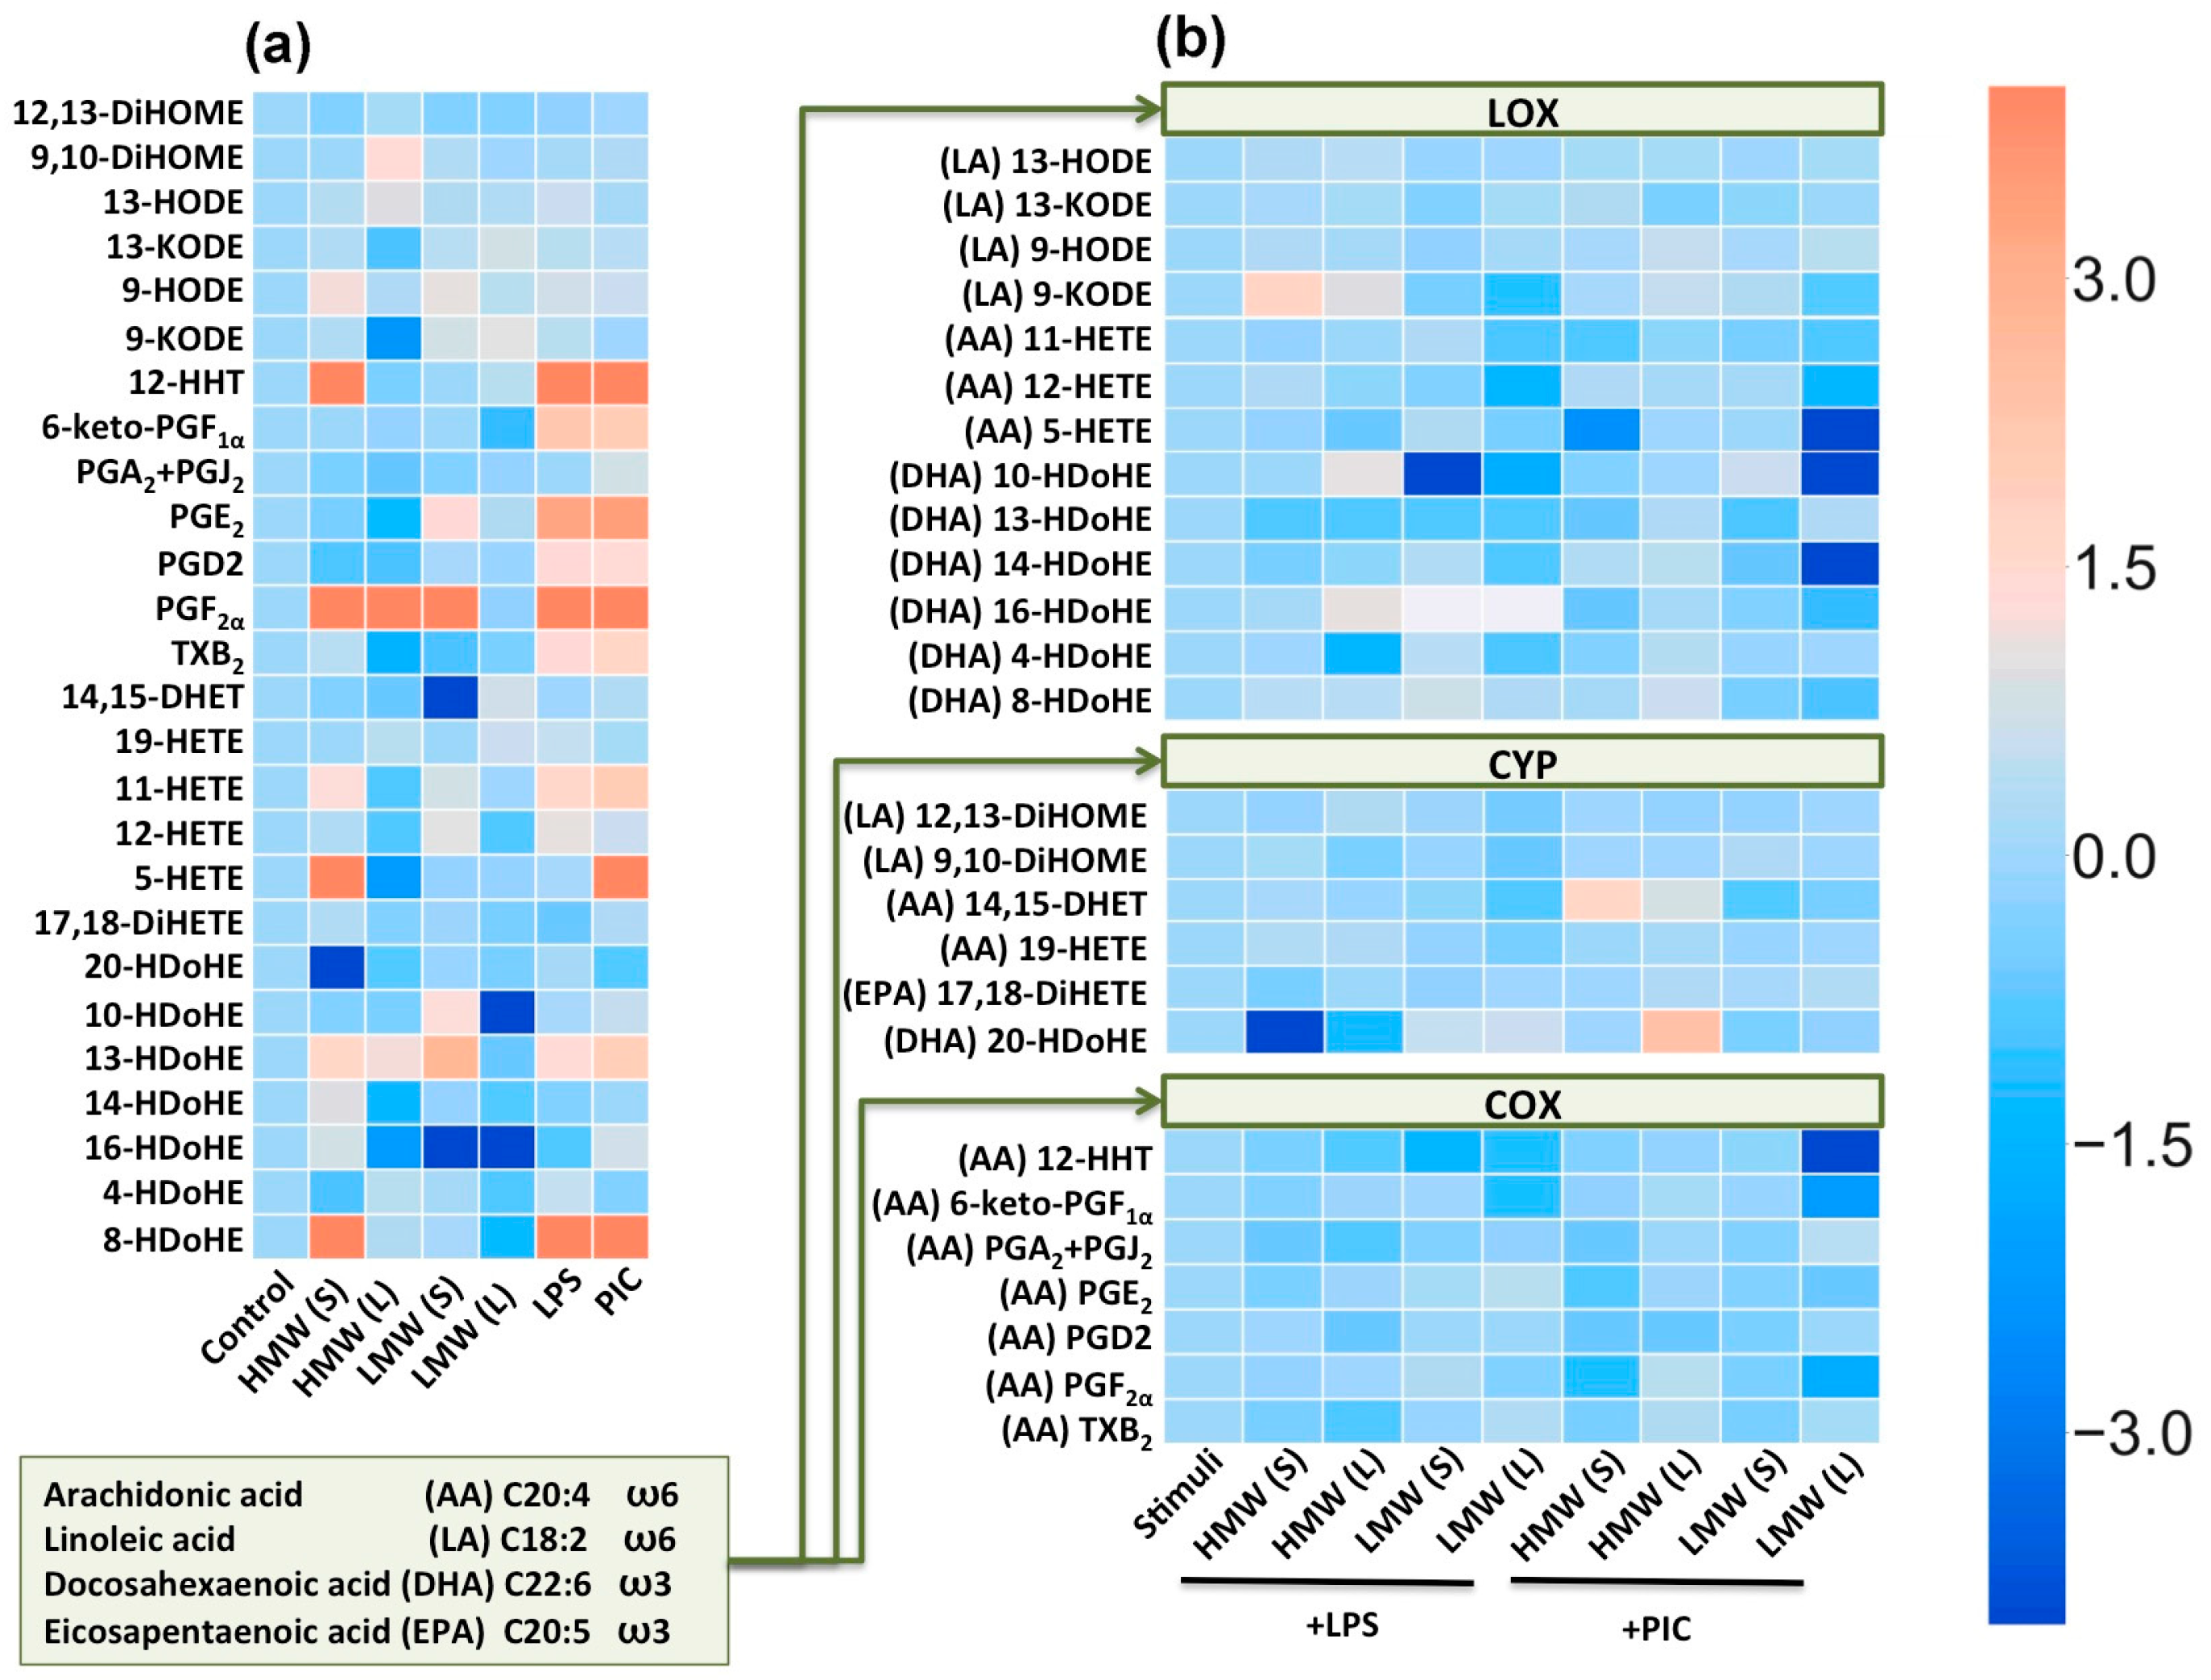
2.3. Modulation of Oxylipin Synthesis by HMW and LMW HA.
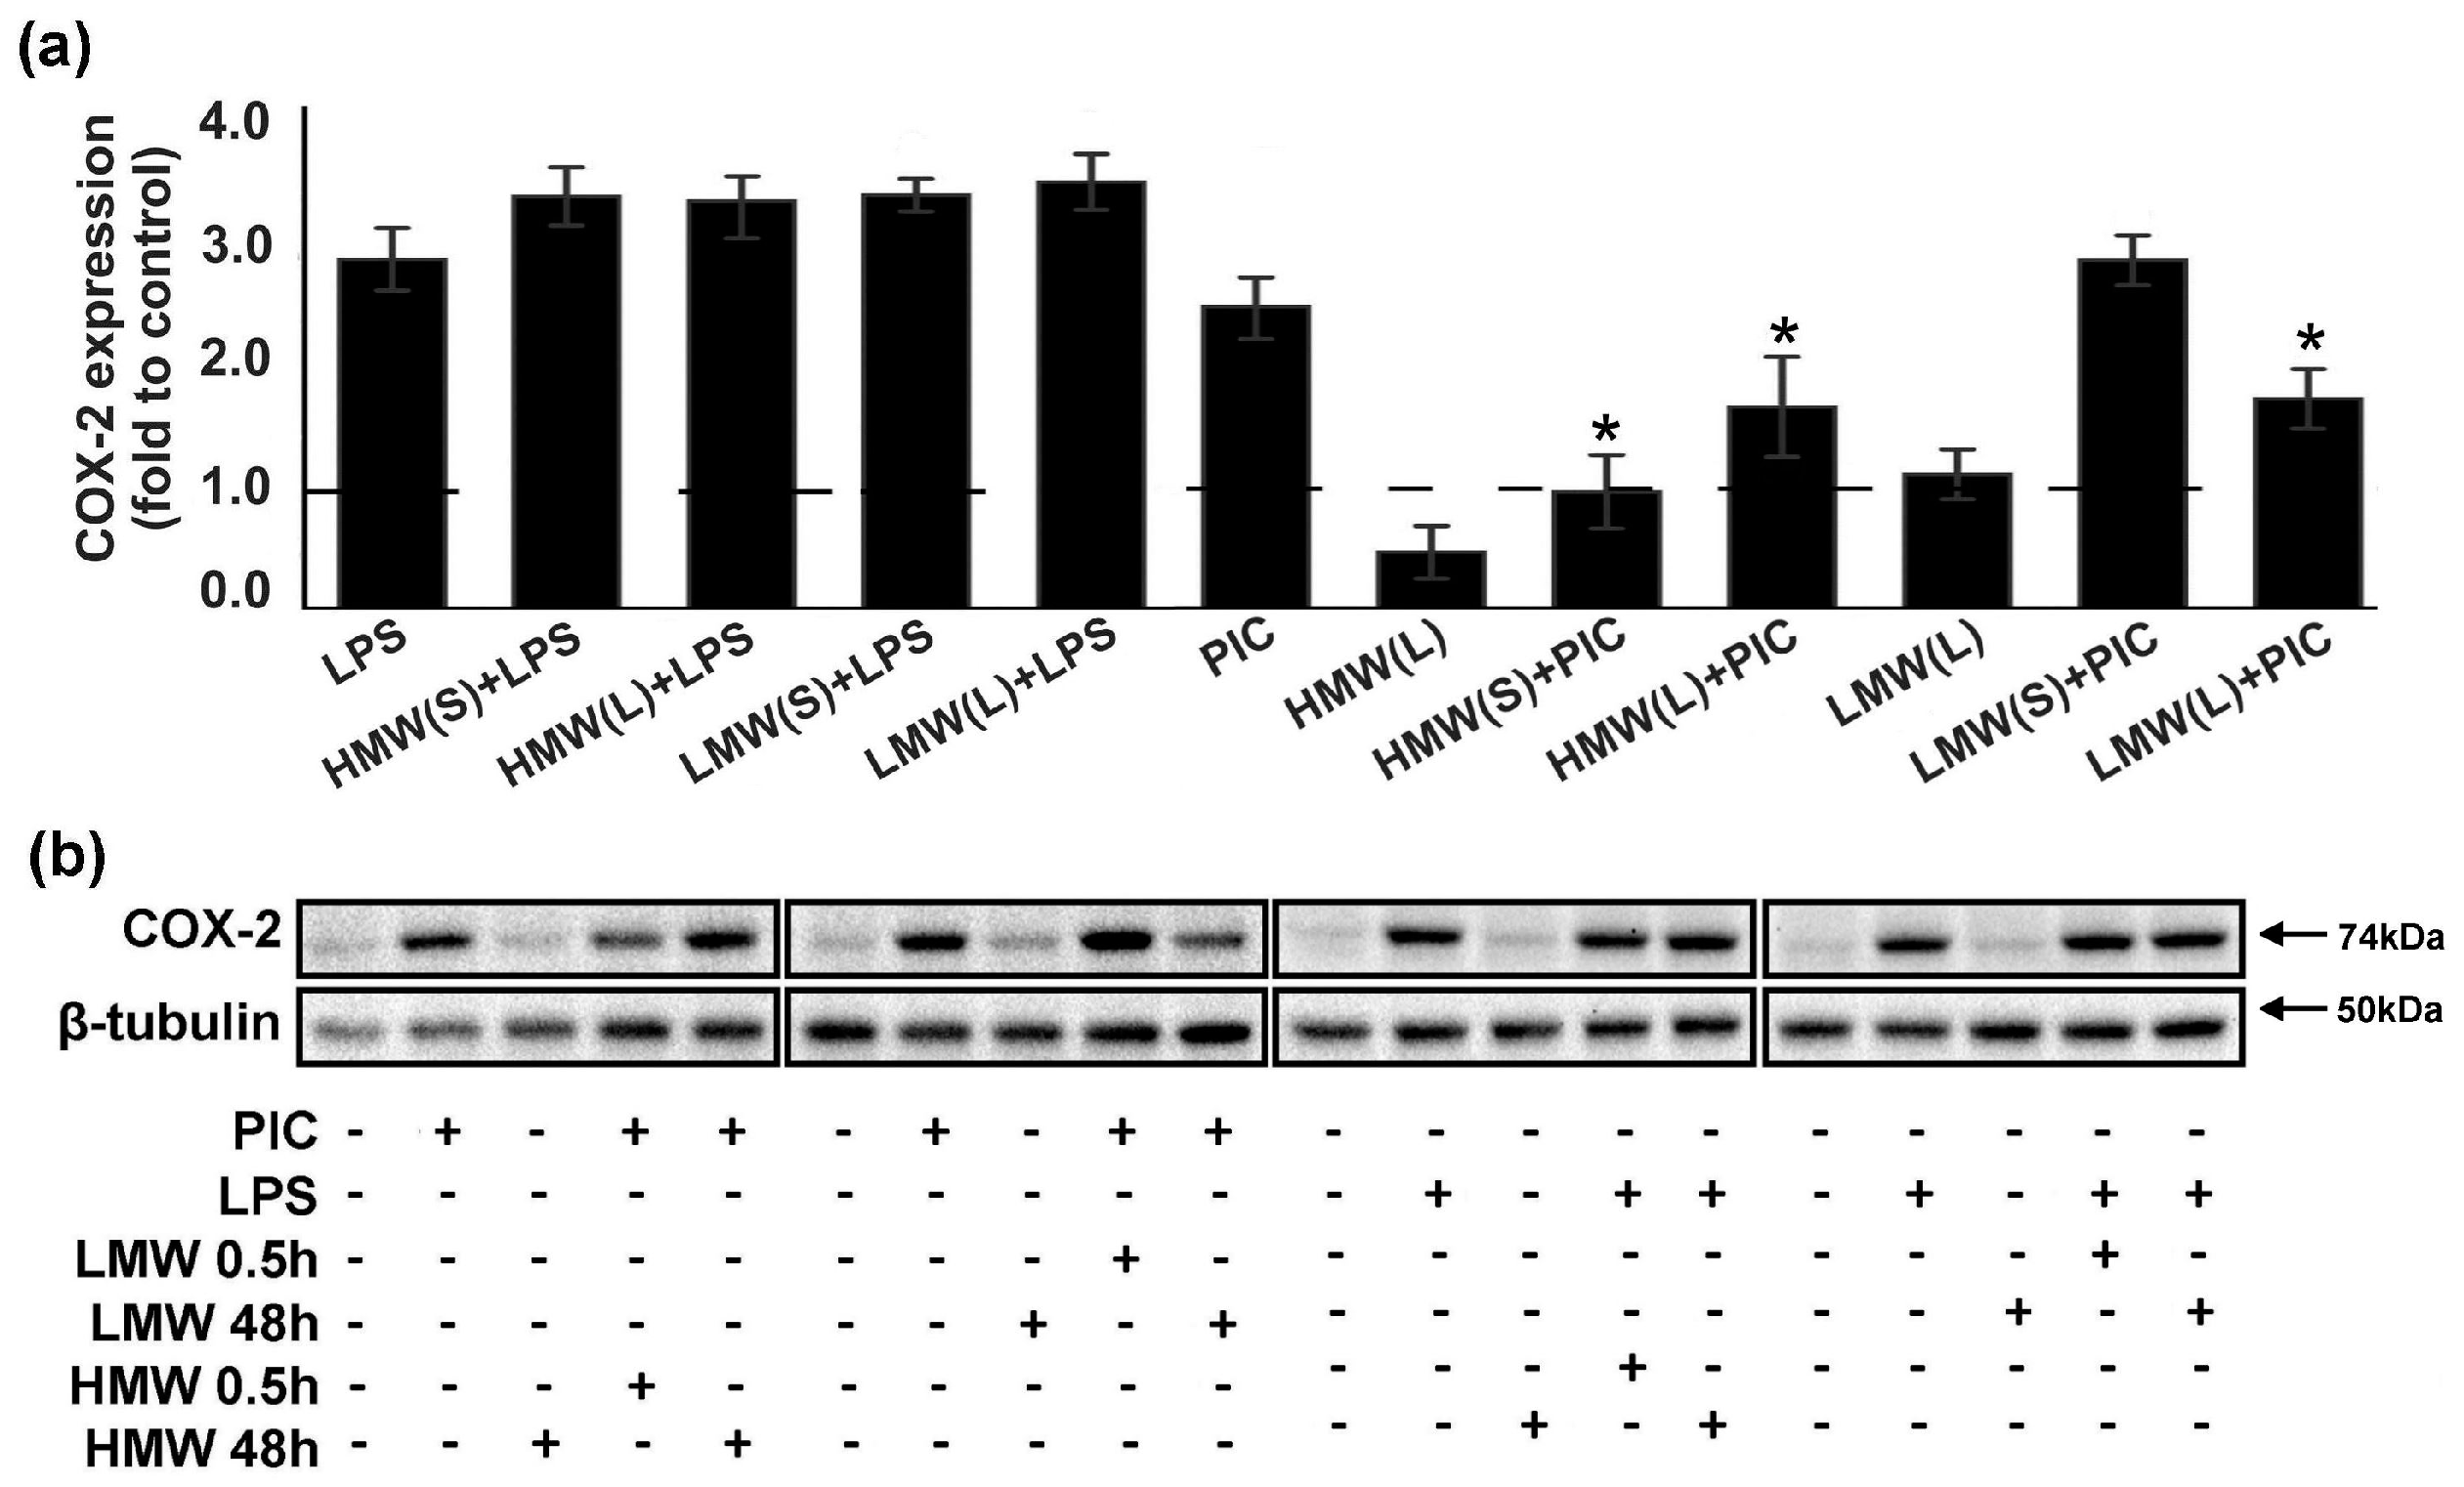
2.4. Modulation of Cyclooxygenase 2 (COX-2) Expression by HMW and LMW HA.
3. Discussion
4. Materials and Methods
4.1. Reagents
4.2. Primary Cell Culture
4.3. Measurement of the Relative RNA Expression Level
4.4. Western Blot Analysis
4.5. Immunofluorescence Analysis
4.6. UPLC-MS/MS Conditions and Sample Preparation
4.7. Determination of TNFα and IL-10 by Enzyme-Linked Immunoassay
4.8. Experimental Data Analysis and Statistics
Supplementary Materials
Author Contributions
Funding
Acknowledgments
Conflicts of Interest
Abbreviations
| HA | hyaluronic acid |
| HMW | high molecular weight |
| LMW | low molecular weight |
| TLR | toll-like receptor |
| LPS | lipopolysaccharide |
| TNFα | tumor necrosis factor alpha |
| COX-2 | cyclooxygenase-2 |
| DHA | docosahexaenoic acid |
| AA | arachidonic acid |
| IL-10 | interleukin-10 |
| iNOS | inducible nitric oxide synthase |
| IL-6 | interleukin 6 |
References
- Garantziotis, S.; Savani, R.C. Hyaluronan biology: A complex balancing act of structure, function, location and context. Matrix Biol. 2019, 78–79, 1–10. [Google Scholar] [CrossRef] [PubMed]
- Theocharis, A.D.; Manou, D.; Karamanos, N.K. The extracellular matrix as a multitasking player in disease. FEBS J. 2019. [Google Scholar] [CrossRef] [PubMed]
- Lau, L.W.; Cua, R.; Keough, M.B.; Haylock-Jacobs, S.; Yong, V.W. Pathophysiology of the brain extracellular matrix: A new target for remyelination. Nat. Rev. Neurosci. 2013, 14, 722–729. [Google Scholar] [CrossRef] [PubMed]
- Syková, E.; Nicholson, C. Diffusion in Brain Extracellular Space. Physiol. Rev. 2008, 88, 1277–1340. [Google Scholar] [CrossRef] [PubMed]
- Bonneh-Barkay, D.; Wiley, C.A. Brain extracellular matrix in neurodegeneration. Brain Pathol. 2009, 19, 573–585. [Google Scholar] [CrossRef] [PubMed]
- Bignami, A.; Hosley, M.; Dahl, D. Hyaluronic acid and hyaluronic acid-binding proteins in brain extracellular matrix. Anat. Embryol. 1993, 188, 419–433. [Google Scholar] [CrossRef]
- Barros, C.S.; Franco, S.J.; Müller, U. Extracellular Matrix: Functions in the nervous system. Cold Spring Harb. Perspect. Biol. 2011, 3, 1–24. [Google Scholar] [CrossRef]
- D’Agostino, A.; Stellavato, A.; Corsuto, L.; Diana, P.; Filosa, R.; La Gatta, A.; De Rosa, M.; Schiraldi, C. Is molecular size a discriminating factor in hyaluronan interaction with human cells? Carbohydr. Polym. 2017, 157, 21–30. [Google Scholar] [CrossRef]
- Mueller, A.M.; Yoon, B.H.; Sadiq, S.A. Inhibition of hyaluronan synthesis protects against central nervous system (CNS) autoimmunity and increases CXCL12 expression in the inflamed CNS. J. Biol. Chem. 2014, 289, 22888–22899. [Google Scholar] [CrossRef]
- Scuruchi, M.; D’Ascola, A.; Avenoso, A.; Campana, S.; Abusamra, Y.A.; Spina, E.; Calatroni, A.; Campo, G.M.; Campo, S. 6-Mer Hyaluronan Oligosaccharides Modulate Neuroinflammation and α-Synuclein Expression in Neuron-Like SH-SY5Y Cells. J. Cell. Biochem. 2016, 117, 2835–2843. [Google Scholar] [CrossRef]
- Sherman, L.S.; Matsumoto, S.; Su, W.; Srivastava, T.; Back, S.A. Hyaluronan Synthesis, Catabolism, and Signaling in Neurodegenerative Diseases. Int. J. Cell Biol. 2015, 2015, 1–10. [Google Scholar] [CrossRef] [PubMed]
- Jiang, D.; Liang, J.; Noble, P.W. Hyaluronan as an Immune Regulator in Human Diseases. Physiol. Rev. 2011, 91, 221–264. [Google Scholar] [CrossRef] [PubMed]
- Struve, J.; Maher, P.C.; Li, Y.Q.; Kinney, S.; Fehlings, M.G.; Kuntz, I.V.C.; Sherman, L.S. Disruption of the hyaluronan-based extracellular matrix in spinal cord promotes astrocyte proliferation. Glia 2005, 52, 16–24. [Google Scholar] [CrossRef] [PubMed]
- Khaing, Z.Z.; Milman, B.D.; Vanscoy, J.E.; Seidlits, S.K.; Grill, R.J.; Schmidt, C.E. High molecular weight hyaluronic acid limits astrocyte activation and scar formation after spinal cord injury. J. Neural Eng. 2011, 8, 046033. [Google Scholar] [CrossRef] [PubMed]
- Austin, J.W.; Gilchrist, C.; Fehlings, M.G. High molecular weight hyaluronan reduces lipopolysaccharide mediated microglial activation. J. Neurochem. 2012, 122, 344–355. [Google Scholar] [CrossRef] [PubMed]
- Astakhova, A.A.; Chistyakov, D.V.; Sergeeva, M.G.; Reiser, G. Regulation of the ARE-binding proteins, TTP (tristetraprolin) and HuR (human antigen R), in inflammatory response in astrocytes. Neurochem. Int. 2018, 118, 82–90. [Google Scholar] [CrossRef] [PubMed]
- Kwan, T.; Floyd, C.L.; Patel, J.; Mohaimany-Aponte, A.; King, P.H. Astrocytic expression of the RNA regulator HuR accentuates spinal cord injury in the acute phase. Neurosci. Lett. 2017, 651, 140–145. [Google Scholar] [CrossRef] [PubMed]
- Phulwani, N.K.; Esen, N.; Syed, M.M.; Kielian, T. TLR2 expression in astrocytes is induced by TNF-alpha- and NF-kappa B-dependent pathways. J. Immunol. 2008, 181, 3841–3849. [Google Scholar] [CrossRef]
- Dzwonek, J.; Wilczynski, G.M. CD44: molecular interactions, signaling and functions in the nervous system. Front. Cell. Neurosci. 2015, 9, 175. [Google Scholar] [CrossRef]
- Gabbs, M.; Leng, S.; Devassy, J.G.; Monirujjaman, M.; Aukema, H.M. Advances in Our Understanding of Oxylipins Derived from Dietary PUFAs. Adv. Nutr. 2015, 6, 513–540. [Google Scholar] [CrossRef]
- Chistyakov, D.V.; Azbukina, N.V.; Lopachev, A.V.; Kulichenkova, K.N.; Astakhova, A.A.; Sergeeva, M.G. Rosiglitazone as a modulator of TLR4 and TLR3 signaling pathways in rat primary neurons and astrocytes. Int. J. Mol. Sci. 2018, 19, 113. [Google Scholar] [CrossRef] [PubMed]
- Buyanova, S.M.; Chistyakov, D.V.; Astakhova, A.A.; Sergeeva, M.G. The effect of dehydroepiandrosterone on inflammatory response of astroglial cells. Biochem. (Moscow) Suppl. Ser. A Membr. Cell Biol. 2017, 11, 304–310. [Google Scholar] [CrossRef]
- Serhan, C.N.; Brain, S.D.; Buckley, C.D.; Gilroy, D.W.; Haslett, C.; O’Neill, L.A.J.; Perretti, M.; Rossi, A.G.; Wallace, J.L. Resolution of inflammation: State of the art, definitions and terms. FASEB J. 2007, 21, 325–332. [Google Scholar] [CrossRef] [PubMed]
- López-Vicario, C.; Rius, B.; Alcaraz-Quiles, J.; García-Alonso, V.; Lopategi, A.; Titos, E.; Clària, J. Pro-resolving mediators produced from EPA and DHA: Overview of the pathways involved and their mechanisms in metabolic syndrome and related liver diseases. Eur. J. Pharmacol. 2016, 785, 133–143. [Google Scholar] [CrossRef] [PubMed]
- Chistyakov, D.V.; Grabeklis, S.; Goriainov, S.V.; Chistyakov, V.V.; Sergeeva, M.G.; Reiser, G. Astrocytes synthesize primary and cyclopentenone prostaglandins that are negative regulators of their proliferation. Biochem. Biophys. Res. Commun. 2018, 500, 204–210. [Google Scholar] [CrossRef] [PubMed]
- Strokin, M.; Sergeeva, M.; Reiser, G. Docosahexaenoic acid and arachidonic acid release in rat brain astrocytes is mediated by two separate isoforms of phospholipase A 2 and is differently regulated by cyclic AMP and Ca2+. Br. J. Pharmacol. 2003, 139, 1014–1022. [Google Scholar] [CrossRef] [PubMed]
- Sergeeva, M.; Strokin, M.; Reiser, G. Regulation of intracellular calcium levels by polyunsaturated fatty acids, arachidonic acid and docosahexaenoic acid, in astrocytes: Possible involvement of phospholipase A2. Reprod. Nutr. Dev. 2005, 45, 633–646. [Google Scholar] [CrossRef]
- Chistyakov, D.V.; Azbukina, N.V.; Astakhova, A.A.; Goriainov, S.V.; Chistyakov, V.V.; Sergeeva, M.G. Sex-mediated differences in lps induced alterations of TNFα, IL-10 expression, and prostaglandin synthesis in primary astrocytes. Int. J. Mol. Sci. 2018, 19, 2793. [Google Scholar] [CrossRef]
- Sokolowska, M.; Chen, L.Y.; Eberlein, M.; Martinez-Anton, A.; Liu, Y.; Alsaaty, S.; Qi, H.Y.; Logun, C.; Horton, M.; Shelhamer, J.H. Low molecular weight hyaluronan activates cytosolic phospholipase A 2α and eicosanoid production in monocytes and macrophages. J. Biol. Chem. 2014, 289, 4470–4488. [Google Scholar] [CrossRef]
- Astakhova, A.A.; Chistyakov, D.V.; Pankevich, E.V.; Sergeeva, M.G. Regulation of cyclooxygenase 2 expression by agonists of PPAR nuclear receptors in the model of endotoxin tolerance in astrocytes. Biochemistry 2015, 80, 1262–1270. [Google Scholar] [CrossRef]
- Gómez-Aristizábal, A.; Kim, K.P.; Viswanathan, S. A systematic study of the effect of different molecular weights of hyaluronic acid on mesenchymal stromal cell-mediated immunomodulation. PLoS ONE 2016, 11, e0147868. [Google Scholar] [CrossRef] [PubMed]
- Rayahin, J.E.; Buhrman, J.S.; Zhang, Y.; Koh, T.J.; Gemeinhart, R.A. High and Low Molecular Weight Hyaluronic Acid Differentially Influence Macrophage Activation. ACS Biomater. Sci. Eng. 2015, 1, 481–493. [Google Scholar] [CrossRef] [PubMed]
- Albano, G.D.; Bonanno, A.; Cavalieri, L.; Ingrassia, E.; Di Sano, C.; Siena, L.; Riccobono, L.; Gagliardo, R.; Profita, M. Effect of High, Medium, and Low Molecular Weight Hyaluronan on Inflammation and Oxidative Stress in an In Vitro Model of Human Nasal Epithelial Cells. Mediators Inflamm. 2016, 2016, 1–13. [Google Scholar] [CrossRef] [PubMed]
- Campo, G.M.; Avenoso, A.; Campo, S.; D’Ascola, A.; Nastasi, G.; Calatroni, A. Molecular size hyaluronan differently modulates toll-like receptor-4 in LPS-induced inflammation in mouse chondrocytes. Biochimie 2010, 92, 204–215. [Google Scholar] [CrossRef] [PubMed]
- Sloane, J.A.; Batt, C.; Ma, Y.; Harris, Z.M.; Trapp, B.; Vartanian, T. Hyaluronan blocks oligodendrocyte progenitor maturation and remyelination through TLR2. Proc. Natl. Acad. Sci. USA 2010, 107, 11555–11560. [Google Scholar] [CrossRef] [PubMed]
- Lawrence, T. The nuclear factor NF-kappaB pathway in inflammation. Cold Spring Harb. Perspect. Biol. 2009, 1, a001651. [Google Scholar] [CrossRef] [PubMed]
- Kim, M.Y.; Muto, J.; Gallo, R.L. Hyaluronic Acid Oligosaccharides Suppress TLR3-Dependent Cytokine Expression in a TLR4-Dependent Manner. PLoS ONE 2013, 8, e72421. [Google Scholar] [CrossRef]
- Yasuda, T. Hyaluronan inhibits prostaglandin E2 production via CD44 in U937 human macrophages. Tohoku J. Exp. Med. 2010, 220, 229–235. [Google Scholar] [CrossRef]
- Chovatiya, R.; Medzhitov, R. Stress, inflammation, and defense of homeostasis. Mol. Cell 2014, 54, 281–288. [Google Scholar] [CrossRef]
- Sofroniew, M.V.; Vinters, H.V. Astrocytes: Biology and pathology. Acta Neuropathol. 2010, 119, 7–35. [Google Scholar] [CrossRef]
- Chistyakov, D.V.; Aleshin, S.; Sergeeva, M.G.; Reiser, G. Regulation of peroxisome proliferator-activated receptor β/δ expression and activity levels by toll-like receptor agonists and MAP kinase inhibitors in rat astrocytes. J. Neurochem. 2014, 130, 563–574. [Google Scholar] [CrossRef] [PubMed]


© 2019 by the authors. Licensee MDPI, Basel, Switzerland. This article is an open access article distributed under the terms and conditions of the Creative Commons Attribution (CC BY) license (http://creativecommons.org/licenses/by/4.0/).
Share and Cite
Chistyakov, D.V.; Astakhova, A.A.; Azbukina, N.V.; Goriainov, S.V.; Chistyakov, V.V.; Sergeeva, M.G. High and Low Molecular Weight Hyaluronic Acid Differentially Influences Oxylipins Synthesis in Course of Neuroinflammation. Int. J. Mol. Sci. 2019, 20, 3894. https://doi.org/10.3390/ijms20163894
Chistyakov DV, Astakhova AA, Azbukina NV, Goriainov SV, Chistyakov VV, Sergeeva MG. High and Low Molecular Weight Hyaluronic Acid Differentially Influences Oxylipins Synthesis in Course of Neuroinflammation. International Journal of Molecular Sciences. 2019; 20(16):3894. https://doi.org/10.3390/ijms20163894
Chicago/Turabian StyleChistyakov, Dmitry V., Alina A. Astakhova, Nadezda V. Azbukina, Sergei V. Goriainov, Viktor V. Chistyakov, and Marina G. Sergeeva. 2019. "High and Low Molecular Weight Hyaluronic Acid Differentially Influences Oxylipins Synthesis in Course of Neuroinflammation" International Journal of Molecular Sciences 20, no. 16: 3894. https://doi.org/10.3390/ijms20163894
APA StyleChistyakov, D. V., Astakhova, A. A., Azbukina, N. V., Goriainov, S. V., Chistyakov, V. V., & Sergeeva, M. G. (2019). High and Low Molecular Weight Hyaluronic Acid Differentially Influences Oxylipins Synthesis in Course of Neuroinflammation. International Journal of Molecular Sciences, 20(16), 3894. https://doi.org/10.3390/ijms20163894