GPathFinder: Identification of Ligand-Binding Pathways by a Multi-Objective Genetic Algorithm

 , , and
Abstract

1. Introduction
2. Results on Illustrative Cases and Discussion
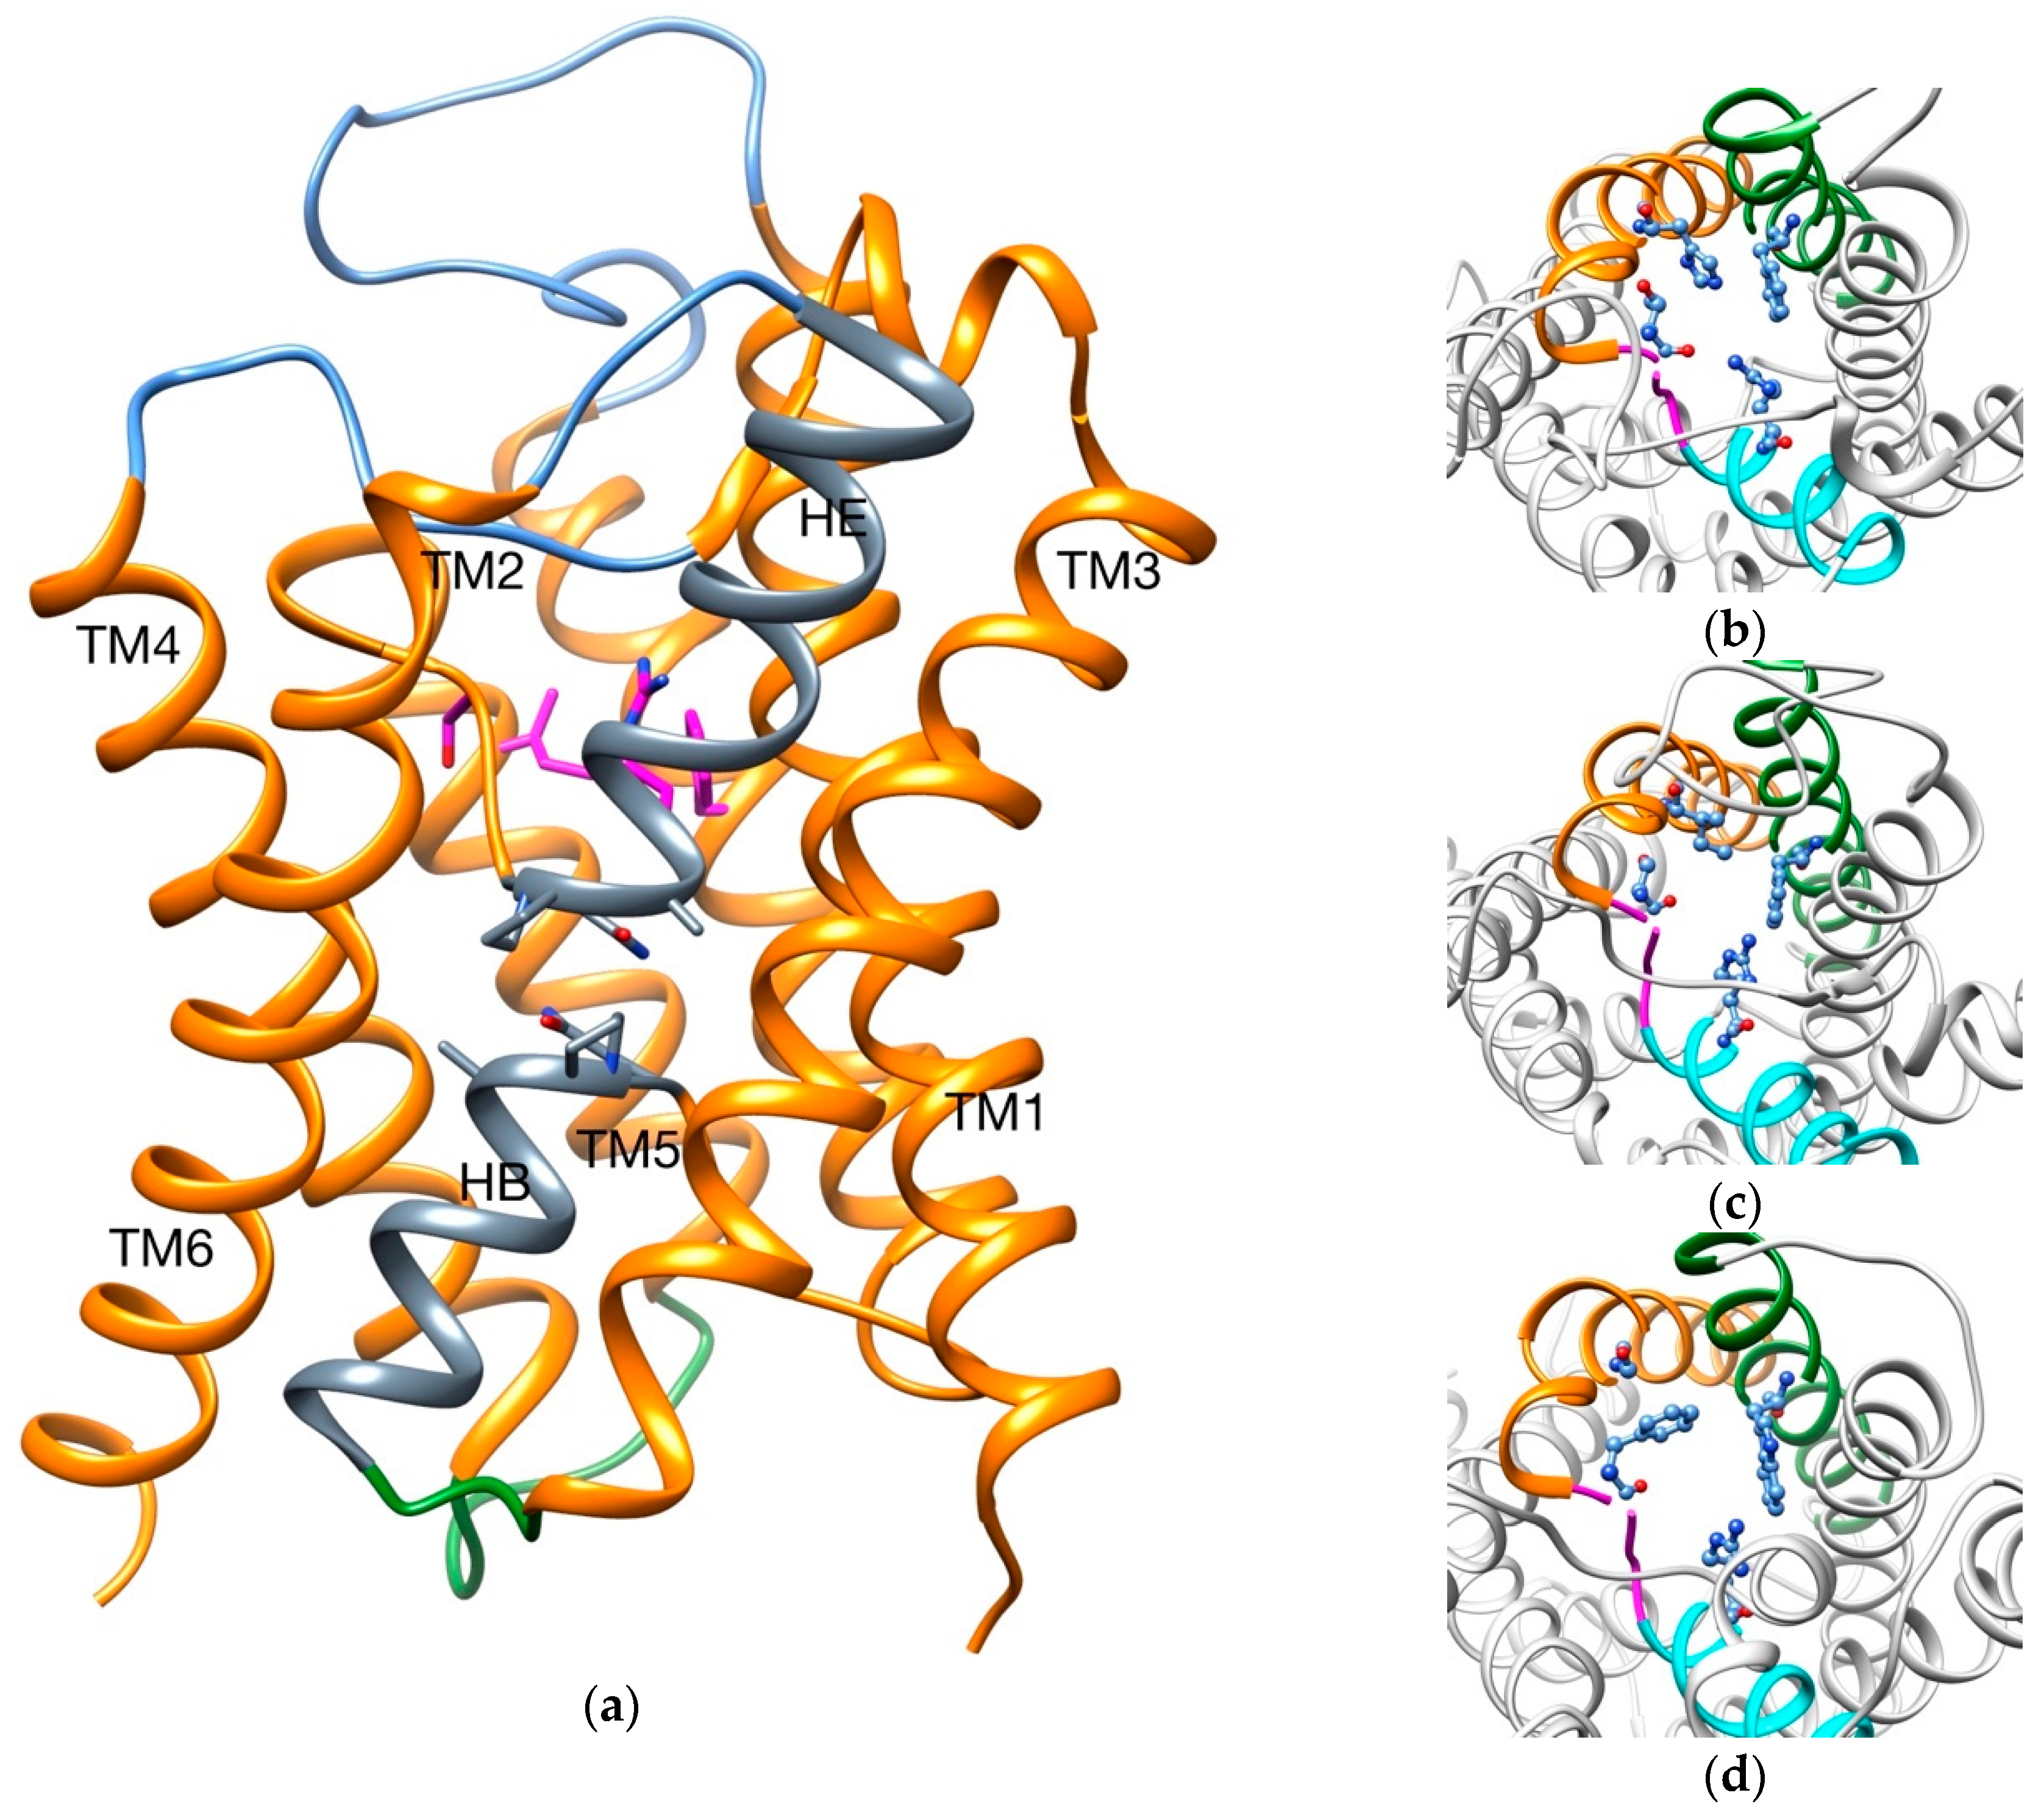
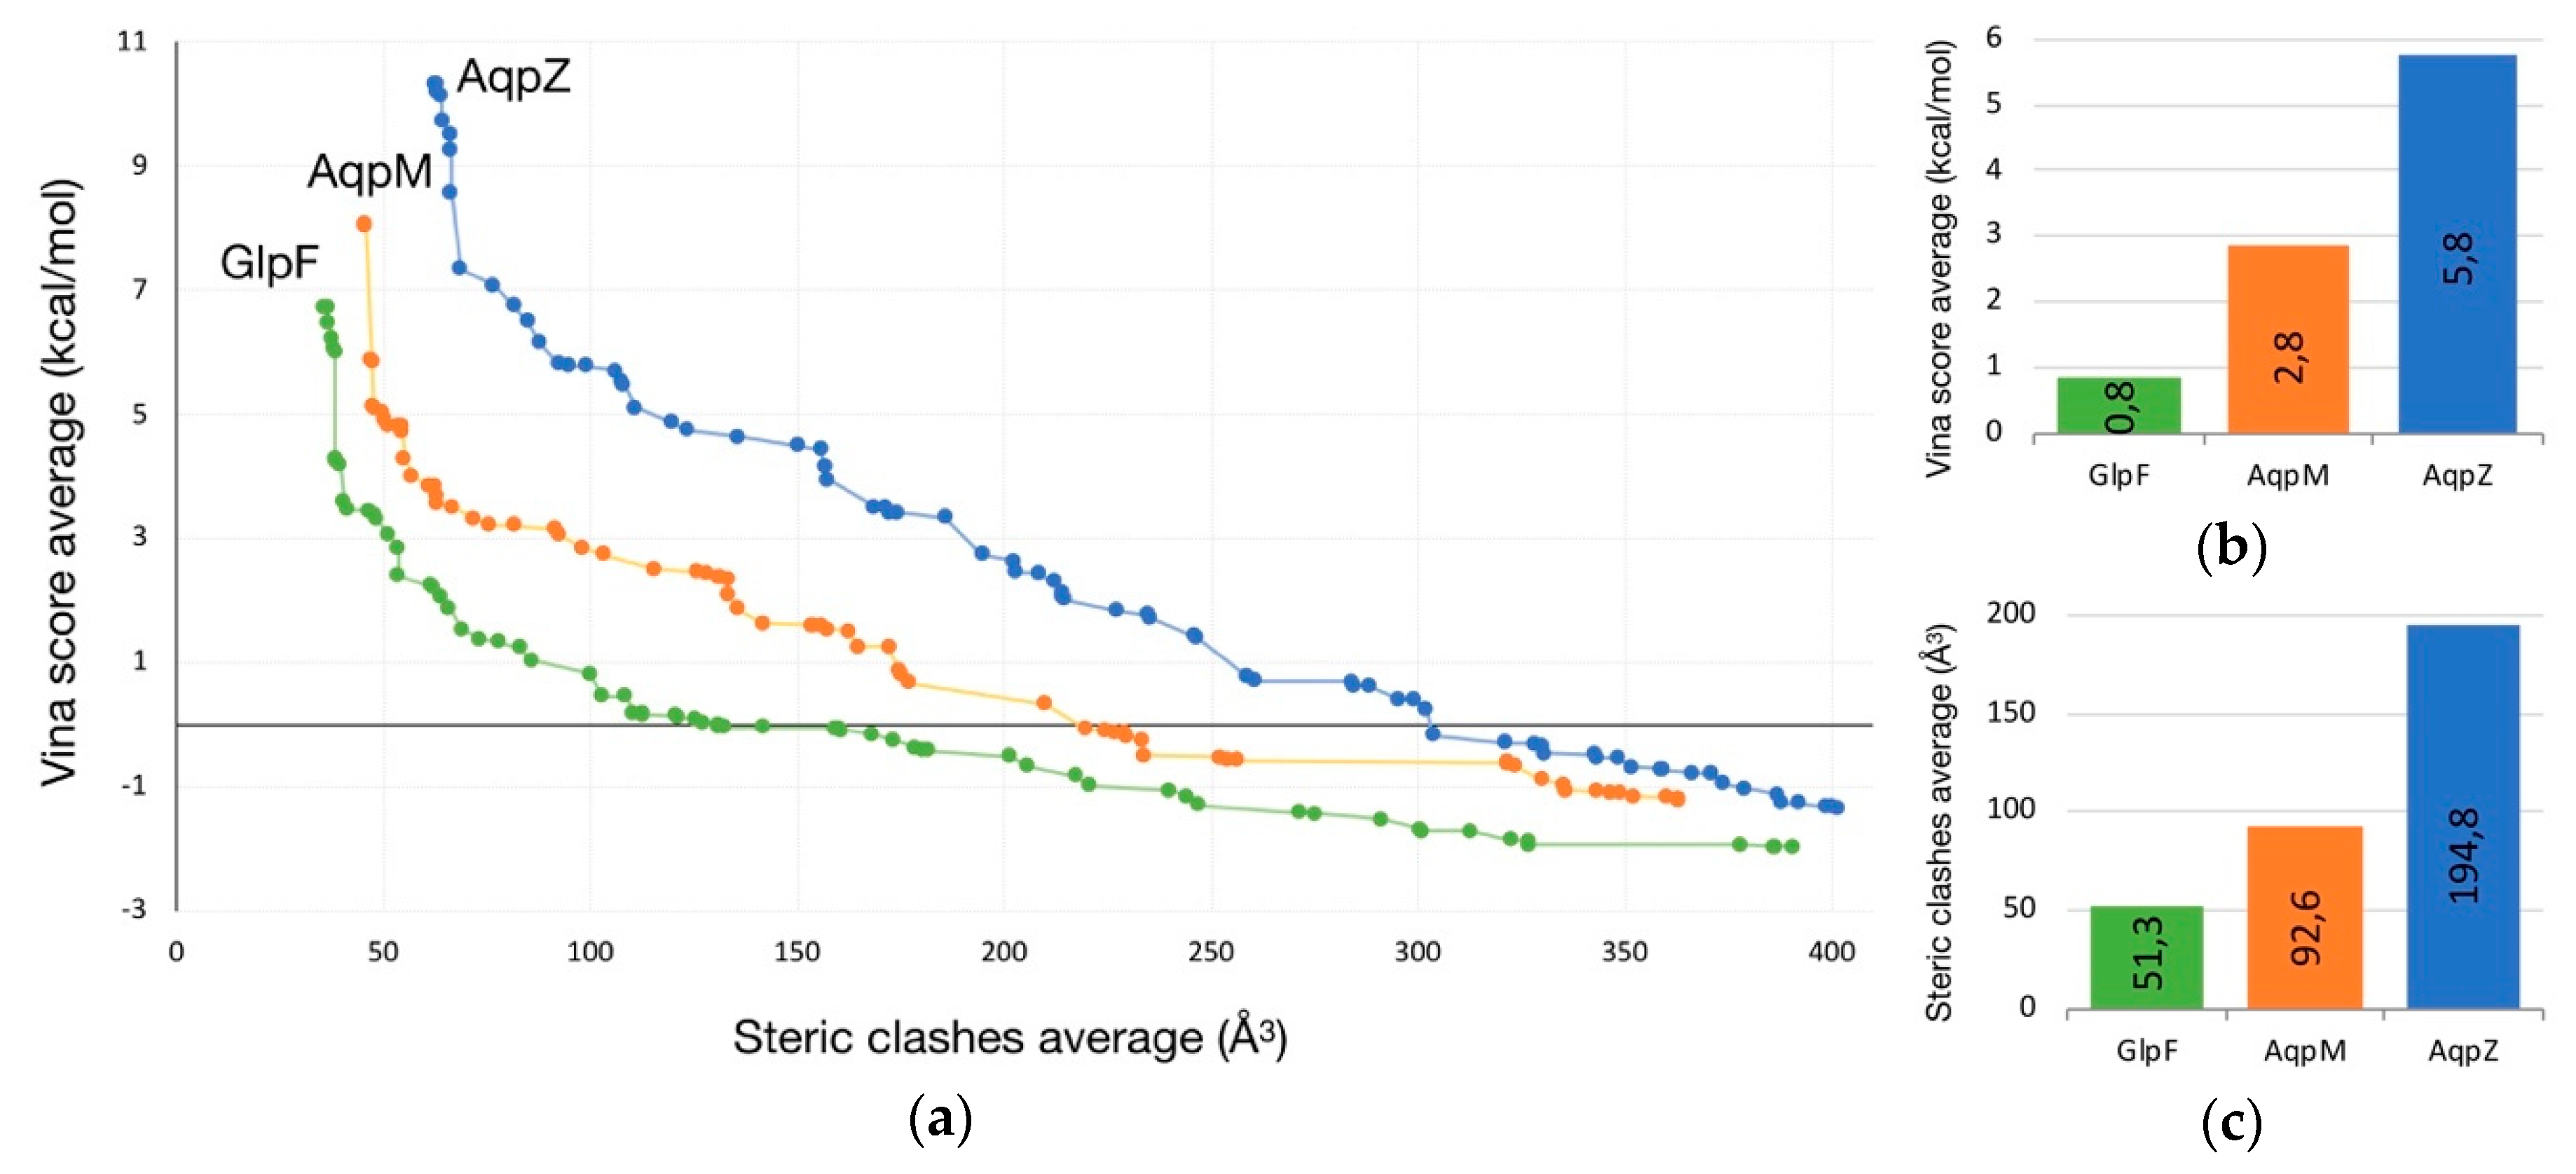
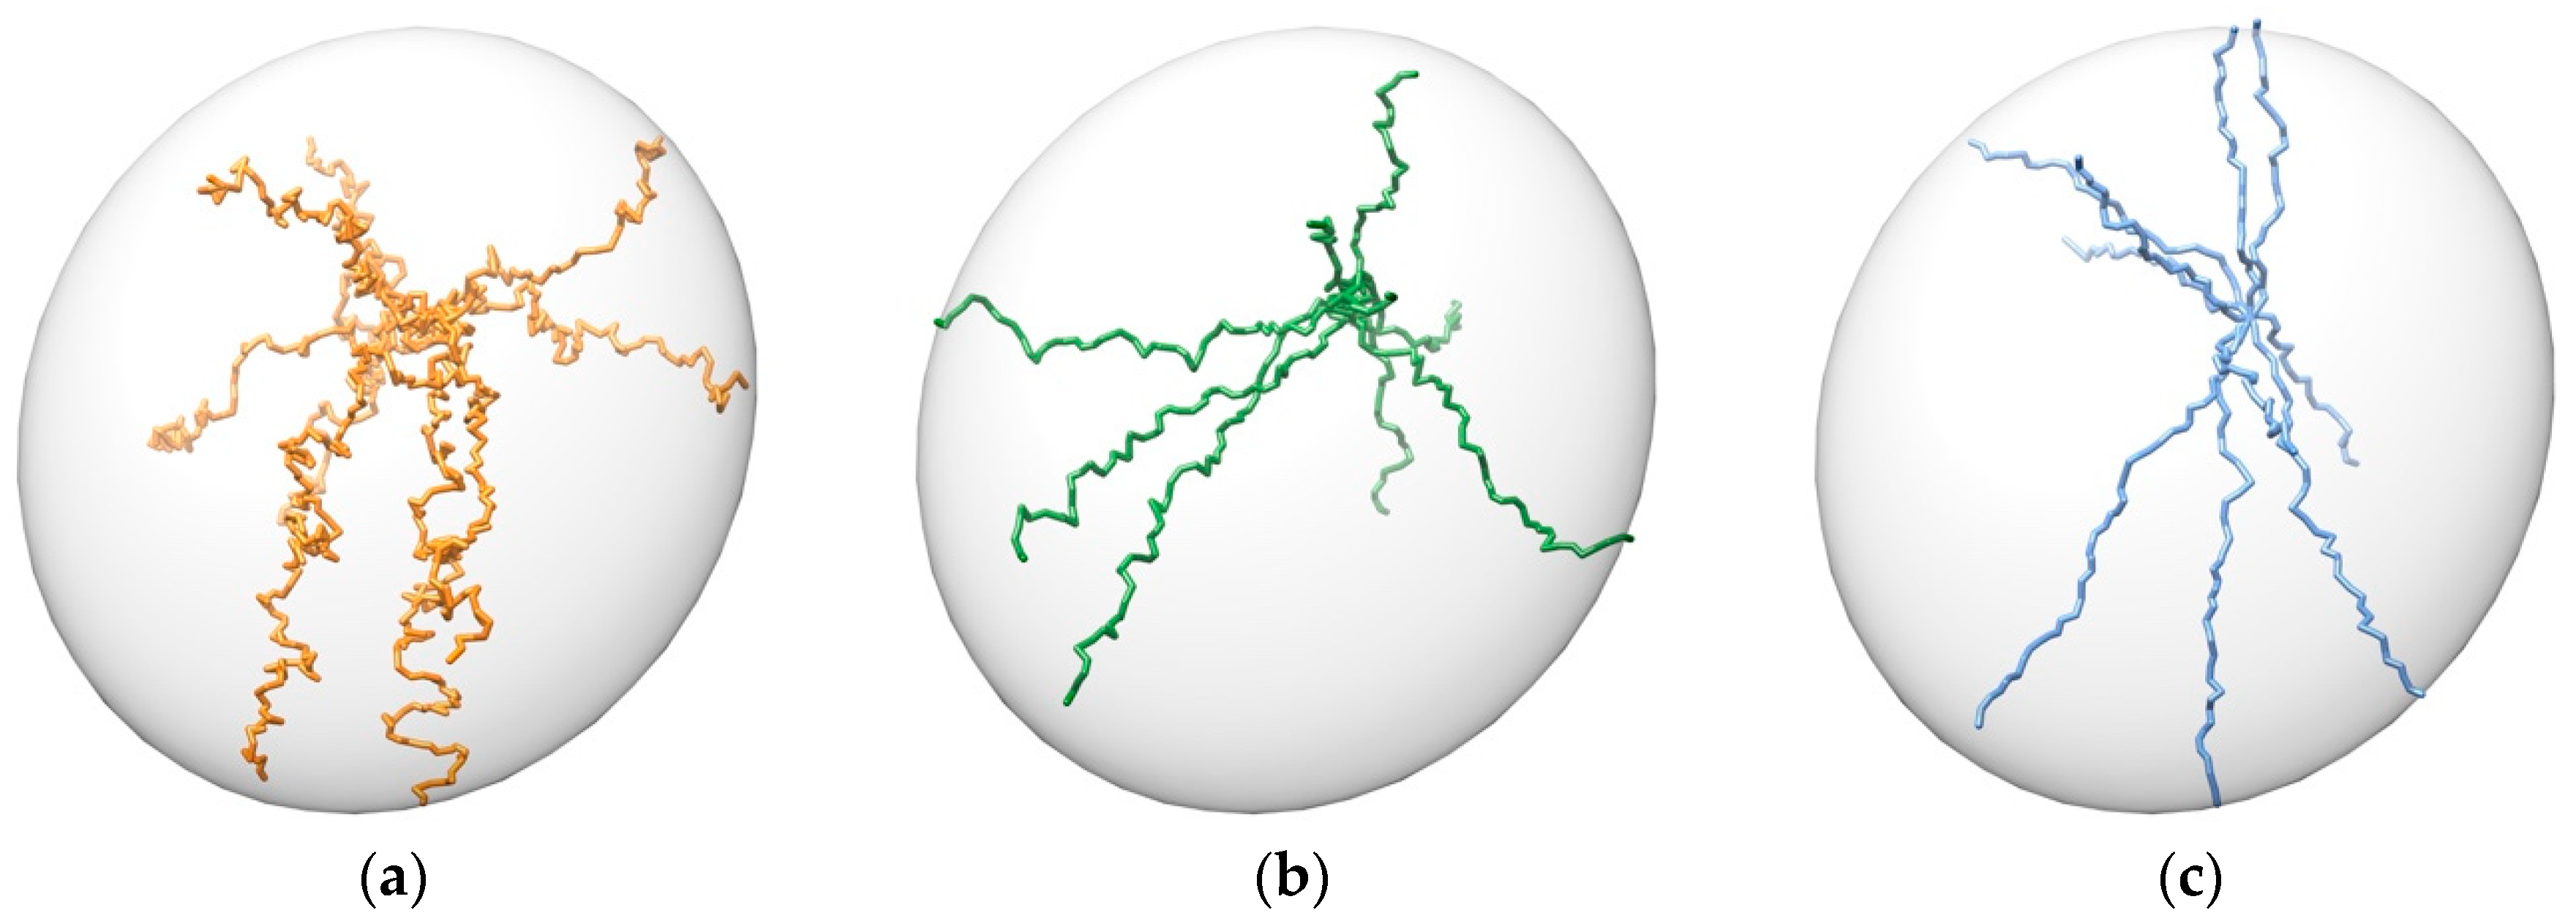
2.1. Transport of Glycerol Across Aquaporin
- Intermolecular interactions at the SF region (together with its geometric configuration) have a clear influence on the permeability/non-permeability to glycerol of GlpF/AqpZ.
- A significative difference is observed in the intermolecular interactions at the SF region of GlpF and AqpM, which can be relevant to explain their different glycerol diffusion rates.
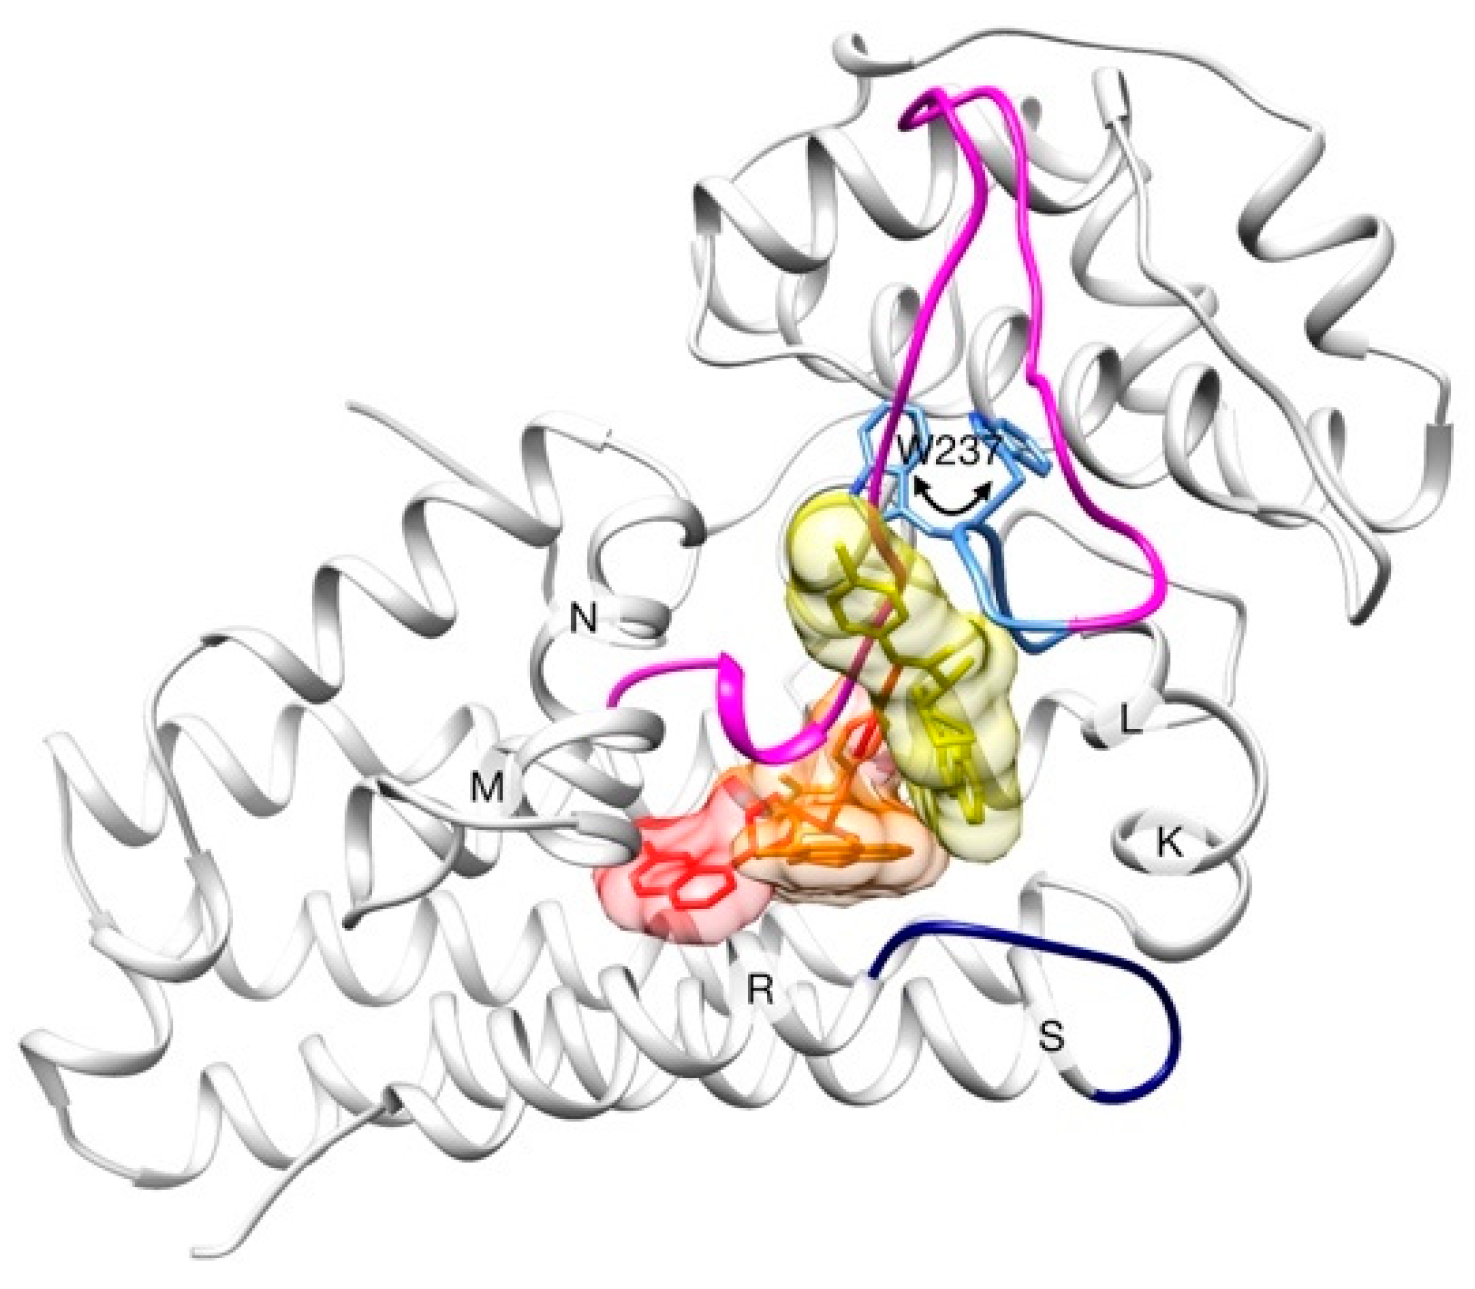
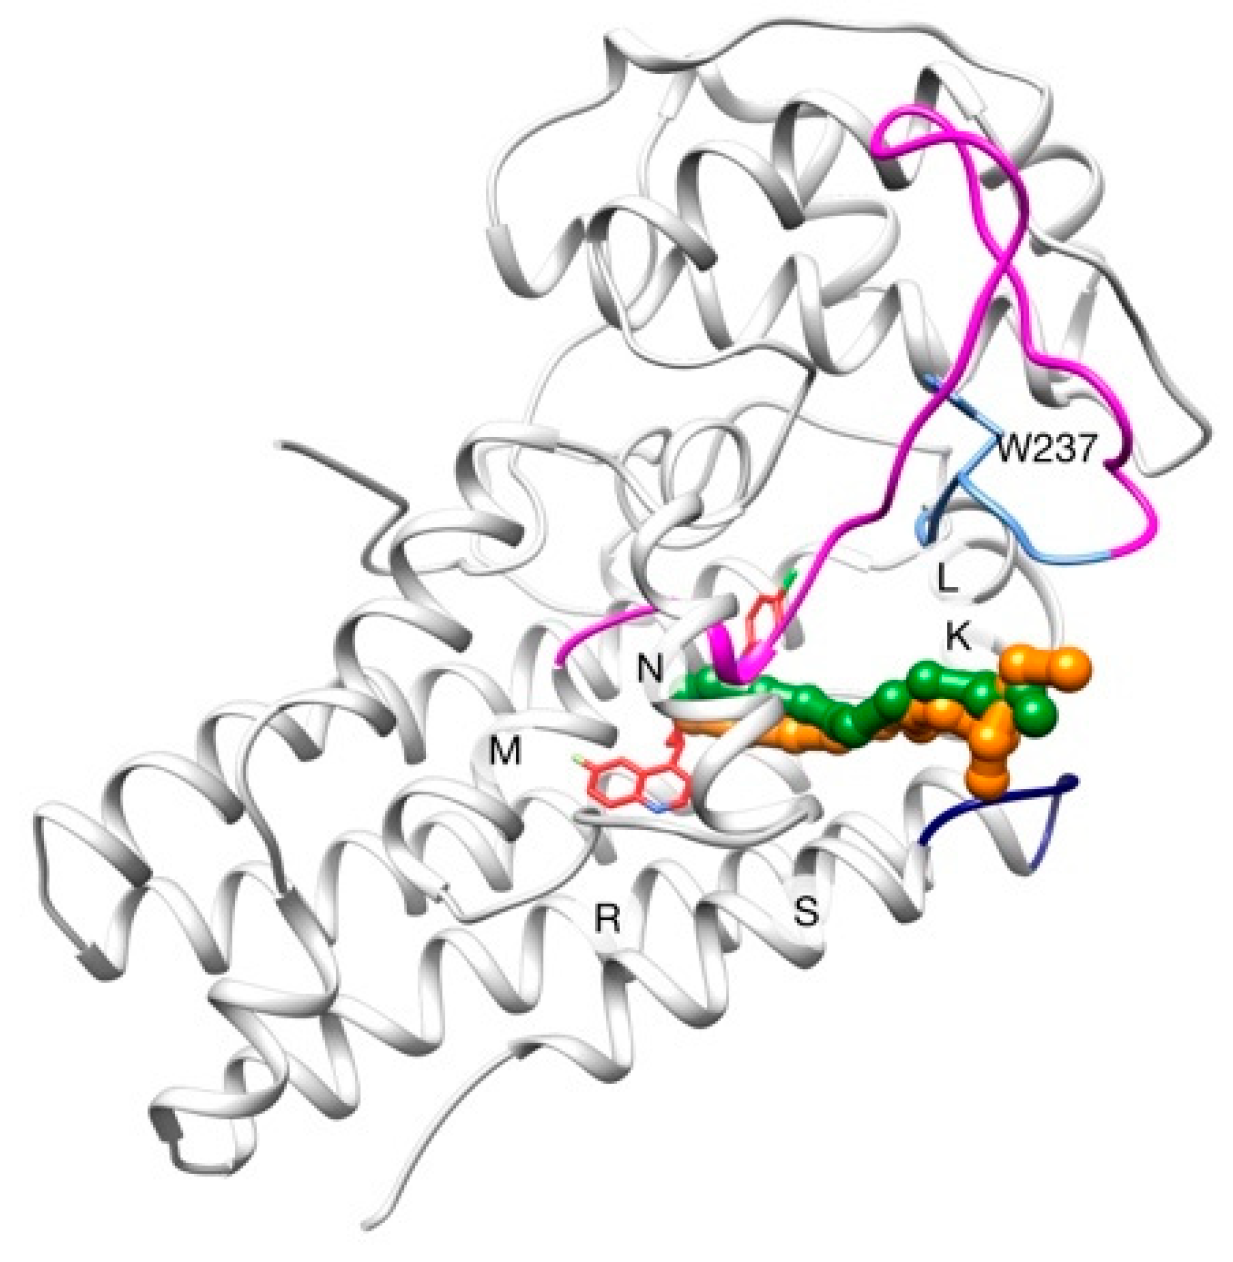
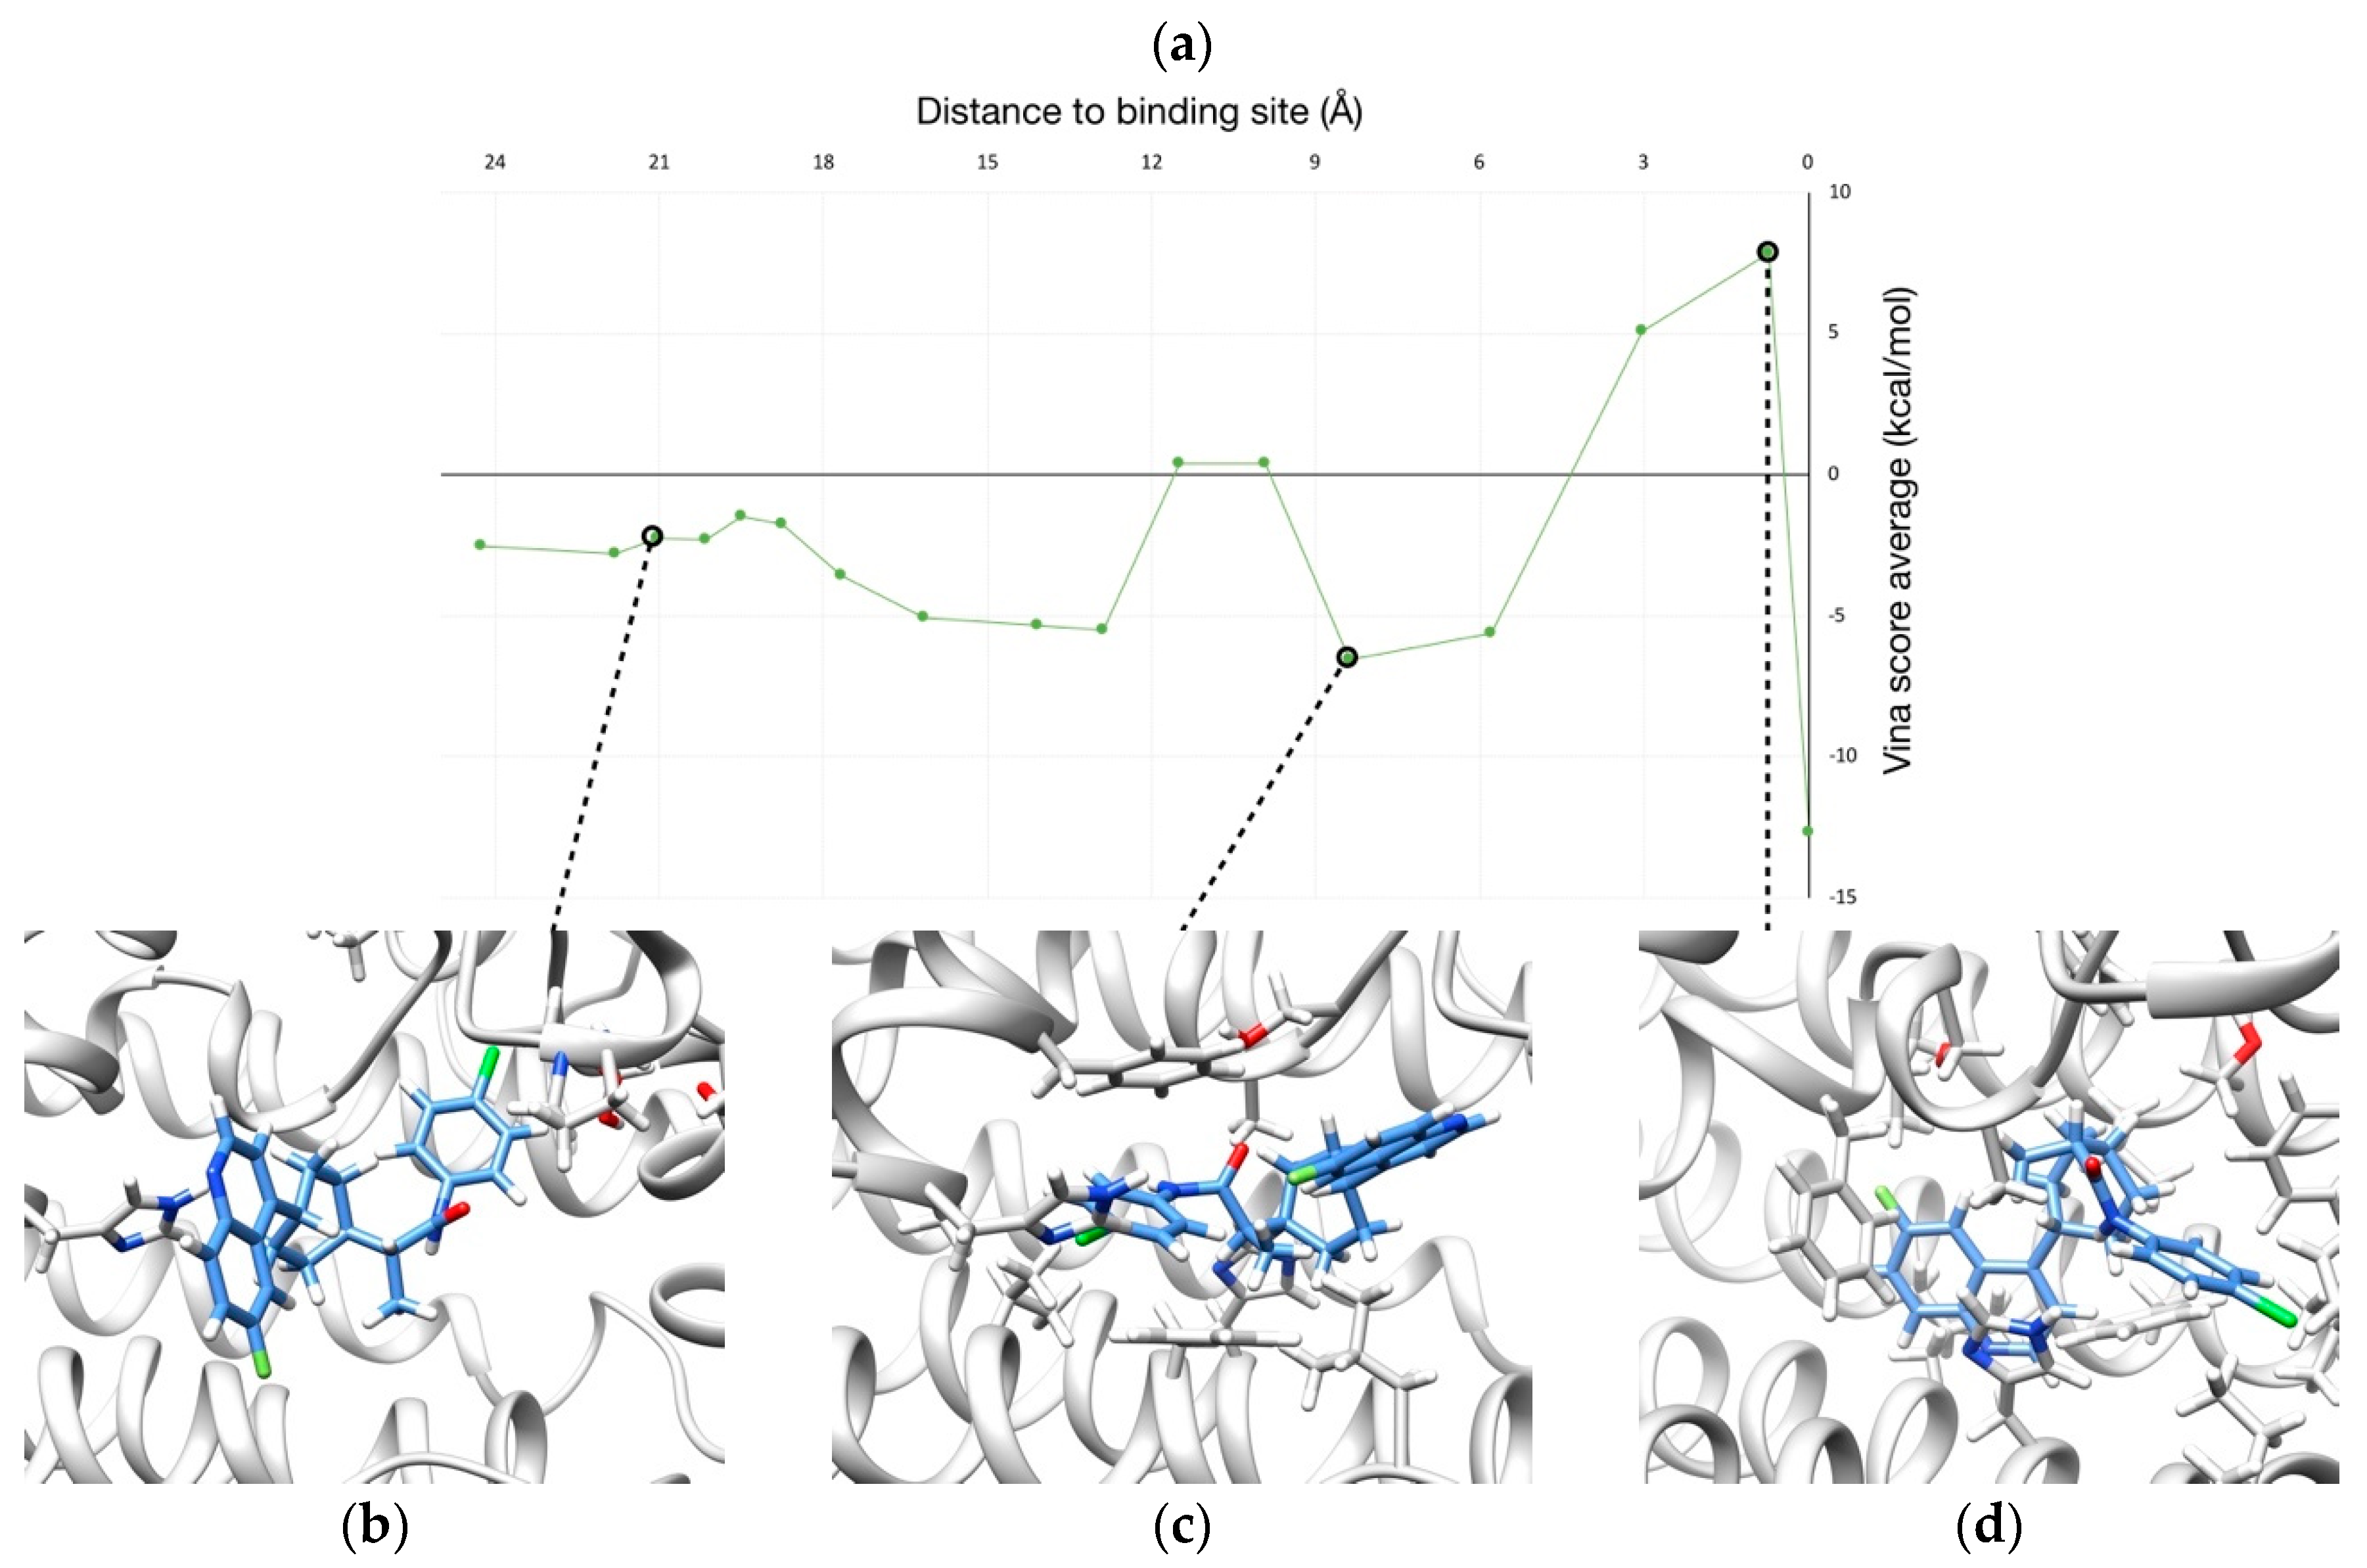
2.2. Unbinding of a Suicide Inhibitor from hIDO1
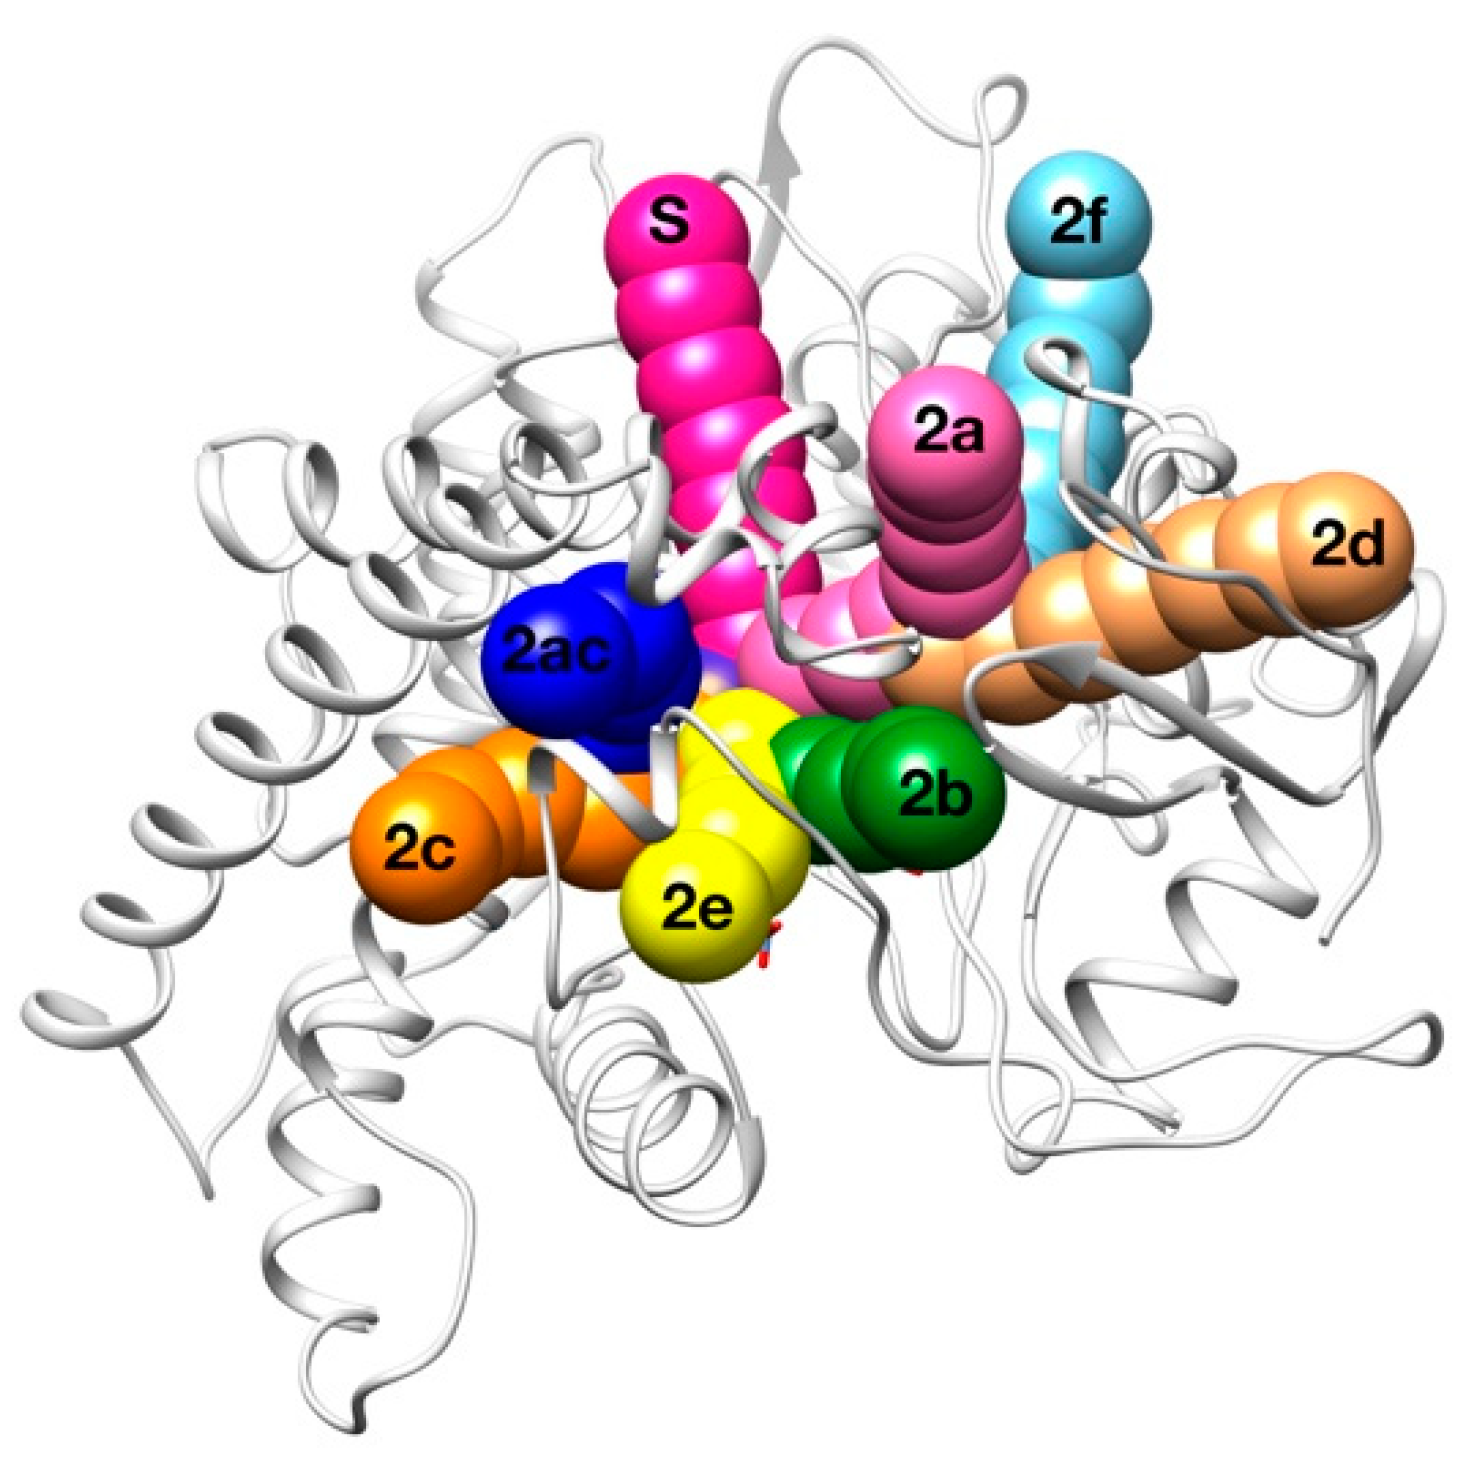
2.3. Human Cytochrome P450 2C19
3. Materials and Methods
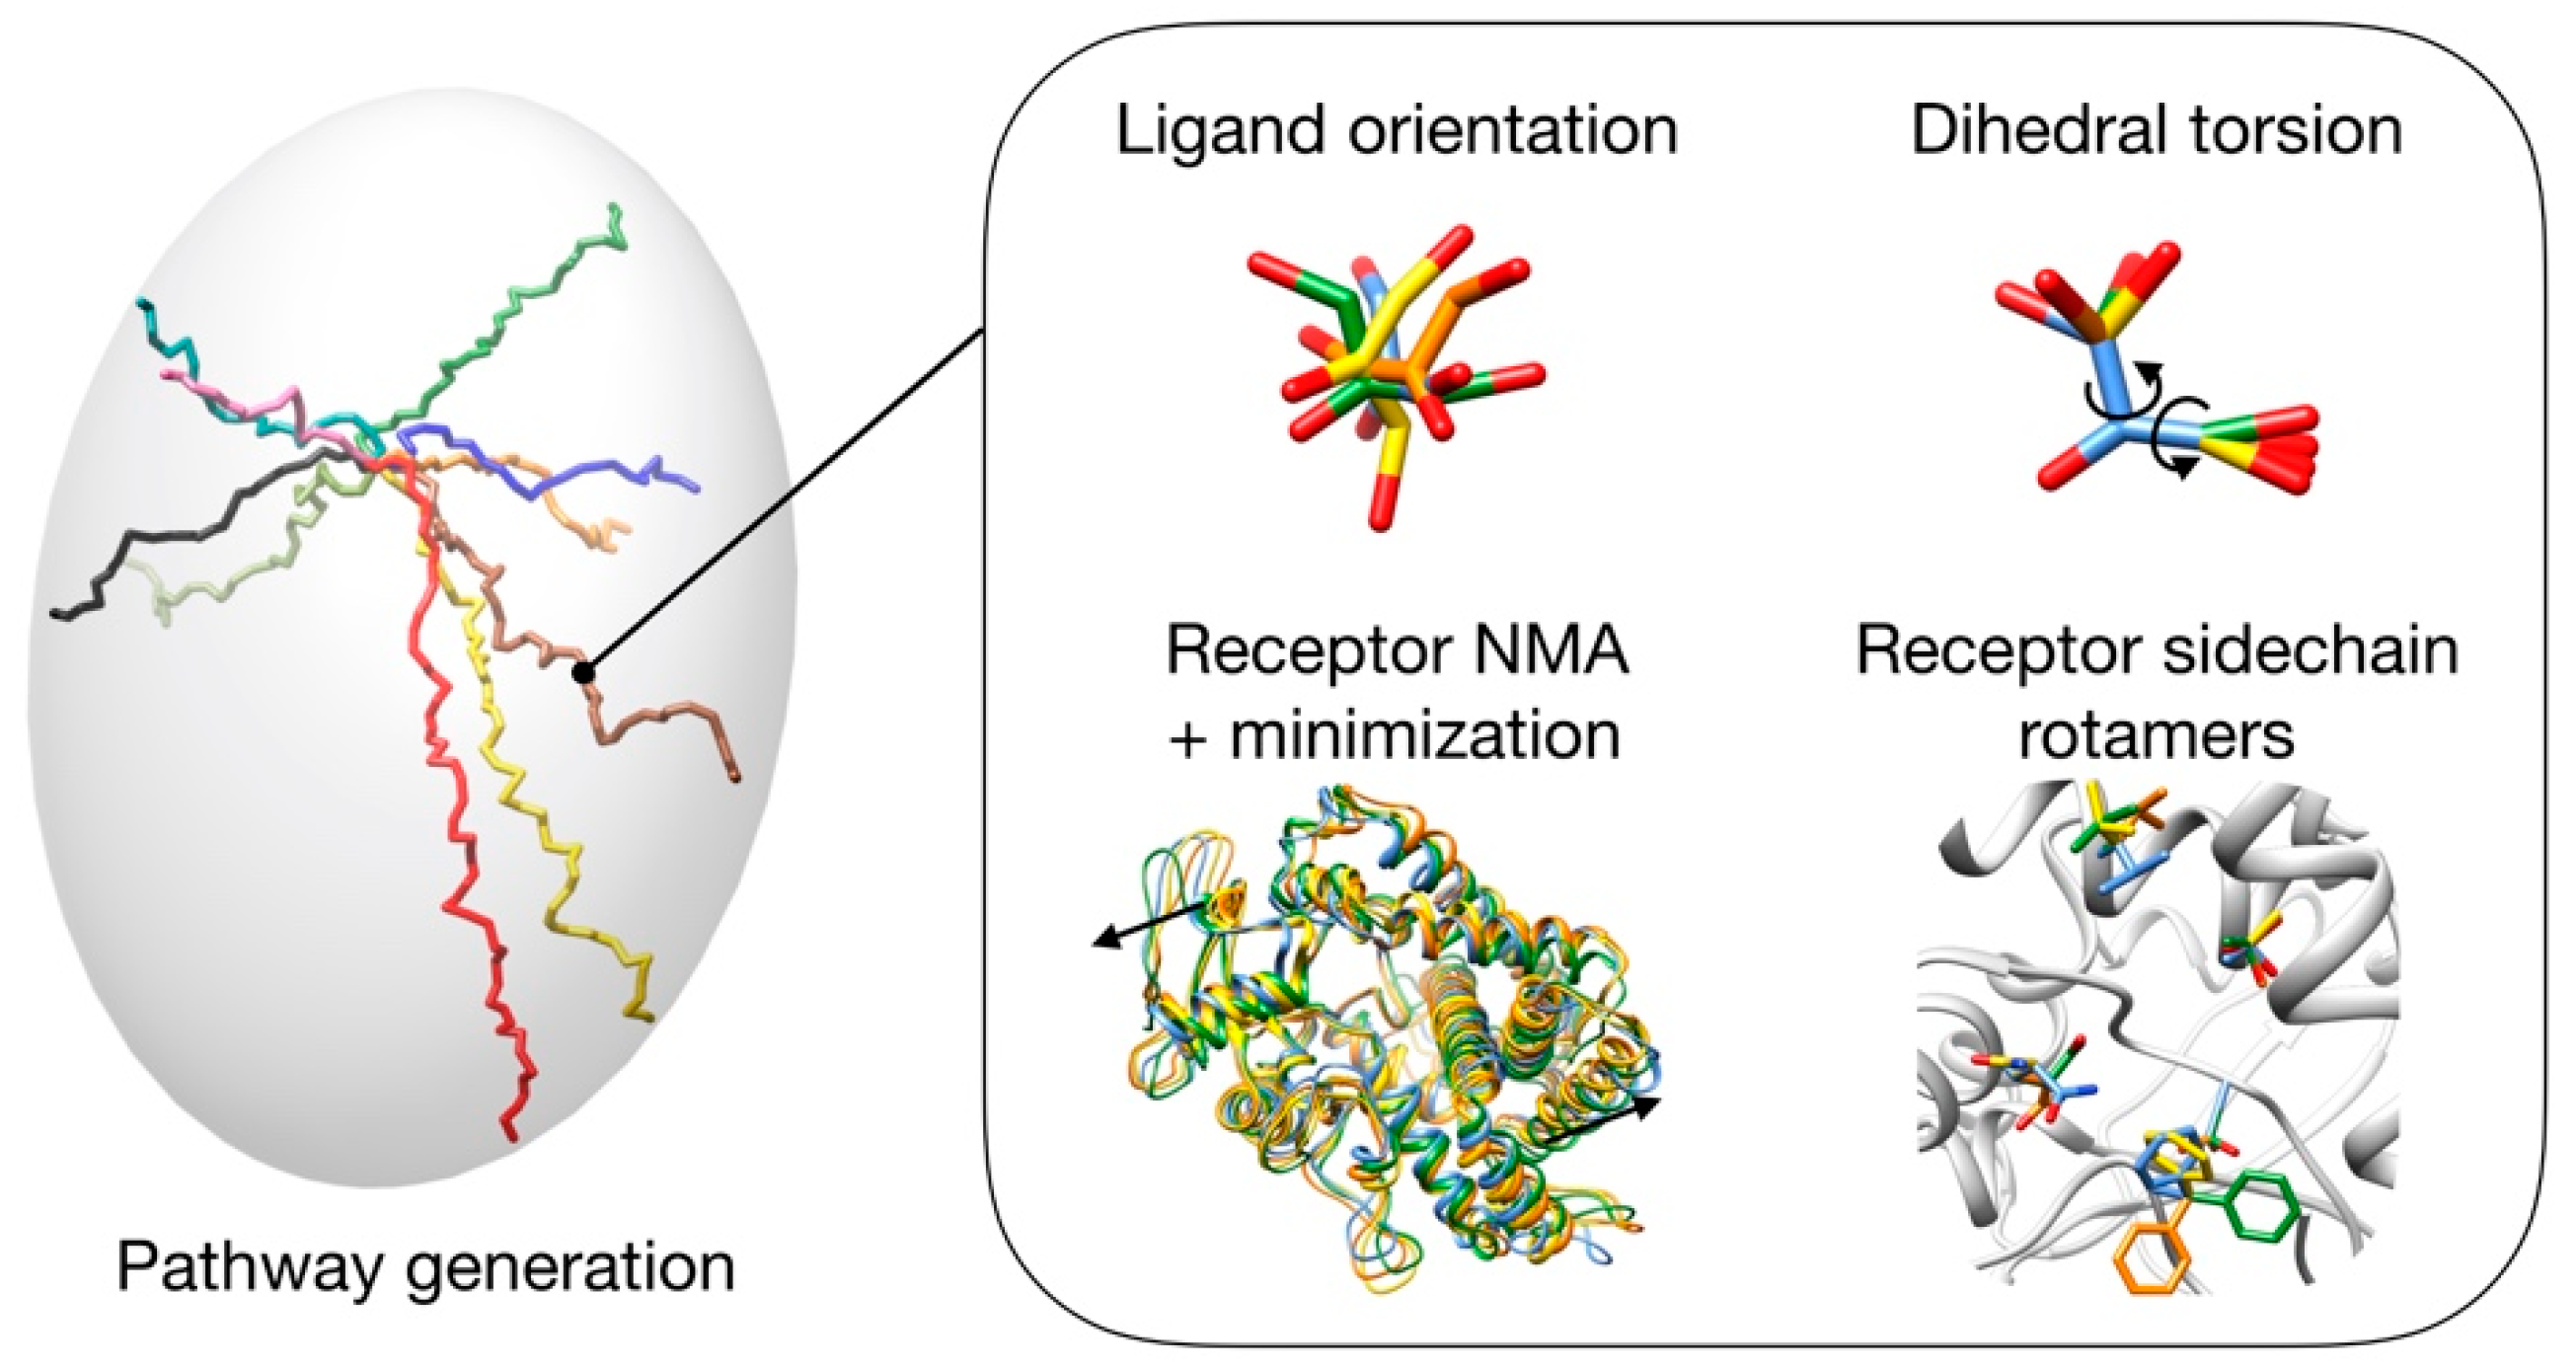
3.1. Pathway Generation
- Unbinding trajectories knowing the initial point (i.e., binding pose).
- Binding trajectories starting from the six ends of the inertia axes of the protein and finishing in a known active site.
- Possible pathways between previously stablished initial and final points.
3.2. Pathway Evaluation
3.3. Pathway Refinement
3.4. Set up of the GA Parameters
3.5. Benchmark
- If necessary, select one of the chains.
- Remove waters and other non-proteic molecules.
- Remove alternative for side chains rotamers.
- Add hydrogen atoms with UCSF Chimera “addh” command (necessary for Vina scoring).
- Separate into two .mol2 files the ligand and the receptor molecules.
3.6. Usability, Availability, and Computational Cost
4. Conclusions
Supplementary Materials
Author Contributions
Funding
Acknowledgments
Conflicts of Interest
Abbreviations
| 0XV | (4-hydroxy-3,5-dimethylphenyl)(2-methyl-1-benzofuran-3-yl)methanone |
| AQP | Aquaporin |
| AqpM | Archaeal Aquaporin |
| AqpZ | Aquaporin Z |
| BMS | BMS-986205 inhibitor |
| CO | Carbon Monoxide |
| COHb | Carboxyhemoglobin |
| CYP | Cytochrome P450 |
| GA | Genetic Algorithm |
| GlpF | Aquaglyceroporin |
| Hb | Hemoglobin |
| hIDO1 | Human indoleamine 2,3-dioxygenase 1 |
| MD | Molecular Dynamics |
| NMA | Normal Mode Analysis |
| PDB | Protein Data Bank |
| RMSD | Root-Mean-Square Deviation |
| RRT | Rapidly exploring Random Tree |
| SF | Selective Filter |
| TM | Transmembrane Domain |
References
- Du, X.; Li, Y.; Xia, Y.L.; Ai, S.M.; Liang, J.; Sang, P.; Ji, X.L.; Liu, S.Q. Insights into protein–ligand interactions: Mechanisms, models, and methods. Int. J. Mol. Sci. 2016, 17, 144. [Google Scholar] [CrossRef] [PubMed]
- Huang, S.Y.; Zou, X. Advances and challenges in Protein-ligand docking. Int. J. Mol. Sci. 2010, 11, 3016–3034. [Google Scholar] [CrossRef] [PubMed]
- Warren, G.L.; Andrews, C.W.; Capelli, A.M.; Clarke, B.; LaLonde, J.; Lambert, M.H.; Lindvall, M.; Nevins, N.; Semus, S.F.; Senger, S.; et al. A critical assessment of docking programs and scoring functions. J. Med. Chem. 2006, 49, 5912–5931. [Google Scholar] [CrossRef] [PubMed]
- Luke, B.T. An Overview of Genetic Methods. In Genetic Algorithms in Molecular Modeling; Devillers, J., Ed.; Principles of QSAR and Drug Design; Academic Press: London, 1996; pp. 35–616. ISBN 978-0-12-213810-2. [Google Scholar]
- Frenkel, D.; Smit, B. Monte Carlo Simulations. In Understanding Molecular Simulation, 2nd ed.; Frenkel, D., Smit, B., Eds.; Academic Press: San Diego, CA, USA, 2002; pp. 23–61. [Google Scholar]
- Hollingsworth, S.A.; Dror, R.O. Molecular Dynamics Simulation for All. Neuron 2018, 99, 1129–1143. [Google Scholar] [CrossRef] [PubMed]
- De Vivo, M.; Masetti, M.; Bottegoni, G.; Cavalli, A. Role of Molecular Dynamics and Related Methods in Drug Discovery. J. Med. Chem. 2016, 59, 4035–4061. [Google Scholar] [CrossRef] [PubMed]
- Wang, G.; Zhu, W. Molecular docking for drug discovery and development: A widely used approach but far from perfect. Future Med. Chem. 2016, 8, 1707–1710. [Google Scholar] [CrossRef] [PubMed]
- Marques, S.M.; Daniel, L.; Buryska, T.; Prokop, Z.; Brezovsky, J.; Damborsky, J. Enzyme Tunnels and Gates As Relevant Targets in Drug Design. Med. Res. Rev. 2017, 37, 1095–1139. [Google Scholar] [CrossRef]
- Chovancova, E.; Pavelka, A.; Benes, P.; Strnad, O.; Brezovsky, J.; Kozlikova, B.; Gora, A.; Sustr, V.; Klvana, M.; Medek, P.; et al. CAVER 3.0: A Tool for the Analysis of Transport Pathways in Dynamic Protein Structures. PLoS Comput. Biol. 2012, 8, 1–12. [Google Scholar] [CrossRef]
- Masood, T.B.; Sandhya, S.; Chandra, N.; Natarajan, V. CHEXVIS: A tool for molecular channel extraction and visualization. BMC Bioinformatics 2015, 16, 1–19. [Google Scholar] [CrossRef]
- Levitt, D.G.; Banaszak, L.J. POCKET: A Computer Graphics Method for Identifying and Displaying Protein Cavities and Their Surrounding Amino Acids. J. Mol. Graph. 1992, 10, 229–234. [Google Scholar] [CrossRef]
- Tripathi, A.; Kellogg, G.E. A novel and efficient tool for locating and characterizing protein cavities and binding sites. Proteins Struct. Funct. Bioinforma. 2010, 78, 825–842. [Google Scholar] [CrossRef] [PubMed]
- Dundas, J.; Ouyang, Z.; Tseng, J.; Binkowski, A.; Turpaz, Y.; Liang, J. CASTp: Computed atlas of surface topography of proteins with structural and topographical mapping of functionally annotated residues. Nucleic Acids Res. 2006, 34, W116–W118. [Google Scholar] [CrossRef] [PubMed]
- Sehnal, D.; Vařeková, R.S.; Berka, K.; Pravda, L.; Navrátilová, V.; Banáš, P.; Ionescu, C.M.; Otyepka, M.; Koča, J. MOLE 2.0: Advanced approach for analysis of biomacromolecular channels. J. Cheminform. 2013, 5, 1–13. [Google Scholar] [CrossRef] [PubMed]
- Yaffe, E.; Fishelovitch, D.; Wolfson, H.J.; Halperin, D.; Nussinov, R. MolAxis: Efficient and accurate identification of channels in macromolecules. Proteins Struct. Funct. Genet. 2008, 73, 72–86. [Google Scholar] [CrossRef] [PubMed]
- Tiwary, P.; Limongelli, V.; Salvalaglio, M.; Parrinello, M. Kinetics of protein–ligand unbinding: Predicting pathways, rates, and rate-limiting steps. Proc. Natl. Acad. Sci. USA 2015, 112, E386–E391. [Google Scholar] [CrossRef] [PubMed]
- Do, P.C.; Lee, E.H.; Le, L. Steered Molecular Dynamics Simulation in Rational Drug Design. J. Chem. Inf. Model. 2018, 58, 1473–1482. [Google Scholar] [CrossRef] [PubMed]
- Vavra, O.; Filipovic, J.; Plhak, J.; Bednar, D.; Marques, S.; Brezovsky, J.; Pavelka, A.; Matyska, L.; Damborsky, J. CAVERDOCK: A New Tool for Analysis of Ligand Binding and Unbinding Based on Molecular Docking. In Proceedings of the Enzyme Engineering XXIV, Toulouse, France, 24–28 September 2017. [Google Scholar]
- Lee, P.H.; Kuo, K.L.; Chu, P.Y.; Liu, E.M.; Lin, J.H. SLITHER: A web server for generating contiguous conformations of substrate molecules entering into deep active sites of proteins or migrating through channels in membrane transporters. Nucleic Acids Res. 2009, 37, W559–W564. [Google Scholar] [CrossRef] [PubMed]
- Devaurs, D.; Bouard, L.; Vaisset, M.; Zanon, C.; Al-Bluwi, I.; Iehl, R.; Siméon, T.; Cortés, J. MoMA-LigPath: A web server to simulate protein-ligand unbinding. Nucleic Acids Res. 2013, 41, W297–W302. [Google Scholar] [CrossRef]
- Borrelli, K.W.; Vitalis, A.; Alcantara, R.; Guallar, V. PELE: Protein energy landscape exploration. A novel Monte Carlo based technique. J. Chem. Theory Comput. 2005, 1, 1304–1311. [Google Scholar] [CrossRef]
- Carrillo, O.; Orozco, M. GRID-MD-A tool for massive simulation of protein channels. Proteins Struct. Funct. Genet. 2008, 70, 892–899. [Google Scholar] [CrossRef] [PubMed]
- Nguyen, M.K.; Jaillet, L.; Redon, S. ART-RRT: As-Rigid-As-Possible exploration of ligand unbinding pathways. J. Comput. Chem. 2018, 39, 665–678. [Google Scholar] [CrossRef] [PubMed]
- Rodríguez-Guerra Pedregal, J.; Sciortino, G.; Guasp, J.; Municoy, M.; Maréchal, J.-D. GaudiMM: A modular multi-objective platform for molecular modeling. J. Comput. Chem. 2017, 38, 2118–2126. [Google Scholar] [CrossRef] [PubMed]
- Agre, P.; Kozono, D. Aquaporin water channels: Molecular mechanisms for human diseases. FEBS Lett. 2003, 555, 72–78. [Google Scholar] [CrossRef]
- Agre, P.; Preston, G.M.; Smith, B.L.; Jung, J.S.; Raina, S.; Moon, C.; Guggino, W.B.; Nielsen, S. Aquaporin CHIP: The archetypal molecular water channel. Am. J. Physiol. Physiol. 1993, 265, F463–F476. [Google Scholar] [CrossRef] [PubMed]
- Froger, A.; Tallur, B.; Thomas, D.; Delamarche, C. Prediction of functional residues in water channels and related proteins. Protein Sci. 1998, 7, 1458–1468. [Google Scholar] [CrossRef] [PubMed]
- Kozono, D.; Ding, X.; Iwasaki, I.; Meng, X.; Kamagata, Y.; Agre, P.; Kitagawa, Y. Functional expression and characterization of an archaeal aquaporin. AqpM from Methanothermobacter marburgensis. J. Biol. Chem. 2003, 278, 10649–10656. [Google Scholar] [CrossRef]
- Finn, R.N.; Cerdá, J. Evolution and functional diversity of aquaporins. Biol. Bull. 2015, 229, 6–23. [Google Scholar] [CrossRef]
- Li, H.; Chen, H.; Steinbronn, C.; Wu, B.; Beitz, E.; Zeuthen, T.; Voth, G.A. Enhancement of proton conductance by mutations of the selectivity filter of aquaporin-1. J. Mol. Biol. 2011, 407, 607–620. [Google Scholar] [CrossRef]
- Stroud, R.M.; Savage, D.; Miercke, L.J.W.; Lee, J.K.; Khademi, S.; Harries, W. Selectivity and conductance among the glycerol and water conducting aquaporin family of channels. FEBS Lett. 2003, 555, 79–84. [Google Scholar] [CrossRef]
- Lee, J.K.; Kozono, D.; Remis, J.; Kitagawa, Y.; Agre, P.; Stroud, R.M. Structural basis for conductance by the archaeal aquaporin AqpM at 1.68 Å. Proc. Natl. Acad. Sci. USA 2005, 102, 18932–18937. [Google Scholar] [CrossRef] [PubMed]
- Savage, D.F.; Egea, P.F.; Robles-Colmenares, Y.; O’connell Iii, J.D.; Stroud, R.M. Architecture and Selectivity in Aquaporins: 2.5 Å X-Ray Structure of Aquaporin Z. PLoS Biol. 2003, 1, e72. [Google Scholar] [CrossRef] [PubMed]
- Fu, D.; Libson, A.; Miercke, L.J.W.; Weitzman, C.; Nollert, P.; Krucinski, J.; Stroud, R.M. Structure of a glycerol-conducting channel and the basis for its selectivity. Science 2000, 290, 481–486. [Google Scholar] [CrossRef] [PubMed]
- Tajkhorshid, E.; Nollert, P.; Jensen, M.; Miercke, L.J.W.; O’Connell, J.; Stroud, R.M.; Schulten, K. Control of the selectivity of the aquaporin water channel family by global orientational tuning. Science 2002, 296, 525–530. [Google Scholar] [CrossRef] [PubMed]
- Wragg, D.; de Almeida, A.; Casini, A.; Leoni, S. Unveiling the mechanisms of aquaglyceroporin-3 water and glycerol permeation by metadynamics. Chem. Eur. J. 2019. [Google Scholar] [CrossRef] [PubMed]
- Uyttenhove, C.; Pilotte, L.; Théate, I.; Stroobant, V.; Colau, D.; Parmentier, N.; Boon, T.; Van den Eynde, B.J. Evidence for a tumoral immune resistance mechanism based on tryptophan degradation by indoleamine 2,3-dioxygenase. Nat. Med. 2003, 9, 1269–1274. [Google Scholar] [CrossRef] [PubMed]
- Friberg, M.; Jennings, R.; Alsarraj, M.; Dessureault, S.; Cantor, A.; Extermann, M.; Mellor, A.L.; Munn, D.H.; Antonia, S.J. Indoleamine 2,3-dioxygenase contributes to tumor cell evasion of T cell-mediated rejection. Int. J. Cancer 2002, 101, 151–155. [Google Scholar] [CrossRef]
- Nelp, M.T.; Kates, P.A.; Hunt, J.T.; Newitt, J.A.; Balog, A.; Maley, D.; Zhu, X.; Abell, L.; Allentoff, A.; Borzilleri, R.; et al. Immune-modulating enzyme indoleamine 2,3-dioxygenase is effectively inhibited by targeting its apo-form. Proc. Natl. Acad. Sci. USA 2018, 115, 3249–3254. [Google Scholar] [CrossRef]
- Sugimoto, H.; Oda, S.-i.; Otsuki, T.; Hino, T.; Yoshida, T.; Shiro, Y. Crystal structure of human indoleamine 2,3-dioxygenase: Catalytic mechanism of O2 incorporation by a heme-containing dioxygenase. Proc. Natl. Acad. Sci. USA 2006, 103, 2611–2616. [Google Scholar] [CrossRef]
- Pham, K.N.; Yeh, S.-R. Mapping the Binding Trajectory of a Suicide Inhibitor in Human Indoleamine 2,3-Dioxygenase 1. J. Am. Chem. Soc. 2018, 140, 14538–14541. [Google Scholar] [CrossRef]
- Furge, L.L.; Guengerich, F.P. Cytochrome P450 enzymes in drug metabolism and chemical toxicology: An introduction. Biochem. Mol. Biol. Educ. 2006, 34, 66–74. [Google Scholar] [CrossRef] [PubMed]
- De Montellano, P.R.O. Cytochrome P450: Structure, Mechanism, and Biochemistry, 4th ed.; Springer: San Francisco, CA, USA, 2015; ISBN 9783319121086. [Google Scholar]
- Guengerich, F.P. Cytochromes P450, drugs, and diseases. Mol. Interv. 2003, 3, 194–204. [Google Scholar] [CrossRef] [PubMed]
- Mustafa, G.; Yu, X.; Wade, R.C. Structure and dynamics of human drug-metabolizing cytochrome P450 enzymes. In Drug Metabolism Prediction; Kirchmair, J., Ed.; Wiley-VCH: Weinheim, Germany, 2014; pp. 77–101. [Google Scholar]
- Reynald, R.L.; Sansen, S.; Stout, C.D.; Johnson, E.F. Structural characterization of human cytochrome P450 2C19: Active site differences between P450s 2C8, 2C9, and 2C19. J. Biol. Chem. 2012, 287, 44581–44591. [Google Scholar] [CrossRef] [PubMed]
- Cojocaru, V.; Winn, P.J.; Wade, R.C. The ins and outs of cytochrome P450s. Biochim. Biophys. Acta Gen. Subj. 2007, 1170, 390–401. [Google Scholar] [CrossRef] [PubMed]
- Perić-Hassler, L.; Stjernschantz, E.; Oostenbrink, C.; Geerke, D.P. CYP 2D6 binding affinity predictions using multiple ligand and protein conformations. Int. J. Mol. Sci. 2013, 14, 24514–24530. [Google Scholar] [CrossRef] [PubMed]
- Deb, K.; Pratap, A.; Agarwal, S.; Meyarivan, T. A fast and elitist multiobjective genetic algorithm: NSGA-II. IEEE Trans. Evol. Comput. 2002, 6, 182–197. [Google Scholar] [CrossRef]
- Fortin, F.-A.; De Rainville, F.-M.; Gardner, M.-A.; Parizeau, M.; Gagné, C. DEAP: Evolutionary Algorithms Made Easy. J. Mach. Learn. Res. 2012, 13, 2171–2175. [Google Scholar]
- Pettersen, E.F.; Goddard, T.D.; Huang, C.C.; Couch, G.S.; Greenblatt, D.M.; Meng, E.C.; Ferrin, T.E. UCSF Chimera—A visualization system for exploratory research and analysis. J. Comput. Chem. 2004, 25, 1605–1612. [Google Scholar] [CrossRef]
- Ben-Kiki, O.; Evans, C.; Ingerson, B. YAML ain’t markup language (YAML) Version 1.2. Available online: http://www.yaml.org/spec/1.2/spec.html (accessed on 25 May 2019).
- Meng, E.C.; Lewis, R.A. Determination of molecular topology and atomic hybridization states from heavy atom coordinates. J. Comput. Chem. 1991, 12, 891–898. [Google Scholar] [CrossRef]
- Bakan, A.; Meireles, L.M.; Bahar, I. ProDy: Protein dynamics inferred from theory and experiments. Bioinformatics 2011, 27, 1575–1577. [Google Scholar] [CrossRef]
- Brooks, B.R.; Brooks Iii, C.L.; Mackerell, A.D.; Nilsson, L.; Petrella, R.J.; Roux, B.; Won, Y.; Archontis, G.; Bartels, C.; Boresch, S.; et al. CHARMM: The Biomolecular Simulation Program NIH Public Access. J. Comput. Chem. 2009, 30, 1545–1614. [Google Scholar] [CrossRef] [PubMed]
- Tama, F.; Sanejouand, Y.-H. Conformational change of proteins arising from normal mode calculations. Protein Eng. Des. Sel. 2001, 14, 1–6. [Google Scholar] [CrossRef]
- Palmer, D.S.; Jensen, F. Predicting large-scale conformational changes in proteins using energy-weighted normal modes. Proteins Struct. Funct. Bioinforma. 2011, 79, 2778–2793. [Google Scholar] [CrossRef] [PubMed]
- Maragakis, P.; Karplus, M. Large amplitude conformational change in proteins explored with a plastic network model: Adenylate kinase. J. Mol. Biol. 2005, 352, 807–822. [Google Scholar] [CrossRef] [PubMed]
- Ikeguchi, M.; Ueno, J.; Sato, M.; Kidera, A. Protein structural change upon ligand binding: Linear response theory. Phys. Rev. Lett. 2005, 94, 078102. [Google Scholar] [CrossRef]
- Eastman, P.; Swails, J.; Chodera, J.D.; McGibbon, R.T.; Zhao, Y.; Beauchamp, K.A.; Wang, L.P.; Simmonett, A.C.; Harrigan, M.P.; Stern, C.D.; et al. OpenMM 7: Rapid development of high performance algorithms for molecular dynamics. PLoS Comput. Biol. 2017, 13, 1–17. [Google Scholar] [CrossRef]
- Ehlers, A.W.; Böhme, M.; Dapprich, S.; Gobbi, A.; Höllwarth, A.; Jonas, V.; Köhler, K.F.; Stegmann, R.; Veldkamp, A.; Frenking, G. A set of f-polarization functions for pseudo-potential basis sets of the transition metals ScCu, YAg and LaAu. Chem. Phys. Lett. 1993, 208, 111–114. [Google Scholar] [CrossRef]
- Bayly, C.I.; Cieplak, P.; Cornell, W.D.; Kollman, P.A. A well-behaved electrostatic potential based method using charge restraints for deriving atomic charges: The RESP model. J. Phys. Chem. 1993, 97, 10269–10280. [Google Scholar] [CrossRef]
- Frisch, M.J.; Trucks, G.W.; Schlegel, H.B.; Scuseria, G.E.; Robb, G.E.; Cheeseman, J.R.; Scalmani, G.; Barone, V.; Mennucci, B.; Petersson, G.A.; et al. Gaussian 09, Revision D.01; Gaussian Inc.: Wallingford, CT, USA, 2009. [Google Scholar]
- Li, P.; Merz, K.M. MCPB.py: A Python Based Metal Center Parameter Builder. J. Chem. Inf. Model. 2016, 56, 599–604. [Google Scholar] [CrossRef]
- Scouras, A.D.; Daggett, V. The dynameomics rotamer library: Amino acid side chain conformations and dynamics from comprehensive molecular dynamics simulations in water. Protein Sci. 2011, 20, 341–352. [Google Scholar] [CrossRef]
- Shapovalov, M.V.; Dunbrack, R.L. A smoothed backbone-dependent rotamer library for proteins derived from adaptive kernel density estimates and regressions. Structure 2011, 19, 844–858. [Google Scholar] [CrossRef] [PubMed]
- Eyal, E.; Najmanovich, R.; Mcconkey, B.J.; Edelman, M.; Sobolev, V. Importance of Solvent Accessibility and Contact Surfaces in Modeling Side-Chain Conformations in Proteins. J. Comput. Chem. 2004, 25, 712–724. [Google Scholar] [CrossRef] [PubMed]
- Trott, O.; Olson, A.J. AutoDock Vina: Improving the speed and accuracy of docking with a new scoring function, efficient optimization, and multithreading. J. Comput. Chem. 2010, 31, 455–461. [Google Scholar] [CrossRef] [PubMed]
- Lavalle, S.M. Rapidly-Exploring Random Trees: A New Tool for Path Planning. Iowa State University: Ames, IA, USA, 1998. [Google Scholar]
- Cortés, J.; Jaulet, L.; Siméon, T. Molecular disassembly with rrt-like algorithms. In Proceedings of the IEEE International Conference on Robotics and Automation, Roma, Italy, 10–14 April 2007; pp. 3301–3306. [Google Scholar]
- Kuffner, J.J.; LaValle, S.M. RRT-connect: An efficient approach to single-query path planning. In Proceedings of the 2000 IEEE International Conference on Robotics & Automation; Institute of Electrical and Electronics Engineers (IEEE): San Francisco, 2000; pp. 995–1001. [Google Scholar]
- Cui, Y.L.; Zheng, Q.C.; Zhang, J.L.; Xue, Q.; Wang, Y.; Zhang, H.X. Molecular dynamic investigations of the mutational effects on structural characteristics and tunnel geometry in CYP17A1. J. Chem. Inf. Model. 2013, 53, 3308–3317. [Google Scholar] [CrossRef] [PubMed]
- Rehan, M. An Anti-Cancer Drug Candidate OSI-027 and its Analog as Inhibitors of mTOR: Computational Insights Into the Inhibitory Mechanisms. J. Cell. Biochem. 2017, 118, 4558–4567. [Google Scholar] [CrossRef] [PubMed]
- Edman, K.; Hosseini, A.; Bjursell, M.K.; Aagaard, A.; Wissler, L.; Gunnarsson, A.; Kaminski, T.; Köhler, C.; Bäckström, S.; Jensen, T.J.; et al. Ligand Binding Mechanism in Steroid Receptors: From Conserved Plasticity to Differential Evolutionary Constraints. Structure 2015, 23, 2280–2290. [Google Scholar] [CrossRef] [PubMed]
- Lucas, M.F.; Guallar, V. An atomistic view on human hemoglobin carbon monoxide migration processes. Biophys. J. 2012, 102, 887–896. [Google Scholar] [CrossRef]
- Madadkar-Sobhani, A.; Guallar, V. PELE web server: Atomistic study of biomolecular systems at your fingertips. Nucleic Acids Res. 2013, 41, W322–W328. [Google Scholar] [CrossRef]
- Kotev, M.; Lecina, D.; Tarragó, T.; Giralt, E.; Guallar, V. Unveiling prolyl oligopeptidase ligand migration by comprehensive computational techniques. Biophys. J. 2015, 108, 116–125. [Google Scholar] [CrossRef]
- Sanson, B.; Colletier, J.P.; Xu, Y.; Lang, P.T.; Jiang, H.; Silman, I.; Sussman, J.L.; Weik, M. Backdoor Opening Mechanism in Acetylcholinesterase Based on X-Ray Crystallography and Molecular Dynamics Simulations. Protein Sci. 2011, 20, 1114–1118. [Google Scholar] [CrossRef]
- Rehan, M.; Beg, M.A.; Parveen, S.; Damanhouri, G.A.; Zaher, G.F. Computational insights into the inhibitory mechanism of human AKT1 by an orally active inhibitor, MK-2206. PLoS ONE 2014, 9, 1–12. [Google Scholar] [CrossRef] [PubMed]
- Garcin, E.D.; Arvai, A.S.; Rosenfeld, R.J.; Kroeger, M.D.; Crane, B.R.; Andersson, G.; Andrews, G.; Hamley, P.J.; Mallinder, P.R.; Nicholls, D.J.; et al. Anchored plasticity opens doors for selective inhibitor design in nitric oxide synthase. Nat. Chem. Biol. 2008, 4, 700–707. [Google Scholar] [CrossRef] [PubMed]
- Zhou, Z.; Zhen, J.; Karpowich, N.K.; Law, C.J.; Reith, M.E.; Wang, D.N. Antidepressant specificity of serotonin transporter suggested by three LeuT-SSRI structures. Nat. Struct. Mol. Biol. 2009, 16, 652–657. [Google Scholar] [CrossRef] [PubMed]
- Cole, K.E.; Gattis, S.G.; Angell, H.D.; Fierke, C.A.; Christianson, D.W. Structure of the Metal-Dependent Deacetylase LpxC from Yersinia enterocolitica Complexed with the Potent Inhibitor CHIR-090. Biochemistry 2010, 50, 258–262. [Google Scholar] [CrossRef] [PubMed]
- Barb, A.W.; Zhou, P. Mechanism and inhibition of LpxC: An essential zinc-dependent deacetylase of bacterial lipid A synthesis. Curr. Pharm. Biotechnol. 2008, 9, 9–15. [Google Scholar] [PubMed]
- Hornak, V.; Abel, R.; Okur, A.; Strockbine, B.; Roitberg, A.; Simmerling, C. Comparison of multiple amber force fields and development of improved protein backbone parameters. Proteins 2006, 65, 712–725. [Google Scholar] [CrossRef] [PubMed]
- Streltsov, V.A.; Luang, S.; Peisley, A.; Varghese, J.N.; Ketudat Cairns, J.R.; Fort, S.; Hijnen, M.; Tvaroška, I.; Ardá, A.; Jiménez-Barbero, J.; et al. Discovery of processive catalysis by an exo-hydrolase with a pocket-shaped active site. Nat. Commun. 2019, 10, 2222. [Google Scholar] [CrossRef] [PubMed]
- Sciortino, G.; Garribba, E.; Rodríguez-Guerra Pedregal, J.; Maréchal, J.D. Simple Coordination Geometry Descriptors Allow to Accurately Predict Metal-Binding Sites in Proteins. ACS Omega 2019, 4, 3726–3731. [Google Scholar] [CrossRef]


| PDB Code | AQP Subfamily | Permeant/s | Residues of the SF | Reference/s |
|---|---|---|---|---|
| 1rc2 (a) | Strict aquaporin (AqpZ) | Water | F43, H174, T183, R189 | [34] |
| 2f2b (a) | Archaeal aquaporin (AqpM) | Water, glycerol 1 | F62, I187, S196, R202 | [29,33] |
| 1ldi (a) | Aquaglyceroporin (GlpF) | Water, glycerol, urea, antimonite, arsenite, polyols, lactate | W48, G191, F200, R206 | [36,37] |
| AQP | Considering the Frame with Highest Steric Clashes | Considering the Average Steric Clashes of All Frames |
|---|---|---|
| AqpZ | 130.70 ± 27.92 Å3 | 23.95 ± 3.31 Å3 |
| AqpM | 95.63 ± 23.99 Å3 | 14.62 ± 2.45 Å3 |
| GlpF | 83.03 ± 18.85 Å3 | 10.19 ± 2.59 Å3 |
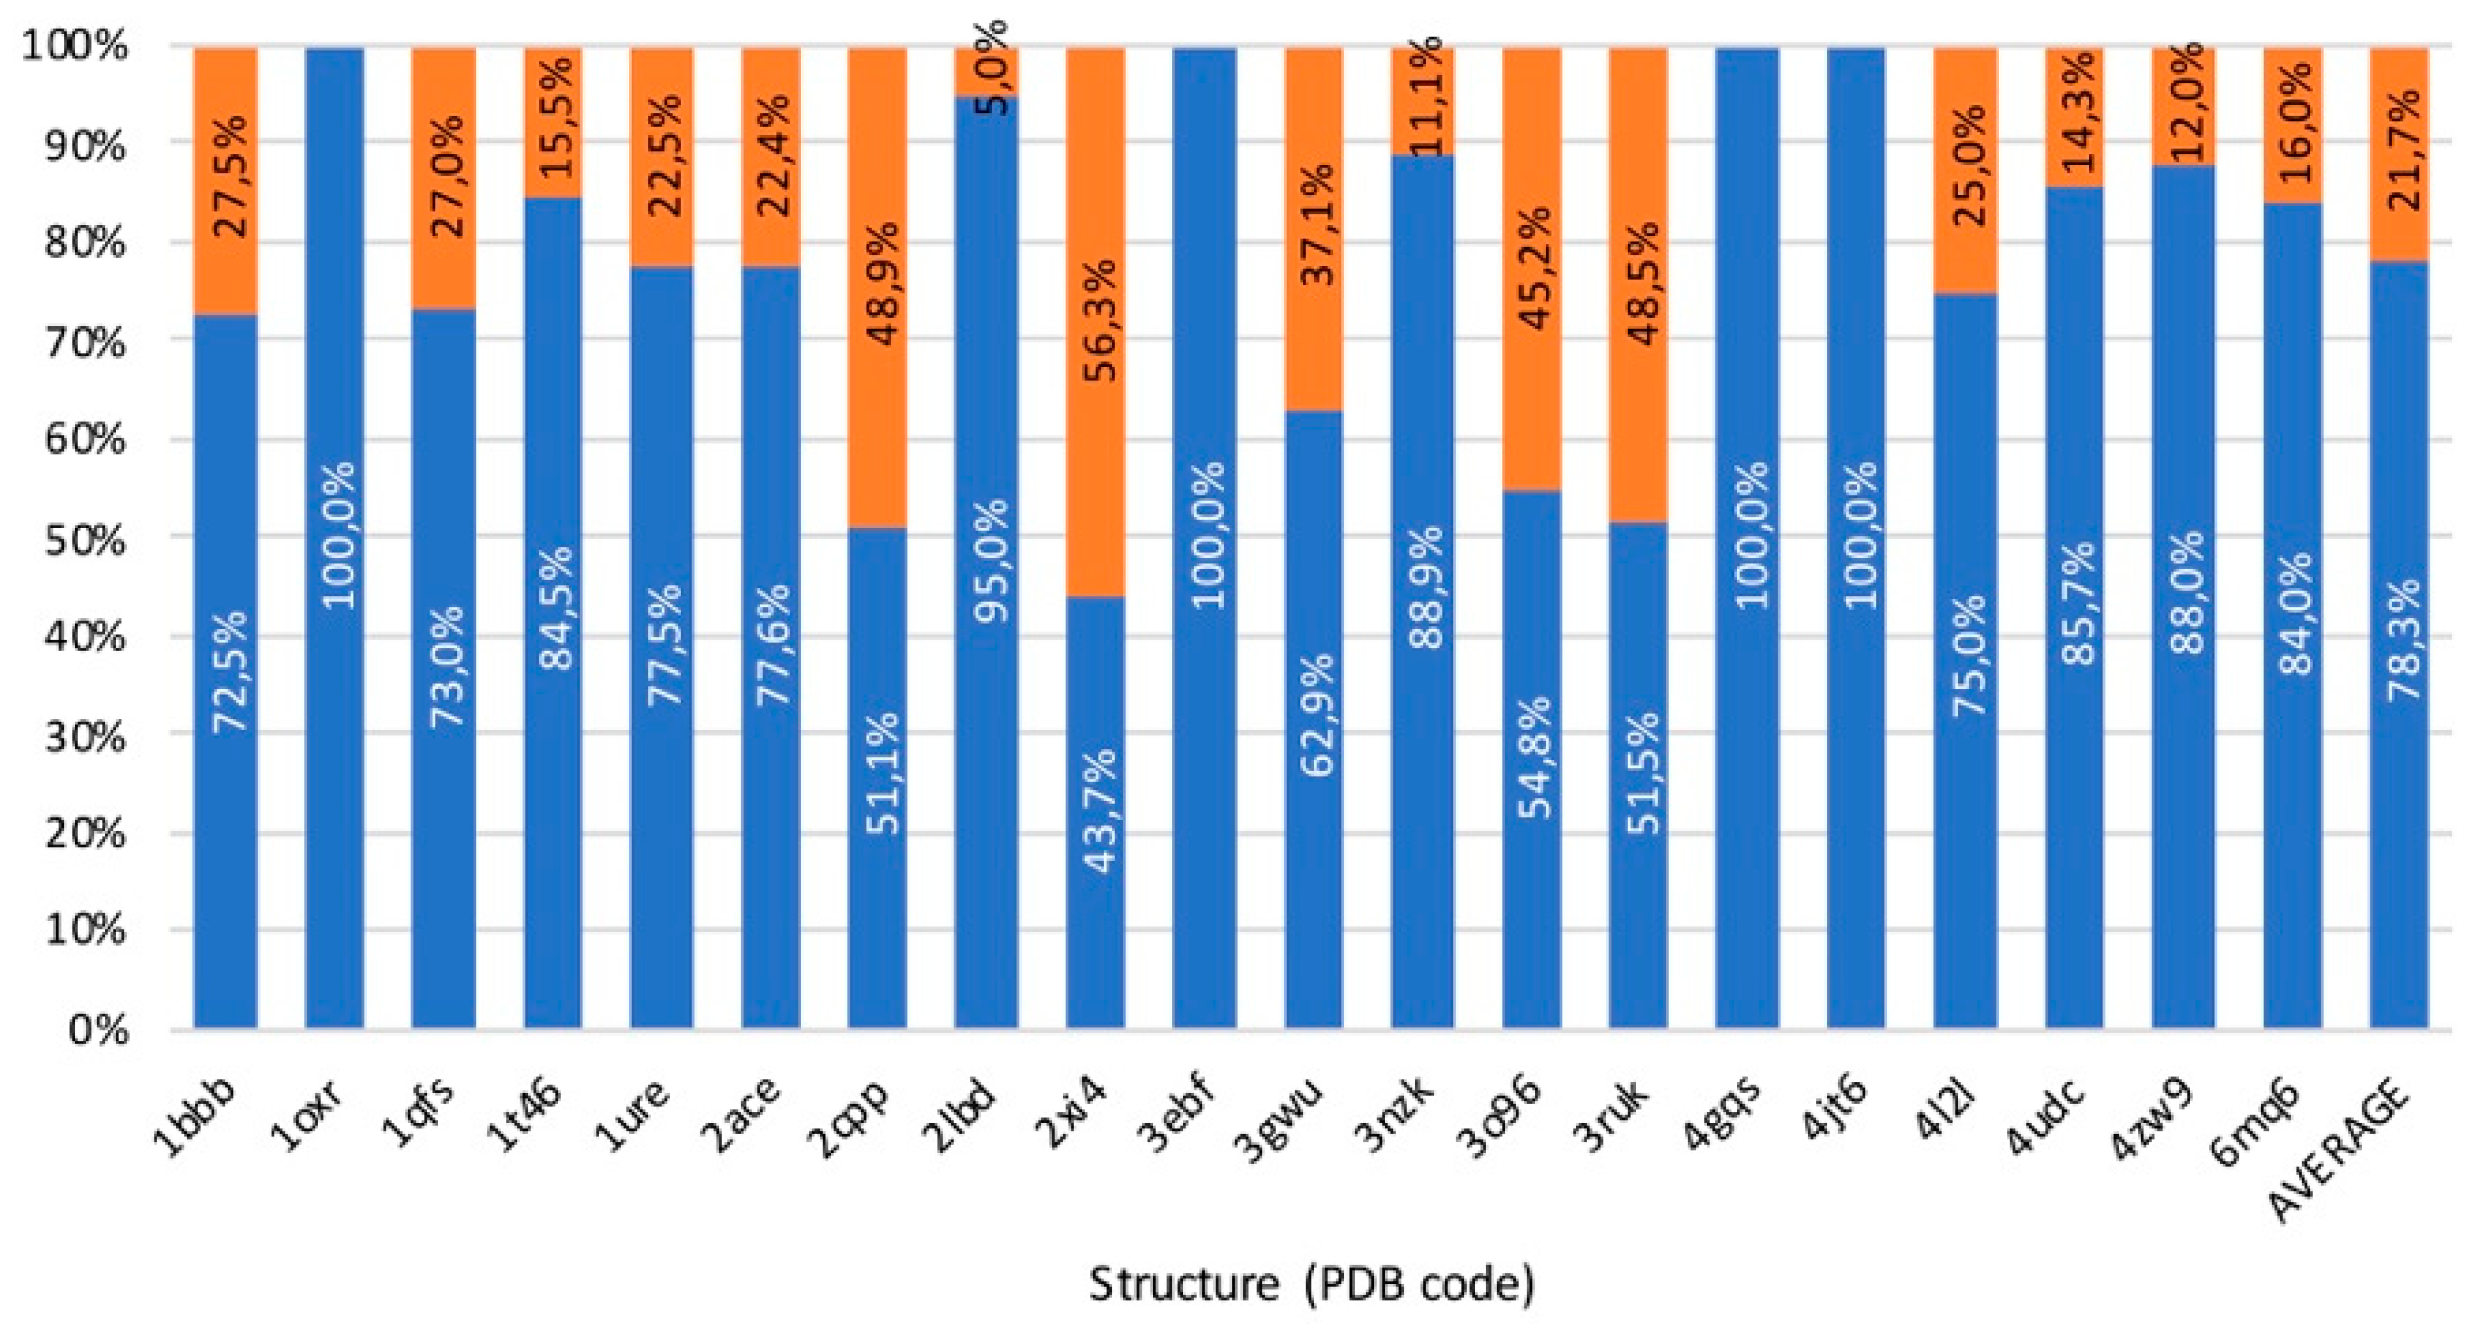
| Access Channel | Frequency for Clashes Evaluation (%) | Frequency for Clashes + Vina Evaluation (%) |
|---|---|---|
| Solvent | 62.0 % | 49.2 % |
| 2a | 0.0 % | 13.4 % |
| 2b | 0.0 % | 6.9 % |
| 2c | 28.0 % | 19.4 % |
| 2e | 6.0 % | 2.0 % |
| 2ac | 2.0 % | 4.5 % |
| Others | 2.0 % | 4.6 % |
| Option | Initial Point | Final Point | Function | Parameters of Path Gene |
|---|---|---|---|---|
| 1 | Known | Unknown | Unbinding trajectories | No necessity to configure if the ligand is positioned at the binding site |
| 2 | Unknow | Known | Binding trajectories | Destination (binding site coordinates) |
| 3 | Known | Known | Trajectories between two points | Origin (starting point) Destination (ending point) |
| Parameter | Default Value |
|---|---|
| Number of generations | 500 (one objective) 750 (two objectives) 1000 (three objectives) |
| Population size | 12 individuals |
| Minimum increment distance from the origin | 0.8 Å |
| Proportion of crossover | 0.2 |
| Proportion of mutation | 0.8 |
© 2019 by the authors. Licensee MDPI, Basel, Switzerland. This article is an open access article distributed under the terms and conditions of the Creative Commons Attribution (CC BY) license (http://creativecommons.org/licenses/by/4.0/).
Share and Cite
Sánchez-Aparicio, J.-E.; Sciortino, G.; Herrmannsdoerfer, D.V.; Chueca, P.O.; Pedregal, J.R.-G.; Maréchal, J.-D. GPathFinder: Identification of Ligand-Binding Pathways by a Multi-Objective Genetic Algorithm. Int. J. Mol. Sci. 2019, 20, 3155. https://doi.org/10.3390/ijms20133155
Sánchez-Aparicio J-E, Sciortino G, Herrmannsdoerfer DV, Chueca PO, Pedregal JR-G, Maréchal J-D. GPathFinder: Identification of Ligand-Binding Pathways by a Multi-Objective Genetic Algorithm. International Journal of Molecular Sciences. 2019; 20(13):3155. https://doi.org/10.3390/ijms20133155
Chicago/Turabian StyleSánchez-Aparicio, José-Emilio, Giuseppe Sciortino, Daniel Viladrich Herrmannsdoerfer, Pablo Orenes Chueca, Jaime Rodríguez-Guerra Pedregal, and Jean-Didier Maréchal. 2019. "GPathFinder: Identification of Ligand-Binding Pathways by a Multi-Objective Genetic Algorithm" International Journal of Molecular Sciences 20, no. 13: 3155. https://doi.org/10.3390/ijms20133155
APA StyleSánchez-Aparicio, J.-E., Sciortino, G., Herrmannsdoerfer, D. V., Chueca, P. O., Pedregal, J. R.-G., & Maréchal, J.-D. (2019). GPathFinder: Identification of Ligand-Binding Pathways by a Multi-Objective Genetic Algorithm. International Journal of Molecular Sciences, 20(13), 3155. https://doi.org/10.3390/ijms20133155