Alterations of Fatty Acid Profile May Contribute to Dyslipidemia in Chronic Kidney Disease by Influencing Hepatocyte Metabolism

 ,
, 

Abstract
1. Introduction
2. Results
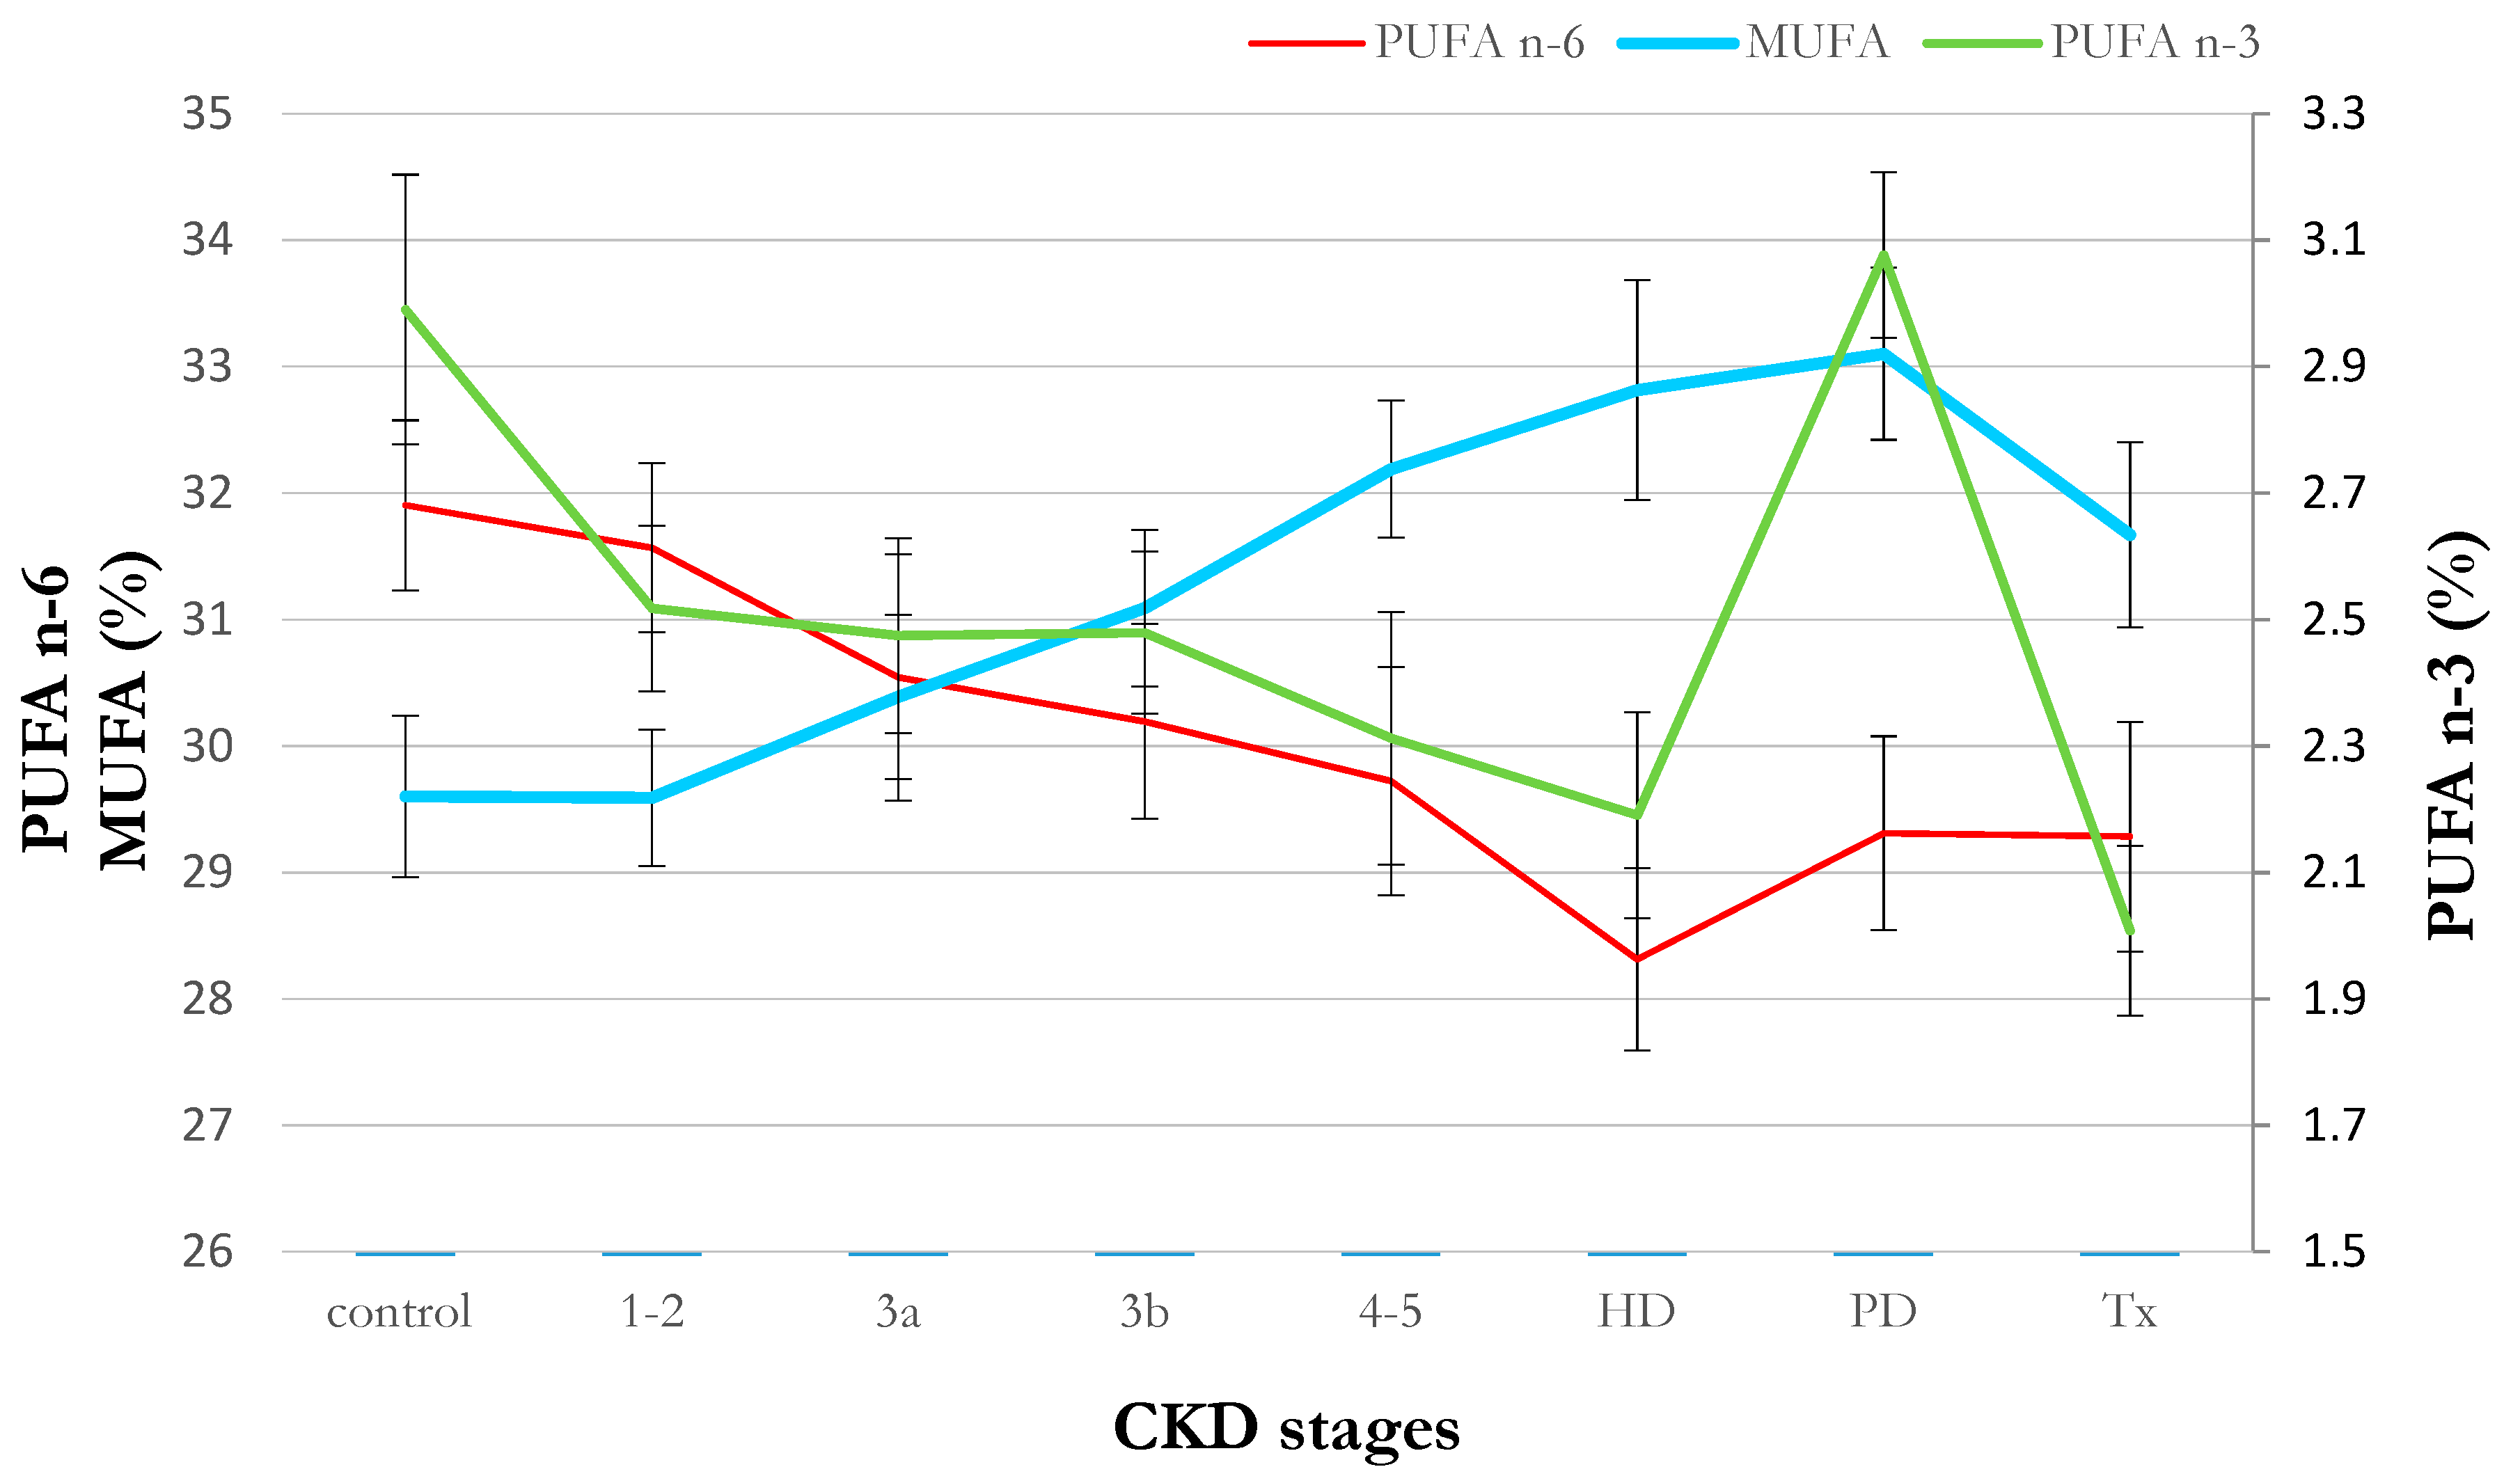
2.1. Clinical Data
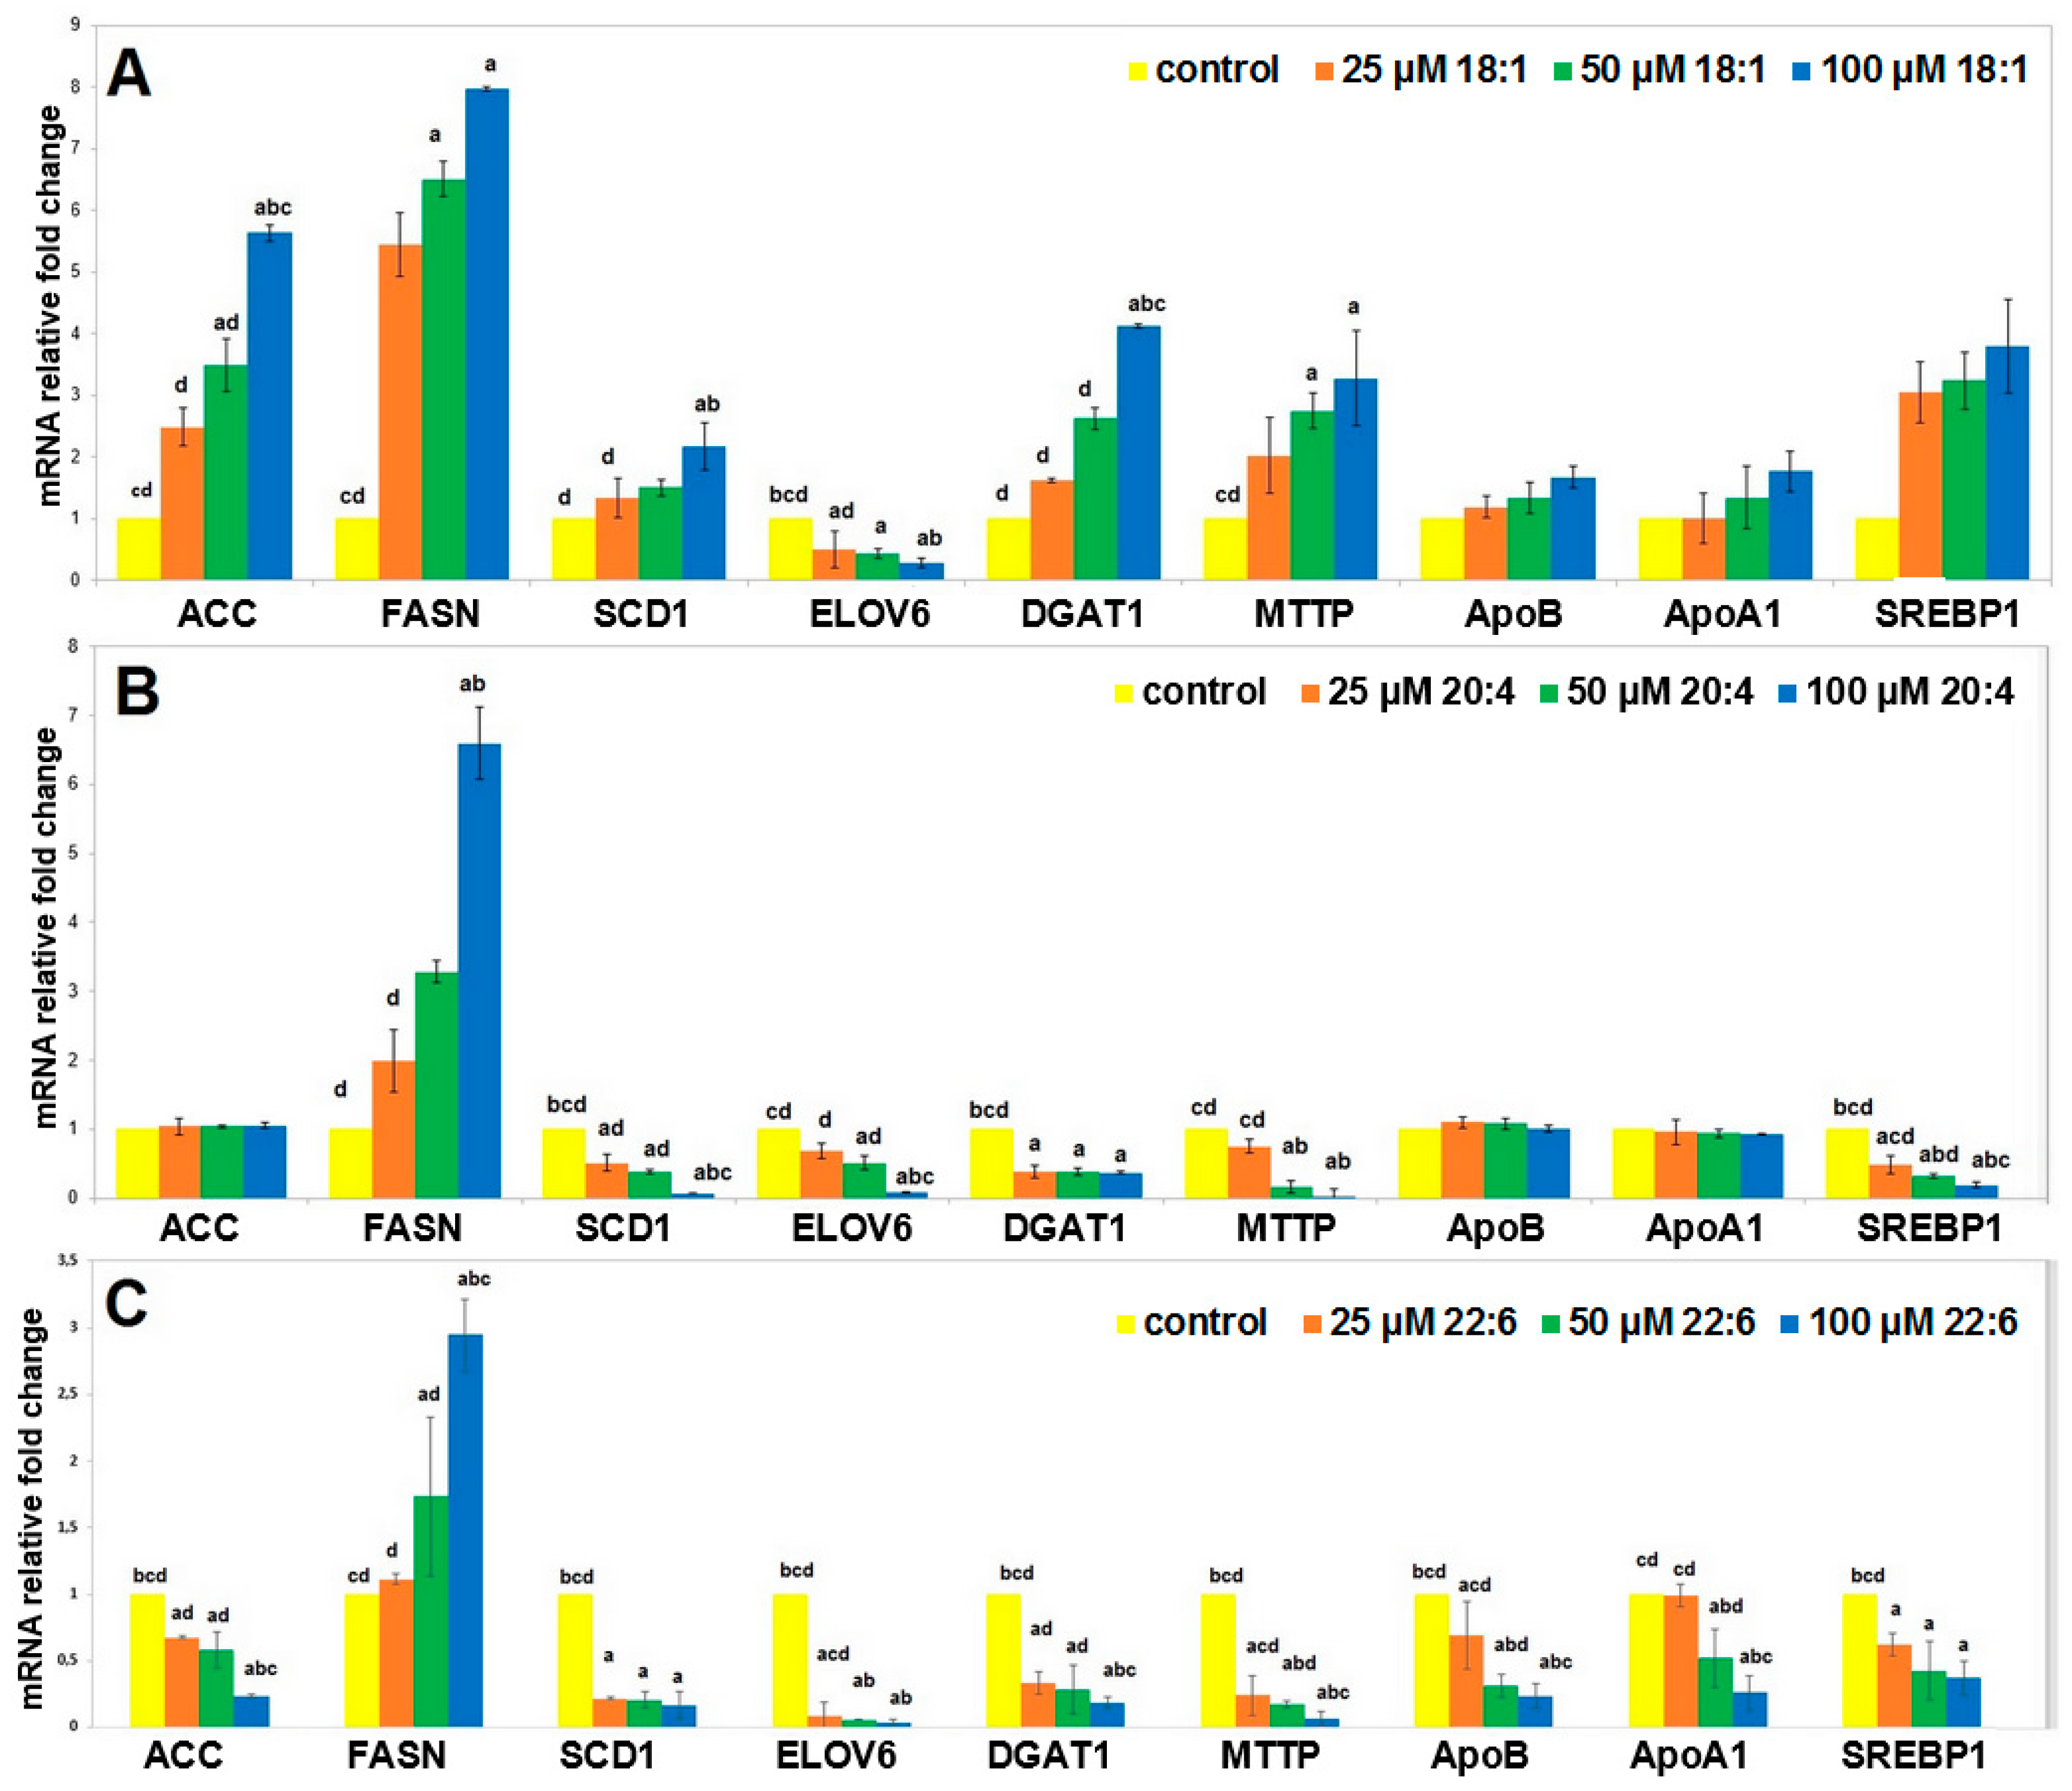
2.2. Cell Studies In Vitro
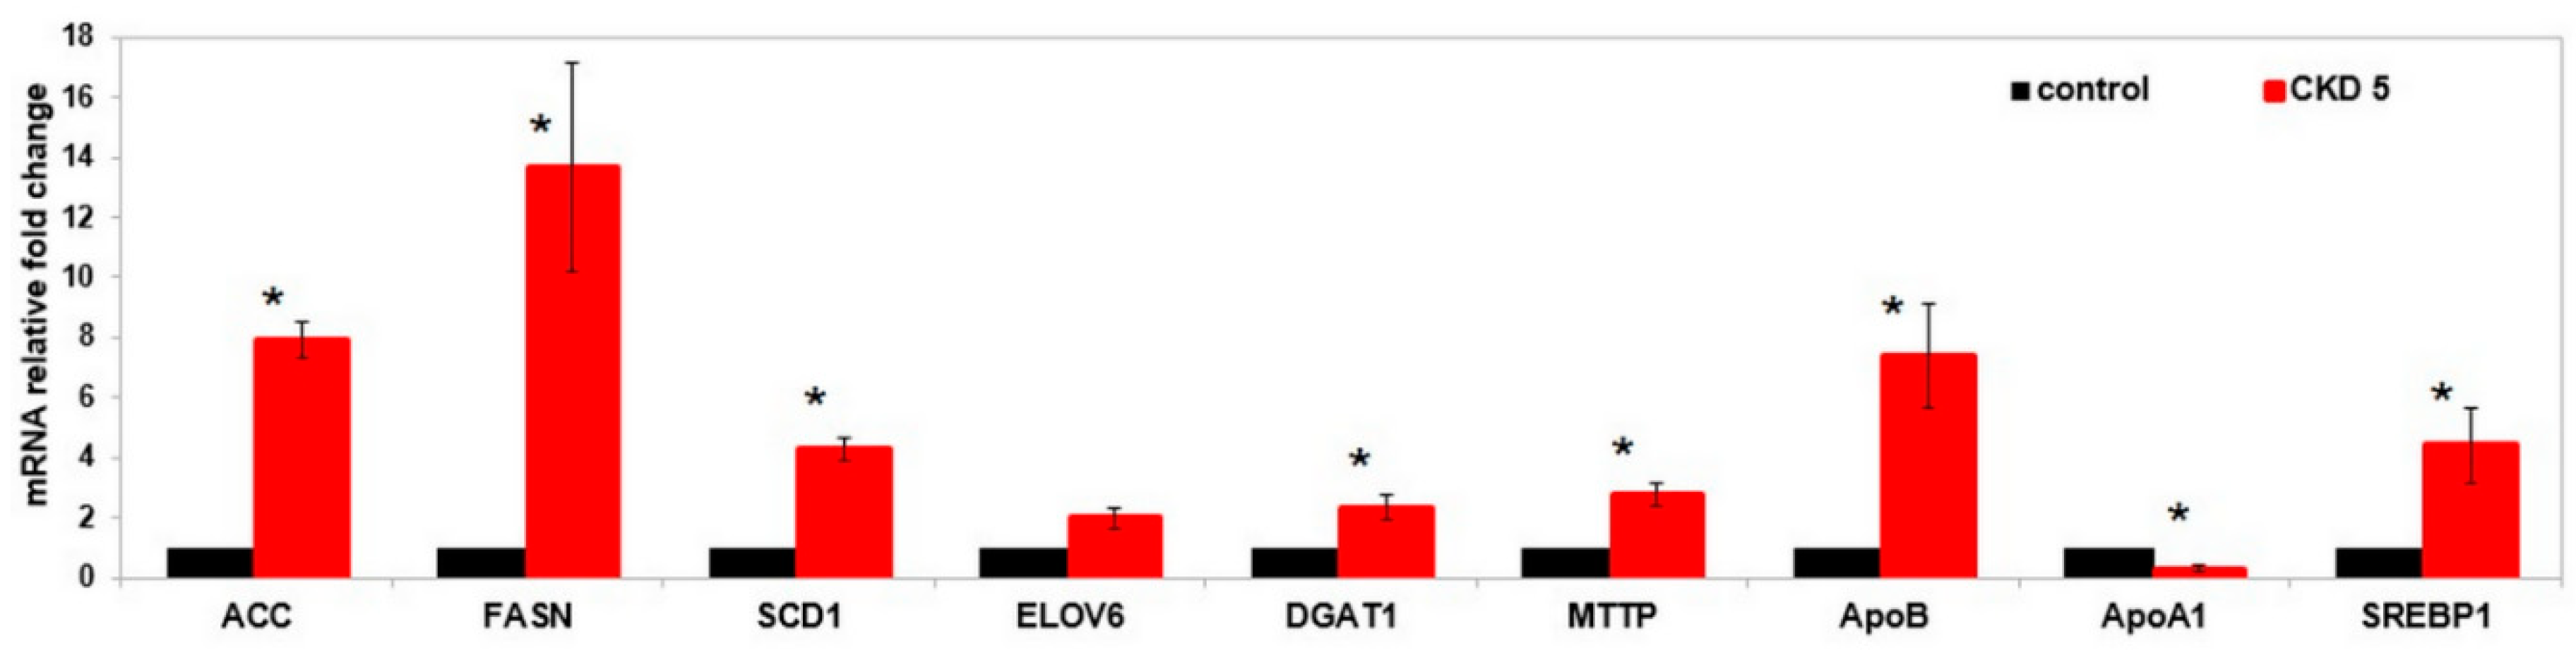
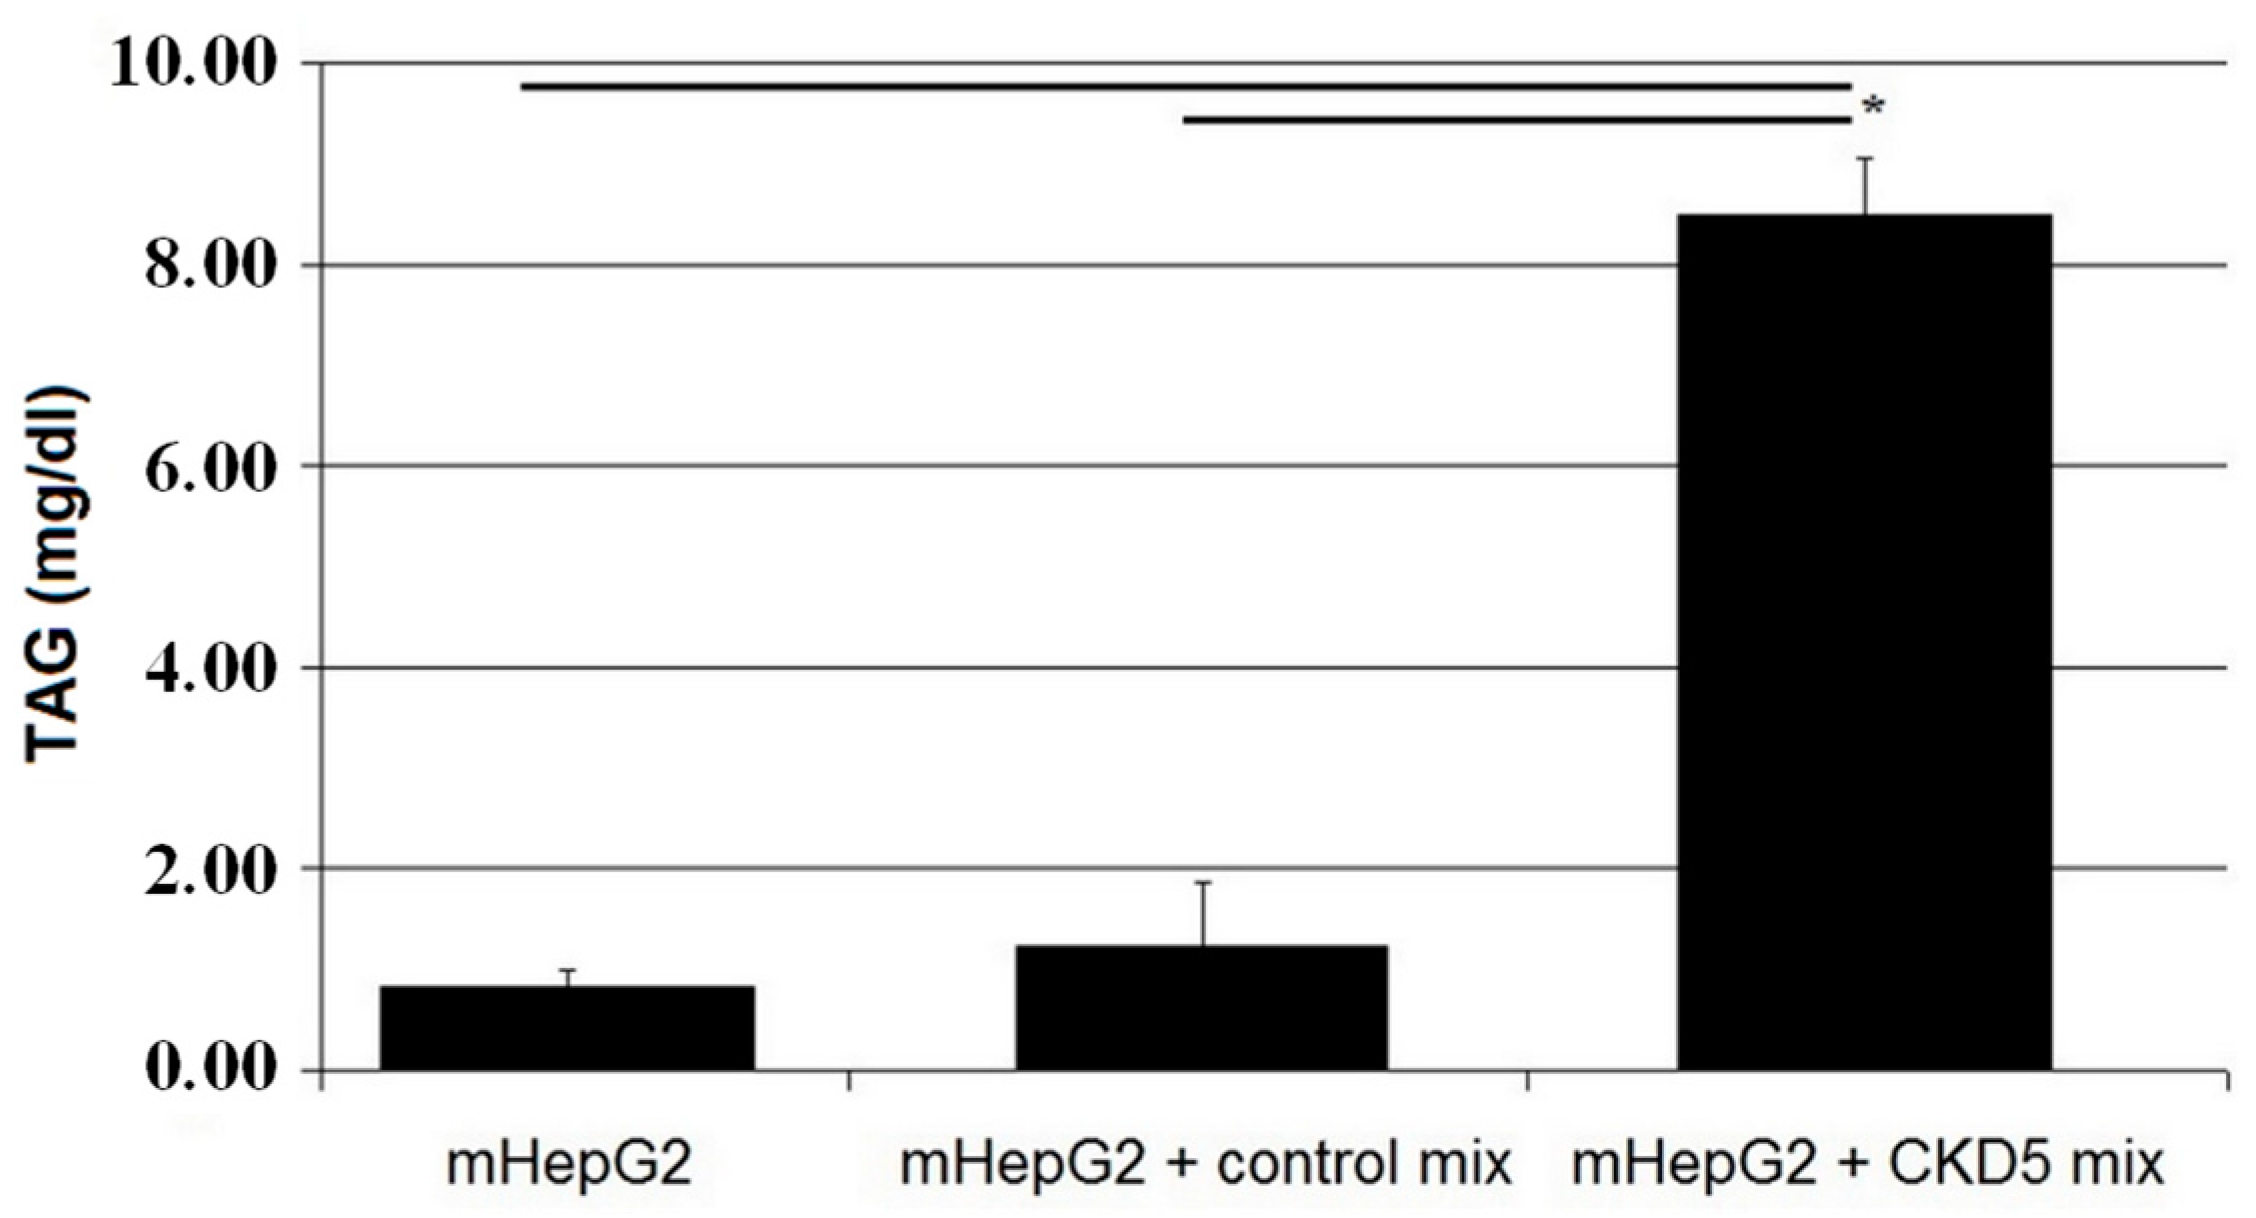
2.3. Cell Studies Ex Vivo
3. Discussion
4. Materials and Methods
4.1. Patients
4.2. Lipid Extraction and FAME Analysis
4.3. Cell Cultures and Treatment
4.4. Triacylglycerols Content Analysis
4.5. Statistical Analyses
Supplementary Materials
Author Contributions
Funding
Conflicts of Interest
Abbreviations
| AA | Arachidonic acid |
| ACC | Acetyl-CoA carboxylase |
| ApoA1 | Apolipoprotein A1 |
| ApoB | Apolipoprotein B |
| BMI | Body mass index |
| BSA | Bovine serum albumin |
| BUN | Blood urea nitrogen |
| CDC | Chronic kidney disease |
| CRP | C-reactive protein |
| CVD | Cardiovascular disease |
| DAG | diacylglycerol |
| DHA | Docosahexaenoic acid |
| DGAT | Diacylglycerol O-transferase |
| DM | Diabetes mellitus |
| eGFR | Glomerular filtration rate |
| ELOVL | Elongase |
| FA | Fatty acids |
| FAME | Fatty acid methyl ester |
| FASN | Fatty acid synthase |
| FFQ | Food frequency questionnaire |
| GLM | General linear model |
| HD | Hemodialysis |
| HNF4α | Hepatocyte nuclear factor 4α |
| HP | Hypertension |
| HOMA IR | Homeostatic model assessment for insulin resistance |
| LXR | Liver-x receptors |
| MTTP | Microsomal TAG transfer protein |
| MUFA | Monounsaturated fatty acids |
| NFκB | Nuclear factor κB |
| OA | Oleic acid |
| PD | Peritoneal dialysis |
| PUFA | Polyunsaturated fatty acids |
| PPAR | Peroxisome proliferator-activated receptors |
| SCD | Stearoyl-CoA desaturase |
| SFA | Saturated fatty acids |
| SREBP | Sterol regulatory binding proteins |
| TAG | Triacylglycerol |
| Tx | Renal transplantation |
| VLDL | Very low density lipoprotein. |
References
- Chmielewski, M.; Carrero, J.J.; Lindholm, B. Lipid disorders in chronic kidney disease: Reverse epidemiology and therapeutic approach. Artic. J. Nephrol. 2008, 21, 635–644. [Google Scholar]
- Li, L.; Han, J.; Wang, Z.; Liu, J.; Wei, J.; Xiong, S.; Zhao, Z. Mass Spectrometry Methodology in Lipid Analysis. Int. J. Mol. Sci. 2014, 15, 10492–10507. [Google Scholar] [CrossRef] [PubMed]
- Sikorska-Wiśniewska, M.; Mika, A.; Śledziński, T.; Małgorzewicz, S.; Stepnowski, P.; Rutkowski, B.; Chmielewski, M. Disorders of serum omega-3 fatty acid composition in dialyzed patients, and their associations with fat mass. Ren. Fail. 2017, 39, 406–412. [Google Scholar] [CrossRef] [PubMed]
- Mika, A.; Stepnowski, P.; Chmielewski, M.; Malgorzewicz, S.; Kaska, L.; Proczko, M.; Ratnicki-Sklucki, K.; Sledzinski, M.; Sledzinski, T. Increased Serum Level of Cyclopropaneoctanoic Acid 2-Hexyl in Patients with Hypertriglyceridemia-Related Disorders; Increased Serum Level of Cyclopropaneoctanoic Acid 2-Hexyl in Patients with Hypertriglyceridemia-Related Disorders. Lipids 2016, 51, 867–873. [Google Scholar] [CrossRef] [PubMed]
- Madsen, T.; Christensen, J.H.; Svensson, M.; Witt, P.M.; Toft, E.; Schmidt, E.B. Marine n-3 Polyunsaturated Fatty Acids in Patients With End-stage Renal Failure and in Subjects Without Kidney Disease: A Comparative Study. J. Ren. Nutr. 2011, 21, 169–175. [Google Scholar] [CrossRef] [PubMed]
- Mika, A.; Sikorska-Wiśniewska, M.; Małgorzewicz, S.; Stepnowski, P.; Alicja, D.; Tomasz, Ś.; Chmielewski, M. Potential contribution of monounsaturated fatty acids to cardiovascular risk in chronic kidney disease. Pol. Arch. Med. wewnȩtrznej 2018, 128, 755–763. [Google Scholar] [CrossRef]
- Desvergne, B.; Wahli, W. Peroxisome Proliferator-Activated Receptors: Nuclear Control of Metabolism*. Endocr. Rev. 1999, 20, 649–688. [Google Scholar] [PubMed]
- Ou, J.; Tu, H.; Shan, B.; Luk, A.; Debose-Boyd, R.A.; Bashmakov, Y.; Goldstein, J.L.; Brown, M.S. Unsaturated fatty acids inhibit transcription of the sterol regulatory element-binding protein-1c (SREBP-1c) gene by antagonizing ligand-dependent activation of the LXR. PNAS 2001, 98, 6027–6032. [Google Scholar] [CrossRef]
- Pawar, A.; Xu, J.; Jerks, E.; Mangelsdorf, D.J.; Jump, D.B. Fatty Acid Regulation of Liver X Receptors (LXR) and Peroxisome Proliferator-activated Receptor (PPAR) in HEK293 Cells*. J. Biol. Chem. 2002, 277, 39243–39250. [Google Scholar] [CrossRef] [PubMed]
- Hertz, R.; Magenheim, J.; Berman, I.; Bar-Tana, J. Fatty acyl-CoA thioesters are ligands of hepatic nuclear factor-4α. Nature 1998, 392, 512–516. [Google Scholar] [CrossRef]
- Wisely, G.B.; Miller, A.B.; Davis, R.G.; Thornquest, A.D.; Johnson, R.; Spitzer, T.; Sefler, A.; Shearer, B.; Moore, J.T.; Miller, A.B.; et al. Hepatocyte nuclear factor 4 is a transcription factor that constitutively binds fatty acids. Structure 2002, 10, 1225–1234. [Google Scholar] [CrossRef]
- Hara, T.; Kashihara, D.; Ichimura, A.; Kimura, I.; Tsujimoto, G.; Hirasawa, A. Role of free fatty acid receptors in the regulation of energy metabolism. Biochim. Biophys. Acta - Mol. Cell Biol. Lipids 2014, 1841, 1292–1300. [Google Scholar] [CrossRef] [PubMed]
- Clarke, S.D.; Armstrong, M.K.; Jump, D.B. Dietary Polyunsaturated Fats Uniquely Suppress Rat Liver Fatty Acid Synthase and S14 mRNA Content. J. Nutr. 1990, 120, 225–231. [Google Scholar] [CrossRef] [PubMed]
- Landschulz, K.T.; Jump, D.B.; MacDougald, O.A.; Lane, M.D. Transcriptional control of the stearoyl-CoA desaturase-1 gene by polyunsaturated fatty acids. Biochem. Biophys. Res. Commun. 1994, 200, 763–768. [Google Scholar] [CrossRef] [PubMed]
- Pazda, M.; Stepnowski, P.; Sledzinski, T.; Chmielewski, M.; Mika, A. Suitability of selected chromatographic columns for analysis of fatty acids in dialyzed patients. Biomed. Chromatogr. 2017, 31, e4006. [Google Scholar] [CrossRef]
- Szolkiewicz, M.; Chmielewski, M.; Nogalska, A.; Stelmanska, E.; Swierczynski, J.; Rutkowski, B. The Potential Role of Sterol Regulatory Element Binding Protein Transcription Factors in Renal Injury. J. Ren. Nutr. 2007, 17, 62–65. [Google Scholar] [CrossRef] [PubMed]
- Korczynska, J.; Stelmanska, E.; Nogalska, A.; Szolkiewicz, M.; Goyke, E.; Swierczynski, J.; Rutkowski, B. Upregulation of lipogenic enzymes genes expression in white adipose tissue of rats with chronic renal failure is associated with higher level of sterol regulatory element binding protein-1. Metabolism. 2004, 53, 1060–1065. [Google Scholar] [CrossRef]
- Patel, T.P.; Rawal, K.; Soni, S.; Gupta, S. Swertiamarin ameliorates oleic acid induced lipid accumulation and oxidative stress by attenuating gluconeogenesis and lipogenesis in hepatic steatosis. Biomed. Pharmacother. 2016, 83, 785–791. [Google Scholar] [CrossRef]
- Caputo, M.; De Rosa, M.C.; Rescigno, T.; Zirpoli, H.; Vassallo, A.; De Tommasi, N.; Torino, G.; Tecce, M.F. Binding of polyunsaturated fatty acids to LXR α and modulation of SREBP-1 interaction with a specific SCD1 promoter element. Cell Biochem. Funct. 2014, 32, 637–646. [Google Scholar] [CrossRef]
- Mater, M.K.; Thelen, A.P.; Jump, D.B. Arachidonic acid and PGE2 regulation of hepatic lipogenic gene expression. J. Lipid Res. 1999, 40, 1045–1052. [Google Scholar]
- Mika, A.; Stepnowski, P.; Kaska, L.; Proczko, M.; Wisniewski, P.; Sledzinski, M.; Sledzinski, T. A comprehensive study of serum odd- and branched-chain fatty acids in patients with excess weight. Obesity 2016, 24, 1669–1676. [Google Scholar] [CrossRef] [PubMed]
- Liu, X.; Strable, M.S.; Ntambi, J.M. Stearoyl CoA Desaturase 1: Role in Cellular Inflammation and Stress. Adv. Nutr. 2011, 2, 15–22. [Google Scholar] [CrossRef]
- Ntambi, J.M.; Miyazaki, M. Regulation of stearoyl-CoA desaturases and role in metabolism. Prog. Lipid Res. 2004, 43, 91–104. [Google Scholar] [CrossRef]
- Worgall, T.S.; Sturley, S.L.; Seo, T.; Osborne, T.F.; Deckelbaum, R.J. Polyunsaturated fatty acids decrease expression of promoters with sterol regulatory elements by decreasing levels of mature sterol regulatory element-binding protein. J. Biol. Chem. 1998, 273, 25537–25540. [Google Scholar] [CrossRef]
- Jin, K.; Norris, K.; Vaziri, N.D. Dysregulation of hepatic fatty acid metabolism in chronic kidney disease. Nephrol. Dial. Transplant. 2013, 28, 313–320. [Google Scholar] [CrossRef] [PubMed]
- Levey, A.S.; Stevens, L.A.; Schmid, C.H.; Zhang, Y.L.; Castro, A.F.; Feldman, H.I.; Kusek, J.W.; Eggers, P.; Van Lente, F.; Greene, T.; et al. A new equation to estimate glomerular filtration rate. Ann. Intern. Med. 2009, 150, 604–612. [Google Scholar] [CrossRef]
- Kowalkowska, J.; Slowinska, M.A.; Slowinski, D.; Dlugosz, A.; Niedzwiedzka, E.; Wadolowska, L. Comparison of a full food-frequency questionnaire with the three-day unweighted food records in young Polish adult women: implications for dietary assessment. Nutrients 2013, 5, 2747–2776. [Google Scholar] [CrossRef] [PubMed]
- Folch, J.; Lees, M.; Sloane Stanley, G.H. A simple method for the isolation and purification of total lipides from animal tissues. J. Biol. Chem. 1957, 226, 497–509. [Google Scholar] [PubMed]
- Sledzinski, T.; Mika, A.; Stepnowski, P.; Proczko-Markuszewska, M.; Kaska, L.; Stefaniak, T.; Swierczynski, J. Identification of Cyclopropaneoctanoic Acid 2-Hexyl in Human Adipose Tissue and Serum. Lipids 2013, 48, 839–848. [Google Scholar] [CrossRef]
- Nguyen, P.; Leray, V.; Diez, M.; Serisier, S.; Le Bloc’h, J.; Siliart, B.; Dumon, H. Liver lipid metabolism. J. Anim. Physiol. Anim. Nutr. (Berl.) 2008, 92, 272–283. [Google Scholar] [CrossRef]
- Guillouzo, A.; Corlu, A.; Aninat, C.; Glaise, D.; Morel, F.; Guguen-Guillouzo, C. The human hepatoma HepaRG cells: A highly differentiated model for studies of liver metabolism and toxicity of xenobiotics. Chem. Biol. Interact. 2007, 168, 66–73. [Google Scholar] [CrossRef] [PubMed]


| Item | Healthy Control | CKD 1-2 | CKD 3a | CKD 3b | CKD 4-5 | HD | PD | Tx |
|---|---|---|---|---|---|---|---|---|
| Age (years) | 55.57 ± 1.34 | 53.65 ± 2.30 | 60.57 ± 2.32 | 61.15 ± 2.64 | 61.00 ± 2.81 | 60.14 ± 2.40 | 51.27 ± 2.18 | 52.17 ± 2.14 |
| Hemoglobin (g/dL) | 14.37 ± 0.20 | 14.23 ± 0.21 | 14.61 ± 0.30 | 13.24 ± 0.39 * | 12.33 ± 0.39 # | 10.71 ± 0.26 # | 10.99 ± 0.29 # | 13.17 ± 0.41 # |
| Creatinine (mg/dL) | 0.85 ± 0.03 | 0.83 ± 0.03 | 1.33 ± 0.04 # | 1.72 ± 0.08 # | 3.98 ± 0.96 # | 7.61 ± 0.46 # | 9.55 ± 0.67 # | 1.57 ± 0.17 # |
| eGFR (ml/min/1.73m2) | 89.07 ± 2.18 | 88.05 ± 2.49 | 50.96 ± 1.17 # | 36.59 ± 1.06 # | 20.63 ± 1.35 # | 7.11 ± 0.54 # | 6.30 ± 0.71 # | 39.27 ± 2.65 # |
| BUN (mmol/L) | 15.92 ± 0.67 | 16.49 ± 0.64 | 21.63 ± 0.88 # | 31.69 ± 1.94 # | 48.34 ± 3.49 # | 53.81 ± 3.00 # | 57.68 ± 3.54 # | 31.32 ± 3.29 # |
| TAG (mg/dL) | 129.80 ± 10.83 | 148.10 ± 17.07 | 151.48 ± 14.48 | 154.77 ± 12.06 | 161.32 ± 15.32 | 185.46 ± 32.68 | 187.41 ± 14.60 # | 215.33 ± 37.46 * |
| Total cholesterol (mmol/L) | 211.23 ± 8.19 | 212.85 ± 7.32 | 202.22 ± 11.68 | 199.62 ± 10.33 | 212.84 ± 12.78 | 184.25 ± 10.04 * | 209.79 ± 12.16 | 217.46 ± 11.62 |
| HDL cholesterol (mmol/L) | 54.30 ± 2.58 | 55.93 ± 2.20 | 48.43 ± 2.66 | 48.73 ± 3.12 | 48.26 ± 3.53 | 41.46 ± 2.47 # | 38.76 ± 1.92 # | 51.71 ± 3.92 |
| LDL cholesterol (mmol/L) | 131.10 ± 7.41 | 126.29 ±6.28 | 121.32 ± 8.79 | 119.96 ± 9.30 | 131.79 ± 10.79 | 111.67 ± 9.87 | 135.43 ± 10.90 | 125.80 ± 10.87 |
| CRP (mg/L) | 2.80 ± 0.90 | 3.38 ± 0.65 | 3.38 ± 0.77 | 4.10 ± 0.91 | 4.59 ± 1.43 | 14.19 ± 5.43 * | 9.05 ± 3.45 | 8.64 ± 3.98 |
| Albumin (g/L) | 39.46 ± 0.45 | 38.70 ± 1.06 | 39.52 ± 0.61 | 37.78 ± 0.76 | 36.74 ± 1.06 * | 31.96 ± 0.68 # | 31.60 ± 0.84 # | 37.92 ± 0.86 |
| Glucose (mg/dL) | 102.55 ± 4.44 | 102.67 ± 4.79 | 114.00 ± 5.35 | 123.07 ± 10.65 | 125.16 ± 11.34 * | 112.96 ± 12.13 | 96.83 ± 4.95 | 116.17 ± 10.10 |
| Insulin (µU/mL) | 11.77 ± 0.96 | 12.99 ± 1.17 | 15.80 ± 3.39 | 15.84 ± 1.19 * | 21.05 ± 6.99 | 23.55 ± 9.47 | 15.13 ± 4.20 | 30.18 ± 15.00 |
| Na+ (mmol/L) | 140.27 ± 0.42 | 140.00 ± 0.41 | 140.10 ± 0.34 | 139.62 ± 0.62 | 140.68 ± 0.78 | 137.25 ± 0.56 # | 141.17 ± 0.46 | 139.54 ± 0.68 |
| K+ (mmol/L) | 4.36 ± 0.05 | 4.24 ± 0.05 | 4.50 ± 0.09 | 4.52 ± 0.09 | 4.81 ± 0.09 # | 5.09 ± 0.15 # | 4.42 ± 0.10 | 4.26 ± 0.08 |
| BMI (kg/m2) | 27.52 ± 0.67 | 27.52 ± 0.84 | 28.63 ± 1.05 | 31.16 ± 1.13 * | 27.54 ± 1.18 | 25.84 ± 1.15 | 26.16 ± 0.77 | 27.04 ± 0.85 |
| HOMA IR | 1.93 ± 0.42 | 3.13 ± 0.40 * | 3.73 ± 1.29 | 4.32 ± 0.53 # | 6.14 ± 3.57 | 5.49 ± 2.08 * | 4.44 ± 1.98 | 7.15 ± 2.65 * |
| Concomitant diseases (%) | ||||||||
| Diabetes mellitus (DM) | 3.33 ± 3.33 | 12.50 ± 5.30 | 27.27 ± 9.50 * | 37.04 ± 9.47 # | 42.11 ± 11.64 # | 35.71 ± 9.22 # | 16.67 ± 6.92 | 33.33 ± 9.83 # |
| Cardiovascular disease (CVD) | 3.33 ± 3.33 | 15.00 ± 5.72 | 40.91 ± 10.49 # | 44.44 ± 9.75 # | 42.11 ± 11.64 # | 57.14 ± 9.52 # | 36.67 ± 8.95 # | 33.33 ± 9.83 # |
| Hypertension (HP) | 33.33 ± 8.75 | 70.00 ± 7.34 # | 95.65 ± 4.45 # | 92.59 ± 5.14 # | 100.00 ±7.65 # | 92.86 ± 4.96 # | 100 ± 0.00 # | 100.00 ± 0.00 # |
| Item | Healthy Control | CKD 1-2 | CKD 3a | CKD 3b | CKD 4-5 | HD | PD | Tx |
|---|---|---|---|---|---|---|---|---|
| 14:0 | 1.18 ± 0.06 | 1.18 ± 0.06 | 1.26 ± 0.07 | 1.18 ± 0.08 | 1.06 ± 0.06 | 1.17 ± 0.08 | 0.98 ± 0.06 * | 1.33 ± 0.12 |
| 16:0 | 23.00 ± 0.33 | 23.04 ±0.30 | 23.64 ± 0.50 | 23.21 ± 0.30 | 23.50 ± 0.39 | 23.51 ± 0.39 | 22.79 ± 0.37 | 23.86 ± 0.45 |
| 18:0 | 7.23 ± 0.12 | 7.15 ± 0.09 | 7.12 ± 0.16 | 7.02 ± 0.16 | 6.79 ± 0.18 * | 7.04 ± 0.20 | 6.87 ± 0.18 | 6.72 ± 0.13 # |
| Other SFA | 1.57 ± 0.04 | 2.08 ± 0.09 # | 1.91 ± 0.11 # | 1.98 ± 0.11 # | 2.00 ± 0.11 # | 2.04 ± 0.10 # | 1.48 ± 0.07 | 2.27 ± 0.10 # |
| Total SFA | 32.97 ± 0.34 | 33.44 ± 0.36 | 33.93 ± 0.14 | 33.38 ± 0.44 | 33.36 ± 0.49 | 33.75 ± 0.38 | 32.12 ± 0.51 | 34.18 ± 0.57 |
| 14:1 | 0.07 ± 0.01 | 0.07 ± 0.01 | 0.08 ± 0.01 | 0.07 ± 0.01 | 0.06 ± 0.01 | 0.07 ± 0.01 | 0.05 ± 0.00 # | 0.08 ± 0.01 |
| 16:1 | 1.93 ± 0.30 | 2.80 ± 0.17 # | 2.41 ± 0.32 | 2.85 ± 0.17 # | 2.22 ± 0.35 | 2.78 ± 0.22 * | 2.76 ± 0.15 * | 3.06 ± 0.17 # |
| 18:1 | 26.04 ± 0.55 | 26.04 ± 0.47 | 25.68 ± 1.29 | 27.56 ± 0.59 | 28.57 ± 0.49 # | 29.24 ± 0.75 # | 29.81 ± 0.58 # | 28.00 ± 0.64 * |
| Other MUFA | 0.47 ± 0.02 | 0.46 ± 0.01 | 0.47 ± 0.02 | 0.51 ± 0.02 | 0.57 ± 0.07 | 0.53 ± 0.02 | 0.47 ± 0.02 | 0.53 ± 0.03 |
| Total MUFA | 29.60 ± 0.64 | 29.59 ± 0.54 | 30.39 ± 0.65 | 31.09 ± 0.62 | 32.19 ± 0.54 # | 32.81 ± 0.87 # | 33.10 ± 0.68 # | 31.67 ± 0.73 * |
| 18:3n-3 | 0.35 ± 0.02 | 0.30 ± 0.02 | 0.29 ± 0.03 | 0.27 ± 0.02 # | 0.24 ± 0.03 # | 0.20 ± 0.02 # | 0.24 ± 0.02 # | 0.21 ± 0.02 # |
| 20:5n-3 | 1.11 ± 0.13 | 0.85 ± 0.07 | 0.81 ± 0.07 | 0.77 ± 0.07 * | 0.77 ± 0.11 | 0.72 ± 0.07 * | 0.95 ± 0.05 | 0.60 ± 0.06 # |
| 22:6n-3 | 1.14 ± 0.08 | 1.01 ± 0.06 | 1.03 ± 0.08 | 1.06 ± 0.06 | 0.96 ± 0.10 | 0.92 ± 0.09 | 1.38 ± 0.08 * | 0.88 ± 0.08 * |
| Other n-3 PUFA | 0.39 ± 0.00 | 0.36 ± 0.01 | 0.34 ± 0.02 * | 0.37 ± 0.02 | 0.34 ± 0.01 # | 0.36 ± 0.01 | 0.50 ± 0.02 # | 0.32 ± 0.02 # |
| Total n-3 PUFA | 2.99 ± 0.21 | 2.52 ± 0.13 | 2.47 ± 0.15 | 2.48 ± 0.13 | 2.31 ± 0.20 * | 2.19 ± 0.16 # | 3.08 ± 0.13 | 2.01 ± 0.13 # |
| 18:2n-6 | 24.90 ± 0.64 | 25.14 ± 0.60 | 24.31 ± 0.99 | 23.85 ± 0.76 | 23.99 ± 0.95 | 22.25 ± 0.64 # | 22.73 ± 0.67 * | 24.13 ± 0.82 |
| 20:4n-6 | 5.56 ± 0.20 | 5.05 ± 0.17 | 4.93 ± 0.22 * | 5.11 ± 0.17 | 4.66 ± 0.27 # | 4.93 ± 0.25 | 5.15 ± 0.20 | 4.03 ± 0.17 # |
| Other n-6 PUFA | 1.44 ± 0.04 | 1.37 ± 0.04 | 1.30 ± 0.04 * | 1.23 ± 0.05 # | 1.10 ± 0.07 # | 1.13 ± 0.06 # | 1.43 ± 0.04 | 1.12 ± 0.04 # |
| Total n-6 PUFA | 31.90 ± 0.67 | 31.57 ± 0.67 | 30.54 ± 0.24 | 30.19 ± 0.77 | 29.72 ± 0.90 | 28.31 ± 0.72 # | 29.31 ± 0.77 * | 29.28 ± 0.91 * |
| Item | Control | CKD Stage 5 |
|---|---|---|
| 14:0 | 1.02 | 1.33 |
| 16:0 | 22.72 | 26.84 |
| 18:0 | 7.99 | 6.46 |
| Other SFA | 1.56 | 1.10 |
| Total SFA | 32.27 | 35.73 |
| 14:1 | 0.04 | 0.09 |
| 16:1 | 1.74 | 3.29 |
| 18:1 | 23.59 | 29.59 |
| Other MUFA | 0.80 | 0.62 |
| Total MUFA | 26.17 | 33.85 |
| 18:3n-3 | 0.23 | 0.20 |
| 20:5n-3 | 0.94 | 0.66 |
| 22:6n-3 | 1.17 | 0.93 |
| Other n-3 PUFA | 0.37 | 0.30 |
| Total n-3 PUFA | 2.71 | 2.09 |
| 18:2n-6 | 30.03 | 22.76 |
| 20:4n-6 | 6.03 | 4.28 |
| Other n-6 PUFA | 1.5 | 0.93 |
| Total n-6 PUFA | 37.56 | 27.97 |
© 2019 by the authors. Licensee MDPI, Basel, Switzerland. This article is an open access article distributed under the terms and conditions of the Creative Commons Attribution (CC BY) license (http://creativecommons.org/licenses/by/4.0/).
Share and Cite
Czumaj, A.; Śledziński, T.; Carrero, J.-J.; Stepnowski, P.; Sikorska-Wisniewska, M.; Chmielewski, M.; Mika, A. Alterations of Fatty Acid Profile May Contribute to Dyslipidemia in Chronic Kidney Disease by Influencing Hepatocyte Metabolism. Int. J. Mol. Sci. 2019, 20, 2470. https://doi.org/10.3390/ijms20102470
Czumaj A, Śledziński T, Carrero J-J, Stepnowski P, Sikorska-Wisniewska M, Chmielewski M, Mika A. Alterations of Fatty Acid Profile May Contribute to Dyslipidemia in Chronic Kidney Disease by Influencing Hepatocyte Metabolism. International Journal of Molecular Sciences. 2019; 20(10):2470. https://doi.org/10.3390/ijms20102470
Chicago/Turabian StyleCzumaj, Aleksandra, Tomasz Śledziński, Juan-Jesus Carrero, Piotr Stepnowski, Malgorzata Sikorska-Wisniewska, Michal Chmielewski, and Adriana Mika. 2019. "Alterations of Fatty Acid Profile May Contribute to Dyslipidemia in Chronic Kidney Disease by Influencing Hepatocyte Metabolism" International Journal of Molecular Sciences 20, no. 10: 2470. https://doi.org/10.3390/ijms20102470
APA StyleCzumaj, A., Śledziński, T., Carrero, J.-J., Stepnowski, P., Sikorska-Wisniewska, M., Chmielewski, M., & Mika, A. (2019). Alterations of Fatty Acid Profile May Contribute to Dyslipidemia in Chronic Kidney Disease by Influencing Hepatocyte Metabolism. International Journal of Molecular Sciences, 20(10), 2470. https://doi.org/10.3390/ijms20102470