Article

Gut Bacterial Communities of Dendroctonus valens and D. mexicanus (Curculionidae: Scolytinae): A Metagenomic Analysis across Different Geographical Locations in Mexico

by
Juan Alfredo Hernández-García
1,2,
Roman Gonzalez-Escobedo
1,2,
Carlos Iván Briones-Roblero
2,
Claudia Cano-Ramírez
2,
Flor N. Rivera-Orduña
3 and
Gerardo Zúñiga
2,*
1
Posgrado en Ciencias Quimicobiológicas, Escuela Nacional de Ciencias Biológicas, Instituto Politécnico Nacional, Mexico City, CP 11340, Mexico
2
Laboratorio de Variación Biológica y Evolución, Departamento de Zoología, Escuela, Nacional de Ciencias Biológicas, Instituto Politécnico Nacional, Prolongación de Carpio y Plan de Ayala s/n, Delegación Miguel Hidalgo, Mexico City, CP 11340, Mexico
3
Laboratorio de Ecología Microbiana, Departamento de Microbiología, Escuela Nacional de Ciencias Biológicas, Instituto Politécnico Nacional, Prolongación de Carpio y Plan de Ayala s/n, Delegación Miguel Hidalgo, Mexico City, CP 11340, Mexico
*
Author to whom correspondence should be addressed.
Int. J. Mol. Sci. 2018, 19(9), 2578; https://doi.org/10.3390/ijms19092578
Submission received: 7 August 2018 / Revised: 21 August 2018 / Accepted: 23 August 2018 / Published: 30 August 2018
(This article belongs to the Section Biochemistry)

Abstract

:
Dendroctonus bark beetles are a worldwide significant pest of conifers. This genus comprises 20 species found in North and Central America, and Eurasia. Several studies have documented the microbiota associated with these bark beetles, but little is known regarding how the gut bacterial communities change across host range distribution. We use pyrosequencing to characterize the gut bacterial communities associated with six populations of Dendroctonus valens and D. mexicanus each across Mexico, determine the core bacteriome of both insects and infer the metabolic pathways of these communities with Phylogenetic Investigation of Communities by Reconstruction of Unobserved States (PICRUSt) to evaluate whether these routes are conserved across geographical locations. Our results show that the β-diversity with UniFrac unweighted varies among locations of both bark beetles mainly due to absence/presence of some rare taxa. No association is found between the pairwise phylogenetic distance of bacterial communities and geographic distance. A strict intraspecific core bacteriome is determined for each bark beetle species, but these cores are different in composition and abundance. However, both bark beetles share the interspecific core bacteriome recorded previously for the Dendroctonus genus consisting of Enterobacter, Pantoea, Providencia, Pseudomonas, Rahnella, and Serratia. The predictions of metabolic pathways are the same in the different localities, suggesting that they are conserved through the geographical locations.

Graphical Abstract

1. Introduction

Dendroctonus Erichson (Curculionidae: Scolytinae) bark beetles are not only a natural inhabitant of coniferous forests but also a major pest during the periodic outbreaks in pine forests from North and Central America [1,2]. Many studies have revealed that these insects are associated with facultative microbes, and it has been demonstrated through in vitro tests, the amplification of specific gene, and sequencing technologies that some of the microbes provide benefits to bark beetles favoring their adaptation and reproductive success [3,4,5,6]. Bacteria can aid in the digestion of plant structural carbohydrates [7,8,9], nitrogen fixation and recycling [10,11,12,13], terpene detoxification [14,15,16], pheromone production [17], protection against antagonistic fungi [18,19], and mediation of carbohydrate consumption and growth of associated fungi [20].
Several studies using conventional techniques and massive parallel sequencing technologies have allowed the determination of the bacterial community structure associated with the inside (e.g., gut and mycangium) and the outside (e.g., mouthparts and cuticle) of the bark beetles body [7,12,21,22,23,24,25,26,27,28], galleries [29], and specific developmental stages of some species [30,31]. In addition, the presence of two core bacteriomes, one strict (composed by Enterobacter, Serratia, Rahnella, Pantoea, Raoultella, and Pseudomonas) and another relaxed (constituted of the strict core plus Acinetobacter, Propionibacterium, Providencia, Stenotrophomonas, Erwinia, Kluyvera, Paenibacillus, and Ralstonia) in the gut has been recently determined in different Dendroctonus species [28], which suggests that some of these taxa probably support basic metabolic processes that benefit these bark beetles.
Based on this evidence, and notwithstanding that the Dendroctonus bark beetles’ gut presumably is a heterogeneous yet limiting habitat, it is reasonable to hypothesize that the strict core bacteriome of these insects should be stable across the distribution range of species, despite the variation in the richness and evenness of the bacterial community across the geographical space. Three pieces of evidence support this idea: (1) The low bacterial diversity observed in many studies performed on bark beetles [26,27,30], and other insects with a similar diet as pine weevils [32], and cerambycids [33] with respect to those found in other phytophagous insects [34,35,36,37]; (2) The dominance of some taxa of the core bacteriome and the presence/absence of rare taxa [28]; and (3) The higher diversity of endophytic bacteria found in the pine species phloem, a substrate on which bark beetles feed, with respect to the diversity found in their gut [38].
There were two aims in this study: (1) To analyze the gut bacterial community of two bark beetle species, Dendroctonus valens LeConte and D. mexicanus Hopkins, across six different geographic localities using 16S rRNA pyrosequencing. The first species has a wide distribution in North and Central America, where it is a parasite of stumps or trees of more than 40 pine species [39,40], while the second species is found mainly in Mexico and it is an aggressive species that attacks and kills approximately 20 pine species in its distribution range [39]; (2) To infer the metabolic pathways of the entire bacterial community in each locality of these bark beetles with the Phylogenetic Investigation of Communities by Reconstruction of Unobserved States (PICRUSt) to evaluate whether these metabolic processes are conserved across the geographical space studied. Although we have some idea of the specific metabolic capacities of some bacterial species found in the bark beetles’ gut, this inference is the first approximation to know the integral functional role of the entire community, as well as to explore whether the predicted metabolic pathways are maintained across the geographic space.

2. Results

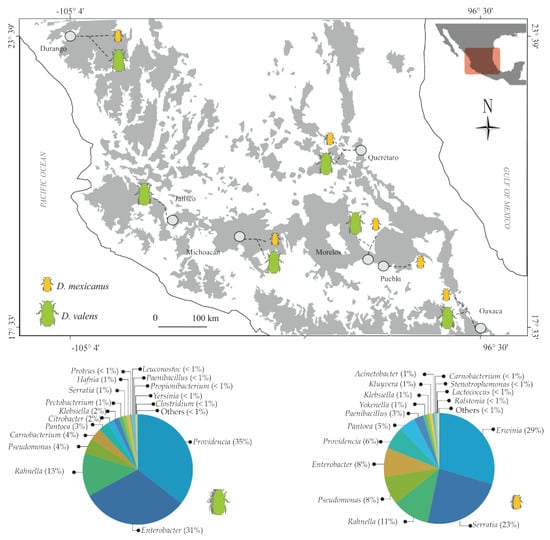
2.1. Taxonomic Analysis of Gut Bacterial Communities

A total of 155,324 and 297,425 raw reads were obtained from six localities (Figure 1, Table S1) and replicates for Dendroctonus valens and D. mexicanus, respectively. After the quality control, 86,349 reads for D. valens and 101,512 reads for D. mexicanus remained for subsequent analyses. The Good’s coverage index values were greater than 97% in all locations of both bark beetles (Table 1).
The gut bacterial communities were similar in composition and abundance among the locations of both bark beetles. The most abundant phylum in both species was Proteobacteria, followed by Firmicutes, Actinobacteria, and Deinococcus-Thermus (Figure 1). At the genus level, the most abundant were in Dendroctonus valensProvidencia (35%), Enterobacter (31%), Rahnella (13%), Pseudomonas (4%), Carnobacterium (4%), Pantoea (3%), Citrobacter (2%), Klebsiella (2%), Pectobacterium (1%), Serratia (1%), and Hafnia (1%)—while in D. mexicanus, they were Erwinia (29%), Serratia (23%), Rahnella (11%), Pseudomonas (8%), Enterobacter (8%), Providencia (6%), Pantoea (5%), Paenibacillus (3%), Klebsiella (1%), Kluyvera (1%), Acinetobacter (1%), and Yokenella (1%). Other genera with <1.0% relative abundances were found in both species (Figure 2 and Figure 3).

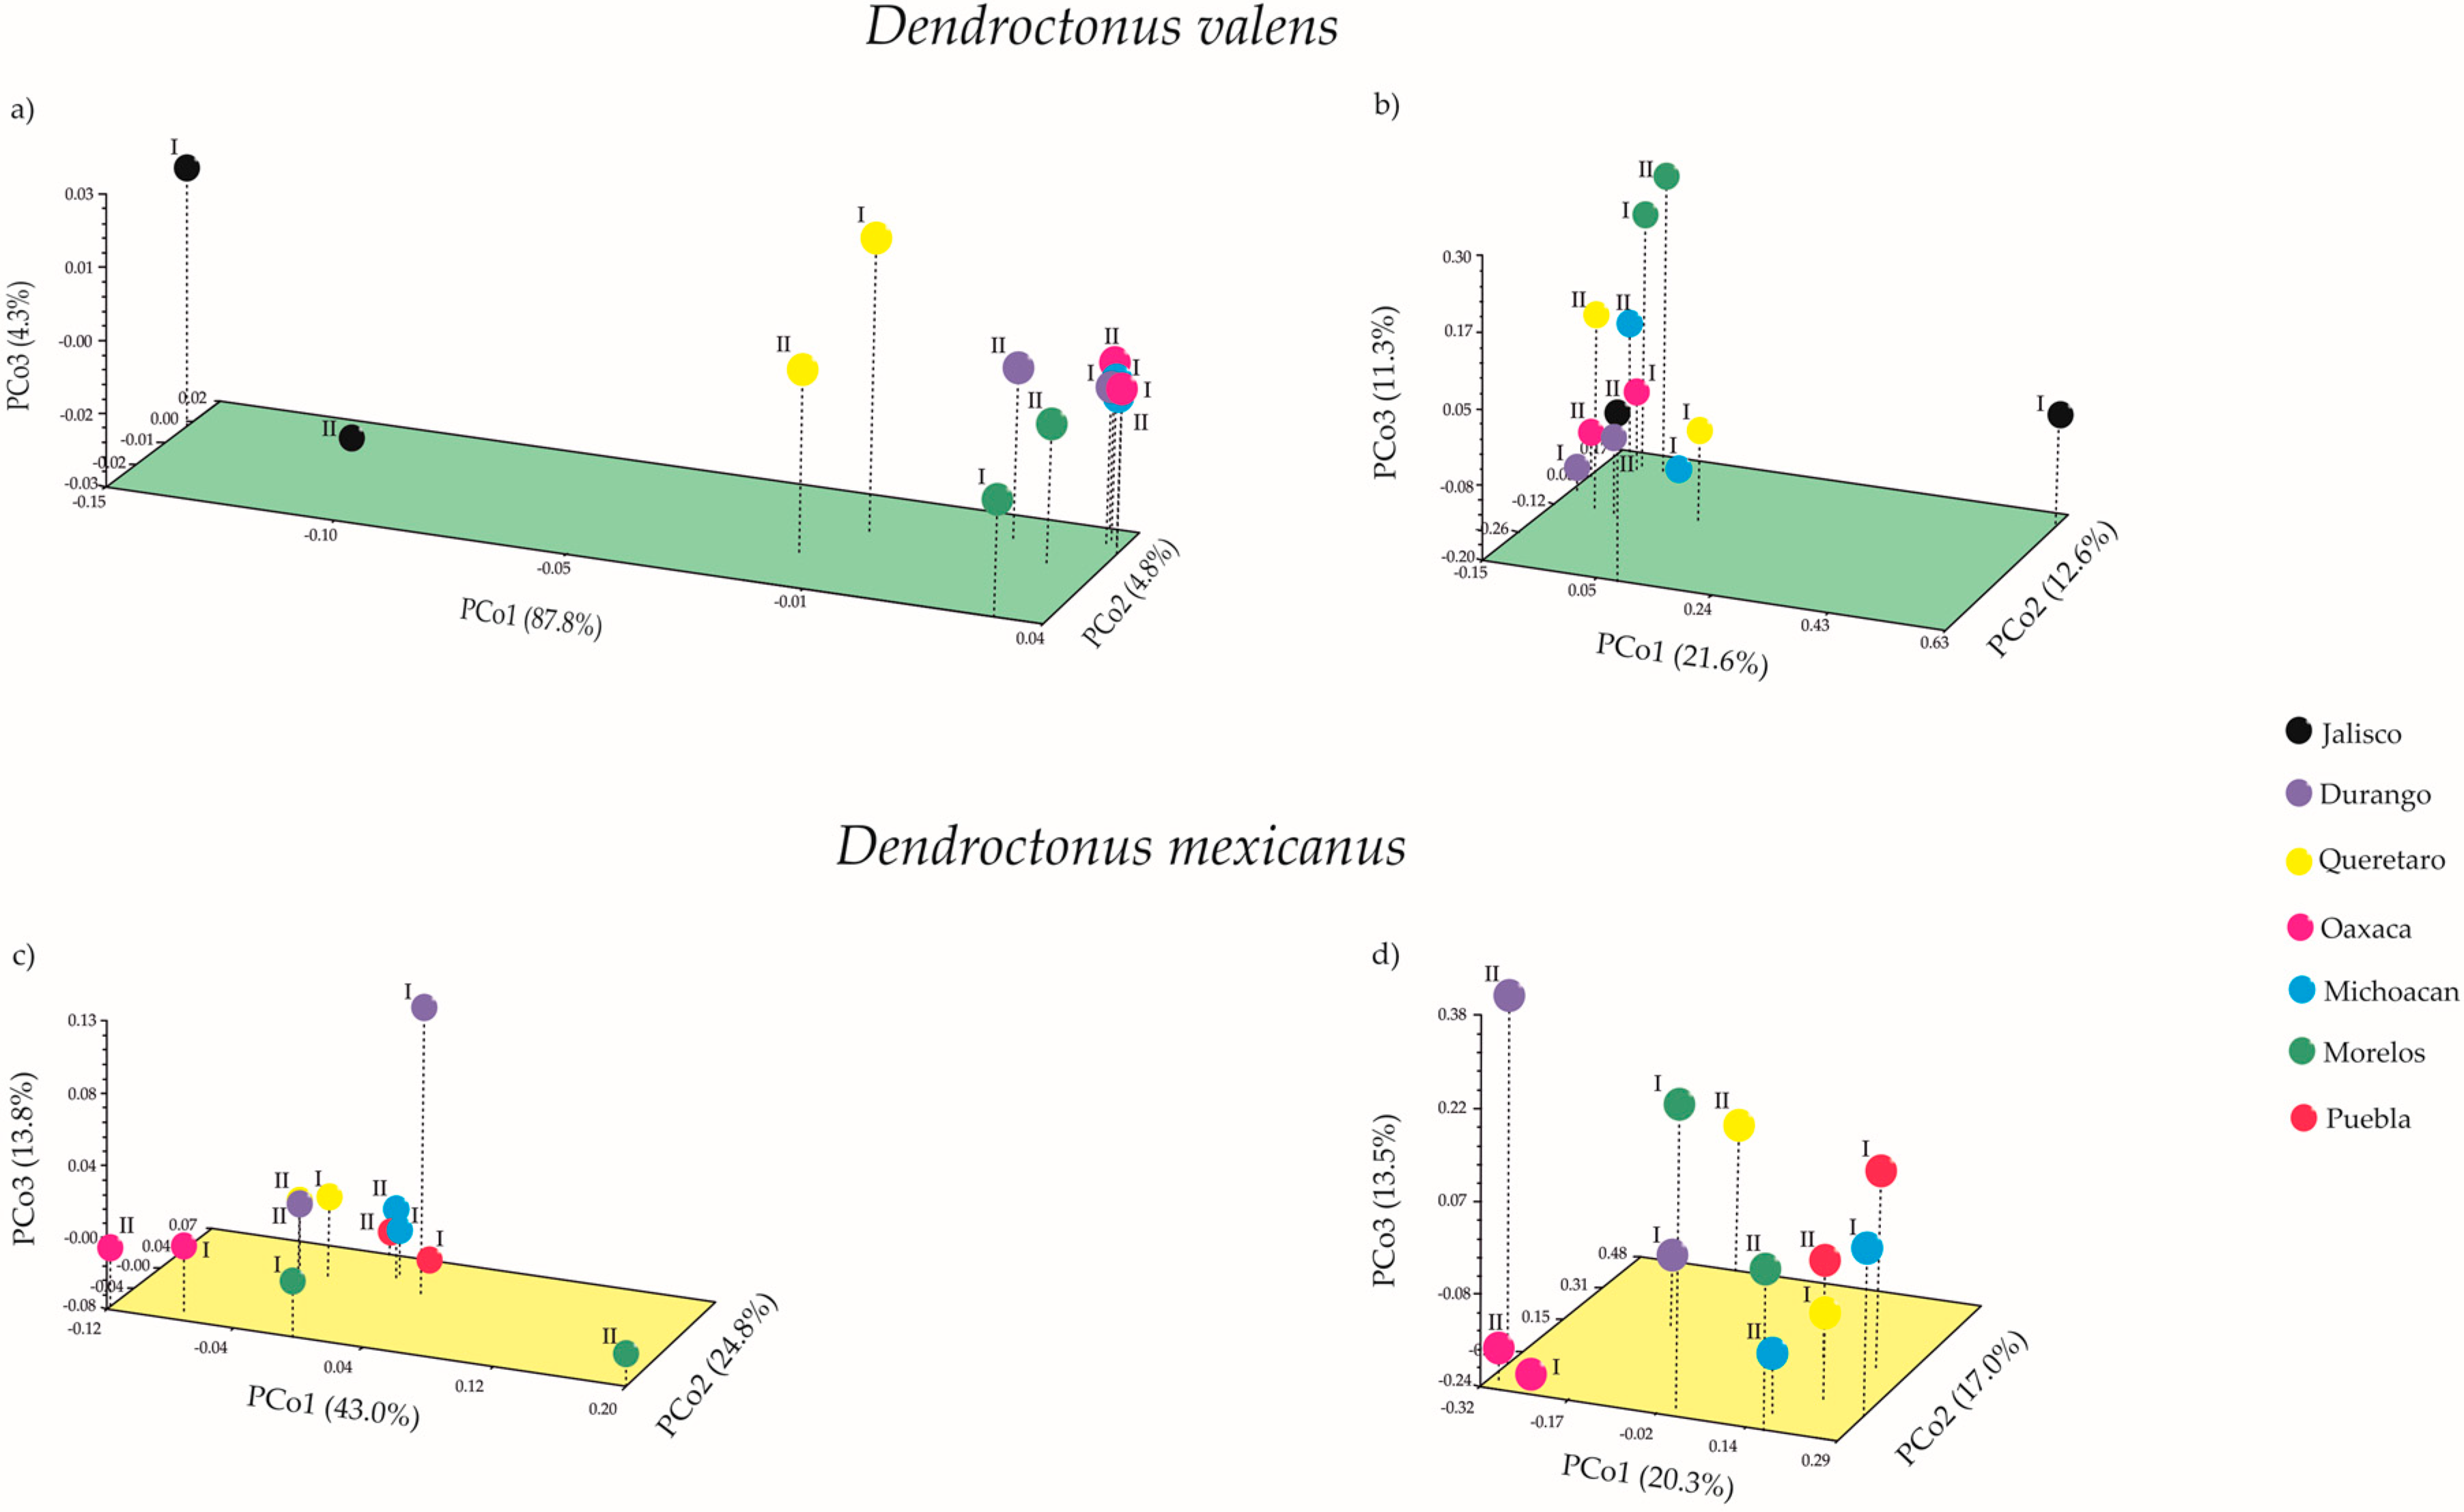
2.2. Bacterial Community Diversity

The operational taxonomic units (OTUs) richness, evenness, and overall diversity of the bacteria were similar among localities in both bark beetles, except for the Michoacan locality in Dendroctonus valens. An average of 127 and 84.5 of the observed OTUs was recorded across locations for D. valens and D. mexicanus, respectively. The higher number of OTUs was detected in Morelos I (177) and Oaxaca I (102) for D. valens and D. mexicanus, respectively (Table 1).
The values of species richness (Chao1) were not statistically different among the locations of Dendroctonus mexicanus (F Welch test: FChao1 = 1.7, p = 0.35), but whether among D. valens localities (F Welch test: FChao1 = 130.8, p = 0.003) being only different the Michoacan location (Michoacan vs. Oaxaca; p = 0.02). The values of the Shannon diversity index varied from 3.4 to 4.9 among the D. valens locations and from 2.5 to 4.0 in those of D. mexicanus. This index did not show differences among the D. mexicanus populations (F Welch test: FShannon = 0.17, p = 0.95), but whether among D. valens locations (F Welch test: FShannon = 15.9, p = 0.03) where the Michoacan locality was different to the Queretaro locality (p = 0.009). The values of the phylogenetic diversity (PD) index were not statistically different among locations of D. mexicanus (F Welch test: FPD = 0.84, p = 0.6) but whether among the D. valens locations (FPD = 16.9, p = 0.03) where the Jalisco locality was different to the Morelos (p = 0.01). Lastly, the values of the Simpson (S) index did not show statistically significant differences among locations of the D. mexicanus (F Welch test: FS = 1.5, p = 0.41) but whether among the D. valens locations (F Welch test: FS = 13.7, p = 0.04) where the Michoacan locality was different from the Queretaro (p = 0.04; Table 1).
The Dendroctonus valens localities shared a strict core bacteriome (Table S4) constituted by 10 bacterial genera, namely Citrobacter, Carnobacterium, Enterobacter, Hafnia, Klebsiella, Pantoea, Providencia, Pseudomonas, Rahnella, and Serratia, whose sequences represented 93.8% of the total reads. On the other hand, the D. mexicanus localities shared a strict core bacteriome (Table S4) constituted by eight taxa, namely Enterobacter, Erwinia, Pantoea, Pseudomonas, Providencia, Rahnella, Serratia, and Yokenella, representing 94% of the total reads. The Venn diagram built for both species based on all localities showed that only six bacterial genera—Enterobacter, Pantoea, Providencia, Pseudomonas, Rahnella, and Serratia—were shared among these bark beetles (Figure 4).
The first three coordinates of the Principal Coordinates Analysis (PCoA) in Dendroctonus valens using weighted UniFrac (wU) and unweighted UniFrac (uwU) distances explained 96.9% (PCo1—87.8%; PCo2—4.8%; PCo3—4.3%) and 45.5% (PCo1—21.6%; PCo2—12.6%; PCo3—11.3%) of the total variation, respectively (Figure 5a,b). In D. mexicanus the PCoA (wU) explained 81.6% (PCo1—43.0%; PCo2—24.8%; PCo3—13.8%) and the PCoA (uwU) 50.8% (PCo1—20.3%; PCo2—17.0%; PCo3—13.5%) of the total variation (Figure 5c,d). Significant differences were found in the bacterial β-diversity among the communities of different localities for both bark beetles using unweighted UniFrac with the Monte Carlo test (Table S2, p < 0.05). These differences were mainly due to the presence or absence of rare taxa (e.g., Turicella, Meiothermus, Exiguobacterium, Curvibacter, among others), which have a relative frequency lower than 1% (Figure 3, light colors). Meanwhile, no significant differences were found among the bacterial communities of both Dendroctonus species when the relative abundance was weighted (Table S2, p > 0.05). These significant differences in β-diversity of both Dendroctonus species were confirmed with the Adonis test using the pairwise Bray-Curtis dissimilarity matrices (D. valens p = 0.001, R2 = 0.85; D. mexicanus p = 0.006, R2 = 0.71).
Lastly, the correlation between the pairwise phylogenetic distance (wU and uwU distances) of bacterial communities and the pairwise geographical distance of locations of each bark beetle using the Mantel test were not significant at the geographical space analyzed (RMArs = 0.07–0.11, ps > 0.05, Table S3).

2.3. Prediction Roles of Gut Bacterial Communities

Based on 79,349 and 92,660 reads for Dendroctonus valens and D. mexicanus, respectively, the predictive analyzes of the microbiota in the Kyoto Encyclopedia of Genes and Genomes (KEGG) pathways at level 2 (Figure 6) revealed a total of 195 metabolic pathways for gut bacterial communities for the former species and 203 for the latter. The Nearest Sequenced Taxon Index (NSTI) values varied from 0.020 to 0.031 (0.023 ± 0.003 standard deviation, SD) in D. valens locations, whereas these varied from 0.018 to 0.13 (0.064 ± 0.041 SD) in D. mexicanus locations, indicating accurate metabolic predictions of the bacterial metagenome of both bark beetles. The heatmap, based on the whole gut bacterial communities of each bark beetle, revealed the presence of genes putatively important for amino acid, carbohydrate, and vitamin metabolism (Figure 6).
The ANOSIM test did not show statistically significant differences among metabolic pathways of bacterial communities of D. valens (R = −0.18, p > 0.05) and D. mexicanus (R = −0.23, p > 0.05) across the geographical locations.

3. Discussion

One of the poorly studied aspects about the bacterial communities in insects, including bark beetles, is whether their structure (i.e., the composition and abundance of their members) and function (metabolic pathways) change across geographic space [41,42]. Our findings show that the gut bacterial community structure of bark beetles Dendroctonus valens and D. mexicanus is apparently stable across the geographical locations, as suggested by the values of richness and diversity indices that did not show significant differences among localities, except the Michoacan location in D. valens, whose geographical distance to its nearest pair (Jalisco) is 160.2 km and to its furthest pair (Oaxaca) the 608.2 km (Figure 1).
These findings agree with those reported for the microbial communities in the pine weevil Hylobious abietis, which are similar at lower taxonomic levels (family and genus) across locations in Europe [32], but they were different from those reported for Dendroctonus valens from different geographical sites in the United States of America [23]. Whereas it is difficult to recognize the factors that can drive these differences in D. valens, some of them may be the number of insects sampled, the anatomical site analyzed (whole insects, tree host, gut, exoskeleton, mycangium), the methodology employed (molecular cloning, DGGE or Next Generation Sequencing (NGS) methodologies), and the geographical scale studied.
The Venn diagram shows that the Dendroctonus species have an intraspecific core bacteriome different in genera number (Figure 4) and relative abundance (Figure 2). However, despite these differences, they share a minimal number of genera, among which stand out Enterobacter, Pantoea, Providencia, Pseudomonas, Rahnella, and Serratia (Figure 4). This small group of bacterial genera is the same as those reported for the Dendroctonus species [28], indicating that the intraspecific core bacteriome of these bark beetles, and perhaps of each Dendroctonus species, is higher than the interspecific core bacteriome reported for Dendroctonus. Based on these results, we hypothesize that each Dendroctonus species may have a specific core bacteriome, which can include all or almost all the members of the interspecific core bacteriome known to the Dendroctonus genus [28]. This closed group may support the basic metabolic functions of these bark beetles independent of the number of localities sampled and geographical space analyzed, as reported in other studies [32].
Our findings regarding β-diversity with unweighted UniFrac show that bacterial communities of both bark beetles vary geographically. The PCoA (uwU) and heatmap (Figure 3 and Figure 5b,d) show that this variation in both bark beetles is a result of the presence or absence of rare members with low relative abundance (<1% reads), as well as due to some dominant genera. In fact, some members of the intraspecific core bacteriome of these bark beetles are not necessarily the most abundant within the community, and their relative abundance varies among locations. This same pattern in the variation of β-diversity, given by the less-frequent members, has been observed in other studies carried out in other scolytines [3,26,27,28,32].
Our Mantel test results indicate that the spatial variation of gut bacterial communities in both bark beetles is not associated with the geographic distance, suggesting that the dominant genera (>1% relative abundance), including the strict core bacteriome members of both bark beetles, are present in all the geographical localities analyzed. Our findings agree with those reported for the pine weevil Hylobius abietis [32] but not with those reported for Dendroctonus valens at a wider geographical space [23]. This difference observed in D. valens with respect to geographical distance may be explained by the different geographical distances analyzed and the statistical coverage of the techniques used. In this study, we used NGS technologies and the maximum geographical distance between the sites was 1175 km, but Adams et al. [23] used the DGGE technique, and the maximum distance between their localities was 2500 km.
The factors that influence the structure to the bacterial communities should be determined in further studies. As suggested for other insects [43,44,45] and some Dendroctonus species [21,31,46], it is possible that geographical distance is not an important factor that influences these differences, particularly considering that pine-associated endophytic bacterial communities are highly similar and independent of their geographical location [38,47,48].
In addition, it is known that the gut is a micro-environmentally heterogeneous habitat and hence limiting for many bacteria, where the prevalence or not of specific bacteria within this system is not random [49]. In the case of bark beetles’ guts, different ecological and demographic factors (e.g., interactions, competition, population growth, resource availability) may determine the presence and/or dominance of bacterial groups and mutualistic relationships between them, at least between members of the bacteriome. Moreover, when the physiological conditions in the gut of bark beetles change, the pathogenic or commensal capacities of some bacteria may be expressed in this system [50].
Independent of the absence or presence of members at low frequency, the metabolic pathways inference analyzes with PICRUSt suggest that the basic biochemical functions of the microbiota and their contribution to the host biology are apparently conserved. In fact, whereas a considerable number of functional metabolic pathways were predicted for the gut bacterial communities of both the Dendroctonus species, the most important metabolic pathways were those related to nutrition and detoxification. Of these, carbohydrate metabolism, cofactors, and vitamins, as well as the biodegradation and metabolism of terpenoids and xenobiotic compounds were the most frequent. These functions are fundamental because these bark beetles feed on a substrate rich in organic compounds, non-essential amino acids, and structural carbohydrates, such as hemicellulose and cellulose, that are not easily degraded by insects. Additionally, throughout their entire life cycle, bark beetles are in contact with plant defensive compounds, some highly toxic, such as limonene and pinene, that can cause cellular damage and kill the Dendroctonus species [51,52,53]. Lastly, future studies using metatranscriptomics are necessary to confirm these inferences based on the 16S rRNA gene because to the best of our knowledge, there are no associative studies between the taxonomy assignments using this gene and specific functional pathways or genes in the Dendroctonus species, further, the results generated from this research using next-generation sequencing could expand knowledge for the control and management of these bark beetles.

4. Materials and Methods

4.1. Insect Collection, Dissection and DNA Extraction

Emerged adults of D. valens and D. mexicanus were directly collected from naturally infested pine trees in six distinct geographical locations in Mexico during 2017 (Figure 1, Table S1). The largest geographical distance between localities was 1175 km (Durango-Oaxaca sites), and the shortest distance was 160 km (Morelos-Puebla sites). Insects were removed from their galleries using fine sterile forceps, placed in sterile polycarbonate containers with wet paper to avoid insect desiccation, stored at 4 °C for their transport, and processed immediately after arriving at the laboratory.
Two sets of 30 insects each were taken in each locality, to integrate two biological replicates for each Dendroctonus species. The insects were dissected under sterile conditions as described by Briones-Roblero et al. [9]. The last washing water was inoculated in Petri dishes with trypticase soy agar (TSA, BD, Difco, Sparks, MD, USA) inoculated with the last rinsing water and by negative Polymerase Chain Reaction (PCR) amplification of the same water to assess the efficiency of the disinfestation. The plates were incubated at 28 °C for 48–72 h. Each set of 30 guts was processed independently for DNA extraction with DNeasy Blood and Tissue Kit (Qiagen, Valencia, CA, USA) according to the manufacturer’s protocol.

4.2. Bacterial 16S rRNA Polymerase Chain Reaction Amplification and Pyrosequencing

The V1–V3 region of the 16S rRNA gene was amplified using universal primers 8F and 556R [54], fitted to 10 bp multiplex identifiers (MID) and Roche 454 adaptors for the Lib-L protocol. PCR reactions were performed in a thermal cycler Techne TC 5000 (Techne, Staffordshire, UK) in a final volume of 25 µL containing 80 ng DNA template, 1× reaction buffer, 2.0 mM MgCl2, 0.4 pM of each primer, 0.4 mM of each dNTPs, and 1.0 U of Platinum Taq DNA polymerase High Fidelity (Invitrogen™ Life Sciences, Carlsbad, CA, USA). The reaction conditions were as follows: initial denaturation at 94 °C for 5 min, 25 cycles denaturation at 94 °C for 50 s, annealing temperature 53 °C for 50 s and extension at 72 °C for 50 s, and a final extension 72 °C for 5 min.
The amplification products of three individual PCR reactions for each biological replicate were combined and purified using a QIAquick Gel Extraction kit (Qiagen, Valencia, CA, USA). The amplicons of all samples were pooled in equal volumes for pyrosequencing using a Roche GS-FLX Titanium 454 pyrosequencer (Roche, Mannheim, Germany) in Macrogen Inc. (Seoul, Korea).

4.3. Data Pyrosequencing Analysis

The data analysis was conducted using the software Quantitative Insight into Microbial Ecology (QIIME) v 1.9 (available online: http://qiime.org) [55]. All low-quality reads (Phred quality score < 25) and sequences <200 or >550 bp long containing ambiguous characters, homopolymers > 6 bp, and mismatches in primers > 1 were removed from subsequent analyzes [56].
The high-quality sequences were grouped in OTUs through the open-reference picking method at a 97% similarity threshold [57] using Uclust v 1.2.22 [58]. Chimeric sequences were identified with Chimera Slayer v 1.39.5.0 [59] and then removed from the data set. The most abundant read of each OTU was selected as a representative sequence and then aligned with the Greengenes core sequences set (available online: http://greengenes.lbl.gov/) using PyNast [60].
The taxonomic assignment from phylum to genus for representative sequences was done at a ≥ 0.8 confidence score with the Ribosomal Database Project (RDP) Classifier (available online: https://rdp.cme.msu.edu/index.jsp) to know its taxonomic identity [61]. The taxonomic assignment was manually corroborated by comparing with the closest matched sequences on three databases (RDP, GenBank, and Greengenes), the cutoff being from 97% to 100% at the genus level. A Maximum-Likelihood (ML) phylogenetic inference analysis was performed in PhyML (available online: http://atgc.lirmm.fr/phyml/), using only representative sequences at the genus level. To this analysis, these sequences were aligned in Clustal X v 2.0.10 (available online: http://www.clustal.org/clustal2/) [62] and trimmed at their 5′ and 3′ ends in SeaView v 4 (available online: ftp://pbil.univ-lyon1.fr/pub/mol_phylogeny/seaview/archive/). The best-fit model of nucleotide substitution was selected with JModeltest v 2.1.7 (available online: http://darwin.uvigo.es/our-software/) [63] based on the Akaike Information Criterion (AIC). The reliability of each node was estimated via a bootstrap analysis after 1000 pseudoreplicates. Finally, the phylogeny and heatmap of relative abundances were matched using Interactive Tree of Life (iTol) (available online: https://itol.embl.de/) [64].

4.4. Bacterial Diversity Analysis

As the amount of sequences analyzed could affect the diversity analysis, we used rarefied data running the multiple rarefaction script implemented in QIIME v 1.9 (for each sample, we calculated the number of OTUs expected to be observed for 100 reads). To determine the probability that a randomly selected amplicon from a sample was previously sequenced, the Good’s coverage was calculated as an estimator of sampling completeness [65]. Estimators of richness (Chao1), diversity (Simpson and Shannon), and phylogenetic diversity (PD) were used to determine the α-diversity in bacterial communities for each bark beetle species and biological replicates [66,67]. The normality and homogeneity of the variances of these estimators were tested with a Shapiro-Wilkinson test and F test [68]. As the diversity indices did not meet the assumptions of equal variances, those values were compared using Welch’s F test for ANOVAs and its respective post hoc multiple paired comparisons using Dunn’s test [69].
The β-diversity of gut bacterial communities among locations was estimated using unweighted (considers only phylogenetic richness) and weighted (considers both relative abundance and phylogenetic richness) Fast UniFrac distances [70], as well as the Bray-Curtis dissimilarity index [71]. The Monte Carlo method was performed to test the statistically significant differences among the bacterial communities using both Fast UniFrac distances [70], while the Adonis test was used to evaluate the differences with Bray-Curtis distances. A Principal Coordinate Analysis (PCoA) using unweighted and weighted UniFrac distances was performed in NTSYS-PC v 2.02 (Exeter Software, Setauket, New York, NY, USA) to explore multidimensional patterns of diversity variation of bacterial communities among locations [72].

4.5. Core Bacteriome

The strict core bacteriome of these bark beetles was determined according to Hernández-García et al. [28]. We, only include those bacterial genera present in all localities and their replicates, whose relative frequencies were >1%. To identify unique and shared OTUs among localities of both the Dendroctonus species, a Venn diagram was generated in Bioinformatics and Evolutionary Genomics (available online: http://bioinformatics.psb.ugent.be/webtools/Venn/).
To determine the variation of bacterial communities of each bark beetle with respect to geographical distance, a nonparametric Mantel test was used to determine the correlation between the matrix of pairwise geographic distance among localities and pairwise phylogenetic distance matrix, using both weighted and unweighted UniFrac [73]. The randomized matrices were generated by row and column permutation. The randomization was performed 5000 times to establish a 95% confidence interval [73]. However, given that the estimation and measurement of the correlation test between the geographic and phylogenetic distance matrices of bacterial communities were not free of errors, it was necessary to estimate the slope and y-intercept to find the best straight line that described this association in a confinable way. To do this, we used the reduced major axis (RMA) method and 95% confidence intervals for elements of the line that were calculated using a bootstrap test as implemented on PAST v 3.20 (available online: https://folk.uio.no/ohammer/past/) [69].

4.6. Predictive Functional Analysis Based on Metagenomic 16S rRNA Surveys

The predicted functional profiles of bacterial communities associated with the gut of D. valens and D. mexicanus of each locality were inferred with the bioinformatic tool PICRUSt [74]. The sequences from each library were demultiplexed and used to generate the OTU table in BIOM format, following a closed-reference method. Given that the ability of PICRUSt to estimate a metabolic profile relies on a set of known sequenced genomes, the OTU table was normalized and used to make a comparison with sequenced bacterial genomes deposited in the Kyoto Encyclopedia of Genes and Genomes (KEGG) [75] at hierarchical levels 2 and 3.
The obtained tables with the counts of predicted genes per sample were cleaned according to the following criteria: Removal of categories unrelated to bacterial physiology/metabolism (similar to human diseases) and removal of gene family categories with a count equal to zero. The functional predictions were plotted at the hierarchical levels 2 and 3 of KEGG. To evaluate the prediction accuracy of samples, we calculated the Nearest Sequenced Taxon Index (NSTI). The NSTI scores summarize the extent to which microorganisms in a sample are related to sequences’ genomes, and they represent the average branch length that separates each OTU from a reference bacterial genome, weighting their relative abundance in each sample [74]. Lastly, to compare whether the metabolic pathways among the gut bacterial communities of different locations of both the Dendroctonus species were different, we performed an analysis of similarity (ANOSIM) using a Gower index with 10,000 permutations in PAST v 3.20 [69].

4.7. Data Accessibility

The pyrosequencing-derived 16S rRNA gene sequence datasets were submitted to the NCBI database, under accession number of Sequence Read Archive (SRA) SRP158467.

Supplementary Materials

Supplementary Materials can be found at https://www.mdpi.com/1422-0067/19/9/2578/s1.

Author Contributions

Conceptualization, G.Z. and F.N.R.-O.; Methodology, J.A.H.-G. and C.I.B.-R.; Formal Analysis, J.A.H.-G., R.G.-E., C.I.B.-R., C.C.-R., F.N.R.-O., G.Z.; Writing—Original Draft Preparation, J.A.H.-G., F.N.R.-O., G.Z.; Writing—Review & Editing, J.A.H.-G., R.G.-E., C.I.B.-R., C.C.-R., F.N.R.-O., G.Z.; Visualization, J.A.H.-G.; Supervision, G.Z.; Funding Acquisition, G.Z. and F.N.R.-O.

Funding

This research was partially funded by Consejo Nacional de Ciencia y Tecnología (CONACyT 169494/CB2011) and Red Temática en Salud Forestal (RTSF) from CONACyT.

Acknowledgments

This work was part of J.A.H.-G. Ph.D. dissertation. J.A.H.-G., R.G.-E., C.I.B.-R. were fellows of CONACyT (369256, 275347, 227280) and of the program of Beca de Estimulo Institucional de Formación de Investigadores del Instituto Politécnico Nacional (BEIFI-IPN). We appreciate and thank the comments of anonymous reviewers.

Conflicts of Interest

The authors declare no conflict of interest.

Abbreviations

AICAkaike Information Criterion
ANOVAAnalysis of Variance
DGGEDenaturing Gradient Gel Electrophoresis
KEGGKyoto Encyclopedia of Genes and Genomes
NGSNext Generation Sequencing
NSTINearest Sequenced Taxon Index
NTSYS-PCNumerical Taxonomy and Multivariate Analysis
OTUOperational Taxonomic Unit
PCoAPrincipal Coordinate Analysis
PDPhylogenetic Diversity
PICRUStPhylogenetic Investigation of Communities by Reconstruction of Unobserved States
QIIMEQuantitative Insight into Microbial Ecology
RDPRibosomal Database Project
uwUUnweighted UniFrac
wUWeighted UniFrac

References

  1. Wood, S.L. The bark and ambrosia beetles of North and Central America (Coleoptera: Scolytidae), a taxonomic monograph. Great Basin Nat. Mem. 1982, 6, 1–1356. [Google Scholar]
  2. Bentz, B.J.; Régnière, J.; Fettig, C.J.; Hansen, E.M.; Hayes, J.L.; Hicke, J.A.; Seybold, S.J. Climate change and bark beetles of the western United States and Canada: Direct and indirect effects. BioScience 2010, 60, 602–613. [Google Scholar] [CrossRef]
  3. Six, D.L. The bark beetle holobiont: Why microbes matter. J. Chem. Ecol. 2013, 39, 989–1002. [Google Scholar] [CrossRef] [PubMed]
  4. Davis, S.T. The ecology of yeasts in the bark beetle holobiont: A century of research revisited. Microb. Ecol. 2015, 69, 723–732. [Google Scholar] [CrossRef] [PubMed]
  5. Six, D.L.; Bracewell, R. Dendroctonus. In Bark Beetles; Vega, F.E., Hofstetter, R.W., Eds.; Academic Press: San Diego, CA, USA, 2015; pp. 305–350. [Google Scholar]
  6. Hofstetter, R.W.; Dinkins-Bookwalter, J.; Davis, T.S.; Klepzig, K.D. Symbiotic associations of bark beetles. In Bark Beetles; Vega, F.E., Hofstetter, R.W., Eds.; Academic Press: San Diego, CA, USA, 2015; pp. 209–245. [Google Scholar]
  7. Morales-Jiménez, J.; Zúñiga, G.; Ramírez-Saad, H.C.; Hernández-Rodríguez, C. Gut-associated bacteria throughout the life cycle of the bark beetle Dendroctonus rhizophagus Thomas and Bright (Curculionidae: Scolytinae) and their cellulolytic activities. Microb. Ecol. 2012, 64, 268–278. [Google Scholar] [CrossRef] [PubMed]
  8. Hu, X.; Yu, J.; Wang, C.; Chen, H. Cellulolytic bacteria associated with the gut of Dendroctonus armandi larvae (Coleoptera: Curculionidae: Scolytinae). Forests 2014, 5, 455–465. [Google Scholar] [CrossRef]
  9. Briones-Roblero, C.I.; Rodríguez-Díaz, R.; Santiago-Cruz, J.A.; Zúñiga, G.; Rivera-Orduña, F.N. Degradation capacities of bacteria and yeasts isolated from the gut of Dendroctonus rhizophagus (Curculionidae: Scolytinae). Folia Microbiol. 2017, 62, 1–9. [Google Scholar] [CrossRef] [PubMed]
  10. Ayres, M.P.; Wilkens, R.T.; Ruel, J.J.; Lombardero, M.J.; Vallery, E. Nitrogen budgets of phloem-feeding bark beetles with and without symbiotic fungi. Ecology 2000, 81, 2198–2210. [Google Scholar] [CrossRef]
  11. Bridges, J.R. Nitrogen-fixing bacteria associated with bark beetles. Microb. Ecol. 1981, 7, 131–137. [Google Scholar] [CrossRef] [PubMed]
  12. Morales-Jiménez, J.; Zúñiga, G.; Villa-Tanaca, L.; Hernández-Rodríguez, C. Bacterial community and nitrogen fixation in the red turpentine beetle, Dendroctonus valens LeConte (Coleoptera: Curculionidae: Scolytinae). Microb. Ecol. 2009, 58, 879–891. [Google Scholar] [CrossRef] [PubMed]
  13. Morales-Jiménez, J.; Vera-Ponce de León, A.; García-Domínguez, A.; Martínez-Romero, E.; Zúñiga, G.; Hernández-Rodríguez, C. Nitrogen-fixing and uricolytic bacteria associated with the gut of Dendroctonus rhizophagus and Dendroctonus valens (Curculionidae: Scolytinae). Microb. Ecol. 2013, 66, 200–210. [Google Scholar] [CrossRef] [PubMed]
  14. Boone, C.K.; Keefover-Ring, K.; Mapes, A.C.; Adams, A.S.; Bohlmann, J.; Raffa, K.F. Bacteria associated with a tree-killing insect reduce concentrations of plant defense compounds. J. Chem. Ecol. 2013, 39, 1003–1006. [Google Scholar] [CrossRef] [PubMed]
  15. Adams, A.S.; Aylward, F.O.; Adams, S.M.; Erbilgin, N.; Aukema, B.H.; Currie, C.R.; Suen, G.; Raffa, K.F. Mountain pine beetles colonizing historical and naïve host trees are associated with a bacterial community highly enriched in genes contributing to terpene metabolism. Appl. Environ. Microbiol. 2013, 79, 3468–3475. [Google Scholar] [CrossRef] [PubMed]
  16. Xu, L.T.; Lu, M.; Sun, J.H. Invasive bark beetle-associated microbes degrade a host defensive monoterpene. Insect Sci. 2016, 23, 183–190. [Google Scholar] [CrossRef] [PubMed]
  17. Xu, L.; Shi, Z.; Wang, B.; Lu, M.; Sun, J.H. Pine defensive monoterpene-pinene influences the feeding behavior of Dendroctonus valens and its gut bacterial community structure. Int. J. Mol. Sci. 2016, 17, 1734. [Google Scholar] [CrossRef] [PubMed]
  18. Cardoza, Y.J.; Klepzig, K.D.; Raffa, K.F. Bacteria in oral secretions of an endophytic insect inhibit antagonistic fungi. Ecol. Entomol. 2006, 31, 636–645. [Google Scholar] [CrossRef]
  19. Scott, J.J.; Oh, D.-C.; Yuceer, M.C.; Klepzig, K.D.; Clardy, J.; Currie, C.R. Bacterial protection of beetle-fungus mutualism. Science 2008, 322, 63. [Google Scholar] [CrossRef] [PubMed]
  20. Zhou, F.; Lou, Q.; Wang, B.; Xu, L.; Cheng, C.; Lu, M.; Sun, J. Altered carbohydrates allocation by associated bacteria-fungi interactions in a bark beetle-microbe symbiosis. Sci. Rep. 2016, 6, 20135. [Google Scholar] [CrossRef] [PubMed]
  21. Vasanthakumar, A.; Delalibera, I.J.; Handelsman, J.; Klepzig, K.D.; Schloss, P.D.; Raffa, K.F. Characterization of gut-associated bacteria in larvae and adults of the southern pine beetle, Dendroctonus frontalis Zimmermann. Environ. Entomol. 2006, 35, 1710–1717. [Google Scholar] [CrossRef]
  22. Yilmaz, H.; Sezen, K.; Kati, H.; Demirbağ, Z. The first study on the bacterial flora of the European spruce bark beetle, Dendroctonus micans (Coleoptera: Scolytidae). Biologia 2006, 61, 679–686. [Google Scholar] [CrossRef]
  23. Adams, A.S.; Adams, S.M.; Currie, C.R.; Gillette, N.E.; Raffa, K.F. Geographic variation in bacterial communities associated with the red turpentine beetle (Coleoptera: Curculionidae). Environ. Entomol. 2010, 39, 406–414. [Google Scholar] [CrossRef] [PubMed]
  24. Yaman, M.; Ertürk, Ö.; Aslan, I. Isolation of some pathogenic bacteria from the great spruce bark beetle, Dendroctonus micans and its specific predator, Rhizophagus grandis. Folia Microbiol. 2010, 55, 35–38. [Google Scholar] [CrossRef] [PubMed]
  25. Muratoglu, H.; Sezen, K.; Demirbag, Z. Determination and pathogenicity of the bacterial flora associated with the spruce bark beetle, Ips typographus (L.) (Coleoptera: Curculionidae: Scolytinae). Turk. J. Biol. 2011, 35, 9–20. [Google Scholar] [CrossRef]
  26. Durand, A.A.; Bergeron, A.; Constant, P.; Buffet, J.P.; Déziel, E.; Guertin, C. Surveying the endomicrobiome and ectomicrobiome of bark beetles: The case of Dendroctonus simplex. Sci. Rep. 2015, 5, 17190. [Google Scholar] [CrossRef] [PubMed]
  27. Dohet, L.; Grégoire, J.C.; Berasategui, A.; Kaltenpoth, M.; Biedermann, P.H. Bacterial and fungal symbionts of parasitic Dendroctonus bark beetles. FEMS Microbiol. Ecol. 2016, 92, fiw129. [Google Scholar] [CrossRef] [PubMed]
  28. Hernández-García, J.A.; Briones-Roblero, C.I.; Rivera-Orduña, F.N.; Zúñiga, G. Revealing the gut bacteriome of Dendroctonus bark beetles (Curculionidae: Scolytinae): Diversity, core members and co-evolutionary patterns. Sci. Rep. 2017, 7, 13864. [Google Scholar] [CrossRef] [PubMed]
  29. Mason, C.J.; Hanshew, A.S.; Raffa, K.F. Contributions by host trees and insect activity to bacterial communities in Dendroctonus valens (Coleoptera: Curculionidae) galleries, and their high overlap with other microbial assemblages of bark beetles. Environ. Entomol. 2015, 45, 348–356. [Google Scholar] [CrossRef] [PubMed]
  30. Briones-Roblero, C.I.; Hernández-García, J.A.; Gonzalez-Escobedo, R.; Soto-Robles, L.V.; Rivera-Orduña, F.N.; Zúñiga, G. Structure and dynamics of the gut bacterial microbiota of the bark beetle, Dendroctonus rhizophagus (Curculionidae: Scolytinae) across their life stages. PLoS ONE 2017, 12, e0175470. [Google Scholar] [CrossRef] [PubMed]
  31. Hu, X.; Wang, C.; Chen, H.; Ma, J. Differences in the structure of the gut bacteria communities in development stages of the Chinese white pine beetle (Dendroctonus armandi). Int. J. Mol. Sci. 2013, 14, 21006–21020. [Google Scholar] [CrossRef] [PubMed]
  32. Berasategui, A.; Axelsson, K.; Nordlander, G.; Schmidt, A.; Borg-Karlson, A.K.; Gershenzon, J.; Terenius, O.; Kaltenpoth, M. The gut microbiota of the pine weevil is similar across Europe and resembles that of other conifer-feeding beetles. Mol. Ecol. 2016, 25, 4014–4031. [Google Scholar] [CrossRef] [PubMed]
  33. Grünwald, S.; Pilhofer, M.; Höll, W. Microbial associations in gut systems of wood-and bark-inhabiting longhorned beetles [Coleoptera: Cerambycidae]. Syst. Appl. Microbiol. 2010, 33, 25–34. [Google Scholar] [CrossRef] [PubMed]
  34. Russell, J.A.; Moreau, C.S.; Goldman-Huertas, B.; Fujiwara, M.; Lohman, D.J.; Pierce, N.E. Bacterial gut symbionts are tightly linked with the evolution of herbivory in ants. Proc. Nat. Acad. Sci. USA 2009, 106, 21236–21241. [Google Scholar] [CrossRef] [PubMed] [Green Version]
  35. Ishak, H.D.; Plowes, R.; Sen, R.; Kellner, K.; Meyer, E.; Estrada, D.A.; Dowd, S.E.; Mueller, U.G. Bacterial diversity in Solenopsis invicta and Solenopsis geminata ant colonies characterized by 16S amplicon 454 pyrosequencing. Microb. Ecol. 2011, 61, 821–831. [Google Scholar] [CrossRef] [PubMed]
  36. Waite, D.W.; Dsouza, M.; Biswas, K.; Ward, D.F.; Deines, P.; Taylor, M.W. Microbial community structure in the gut of the New Zealand insect Auckland tree weta (Hemideina thoracica). Arch. Microbiol. 2015, 197, 603–612. [Google Scholar] [CrossRef] [PubMed]
  37. Köhler, T.; Dietrich, C.; Scheffrahn, R.H.; Brune, A. High-resolution analysis of gut environment and bacterial microbiota reveals functional compartmentation of the gut in wood-feeding higher termites (Nasutitermes spp.). Appl. Environ. Microbiol. 2012, 78, 4691–4701. [Google Scholar] [CrossRef] [PubMed]
  38. Gonzalez-Escobedo, R.; Briones-Roblero, C.I.; Pineda-Mendoza, R.M.; Rivera-Orduña, F.N.; Zúñiga, G. Bacteriome from Pinus arizonica and P. durangensis: Diversity, comparison of assemblages, and overlapping degree with the gut bacterial community of a bark beetle that kills pines. Front. Microbiol. 2018, 9, 77. [Google Scholar] [CrossRef] [PubMed]
  39. Salinas-Moreno, Y.; Mendoza, G.; Barrios, M.A.; Cisneros, R.; Macías-Sámano, J.; Zúñiga, G. Areography of the genus Dendroctonus (Coleoptera: Curculionidae: Scolytinae) in Mexico. J. Biogeogr. 2004, 31, 1163–1177. [Google Scholar] [CrossRef]
  40. Owen, D.R.; Smith, S.L.; Seybold, S.J. Red turpentine beetle. In Forest Insect and Disease Leaflet 55; US Department of Agriculture: Washington, DC, USA, 2010; p. 8. [Google Scholar]
  41. Martiny, J.B.H.; Bohannan, B.J.M.; Brown, J.H.; Colwell, R.K.; Fuhrman, J.A.; Green, J.L.; Horner-Devine, M.C.; Kane, M.; Krumins, J.A.; Kuske, C.R.; et al. Microbial biogeography: Putting microorganisms on the map. Nat. Rev. Microbiol. 2006, 4, 102–112. [Google Scholar] [CrossRef] [PubMed]
  42. Hanson, C.A. Microbial biogeography. In Encyclopedia of Biodiversity, 2nd ed.; Academic Press: San Diego, CA, USA, 2013; pp. 271–279. [Google Scholar]
  43. Toju, H.; Fukatsu, T. Diversity and infection prevalence of endosymbionts in natural populations of the chestnut weevil: Relevance of local climate and host plants. Mol. Ecol. 2011, 20, 853–868. [Google Scholar] [CrossRef] [PubMed]
  44. Zouache, K.; Raharimalala, F.N.; Raquin, V.; Tran-Van, V.; Raveloson, L.H.R.; Ravelonandro, P.; Mavingui, P. Bacterial diversity of field-caught mosquitoes, Aedes albopictus and Aedes aegypti, from different geographic regions of Madagascar. FEMS Microbiol. Ecol. 2011, 75, 377–389. [Google Scholar] [CrossRef] [PubMed]
  45. Ceja-Navarro, J.A.; Vega, F.E.; Karaoz, U.; Hao, Z.; Jenkins, S.; Lim, H.C.; Kosina, P.; Infante, F.; Northen, T.R.; Brodie, E.L. Gut microbiota mediate caffeine detoxification in the primary insect pest of coffee. Nat. Commun. 2015, 6, 7618. [Google Scholar] [CrossRef] [PubMed]
  46. Xu, L.; Lou, Q.; Cheng, C.; Lu, M.; Sun, J. Gut-associated bacteria of Dendroctonus valens and their involvement in verbenone production. Microb. Ecol. 2015, 70, 1012–1023. [Google Scholar] [CrossRef] [PubMed]
  47. Redford, A.J.; Bowers, R.M.; Knight, R.; Linhart, Y.; Fierer, N. The ecology of the phyllosphere: Geographic and phylogenetic variability in the distribution of bacteria on tree leaves. Environ. Microbiol. 2010, 12, 2885–2893. [Google Scholar] [CrossRef] [PubMed]
  48. Carrell, A.A.; Carper, D.L.; Frank, A.C. Subalpine conifers in different geographical locations host highly similar foliar bacterial endophyte communities. FEMS Microbiol. Ecol. 2016, 92, fiw124. [Google Scholar] [CrossRef] [PubMed]
  49. Engel, P.; Moran, N.A. The gut microbiota of insects—Diversity in structure and function. FEMS Microbiol. Rev. 2013, 37, 699–735. [Google Scholar] [CrossRef] [PubMed]
  50. Winder, R.S.; Macey, D.E.; Cortese, J. Dominant bacteria associated with broods of mountain pine beetle, Dendroctonus ponderosae (Coleoptera: Curculionidae, Scolytinae). J. Entomol. Soc. BC 2010, 107, 43–56. [Google Scholar]
  51. Smith, R.H. Toxicity of pine resin vapors to three species of Dendroctonus bark beetles. J. Econ. Entomol. 1963, 56, 827–831. [Google Scholar] [CrossRef]
  52. López, M.F.; Cano-Ramírez, C.; Shibayama, M.G.; Zúñiga, G. α-pinene and myrcene induce ultrastructural change in the midgut of Dendroctonus valens (Coleoptera: Curculionidae: Scolytinae). Ann. Entomol. Soc. Am. 2011, 104, 553–561. [Google Scholar] [CrossRef]
  53. Chiu, C.C.; Keeling, C.I.; Bohlmann, J. Toxicity of pine monoterpenes to mountain pine beetle. Sci. Rep. 2017, 7, 8858. [Google Scholar] [CrossRef] [PubMed]
  54. Navarro-Noya, Y.E.; Suárez-Arriaga, M.C.; Rojas-Valdes, A.; Montoya-Ciriaco, N.M.; Gómez-Acata, S.; Fernández-Luqueño, F.; Dendooven, L. Pyrosequencing analysis of the bacterial community in drinking water wells. Microb. Ecol. 2013, 66, 19–29. [Google Scholar] [CrossRef] [PubMed]
  55. Caporaso, J.G.; Kuczynski, J.; Stombaugh, J.; Bittinger, K.; Bushman, F.D.; Costello, E.K.; Fierer, N.; Pena, A.G.; Goodrich, J.K.; Gordon, J.I.; et al. QIIME allows analysis of high-throughput community sequencing data. Nat. Methods 2010, 7, 335–336. [Google Scholar] [CrossRef] [PubMed] [Green Version]
  56. Reeder, J.; Knight, R. Rapid denoising of pyrosequencing amplicon data: Exploiting the rank-abundance distribution. Nat. Methods 2010, 7, 668–669. [Google Scholar] [CrossRef] [PubMed]
  57. Navas-Molina, J.A.; Peralta-Sánchez, J.M.; González, A.; McMurdie, P.J.; Vázquez-Baeza, Y.; Xu, Z.; Ursell, L.K.; Lauber, C.; Zhou, H.; Song, S.J.; et al. Advancing our understanding of the human microbiome using QIIME. Meth. Enzymol. 2013, 531, 371–444. [Google Scholar] [CrossRef] [PubMed]
  58. Edgar, R.C. Search and clustering orders of magnitude faster than BLAST. Bioinformatics 2010, 26, 2460–2461. [Google Scholar] [CrossRef] [PubMed] [Green Version]
  59. Haas, B.J.; Gevers, D.; Earl, A.M.; Feldgarden, M.; Ward, D.V.; Giannoukos, G.; Ciulla, D.; Tabbaa, D.; Highlander, S.K.; Sodergren, E.; et al. Chimeric 16S rRNA sequence formation and detection in sanger and 454-pyrosequenced PCR amplicons. Genome Res. 2011, 21, 494–504. [Google Scholar] [CrossRef] [PubMed]
  60. Caporaso, J.G.; Bittinger, K.; Bushman, F.D.; DeSantis, T.Z.; Andersen, G.L.; Knight, R. PyNAST: A flexible tool for aligning sequences to a template alignment. Bioinformatics 2010, 26, 266–267. [Google Scholar] [CrossRef] [PubMed]
  61. Wang, Y.; Gilbreath, T.M.; Kukutla, P.; Yan, G.; Xu, J. Dynamic gut microbiome across life history of the malaria mosquito Anopheles gambiae in Kenya. PLoS ONE 2011, 6, e24767. [Google Scholar] [CrossRef] [PubMed]
  62. Thompson, J.D.; Gibson, T.J.; Plewniak, F.; Jeanmougin, F.; Higgins, D.G. The CLUSTAL_X windows interface: Flexible strategies for multiple sequence alignment aided by quality analysis tools. Nucleic Acids Res. 1997, 25, 4876–4882. [Google Scholar] [CrossRef] [PubMed]
  63. Darriba, D.; Taboada, G.L.; Doallo, R.; Posada, D. jModelTest 2: More models, new heuristics and parallel computing. Nat. Methods 2012, 9, 772. [Google Scholar] [CrossRef] [PubMed]
  64. Letunic, I.; Bork, P. Interactive tree of life (iTOL) v3: An online tool for the display and annotation of phylogenetic and other trees. Nucleic Acids Res. 2016, 44, W242–W245. [Google Scholar] [CrossRef] [PubMed]
  65. Chao, A.; Lee, S.M.; Chen, T.C.A. A generalized Good’s nonparametric coverage estimator. Chin. J. Math. 1988, 16, 189–199. [Google Scholar]
  66. Magurran, A.E. Ecological Diversity and Its Measurement; Princeton University Press: Princeton, NJ, USA, 1988. [Google Scholar]
  67. Faith, D.P.; Baker, A.M. Phylogenetic diversity (PD) and biodiversity conservation: Some bioinformatics challenges. Evol. Bioinform. 2007, 2, 121–128. [Google Scholar] [CrossRef]
  68. Zar, J.H. Biostatistical Analysis; Prentice-Hall: Upper Saddle River, NJ, USA, 2010. [Google Scholar]
  69. Hammer, Ø.; Harper, D.A.T.; Ryan, P.D. PAST: Paleontological statistics software package for education and data analysis. Palaeontol. Electron. 2001, 4, 1–9. [Google Scholar]
  70. Lozupone, C.; Lladser, M.E.; Knights, D.; Stombaugh, J.; Knight, R. UniFrac: An effective distance metric for microbial community comparison. ISME J. 2011, 5, 169–172. [Google Scholar] [CrossRef] [PubMed]
  71. Bray, J.R.; Curtis, J.T. An Ordination of the upland forest community of southern Wisconsin. Ecol. Monogr. 1957, 27, 325–349. [Google Scholar] [CrossRef]
  72. Rohlf, F.J. NTSYSpc Numerical Taxonomy and Multivariate Analysis System Version 2.0 User Guide; Applied Biostatistics Inc.: East Setauket, NY, USA, 1997. [Google Scholar]
  73. Manly, B.F.J. Randomization, Bootstrap and Monte Carlo Methods in Biology 2; Chapman & Hall: London, UK, 1997. [Google Scholar]
  74. Langille, M.G.I.; Zaneveld, J.; Caporaso, J.G.; McDonald, D.; Knights, D.; Reyes, J.A.; Clemente, J.C.; Burkepile, D.E.; Thurber, R.L.V.; Knight, R.; et al. Predictive functional profiling of microbial communities using 16S rRNA marker gene sequences. Nat. Biotechnol. 2013, 31, 814–821. [Google Scholar] [CrossRef] [PubMed] [Green Version]
  75. Kanehisa, M.; Goto, S.; Sato, Y.; Furumichi, M.; Tanabe, M. KEGG for integration and interpretation of large-scale molecular data sets. Nucleic Acids Res. 2011, 40, 109–114. [Google Scholar] [CrossRef] [PubMed]
Figure 1. Locations studied of the Dendroctonus valens (green) and D. mexicanus (orange). Grey dot = sampled localities; dot line = collected species.
Ijms 19 02578 g001
Figure 2. Relative abundances of the most abundant taxa of the gut at phylum, class, family, and genus levels: (a) Dendroctonus valens, (b) D. mexicanus.
Ijms 19 02578 g002
Figure 3. Heatmap of representative sequences of operational taxonomic units (OTUs) of Dendroctonus valens and D. mexicanus in different localities. The range of colors indicates the OTUs relative abundance for each sample; dark colors indicate higher abundance and light ones lower abundance.
Ijms 19 02578 g003
Figure 4. Venn diagram representing unique and shared taxa present in all localities between Dendroctonus valens and D. mexicanus.
Ijms 19 02578 g004
Figure 5. Principal coordinates analysis (PCoA) of bacterial communities of Dendroctonus valens (a,b) and D. mexicanus (c,d) using weighted and unweighted UniFrac distances, respectively. I = replicate one; II = replicate two.
Ijms 19 02578 g005
Figure 6. Heatmap of PICRUSt-inferred genes of bacterial communities of Dendroctonus valens and D. mexicanus. The range of colors indicates the relative abundance of metabolic pathways for each sample. Dark colors (green and yellow) indicate higher abundance and light (orange and red) ones lower abundance. The dendrogram shows the dissimilarities between the potential metabolic pathways of different bacterial communities clustered in KEGG 2 level. The relative abundance of the most important metabolic pathways in the KEGG 1 level on a log10 scale is shown below the heatmap figure.
Ijms 19 02578 g006
Table 1. Summary of pyrosequencing data and alpha diversity of Dendroctonus valens and D. mexicanus.
LabelNo. of High Quality ReadsObserved OTUs97Richness and Diversity IndexGood’s Coverage
Chao1PD *ShannonSimpsonSimpson−1
D. valens
Oaxaca I83001182325.203.60.8667.50.973
Oaxaca II27031152344.733.70.8727.80.974
Queretaro I64031733715.644.70.93014.30.960
Queretaro II13,3051583645.794.90.94417.80.965
Morelos I11,5891743906.514.60.91611.90.961
Morelos II58151533276.504.20.8969.60.966
Jalisco I13,459871183.113.60.8516.70.986
Jalisco II37131643144.944.50.8999.90.965
Durango I84091092244.683.40.8346.00.975
Durango II47231582515.414.20.8989.80.968
Michoacan I34611002684.133.40.8597.10.975
Michoacan II44691171965.593.50.8617.20.975
D. mexicanus
Oaxaca I7310951433.684.00.8999.90.981
Oaxaca II683660952.272.50.7484.00.988
Queretaro I4436911663.192.80.6492.80.981
Queretaro II3589731041.953.30.7894.70.989
Morelos I37,466731842.822.50.6232.70.982
Morelos II4444951634.473.70.8285.80.980
Puebla I4681871202.913.00.7413.90.983
Puebla II290672892.663.00.7433.90.989
Durango I16,022821392.953.00.7754.40.984
Durango II578665832.103.20.7984.90.990
Michoacan I35891021543.422.90.6412.80.980
Michoacan II4447971254.143.50.7704.30.985
* PD: Phylogenetic Diversity.

