Innovative Approach of Non-Thermal Plasma Application for Improving the Growth Rate in Chickens

 ,
,  , , ,
, , ,  and
and
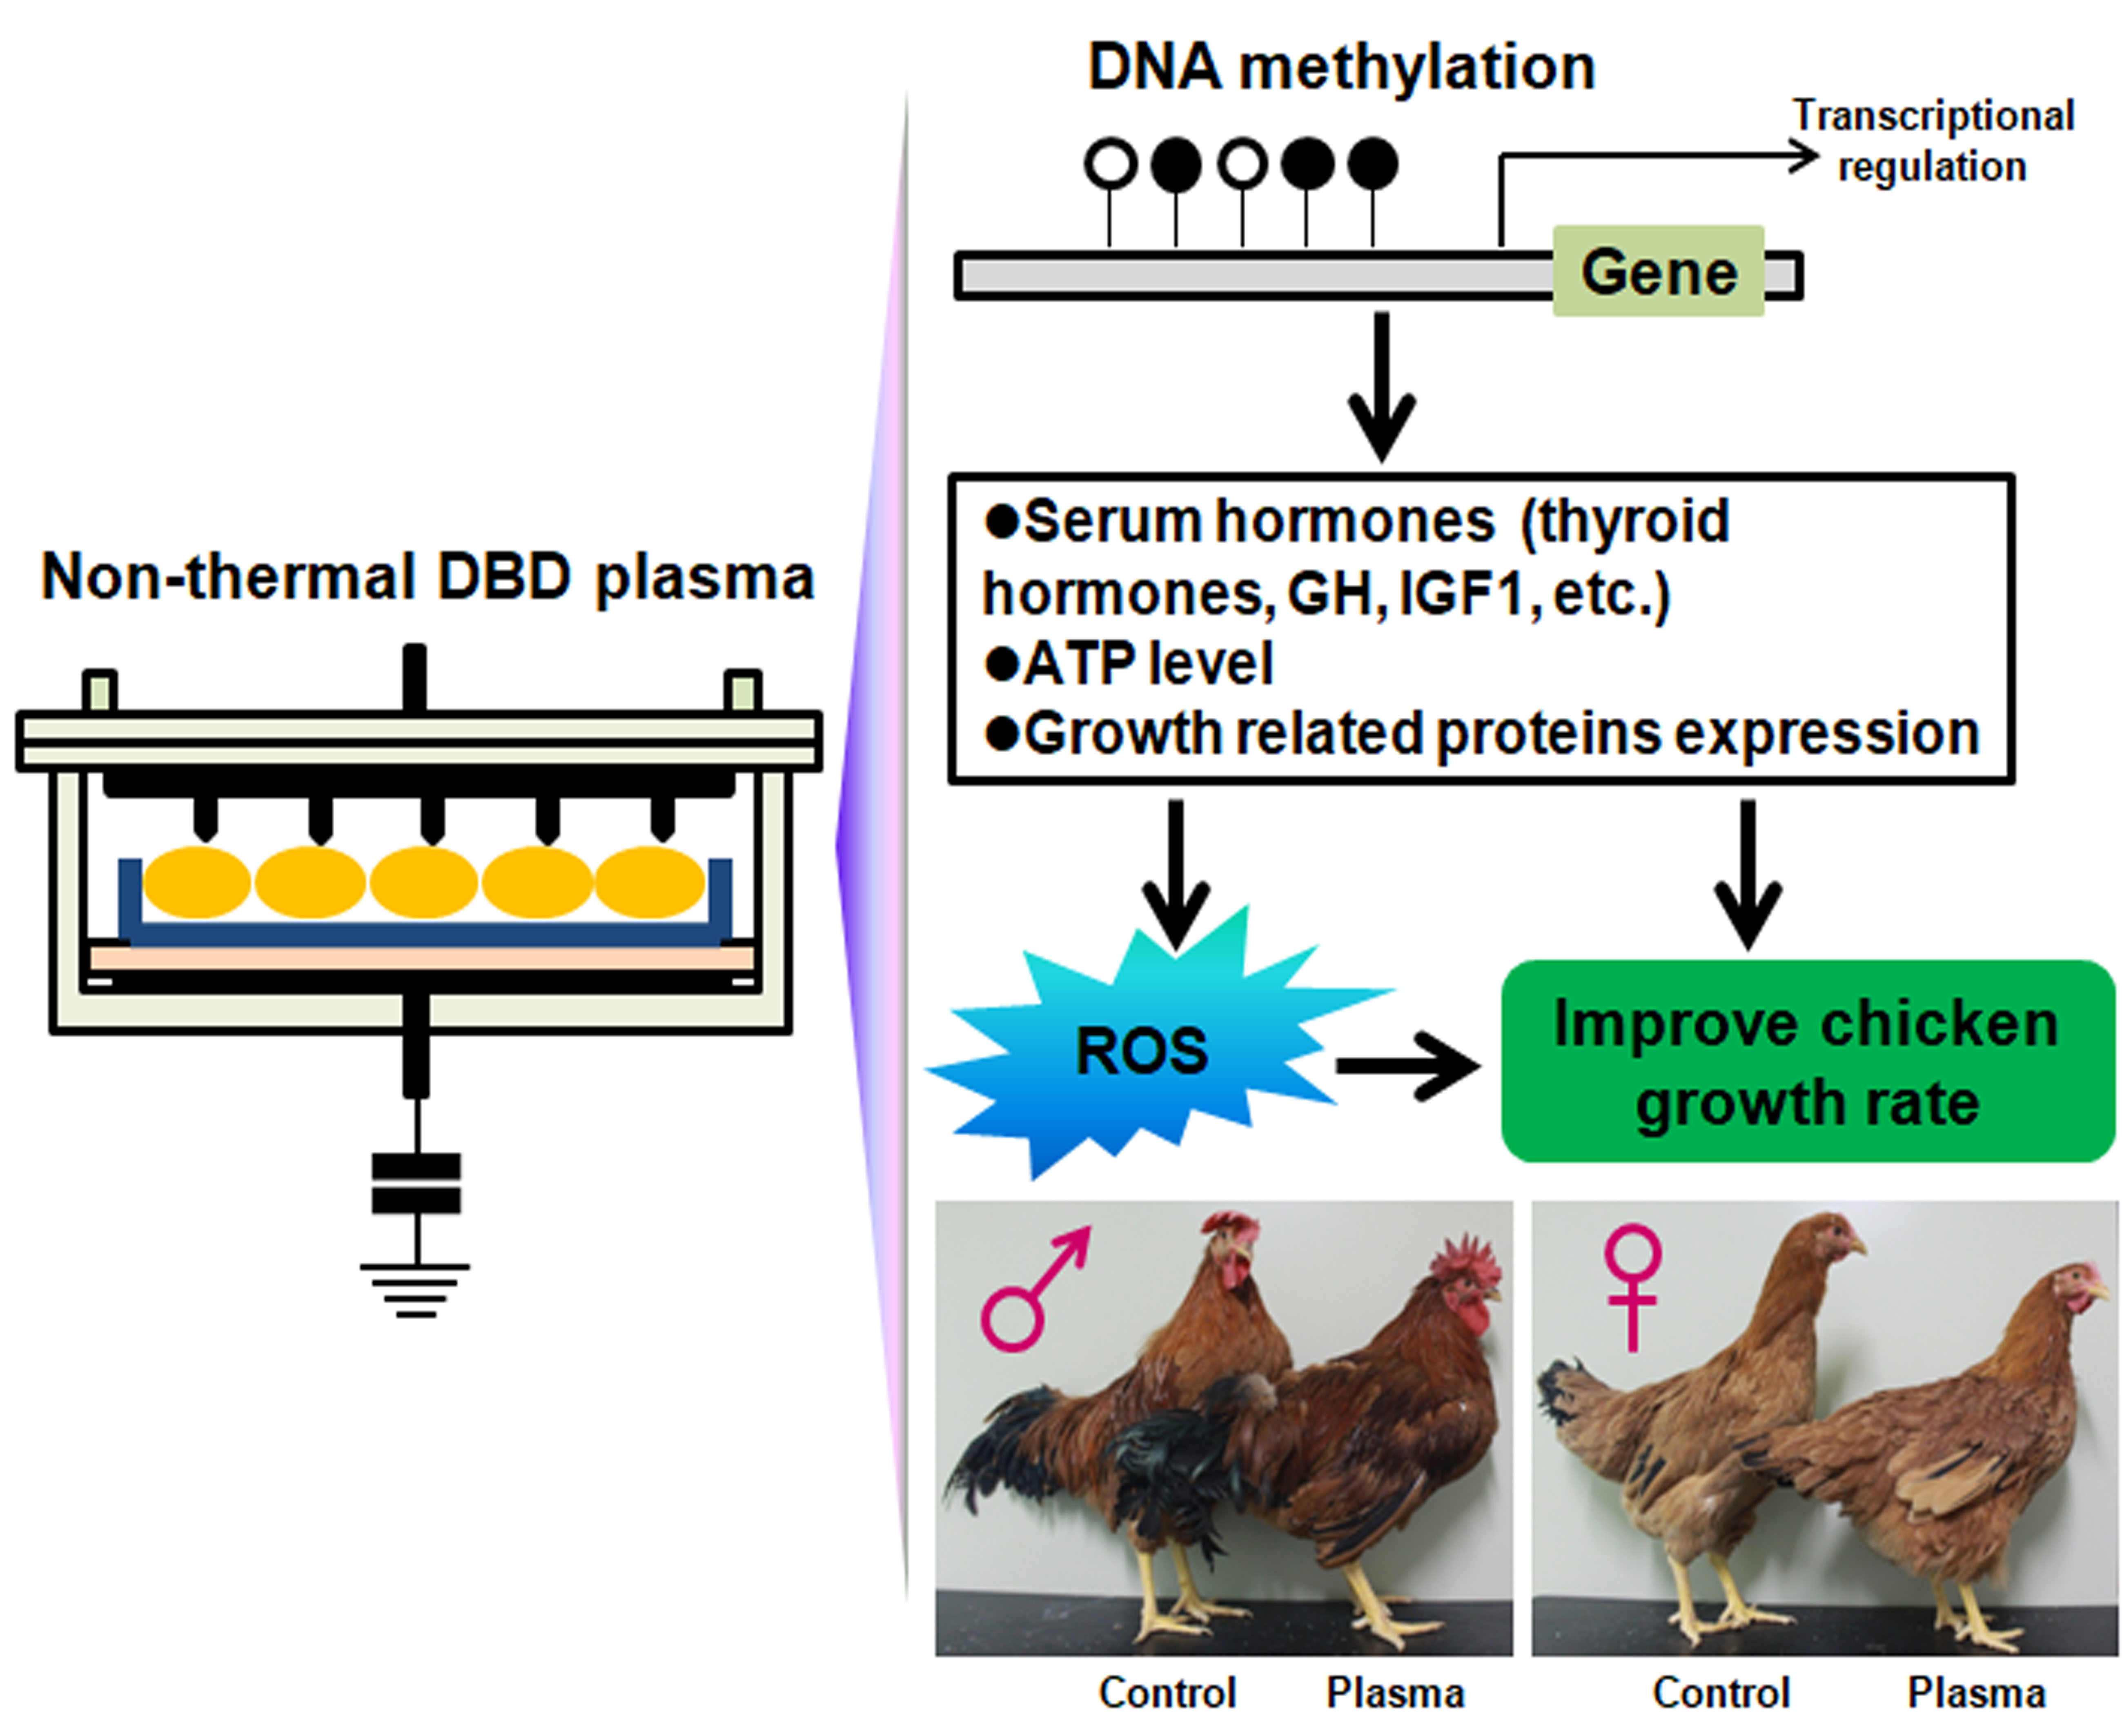
Abstract

1. Introduction
2. Results
2.1. Optimization of Plasma Treatment Condition on the Chicken Growth
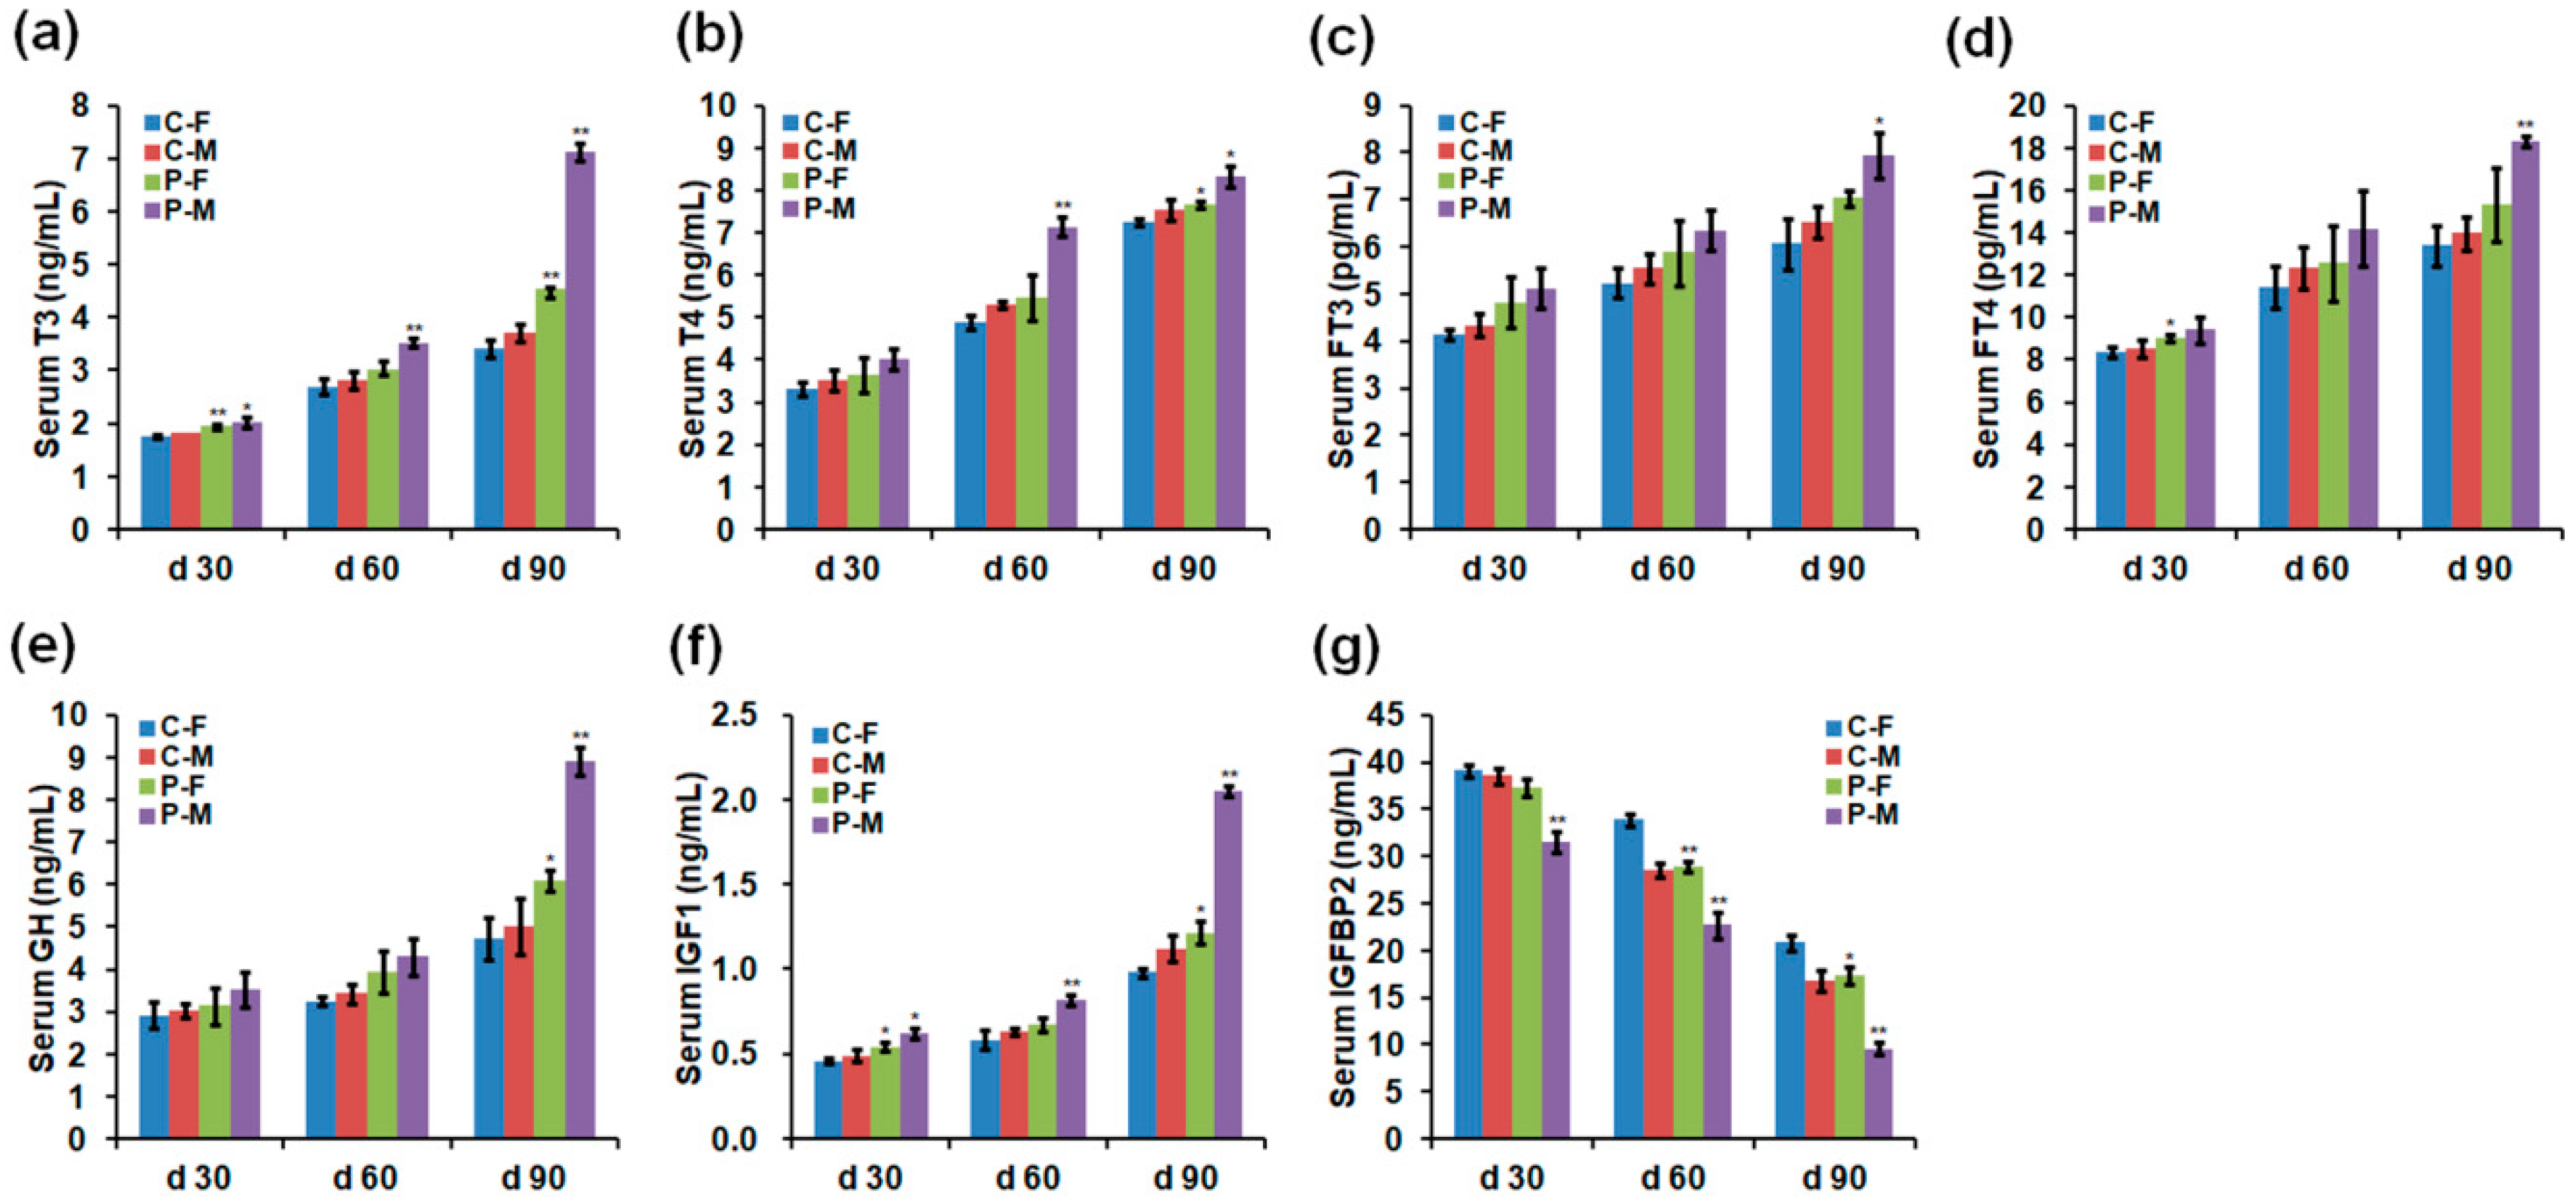
2.2. Chicken Serum Hormone Levels
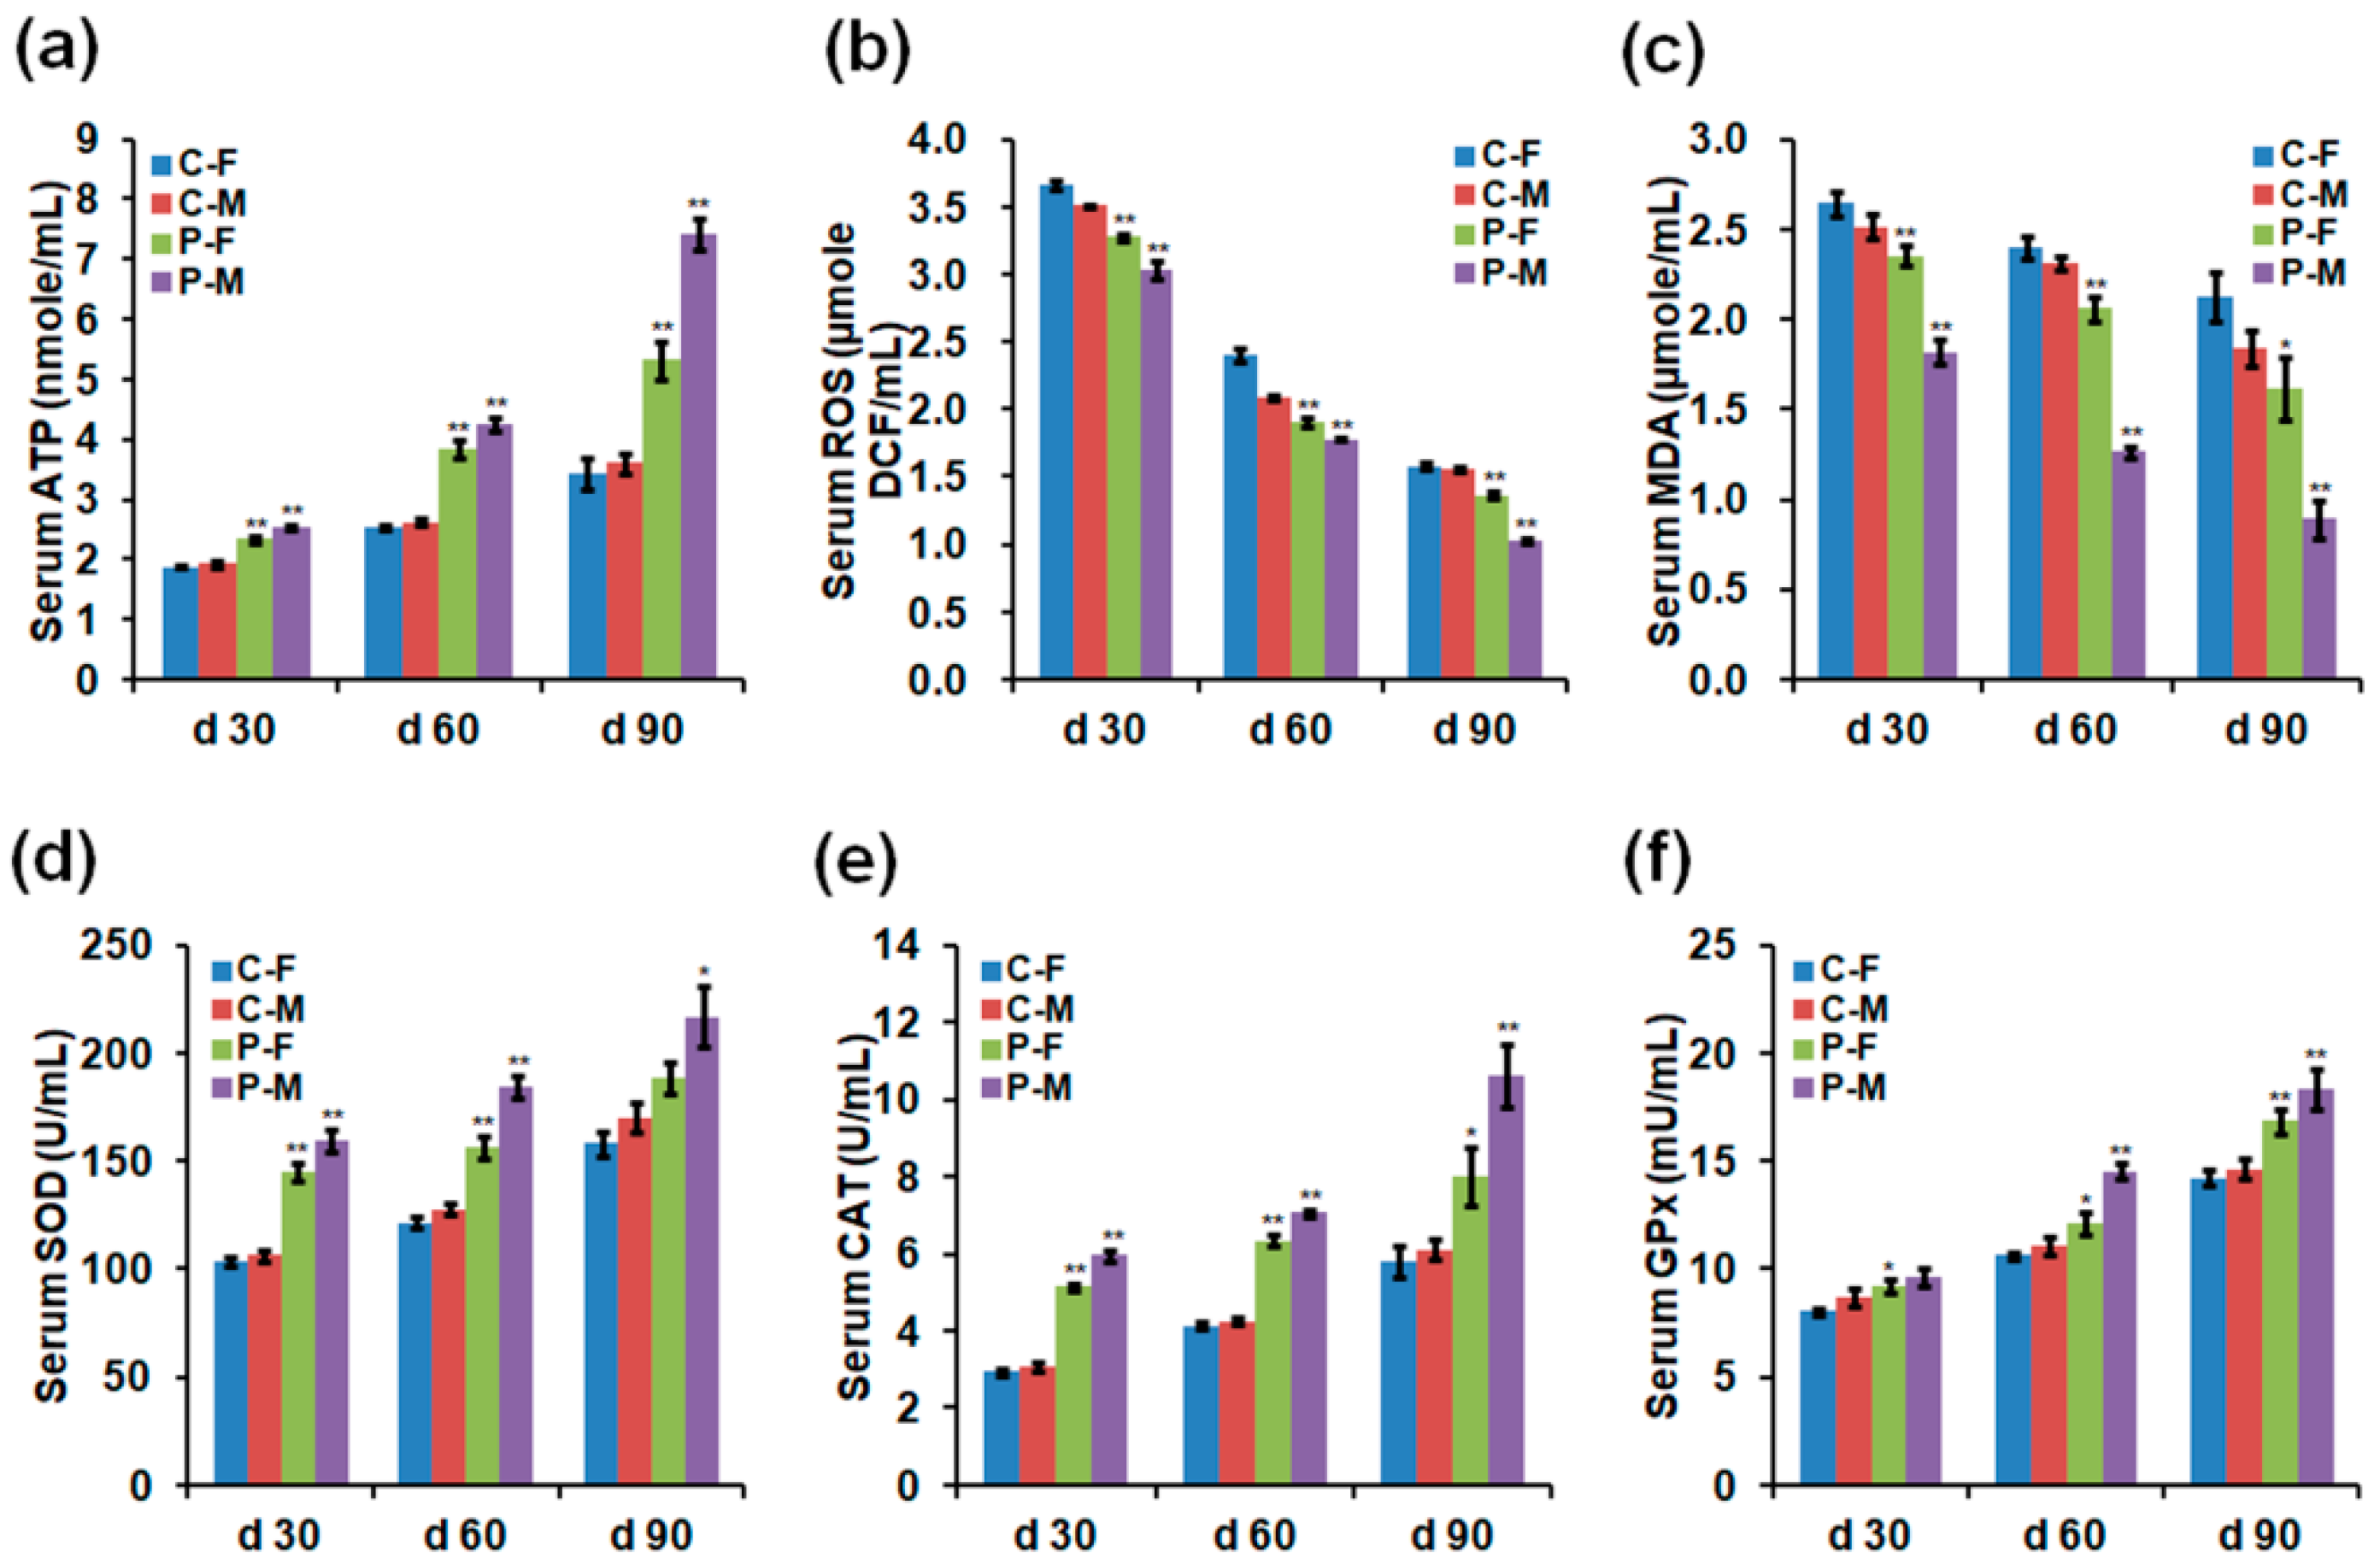
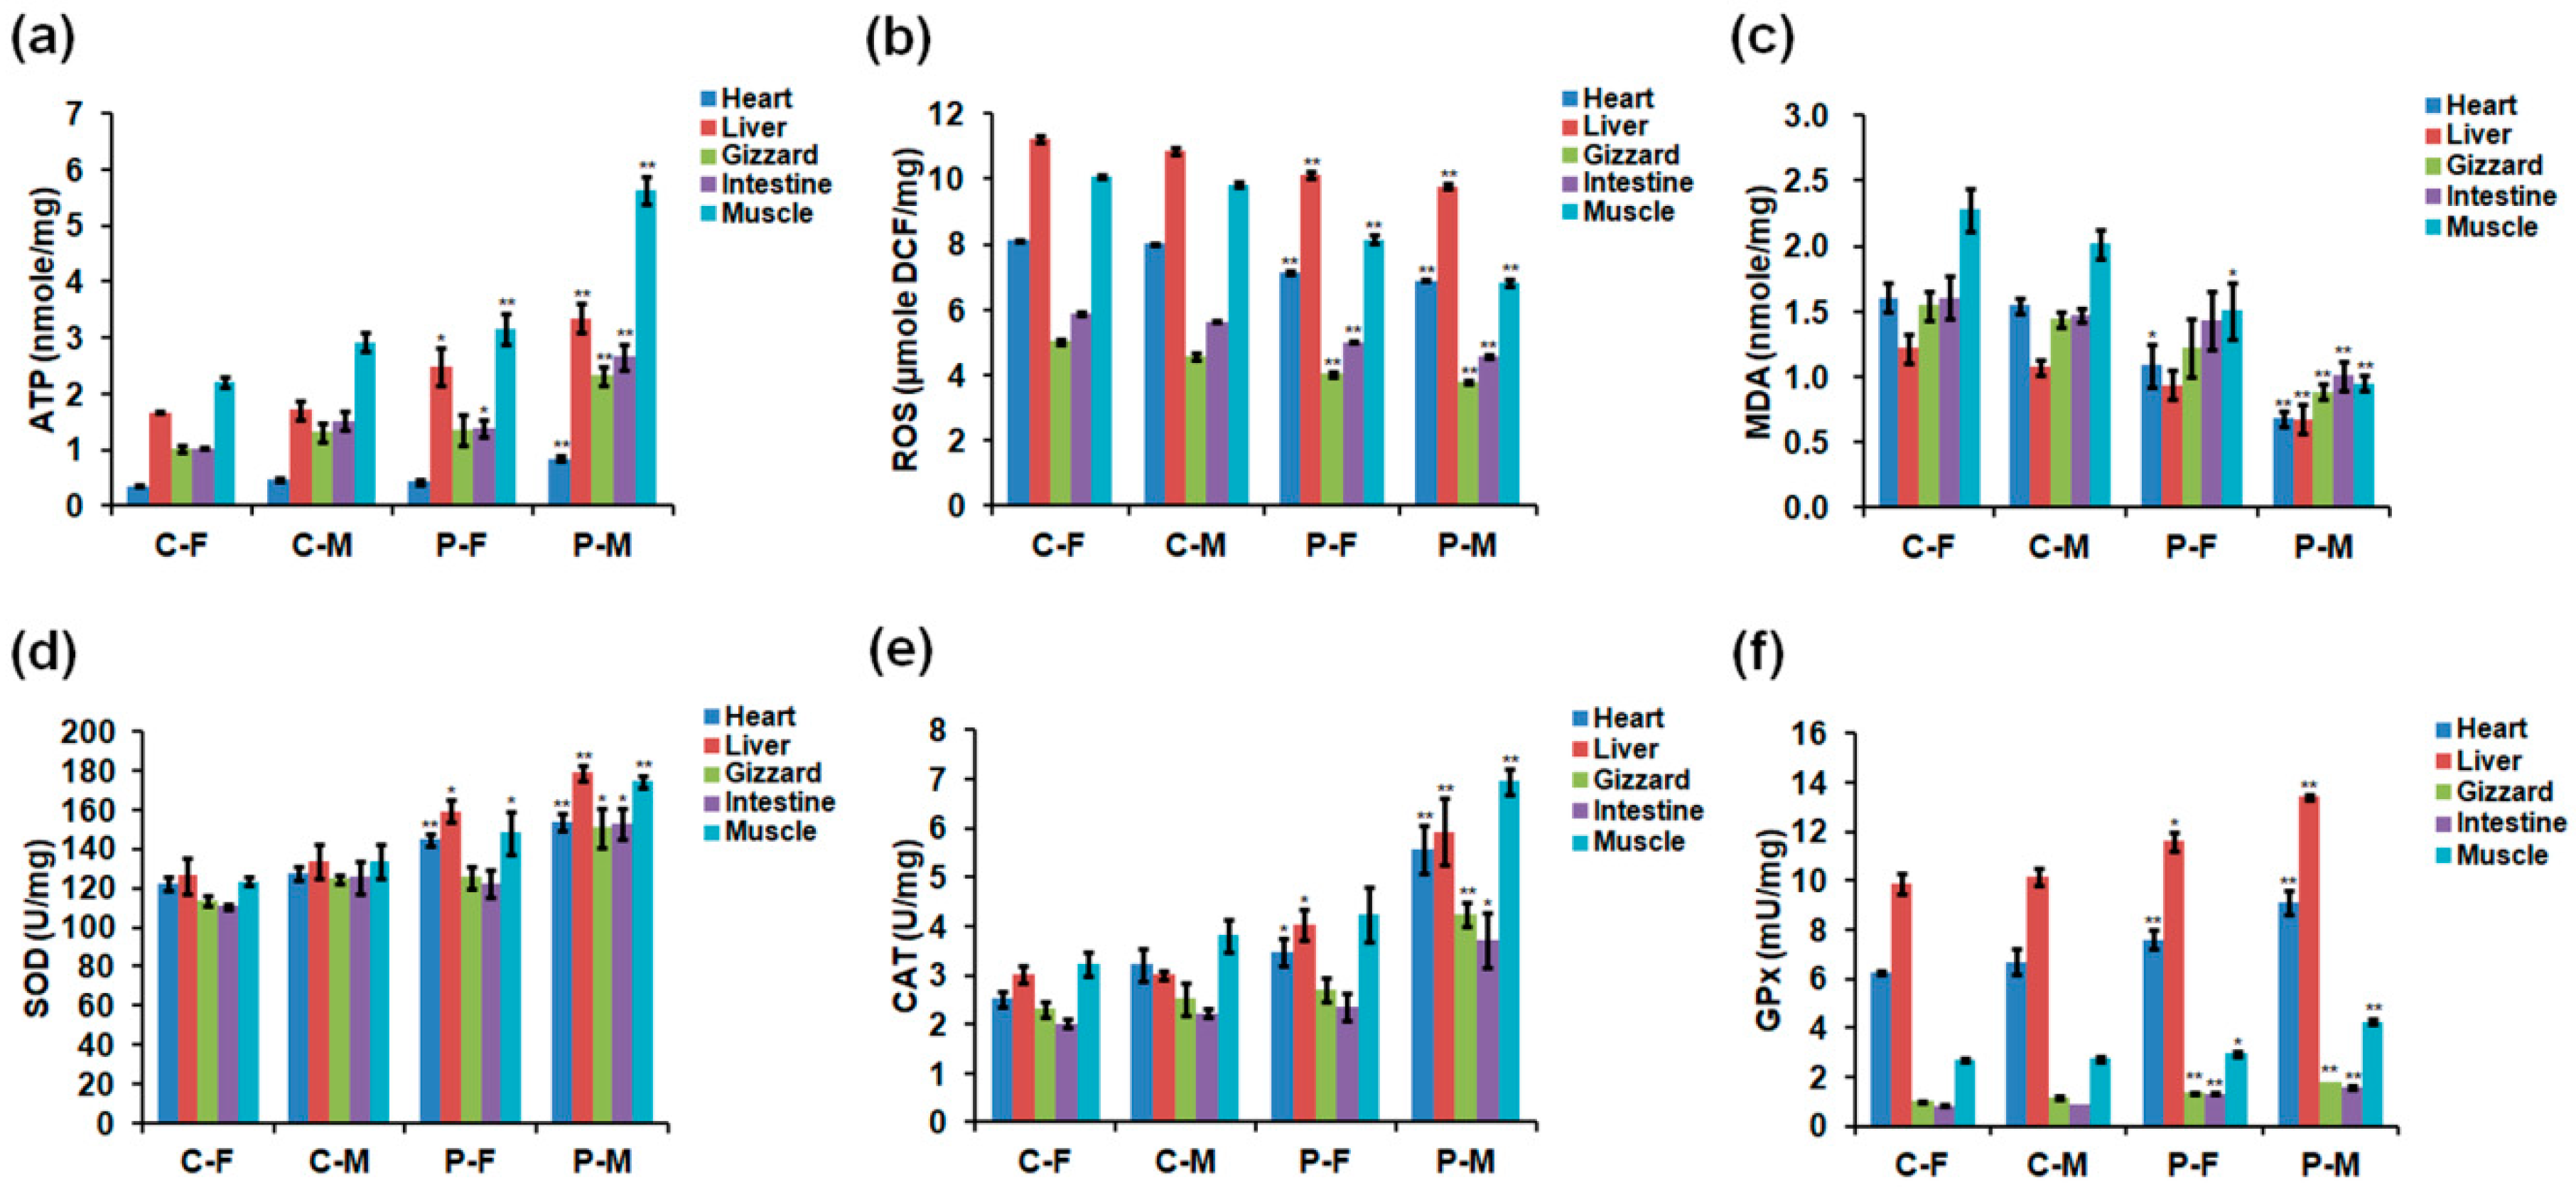
2.3. Adenosine Triphosphate (ATP), ROS, and Antioxidant Enzyme Levels
2.4. Ultrastructure of Skeletal Muscles and Mitochondrial Respiratory Enzyme Levels in Male Chickens
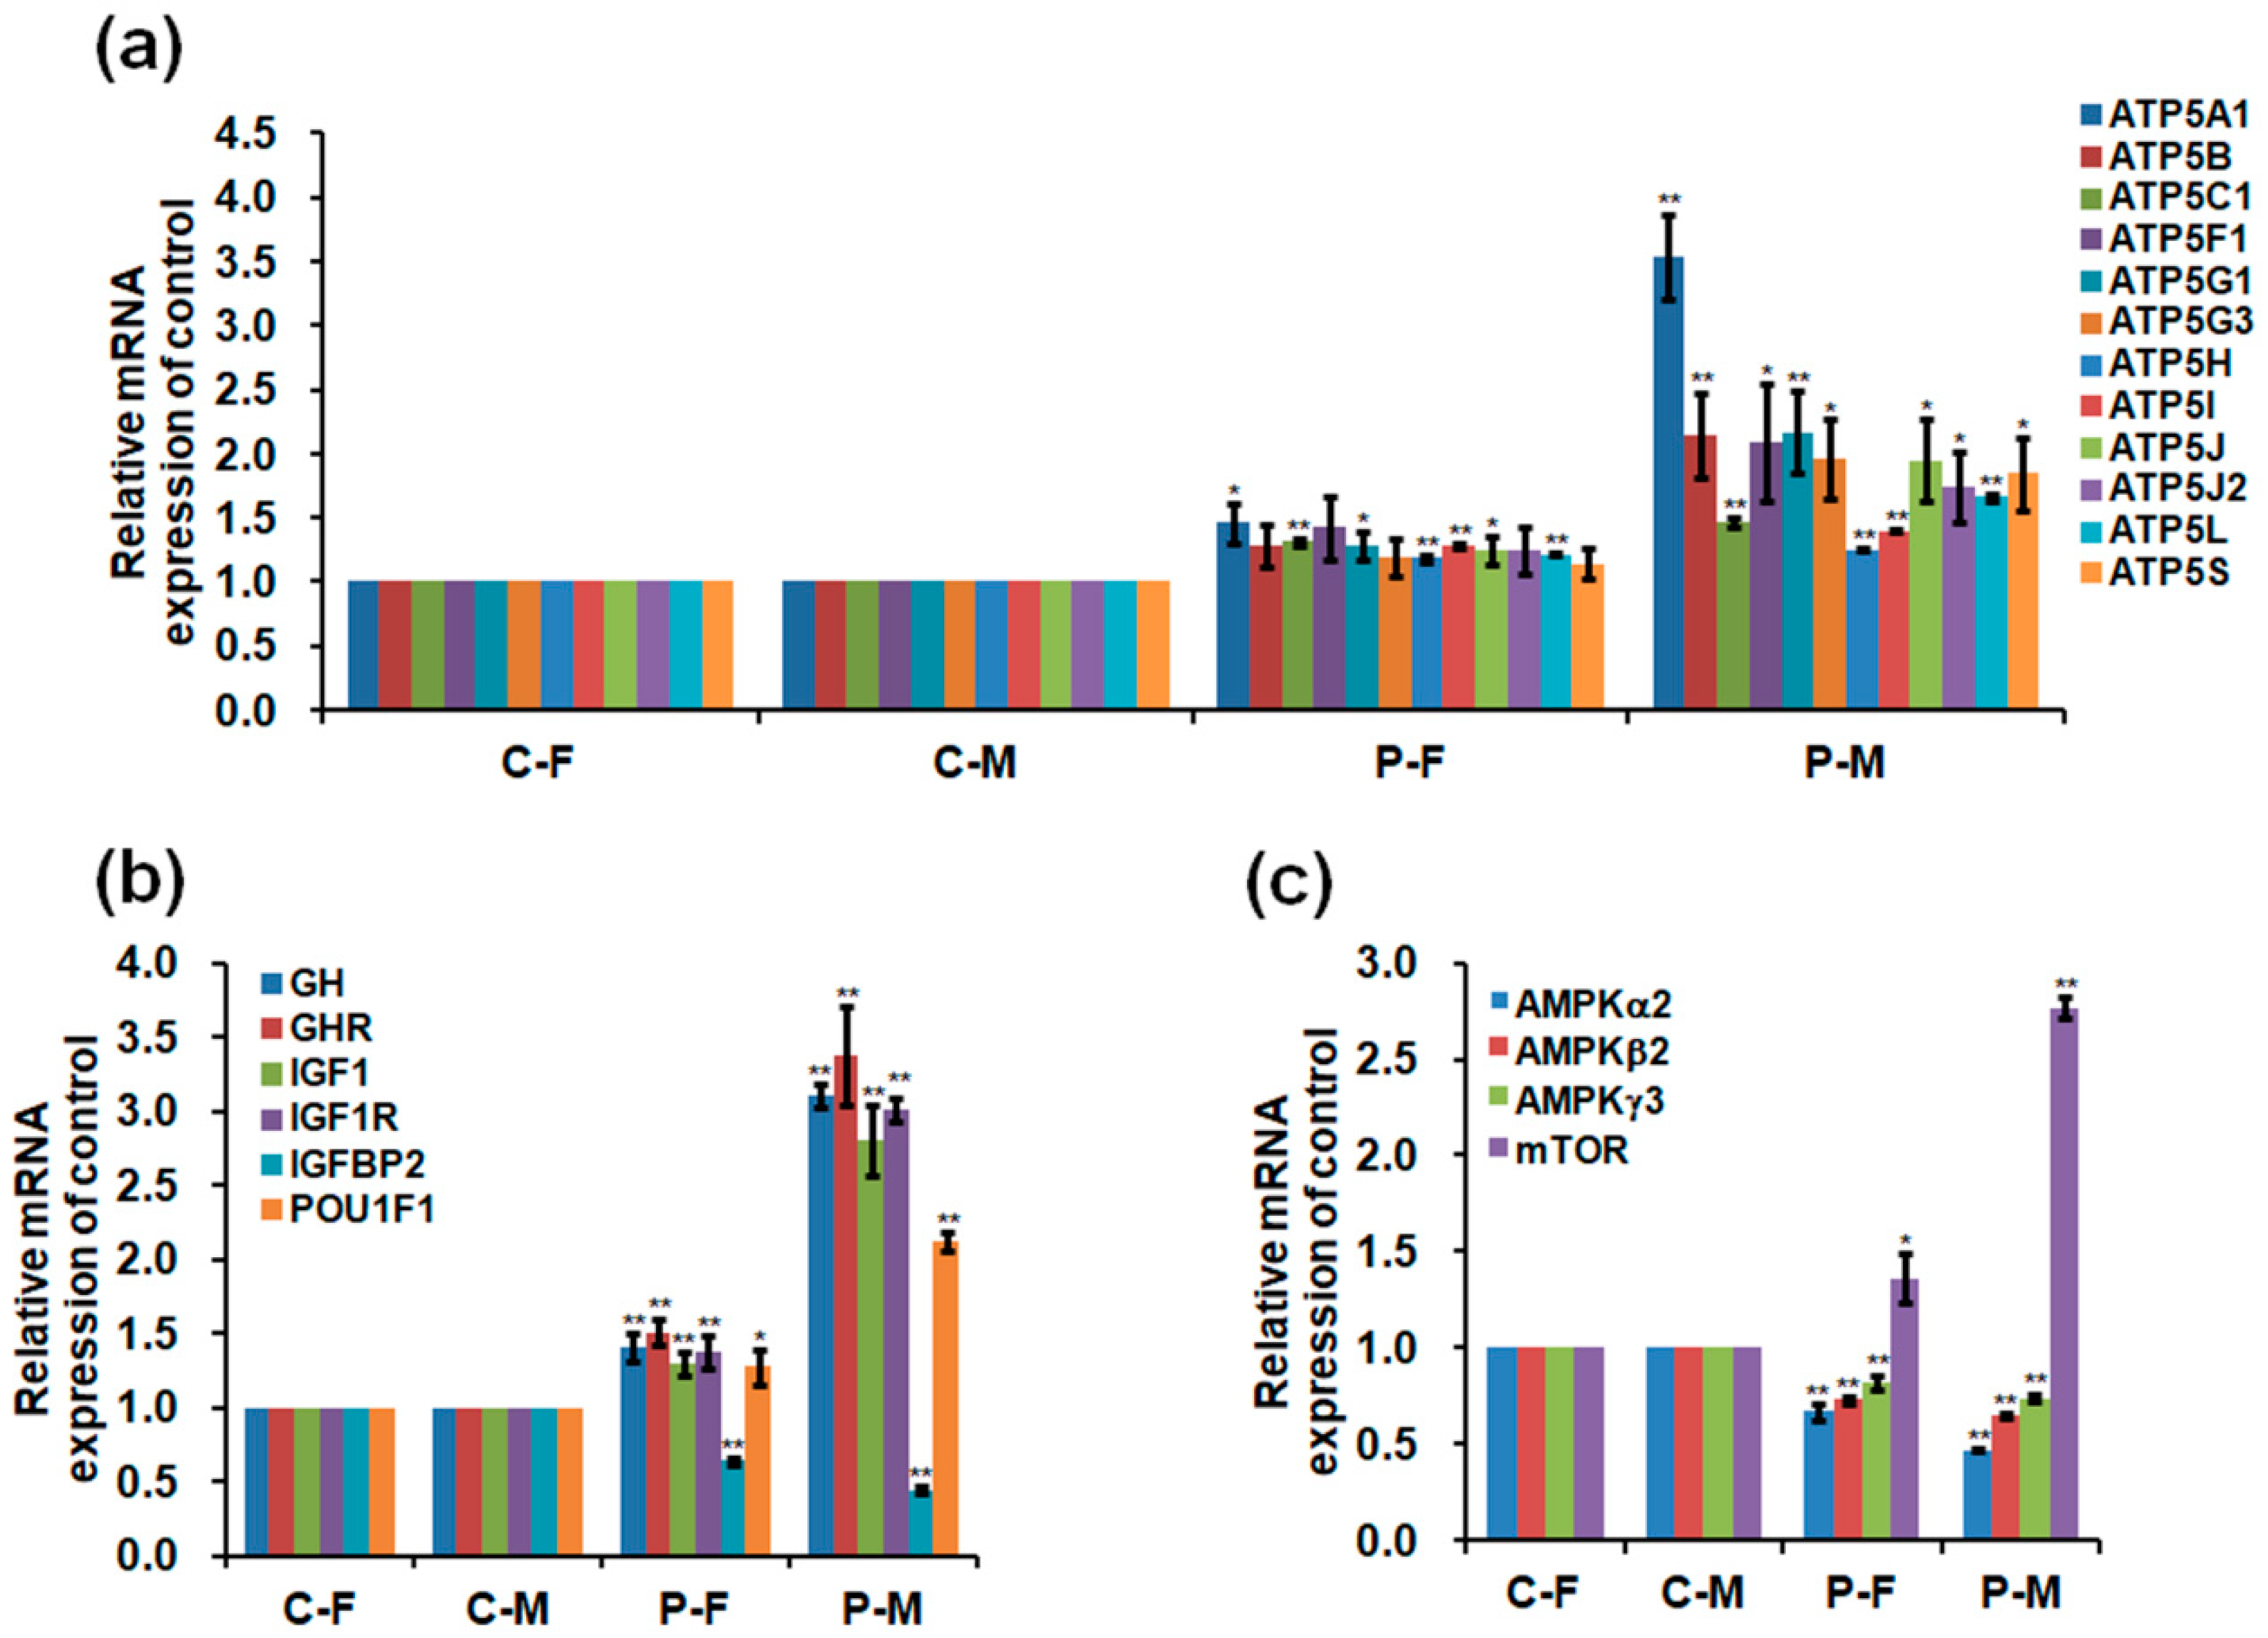
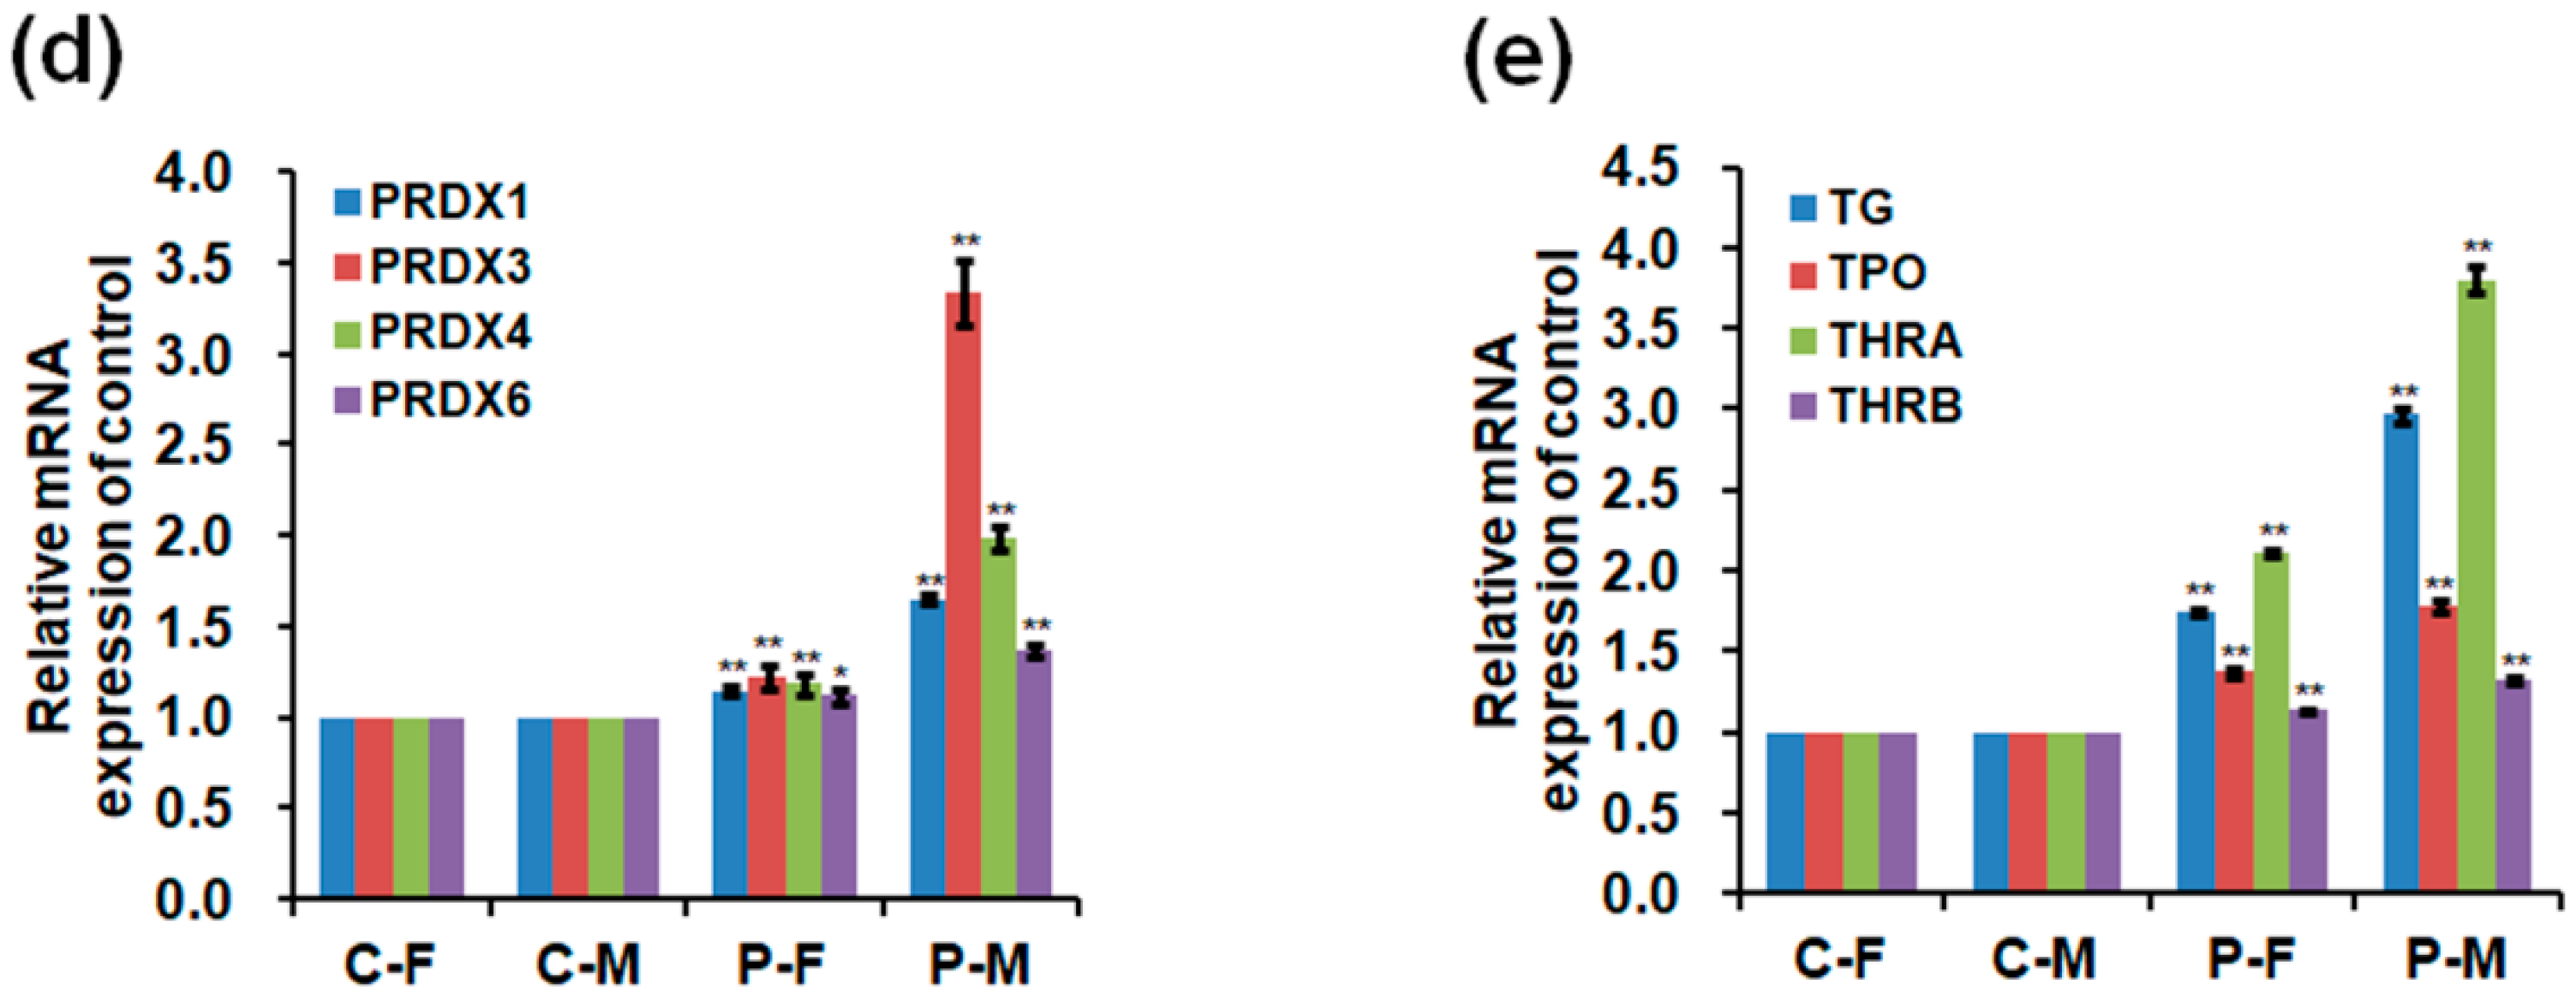
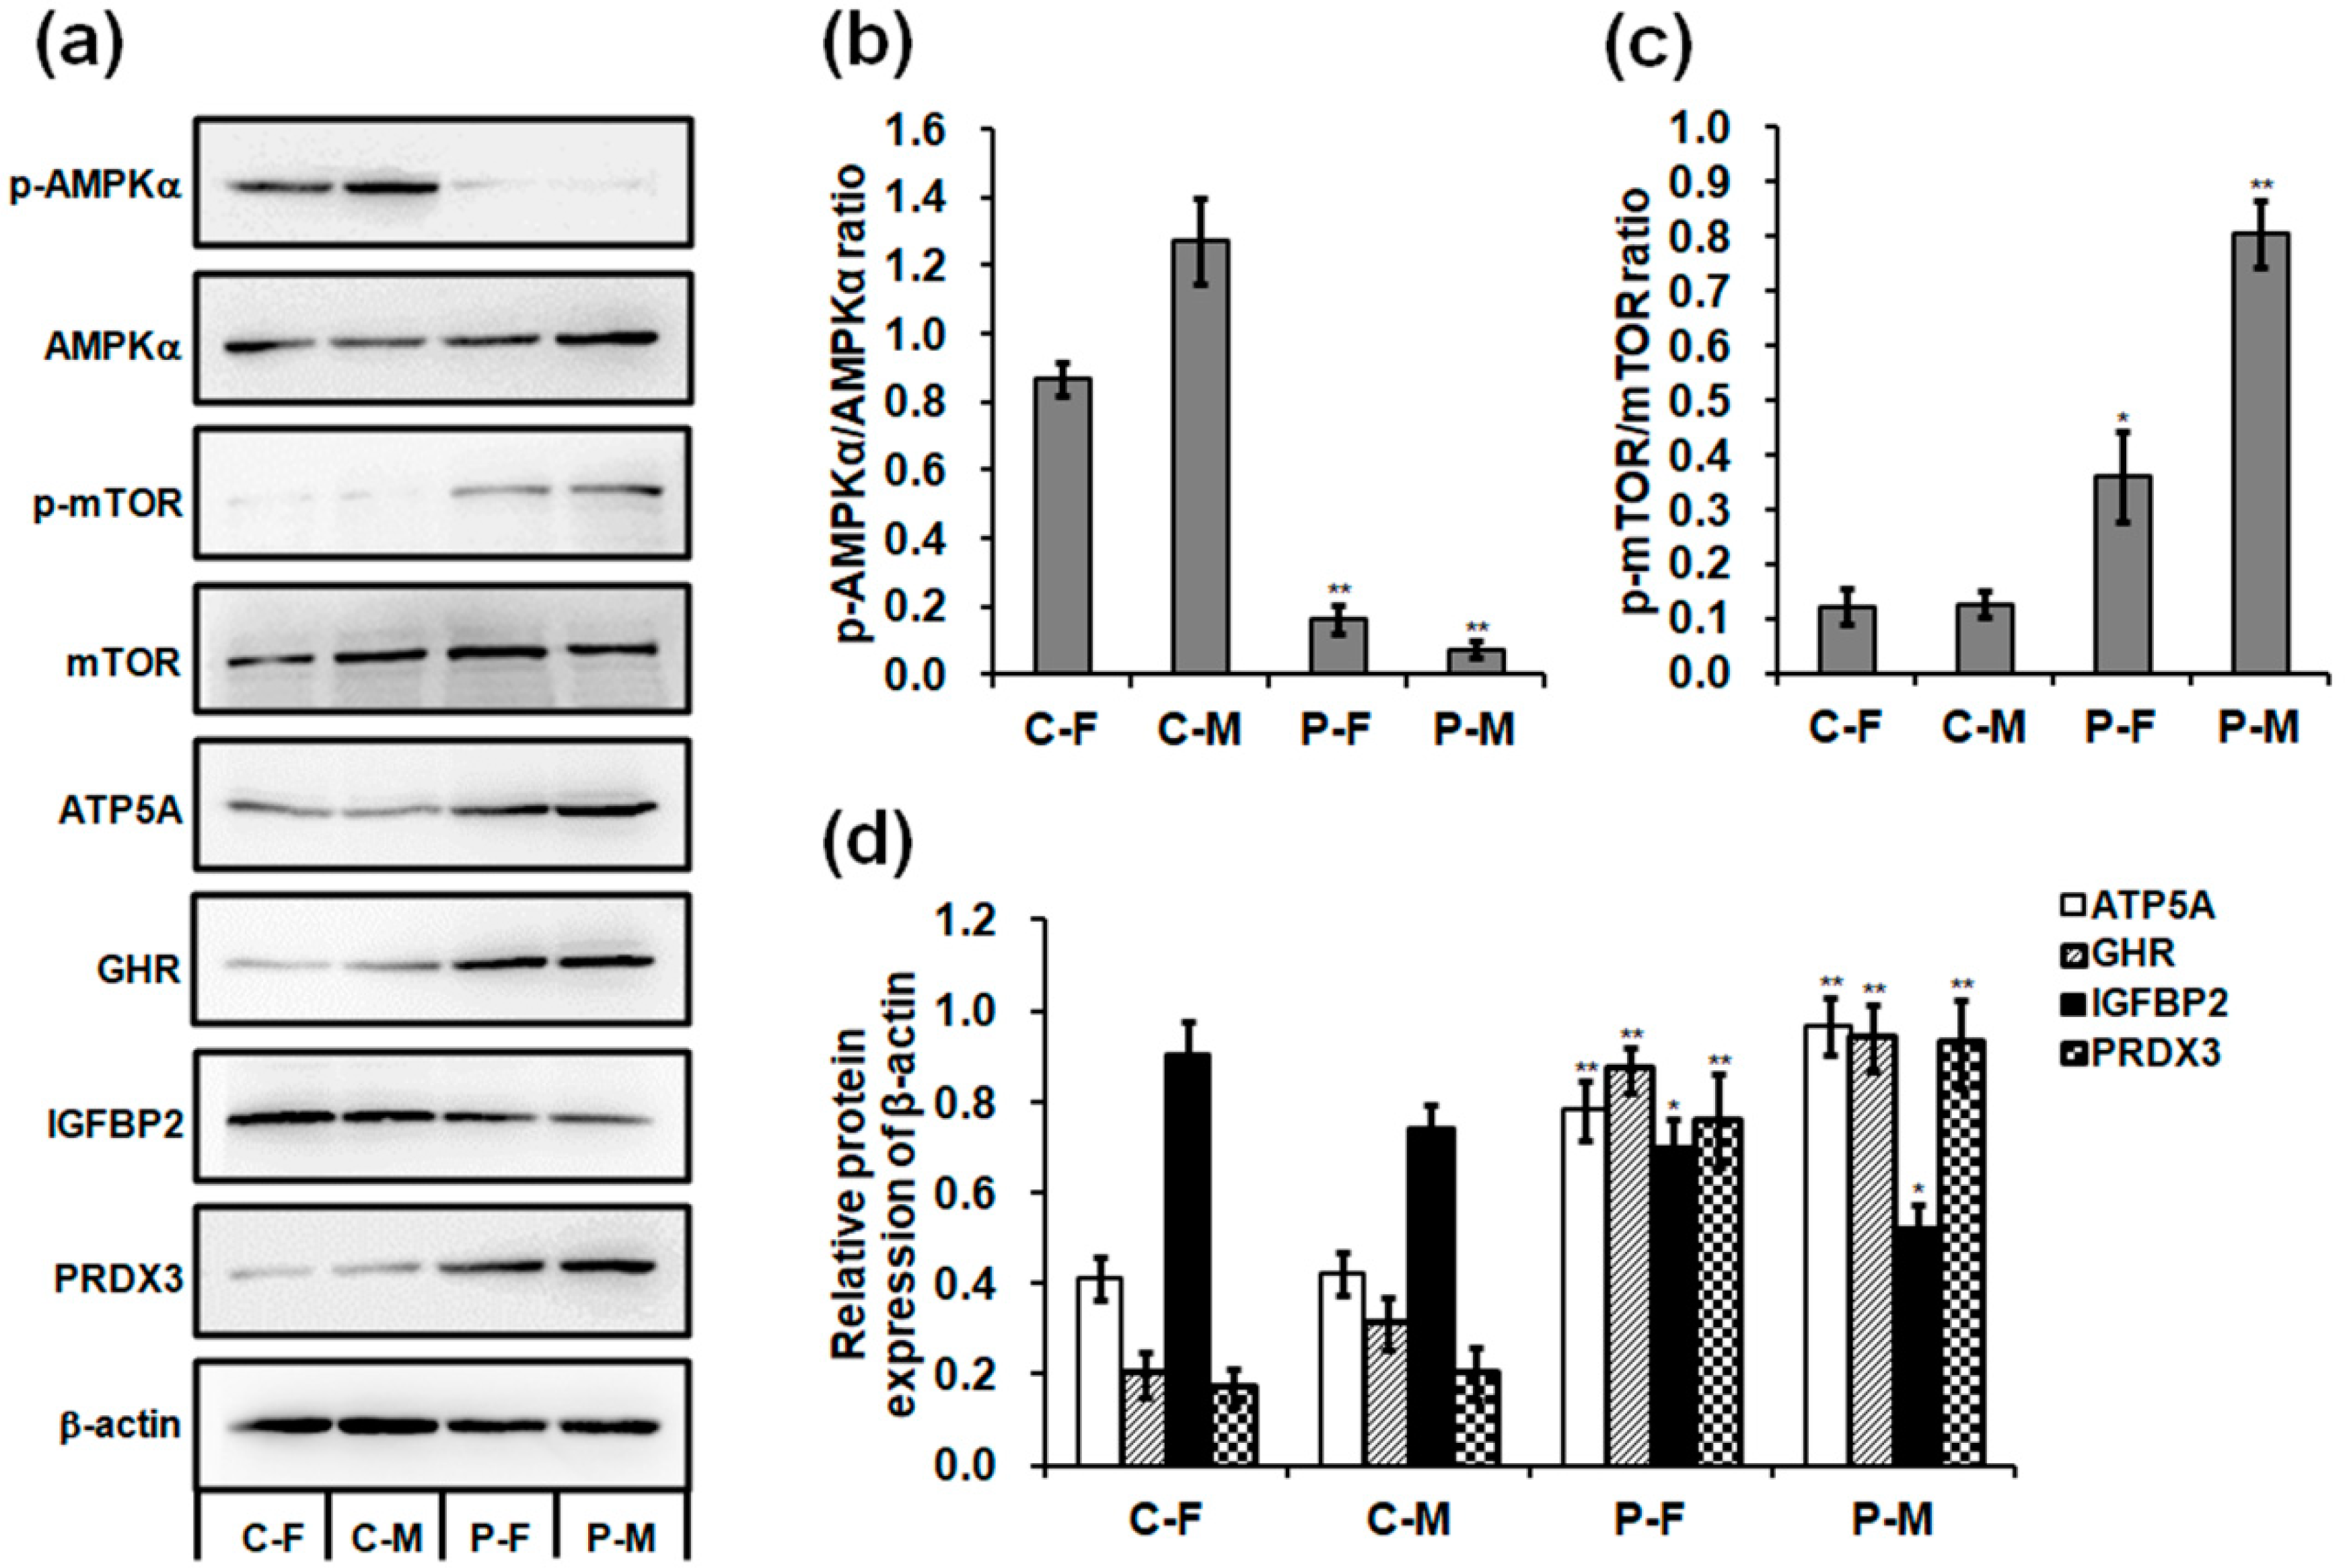
2.5. Expressions of mRNA and Protein in the Skeletal Muscles
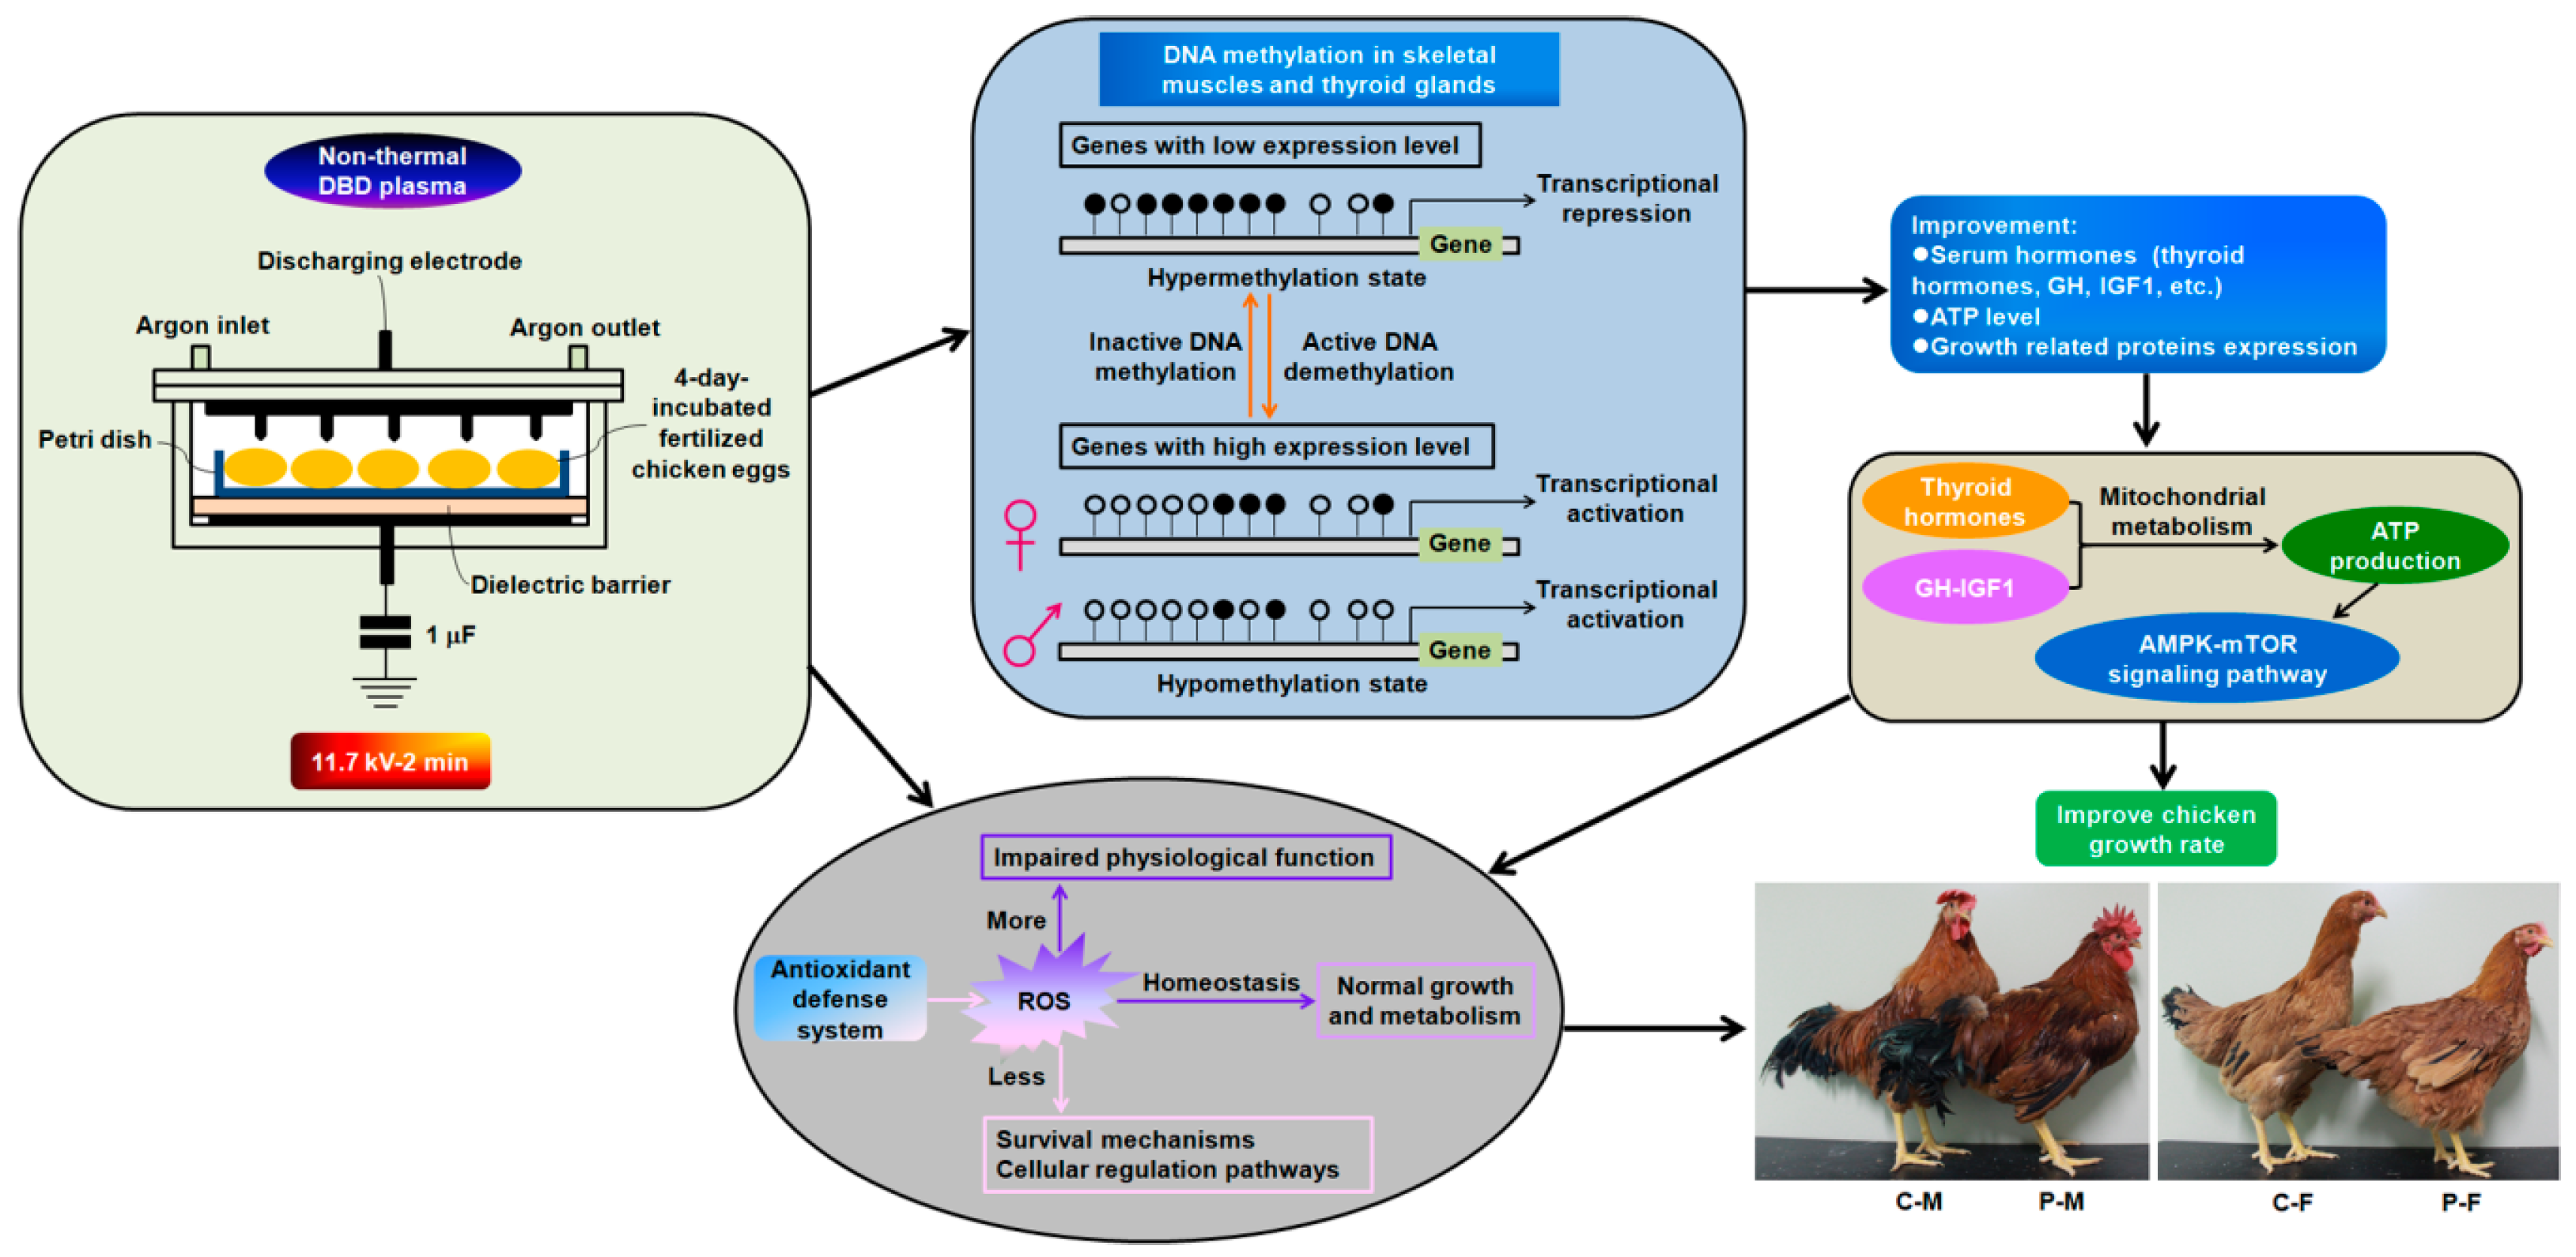
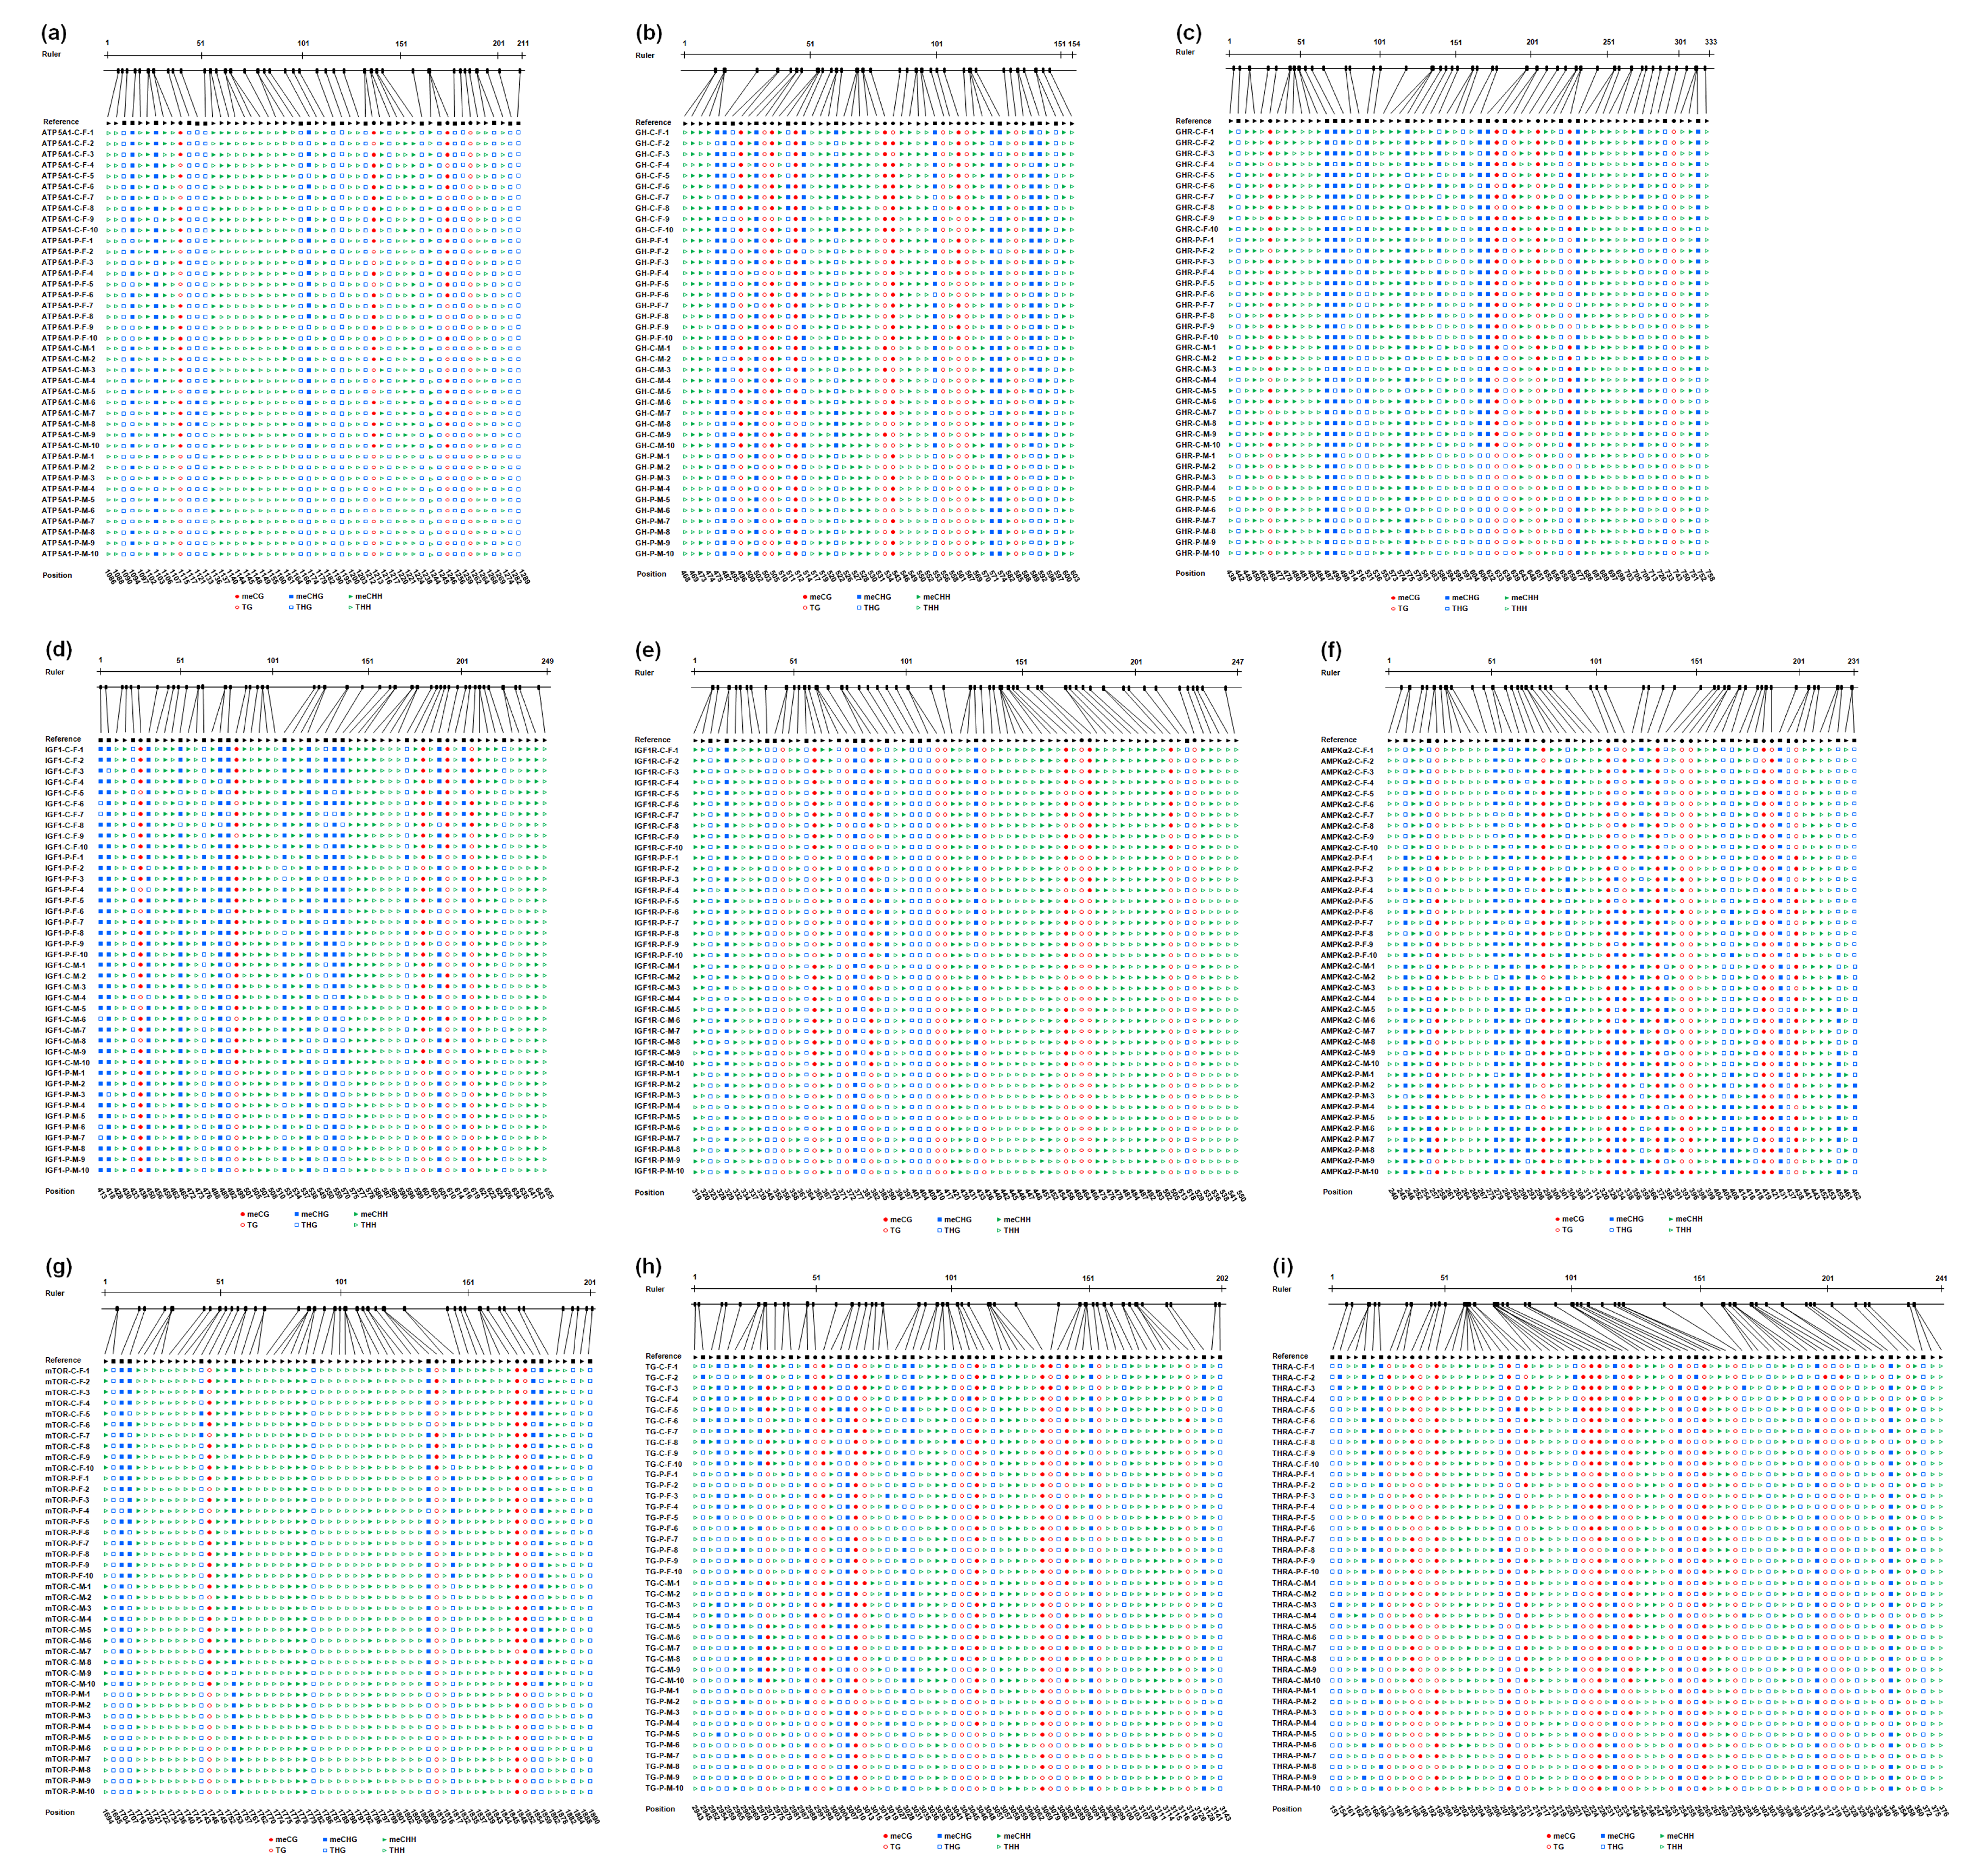
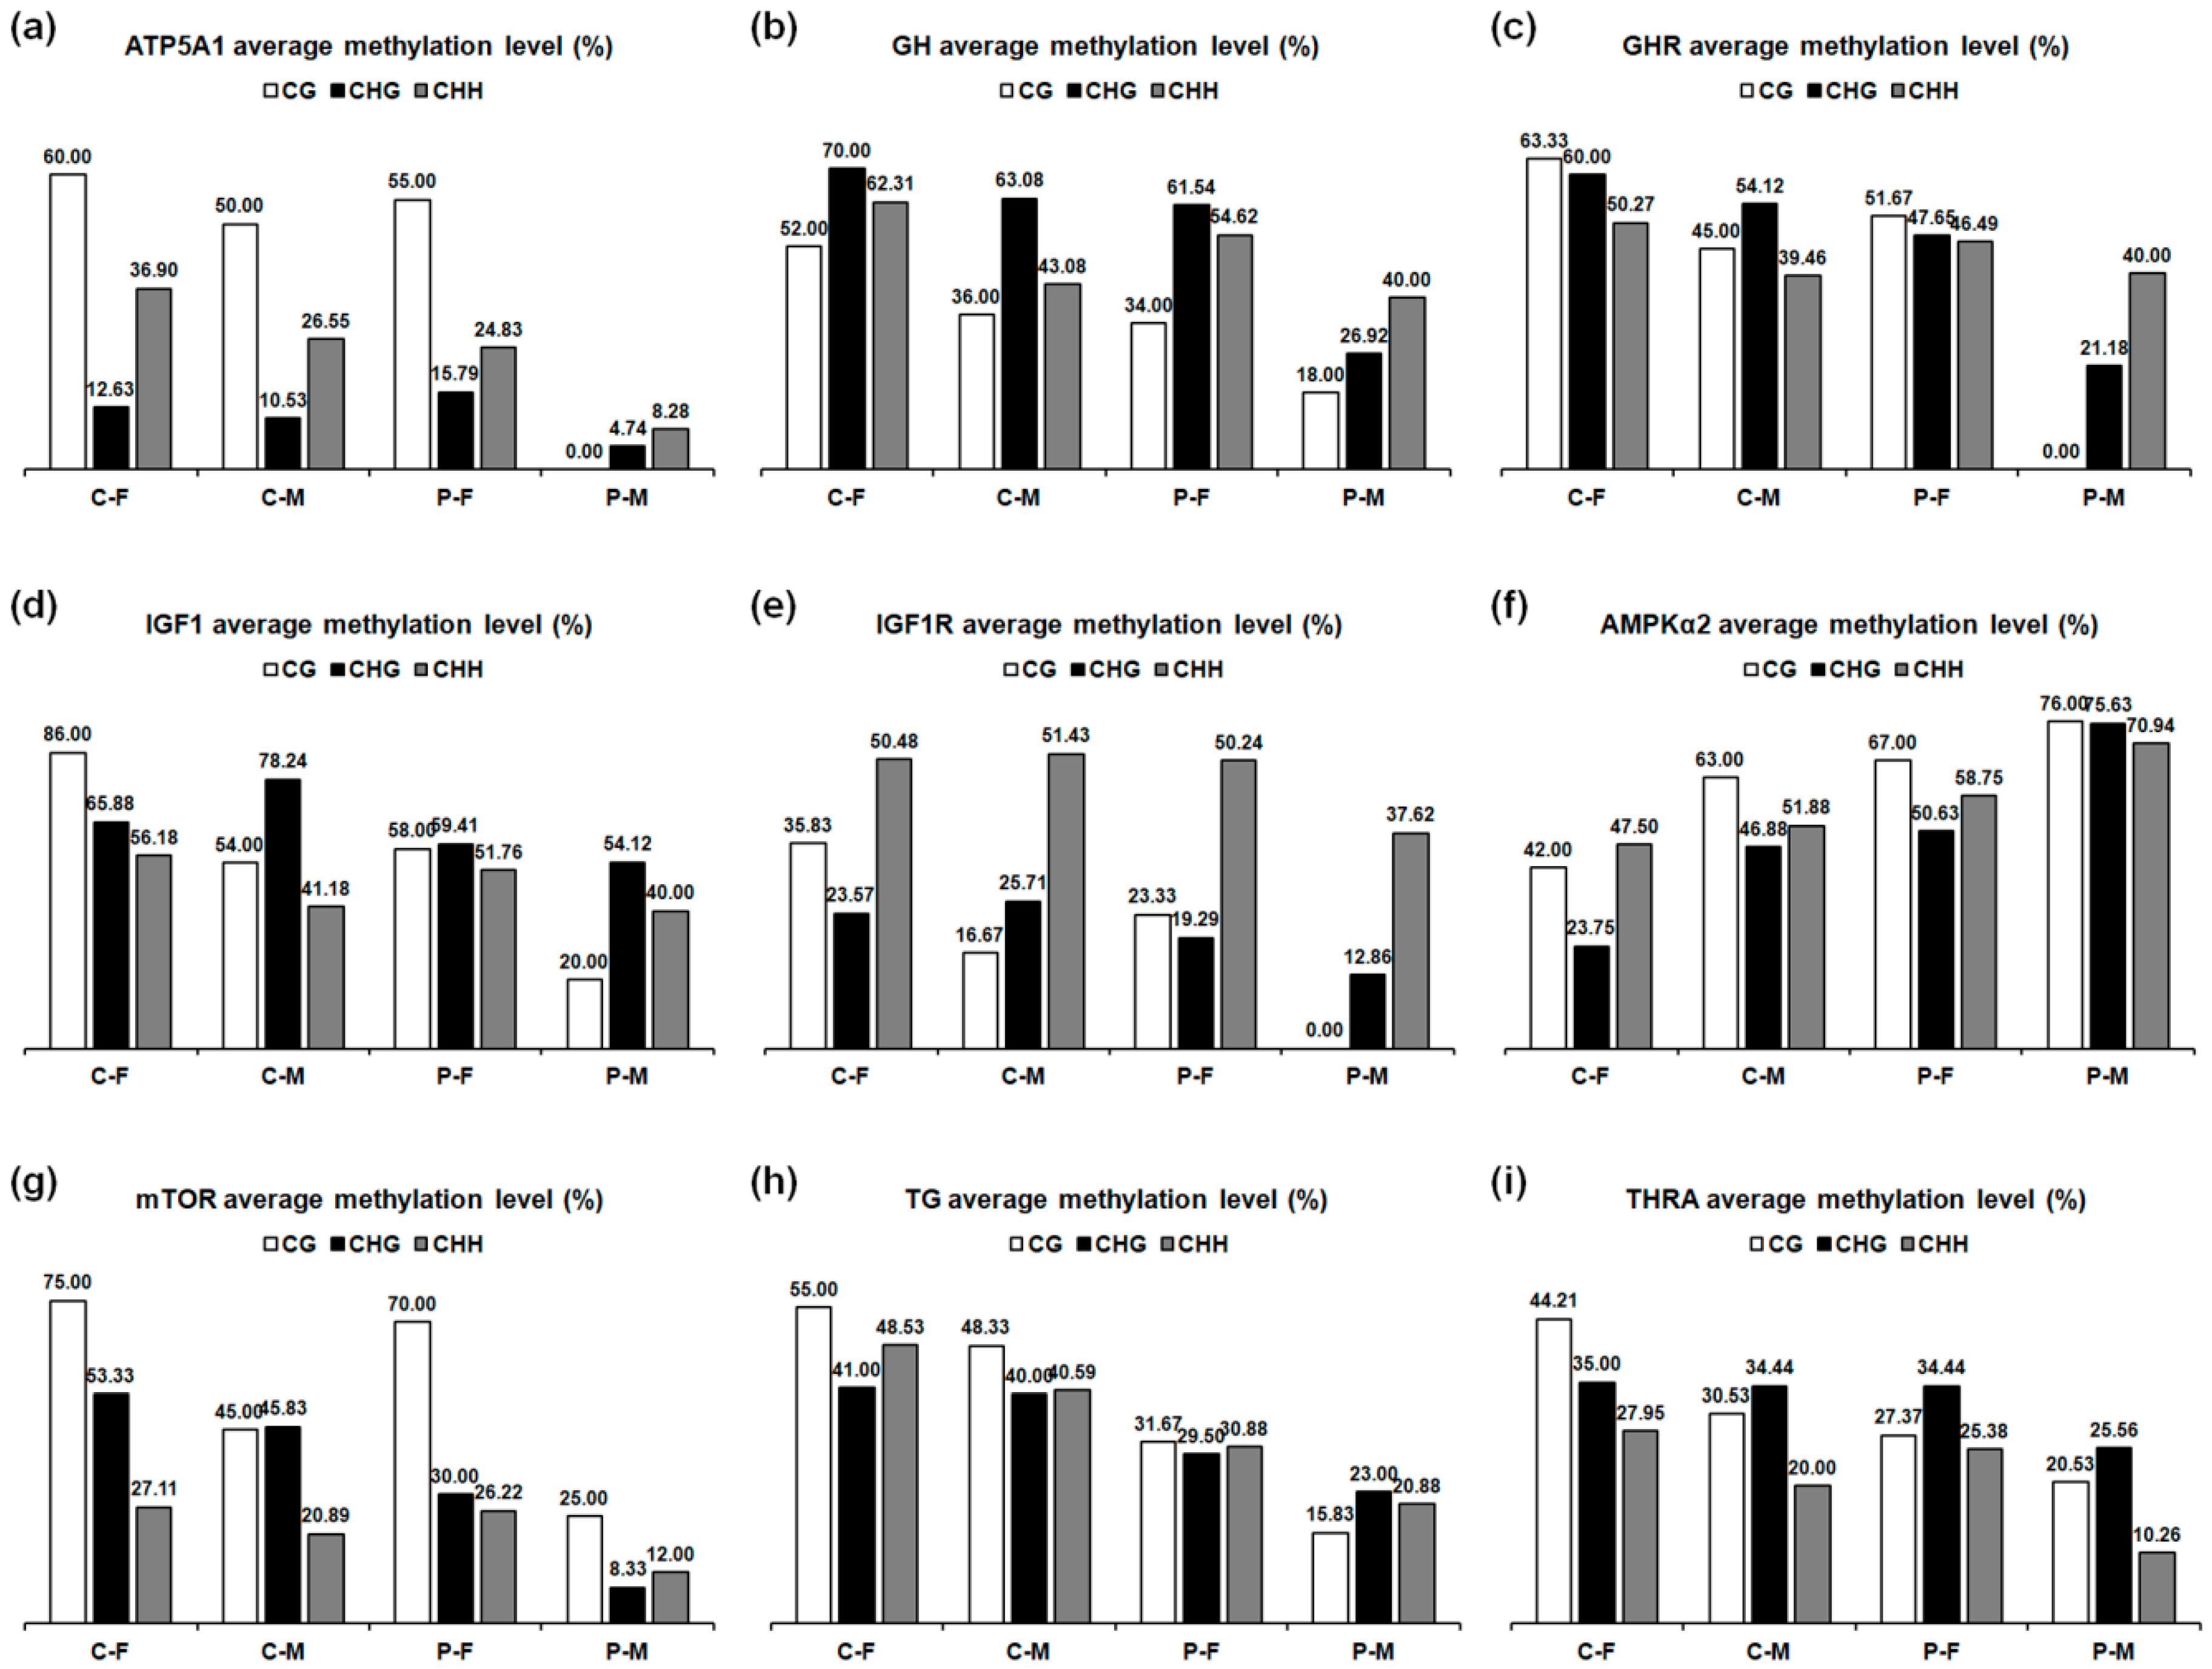
2.6. DNA Methylation Level
3. Discussion
4. Materials and Methods
4.1. Plasma Treatment and Chicken Growth
4.2. Serum Hormones, ATP, ROS, and Antioxidant Enzyme Analyses
4.3. Transmission Electron Microscopy and Mitochondrial Respiratory Enzyme Analyses
4.4. RT-PCR Analysis
4.5. Methylation Sequencing
4.6. Western Blotting
4.7. Statistical Analysis
5. Conclusions
Supplementary Materials
Author Contributions
Funding
Acknowledgments
Conflicts of Interest
Abbreviations
| DBD | Dielectric barrier discharge |
| ROS | Reactive oxygen species |
| ADG | Average daily gain |
| T3 | Triiodothyronine |
| T4 | Thyroxine |
| FT3 | Free triiodothyronine |
| FT4 | Free thyroxine |
| GH | Growth hormone |
| IGF1 | Insulin-like growth factor 1 |
| IGFBP2 | Insulin-like growth factor binding protein 2 |
| ATP | Adenosine triphosphate |
| SOD | Superoxide dismutase |
| CAT | Catalase |
| GPx | Glutathione peroxidase |
| MDA | Malondialdehyde |
| NADH | Nicotinamide adenine dinucleotide hydrogen |
| GHR | Growth hormone receptor |
| IGF1R | Insulin-like growth factor 1 receptor |
| POU1F1 | POU class 1 homeobox 1 |
| mTOR | Mammalian target of rapamycin |
| AMPK | Adenosine monophosphate-activated protein kinase |
| PRDXs | Peroxiredoxins |
| TG | Thyroglobulin |
| TPO | Thyroid peroxidase |
| THRs | Thyroid hormone receptors |
| BSP | Bisulfite-sequencing PCR |
| SD | Standard deviation |
| LSD | Fisher’s least significant difference |
References
- Kalghatgi, S.; Kelly, C.M.; Cerchar, E.; Torabi, B.; Alekseev, O.; Fridman, A.; Friedman, G.; Azizkhan-Clifford, J. Effects of non-thermal plasma on mammalian cells. PLoS ONE 2011, 6, e16270. [Google Scholar] [CrossRef] [PubMed]
- Zhang, J.J.; Do, H.L.; Chandimali, N.; Lee, S.B.; Mok, Y.S.; Kim, N.; Kim, S.B.; Kwon, T.; Jeong, D.K. Non-thermal plasma treatment improves chicken sperm motility via the regulation of demethylation levels. Sci. Rep. 2018, 8, 7576. [Google Scholar] [CrossRef] [PubMed]
- Zhang, J.J.; Huynh, D.L.; Chandimali, N.; Kang, T.Y.; Kim, N.; Mok, Y.S.; Kwon, T.; Jeong, D.K. Growth and male reproduction improvement of non-thermal dielectric barrier discharge plasma treatment on chickens. J. Phys. D Appl. Phys. 2018, 51, 205201. [Google Scholar] [CrossRef]
- Zhang, J.J.; Jo, J.O.; Huynh, D.L.; Ghosh, M.; Kim, N.; Lee, S.B.; Lee, H.K.; Mok, Y.S.; Kwon, T.; Jeong, D.K. Lethality of inappropriate plasma exposure on chicken embryonic development. Oncotarget 2017, 8, 85642–85654. [Google Scholar] [CrossRef] [PubMed]
- Zhang, J.J.; Jo, J.O.; Huynh, D.L.; Mongre, R.K.; Ghosh, M.; Singh, A.K.; Lee, S.B.; Mok, Y.S.; Hyuk, P.; Jeong, D.K. Growth-inducing effects of argon plasma on soybean sprouts via the regulation of demethylation levels of energy metabolism-related genes. Sci. Rep. 2017, 7, 41917. [Google Scholar] [CrossRef] [PubMed]
- Zhang, J.J.; Wang, X.Z.; Luong Do, H.; Chandimali, N.; Kang, T.Y.; Kim, N.; Ghosh, M.; Lee, S.B.; Mok, Y.S.; Kim, S.B.; et al. MicroRNA-7450 regulates non-thermal plasma-induced chicken Sertoli cell apoptosis via adenosine monophosphate-activated protein kinase activation. Sci. Rep. 2018, 8, 8761. [Google Scholar] [CrossRef] [PubMed]
- Kieft, I.E.; Kurdi, M.; Stoffels, E. Reattachment and apoptosis after plasma-needle treatment of cultured cells. IEEE Trans. Plasma Sci. 2006, 34, 1331–1336. [Google Scholar] [CrossRef]
- Kalghatgi, S.; Friedman, G.; Fridman, A.; Clyne, A.M. Endothelial cell proliferation is enhanced by low dose non-thermal plasma through fibroblast growth factor-2 release. Ann. Biomed. Eng. 2010, 38, 748–757. [Google Scholar] [CrossRef] [PubMed]
- Nakai, N.; Fujita, R.; Kawano, F.; Takahashi, K.; Ohira, T.; Shibaguchi, T.; Nakata, K.; Ohira, Y. Retardation of C2C12 myoblast cell proliferation by exposure to low-temperature atmospheric plasma. J. Physiol. Sci. 2014, 64, 365–375. [Google Scholar] [CrossRef] [PubMed]
- Kuchenbecker, M.; Bibinov, N.; Kaemlimg, A.; Wandke, D.; Awakowicz, P.; Viol, W. Characterization of DBD plasma source for biomedical applications. J. Phys. D Appl. Phys. 2009, 42, 045212. [Google Scholar] [CrossRef]
- Lin, A.; Truong, B.; Patel, S.; Kaushik, N.; Choi, E.H.; Fridman, G.; Fridman, A.; Miller, V. Nanosecond-pulsed DBD plasma-generated reactive oxygen species trigger immunogenic cell death in A549 lung carcinoma cells through intracellular oxidative stress. Int. J. Mol. Sci. 2017, 18, 966. [Google Scholar] [CrossRef] [PubMed]
- Yan, X.; Xiong, Z.; Zou, F.; Zhao, S.; Lu, X.; Yang, G.; He, G.; Ostrikov, K. Plasma-induced death of HepG2 cancer cells: Intracellular effects of reactive species. Plasma Process. Polym. 2011, 9, 59–66. [Google Scholar] [CrossRef]
- Steinbeck, M.J.; Chernets, N.; Zhang, J.; Kurpad, D.S.; Fridman, G.; Fridman, A.; Freeman, T.A. Skeletal cell differentiation is enhanced by atmospheric dielectric barrier discharge plasma treatment. PLoS ONE 2013, 8, e82143. [Google Scholar] [CrossRef] [PubMed]
- Chen, C.; Liu, Y.; Liu, R.; Ikenoue, T.; Guan, K.-L.; Liu, Y.; Zheng, P. TSC-mTOR maintains quiescence and function of hematopoietic stem cells by repressing mitochondrial biogenesis and reactive oxygen species. J. Exp. Med. 2008, 205, 2397–2408. [Google Scholar] [CrossRef] [PubMed]
- Chernets, N.; Zhang, J.; Steinbeck, M.J.; Kurpad, D.S.; Koyama, E.; Friedman, G.; Freeman, T.A. Nonthermal atmospheric pressure plasma enhances mouse limb bud survival, growth, and elongation. Tissue Eng. Part A 2015, 21, 300–309. [Google Scholar] [CrossRef] [PubMed]
- Kim, K.C.; Piao, M.J.; Hewage, S.R.K.M.; Han, X.I.A.; Kang, K.A.; Jo, J.O.; Mok, Y.S.; Shin, J.H.; Park, Y.; Yoo, S.J.; et al. Non-thermal dielectric-barrier discharge plasma damages human keratinocytes by inducing oxidative stress. Int. J. Mol. Med. 2016, 37, 29–38. [Google Scholar] [CrossRef] [PubMed]
- Blackert, S.; Haertel, B.; Wende, K.; von Woedtke, T.; Lindequist, U. Influence of non-thermal atmospheric pressure plasma on cellular structures and processes in human keratinocytes (HaCaT). J. Dermatol. Sci. 2013, 70, 173–181. [Google Scholar] [CrossRef] [PubMed]
- Li, Q.; Li, N.; Hu, X.; Li, J.; Du, Z.; Chen, L.; Yin, G.; Duan, J.; Zhang, H.; Zhao, Y.; et al. Genome-wide mapping of DNA methylation in chicken. PLoS ONE 2011, 6, e19428. [Google Scholar] [CrossRef] [PubMed]
- Baylin, S.B.; Esteller, M.; Rountree, M.R.; Bachman, K.E.; Schuebel, K.; Herman, J.G. Aberrant patterns of DNA methylation, chromatin formation and gene expression in cancer. Hum. Mol. Genet. 2001, 10, 687–692. [Google Scholar] [CrossRef] [PubMed]
- Jin, B.; Li, Y.; Robertson, K.D. DNA methylation: Superior or subordinate in the epigenetic hierarchy? Genes Cancer 2011, 2, 607–617. [Google Scholar] [CrossRef] [PubMed]
- Cao-Lei, L.; Massart, R.; Suderman, M.J.; Machnes, Z.; Elgbeili, G.; Laplante, D.P.; Szyf, M.; King, S. DNA methylation signatures triggered by prenatal maternal stress exposure to a natural disaster: Project ice storm. PLoS ONE 2014, 9, e107653. [Google Scholar] [CrossRef] [PubMed]
- Cotton, A.M.; Lam, L.; Affleck, J.G.; Wilson, I.M.; Peñaherrera, M.S.; McFadden, D.E.; Kobor, M.S.; Lam, W.L.; Robinson, W.P.; Brown, C.J. Chromosome-wide DNA methylation analysis predicts human tissue-specific X inactivation. Hum. Genet. 2011, 130, 187–201. [Google Scholar] [CrossRef] [PubMed]
- Hall, E.; Volkov, P.; Dayeh, T.; Esguerra, J.L.S.; Salö, S.; Eliasson, L.; Rönn, T.; Bacos, K.; Ling, C. Sex differences in the genome-wide DNA methylation pattern and impact on gene expression, microRNA levels and insulin secretion in human pancreatic islets. Genome Boil. 2014, 15, 522. [Google Scholar] [CrossRef] [PubMed]
- Liu, J.; Morgan, M.; Hutchison, K.; Calhoun, V.D. A Study of the Influence of Sex on Genome Wide Methylation. PLoS ONE 2010, 5, e10028. [Google Scholar] [CrossRef] [PubMed]
- Szili, E.J.; Hong, S.-H.; Oh, J.-S.; Gaur, N.; Short, R.D. Tracking the penetration of plasma reactive species in tissue models. Trends Biotechnol. 2018, 36, 594–602. [Google Scholar] [CrossRef] [PubMed]
- Bassett, J.H.D.; Williams, G.R. Role of Thyroid Hormones in Skeletal Development and Bone Maintenance. Endocr. Rev. 2016, 37, 135–187. [Google Scholar] [CrossRef] [PubMed]
- Cao-Lei, L.; Dancause, K.N.; Elgbeili, G.; Massart, R.; Szyf, M.; Liu, A.; Laplante, D.P.; King, S. DNA methylation mediates the impact of exposure to prenatal maternal stress on BMI and central adiposity in children at age 13½ years: Project Ice Storm. Epigenetics 2015, 10, 749–761. [Google Scholar] [CrossRef] [PubMed]
- Veldhuis, J.D.; Roemmich, J.N.; Richmond, E.J.; Rogol, A.D.; Lovejoy, J.C.; Sheffield-Moore, M.; Mauras, N.; Bowers, C.Y. Endocrine control of body composition in infancy, childhood, and puberty. Endocr. Rev. 2005, 26, 114–146. [Google Scholar] [CrossRef] [PubMed]
- Kita, K.; Nagao, K.; Okumura, J. Nutritional and tissue specificity of IGF-I and IGFBP-2 gene expression in growing chickens. Asian Australas. J. Anim. Sci. 2005, 18, 747–754. [Google Scholar] [CrossRef]
- Sobrier, M.L.; Tsai, Y.C.; Perez, C.; Leheup, B.; Bouceba, T.; Duquesnoy, P.; Copin, B.; Sizova, D.; Penzo, A.; Stanger, B.Z.; et al. Functional characterization of a human POU1F1 mutation associated with isolated growth hormone deficiency: A novel etiology for IGHD. Hum. Mol. Genet. 2016, 25, 472–483. [Google Scholar] [CrossRef] [PubMed]
- Lanni, A.; Moreno, M.; Goglia, F. Mitochondrial Actions of Thyroid Hormone; John Wiley & Sons, Inc.: New York, NY, USA, 2011. [Google Scholar] [CrossRef]
- Short, K.R.; Moller, N.; Bigelow, M.L.; Coenen-Schimke, J.; Nair, K.S. Enhancement of muscle mitochondrial function by growth hormone. J. Clin. Endocrinol. Metab. 2008, 93, 597–604. [Google Scholar] [CrossRef] [PubMed]
- Troncoso, R.; Vicencio, J.M.; Parra, V.; Nemchenko, A.; Kawashima, Y.; del Campo, A.; Toro, B.; Battiprolu, P.K.; Aranguiz, P.; Chiong, M.; et al. Energy-preserving effects of IGF-1 antagonize starvation-induced cardiac autophagy. Cardiovasc. Res. 2012, 93, 320–329. [Google Scholar] [CrossRef] [PubMed]
- Donald, V.; Judith, G.V.; Charlotte, W.P. Fundamentals of Biochemistry, 2nd ed.; John Wiley and Sons, Inc.: New York, NY, USA, 2006. [Google Scholar]
- Zurlo, F.; Larson, K.; Bogardus, C.; Ravussin, E. Skeletal muscle metabolism is a major determinant of resting energy expenditure. J. Clin. Investig. 1990, 86, 1423–1427. [Google Scholar] [CrossRef] [PubMed]
- Du, M.; Shen, Q.W.; Zhu, M.J.; Ford, S.P. Leucine stimulates mammalian target of rapamycin signaling in C2C12 myoblasts in part through inhibition of adenosine monophosphate-activated protein kinase. J. Anim. Sci. 2007, 85, 919–927. [Google Scholar] [CrossRef] [PubMed]
- Viollet, B.; Horman, S.; Leclerc, J.; Lantier, L.; Foretz, M.; Billaud, M.; Giri, S.; Andreelli, F. AMPK inhibition in health and disease. Crit. Rev. Biochem. Mol. Boil. 2010, 45, 276–295. [Google Scholar] [CrossRef] [PubMed]
- Murphy, M.P. How mitochondria produce reactive oxygen species. Biochem. J. 2009, 417, 1–13. [Google Scholar] [CrossRef] [PubMed]
- Zhunussova, A.; Vitol, E.A.; Polyak, B.; Tuleukhanov, S.; Brooks, A.D.; Sensenig, R.; Friedman, G.; Orynbayeva, Z. Mitochondria-mediated anticancer effects of non-thermal atmospheric plasma. PLoS ONE 2016, 11, e0156818. [Google Scholar] [CrossRef] [PubMed]
- Kaushik, N.K.; Kaushik, N.; Park, D.; Choi, E.H. Altered antioxidant system stimulates dielectric barrier discharge plasma-induced cell death for solid tumor cell treatment. PLoS ONE 2014, 9, e103349. [Google Scholar] [CrossRef] [PubMed]
- Lukyanenko, L.M.; Skarabahatava, A.S.; Slobozhanina, E.I.; Kovaliova, S.A.; Falcioni, M.L.; Falcioni, G. In vitro effect of AlCl3 on human erythrocytes: Changes in membrane morphology and functionality. J. Trace Elem. Med. Biol. 2013, 27, 160–167. [Google Scholar] [CrossRef] [PubMed]
- Wagner, M.S.; Wajner, S.M.; Maia, A.L. The role of thyroid hormone in testicular development and function. J. Endocrinol. 2008, 199, 351–365. [Google Scholar] [CrossRef] [PubMed]
- Zhu, Z.; Mukhina, S.; Zhu, T.; Mertani, H.C.; Lee, K.O.; Lobie, P.E. p44/42 MAP kinase-dependent regulation of catalase by autocrine human growth hormone protects human mammary carcinoma cells from oxidative stress-induced apoptosis. Oncogene 2005, 24, 3774–3785. [Google Scholar] [CrossRef] [PubMed]
- Higashi, Y.; Pandey, A.; Goodwin, B.; Delafontaine, P. Insulin-like growth factor-1 regulates glutathione peroxidase expression and activity in vascular endothelial cells: Implications for atheroprotective actions of insulin-like growth factor-1. Biochim. Biophys. Acta 2013, 1832, 391–399. [Google Scholar] [CrossRef] [PubMed]
- Maeder, M.L.; Angstman, J.F.; Richardson, M.E.; Linder, S.J.; Cascio, V.M.; Tsai, S.Q.; Ho, Q.H.; Sander, J.D.; Reyon, D.; Bernstein, B.E.; et al. Targeted DNA demethylation and activation of endogenous genes using programmable TALE-TET1 fusion proteins. Nat. Biotechnol. 2013, 31, 1137–1142. [Google Scholar] [CrossRef] [PubMed]
- Jiao, Z.J.; Yi, W.; Rong, Y.W.; Kee, J.D.; Zhong, W.X. MicroRNA-1285 regulates 17β-estradiol-inhibited immature boar Sertoli cell proliferation via adenosine monophosphate-activated protein kinase activation. Endocrinology 2015, 156, 4059–4070. [Google Scholar] [CrossRef] [PubMed]


| Gender | Group | ADG (Day 0–30) (g/d) | Average Tibia Length on Day 30 (cm) | ADG (Day 0–60) (g/d) | Average Tibia Length on Day 60 (cm) | ADG (Day 0–90) (g/d) | Average Tibia Length on Day 90 (cm) |
|---|---|---|---|---|---|---|---|
| Female | Control | 7.66 ± 0.13 cd | 5.37 ± 0.05 d | 7.68 ± 0.06 d | 8.27 ± 0.05 fg | 8.81 ± 0.04 ef | 11.58 ± 0.13 de |
| 11.7 kV–30 s | 7.91 ± 0.10 bc | 5.60 ± 0.08 c | 7.95 ± 0.14 cd | 8.43 ± 0.12 ef | 8.93 ± 0.14 def | 11.81 ± 0.17 cd | |
| 11.7 kV–1 min | 7.94 ± 0.07 bc | 5.70 ± 0.08 c | 10.04 ± 0.15 a | 9.13 ± 0.09 b | 9.66 ± 0.10 b | 11.99 ± 0.03 bc | |
| 11.7 kV–2 min | 8.42 ± 0.28 b | 6.13 ± 0.05 b | 10.28 ± 0.31 a | 9.60 ± 0.08 a | 10.10 ± 0.09 a | 12.88 ± 0.04 a | |
| 16.4 kV–30 s | 7.98 ± 0.08 bc | 5.67 ± 0.12 c | 8.03 ± 0.13 cd | 8.63 ± 0.09 de | 9.04 ± 0.11 cde | 11.89 ± 0.10 c | |
| 16.4 kV–1 min | 8.07 ± 0.38 bc | 6.17 ± 0.05 b | 8.23 ± 0.18 c | 8.90 ± 0.08 c | 9.13 ± 0.20 cd | 12.01 ± 0.08 bc | |
| 16.4 kV–2 min | 7.65 ± 0.17 cd | 5.60 ± 0.08 c | 8.02 ± 0.28 cd | 8.57 ± 0.05 de | 9.05 ± 0.08 cde | 11.76 ± 0.20 cd | |
| 22.0 kV–30 s | 8.58 ± 0.60 b | 6.33 ± 0.17 b | 8.28 ± 0.02 c | 8.73 ± 0.05 cd | 9.13 ± 0.14 cd | 11.89 ± 0.05 c | |
| 22.0 kV–1 min | 9.67 ± 0.49 a | 6.67 ± 0.12 a | 8.91 ± 0.22 b | 8.93 ± 0.12 bc | 9.24 ± 0.05 c | 12.20 ± 0.04 b | |
| 22.0 kV–2 min | 7.60 ± 0.13 cd | 5.63 ± 0.05 c | 8.11 ± 0.30 cd | 8.20 ± 0.14 g | 8.75 ± 0.14 f | 11.48 ± 0.20 e | |
| 27.6 kV–30 s | 8.22 ± 0.37 bc | 5.70 ± 0.08 c | 8.16 ± 0.10 c | 8.10 ± 0.08 gh | 8.43 ± 0.06 g | 11.34 ± 0.03 ef | |
| 27.6 kV–1 min | 7.03 ± 0.18 de | 5.10 ± 0.16 e | 8.09 ± 0.23 cd | 7.97 ± 0.17 hi | 8.36 ± 0.09 g | 11.17 ± 0.06 fg | |
| 27.6 kV–2 min | 6.79 ± 0.22 e | 5.03 ± 0.09 e | 7.92 ± 0.23 cd | 7.77 ± 0.05 i | 8.25 ± 0.20 g | 11.08 ± 0.11 g | |
| Male | Control | 7.74 ± 0.16 d | 5.90 ± 0.08 d | 8.91 ± 0.12 f | 9.23 ± 0.12 e | 9.51 ± 0.19 ef | 12.93 ± 0.08 f |
| 11.7 kV–30 s | 8.72 ± 0.37 c | 6.27 ± 0.12 c | 10.06 ± 0.12 cde | 9.37 ± 0.12 de | 10.37 ± 0.05 bc | 13.11 ± 0.03 ef | |
| 11.7 kV–1 min | 8.80 ± 0.35 c | 6.40 ± 0.08 c | 10.24 ± 0.16 cd | 9.57 ± 0.12 cd | 10.47 ± 0.13 b | 13.41 ± 0.11 cd | |
| 11.7 kV–2 min | 10.39 ± 0.30 b | 6.83 ± 0.05 b | 12.17 ± 0.09 a | 10.57 ± 0.17 a | 11.65 ± 0.09 a | 14.52 ± 0.03 a | |
| 16.4 kV–30 s | 8.98 ± 0.29 c | 6.40 ± 0.08 c | 10.07 ± 0.15 cde | 9.57 ± 0.12 cd | 9.89 ± 0.05 de | 13.39 ± 0.17 cd | |
| 16.4 kV–1 min | 8.97 ± 0.48 c | 6.80 ± 0.08 b | 10.37 ± 0.23 c | 9.57 ± 0.09 cd | 9.93 ± 0.40 d | 13.50 ± 0.15 c | |
| 16.4 kV–2 min | 8.33 ± 0.18 c | 6.20 ± 0.14 c | 10.18 ± 0.32 cd | 9.30 ± 0.08 e | 9.43 ± 0.14 f | 13.19 ± 0.13 de | |
| 22.0 kV–30 s | 9.93 ± 0.21 b | 6.73 ± 0.17 b | 10.47 ± 0.27 bc | 9.43 ± 0.05 de | 9.51 ± 0.24 ef | 13.44 ± 0.10 cd | |
| 22.0 kV–1 min | 11.32 ± 0.14 a | 7.03 ± 0.09 a | 10.83 ± 0.05 b | 9.70 ± 0.22 b | 10.06 ± 0.08 cd | 13.85 ± 0.07 b | |
| 22.0 kV–2 min | 7.19 ± 0.18 def | 5.87 ± 0.05 d | 9.68 ± 0.13 e | 8.63 ± 0.05 f | 8.74 ± 0.13 g | 12.04 ± 0.20 g | |
| 27.6 kV–30 s | 7.46 ± 0.31 de | 5.30 ± 0.08 e | 9.82 ± 0.22 de | 7.90 ± 0.08 g | 8.23 ± 0.09 h | 11.06 ± 0.11 h | |
| 27.6 kV–1 min | 6.85 ± 0.29 ef | 5.13 ± 0.05 e | 8.82 ± 0.30 f | 7.83 ± 0.05 g | 8.10 ± 0.26 h | 10.97 ± 0.07 h | |
| 27.6 kV–2 min | 6.68 ± 0.27 f | 5.10 ± 0.08 e | 6.04 ± 0.19 g | 7.73 ± 0.05 g | 7.25 ± 0.16 i | 10.22 ± 0.11 i |
| Tissues | Genes | C-F | C-M | P-F | P-M |
|---|---|---|---|---|---|
| Skeletal muscles | ATP5A1 | 29.81 | 22.50 | 23.85 | 6.35 |
| GH | 62.24 | 46.94 | 52.24 | 32.04 | |
| GHR | 54.33 | 44.17 | 47.33 | 30.67 | |
| IGF1 | 61.79 | 53.57 | 54.64 | 42.50 | |
| IGF1R | 42.35 | 40.00 | 39.12 | 25.88 | |
| AMPKα2 | 40.00 | 52.41 | 57.93 | 73.10 | |
| mTOR | 35.41 | 27.38 | 29.84 | 12.13 | |
| Thyroid glands | TG | 47.42 | 41.82 | 30.61 | 20.61 |
| THRA | 33.68 | 26.05 | 28.03 | 16.45 |
| Gene | Sequence Number | Sequence Position | Product Length (bp) | Annealing Temperature (°C) | Sequence (5′to3′) |
|---|---|---|---|---|---|
| β-actin | NM_205518.1 | 625–818 | 194 | 57 | F: GTGCGTGACATCAAGGAGAAGC |
| R: CCACAGGACTCCATACCCAAGA | |||||
| ATP5A1 | NM_204286.1 | 1207–1364 | 158 | 57 | F: GGTATCCGTCCAGCCATCAA |
| R: GCATCCAAATCAGACCCAAACT | |||||
| ATP5B | NM_001031391.2 | 482–637 | 156 | 57 | F: GCCCCATCACAACGAAACAG |
| R: CGCCTCCAAACAAACCAATC | |||||
| ATP5C1 | NM_001278096.1 | 272–411 | 140 | 57 | F: ATTAAGGCACCCGAGGACAA |
| R: ACTTCCTTCCCTGCATTGGA | |||||
| ATP5F1 | XM_417993.4 | 437–644 | 208 | 57 | F: CATTGGAGACTGCCATTGAGG |
| R: TGATCTTGCTCTTTCTGACGCTT | |||||
| ATP5G1 | XM_001233602.3 | 287–536 | 250 | 57 | F: CAGGAGCAGGTATTGGGACA |
| R: TTGTCAGTCTGGAACGCTCT | |||||
| ATP5G3 | NM_001277855.1 | 141–288 | 148 | 57 | F: CCAAAACGCTGTCTCCCAAC |
| R: ACCGAAGACCGTTCCAATACC | |||||
| ATP5H | XM_001232598.3 | 332–551 | 220 | 57 | F: CTGAAGGTCCCTGAACCAGT |
| R: ACTTCTCCCTGTCCAGTCTG | |||||
| ATP5I | NM_001097534.2 | 74–240 | 167 | 57 | F: TCTCGCCCCTCATCAAGTTC |
| R: TGCCAGTTCCTTTGCAATCC | |||||
| ATP5J | XM_004938370.1 | 58–197 | 140 | 58 | F: CACTTGCGGAGAAACATCGGT |
| R: CCTACATCAACAGGTCCTCCAGC | |||||
| ATP5J2 | NM_001257200.1 | 170–263 | 94 | 57 | F: GCCTCGGTGGTATCAGTATGGT |
| R: TACTTCCTGCGGCGGTCAT | |||||
| ATP5L | XM_015298211 | 250–377 | 128 | 57 | F: CCATGGTCAGGAGCTTTCAG |
| R: GCCTCGTTTGCCTATGATCTC | |||||
| ATP5S | NM_001277562.1 | 46–279 | 234 | 57 | F: TCCCCTTCCCCTTTCTTTCC |
| R: CATAGCCTTGATAGCGCACC | |||||
| GH | NM_204359.2 | 104–284 | 181 | 57 | F: TGTTTGCCAACGCTGTGCT |
| R: TTCTGCTGGGCGTCATCCT | |||||
| GHR | NM_001001293.1 | 1070–1299 | 230 | 57 | F: GTCACACAGTTGCTTGGGAG |
| R: TATGCGGCTGTTGGGTATCT | |||||
| IGF1 | NM_001004384.2 | 188–316 | 129 | 58 | F: AGTTCGTATGTGGAGACAGAGGC |
| R: CCAGCCTCCTCAGGTCACAAC | |||||
| IGF1R | NM_205032.1 | 2961–3114 | 154 | 57 | F: TTGTGCTCCCCATTGCTTTC |
| R: GGAACGTACACATCCGAAGC | |||||
| IGFBP2 | NM_205359.1 | 582–793 | 212 | 57 | F: TCACAACCACGAGGACTCAAAG |
| R: GCTGCCCATTCACCGACAT | |||||
| POU1F1 | NM_204319.1 | 560–754 | 195 | 57 | F: ATGTTGGCGAAGCACTGGC |
| R: GCTTCCTCTTCCGCTCATTCA | |||||
| AMPKα2 | NM_001039605.1 | 726–943 | 218 | 57 | F: GGAGGCGTGTTTTACATCCC |
| R: AACTTCTCACAGACCTCCCG | |||||
| AMPKβ2 | NM_001044662.1 | 435–661 | 227 | 57 | F: CCAGTGTTTTCAGCTCCCAC |
| R: GAGGTCCAGGATAGCGACAA | |||||
| AMPKγ3 | NM_001031258.2 | 183–320 | 138 | 57 | F: GCTGGAACCCGACAACAATT |
| R: GCCTTCTTGATCTCCAGGGT | |||||
| mTOR | XM_417614.4 | 119–309 | 191 | 57 | F: TGAAGGGGTCAAGGCAATCC |
| R: GGCGAGCAGTGGTTGTGGAT | |||||
| PRDX1 | NM_001271932.1 | 358–545 | 188 | 56 | F: ACAAGGTGGTTTGGGCACTA |
| R: TCTCATCAACAGAACGGCCA | |||||
| PRDX3 | XM_426543.5 | 414–551 | 138 | 56 | F: TTTCACCTTTGTGTGCCCCA |
| R: TTGCGCGGGGTATTTATCCA | |||||
| PRDX4 | XM_001233999.3 | 595–733 | 139 | 56 | F: TGCACTTAGGGGCCTTTTCA |
| R: TTCTCCATGCTTGTCCGTGT | |||||
| PRDX6 | NM_001039329.2 | 189–340 | 152 | 58 | F: TGAGTTCAGCAAACGCAACG |
| R: GCTCTCGGTCCTTATCAGCG | |||||
| TG | XM_015283114.1 | 2812–2966 | 155 | 57 | F: GCAGCTTTCCAAACCTTCAG |
| R: GGCTCCAGCACAGAGAAAAC | |||||
| TPO | XM_015284944.1 | 1872–2075 | 204 | 58 | F: TGACGCTCAAAAGCATGAAC |
| R: TGCTTTGGTGTTCCACACAT | |||||
| THRA | NM_205313.1 | 355–636 | 282 | 57 | F: AAGCGCAAAAGAAAGAGCAG |
| R: CACGGAGATGCACTTCTTGA | |||||
| THRB | NM_205447.2 | 976–1150 | 175 | 58 | F: TTTCCTCCTGGCATTTGAAC |
| R: CAGGAACAATGGAGGGAAGA |
| Gene | Chromosome Location | Sequence Position | Product Length (bp) | Annealing Temperature (°C) | Sequence (5′to3′) | Expected No. of CpGs |
|---|---|---|---|---|---|---|
| ATP 5A1 | Z | 1082–1292 | 211 | 55 | F: GAGGTTTTTTGATTGTTTTGTTTGT | 4 |
| R: CCTACCACCTATTTCATTACCCTAAT | ||||||
| GH | 27 | 458–611 | 154 | 53 | F: AAGAAGGGATTTAAGTTTTGATGAG | 10 |
| R: TCCTTCTTAAAACAAAACAACAAAC | ||||||
| GHR | Z | 436–768 | 333 | 53 | F: GTTAAATTGGGATTTATGGGGATAT | 6 |
| R: CAACAACTAAAAACCAAAAAAACTC | ||||||
| IGF1 | 1 | 413–661 | 249 | 53 | F: TTGAGTTGGTTGATGTTTTTTAGTT | 5 |
| R: TCAAATACACTTCCTTTTATACTTTTAACA | ||||||
| IGF1R | 10 | 308–554 | 247 | 52 | F: GTTGAGGGTTTTTTTTAGATTTTGTT | 12 |
| R: TTATATTCCTCAAATTATAAAACCC | ||||||
| AMPKα2 | 8 | 233–463 | 231 | 52 | F: AGAAATTTAAAATTTGAAATTTTTT | 10 |
| R: AAATCCCTATAAACAACCATATATC | ||||||
| mTOR | 21 | 1690–1890 | 201 | 52 | F: ATATTTAGGATGGGTTGTTGAAAAT | 4 |
| R: AAATCAAAAAATACCCTTCAAACTC | ||||||
| TG | 2 | 2943–3144 | 202 | 53 | F: TATTGTTTTTTTTGTGTTGGAGTTT | 12 |
| R: TATATATCCCCCATCAATATCACAC | ||||||
| THRA | 27 | 145–385 | 241 | 51 | F: GGGATGTTGTAGGGAGTTTAGTATT | 19 |
| R: CCAAACATTAACTACTCTTTCTTTTAC |
© 2018 by the authors. Licensee MDPI, Basel, Switzerland. This article is an open access article distributed under the terms and conditions of the Creative Commons Attribution (CC BY) license (http://creativecommons.org/licenses/by/4.0/).
Share and Cite
Zhang, J.J.; Wang, X.Z.; Kwon, T.; Huynh, D.L.; Chandimali, N.; Kim, N.; Kang, T.Y.; Ghosh, M.; Gera, M.; Lee, S.B.; et al. Innovative Approach of Non-Thermal Plasma Application for Improving the Growth Rate in Chickens. Int. J. Mol. Sci. 2018, 19, 2301. https://doi.org/10.3390/ijms19082301
Zhang JJ, Wang XZ, Kwon T, Huynh DL, Chandimali N, Kim N, Kang TY, Ghosh M, Gera M, Lee SB, et al. Innovative Approach of Non-Thermal Plasma Application for Improving the Growth Rate in Chickens. International Journal of Molecular Sciences. 2018; 19(8):2301. https://doi.org/10.3390/ijms19082301
Chicago/Turabian StyleZhang, Jiao Jiao, Xian Zhong Wang, Taeho Kwon, Do Luong Huynh, Nisansala Chandimali, Nameun Kim, Tae Yoon Kang, Mrinmoy Ghosh, Meeta Gera, Sang Baek Lee, and et al. 2018. "Innovative Approach of Non-Thermal Plasma Application for Improving the Growth Rate in Chickens" International Journal of Molecular Sciences 19, no. 8: 2301. https://doi.org/10.3390/ijms19082301
APA StyleZhang, J. J., Wang, X. Z., Kwon, T., Huynh, D. L., Chandimali, N., Kim, N., Kang, T. Y., Ghosh, M., Gera, M., Lee, S. B., Lee, S. J., Lee, W. S., Kim, S. B., Mok, Y. S., & Jeong, D. K. (2018). Innovative Approach of Non-Thermal Plasma Application for Improving the Growth Rate in Chickens. International Journal of Molecular Sciences, 19(8), 2301. https://doi.org/10.3390/ijms19082301