The Role of the Nuclear Factor κB Pathway in the Cellular Response to Low and High Linear Energy Transfer Radiation

 ,
,  , and
, and
Abstract
:
1. Introduction
2. Results
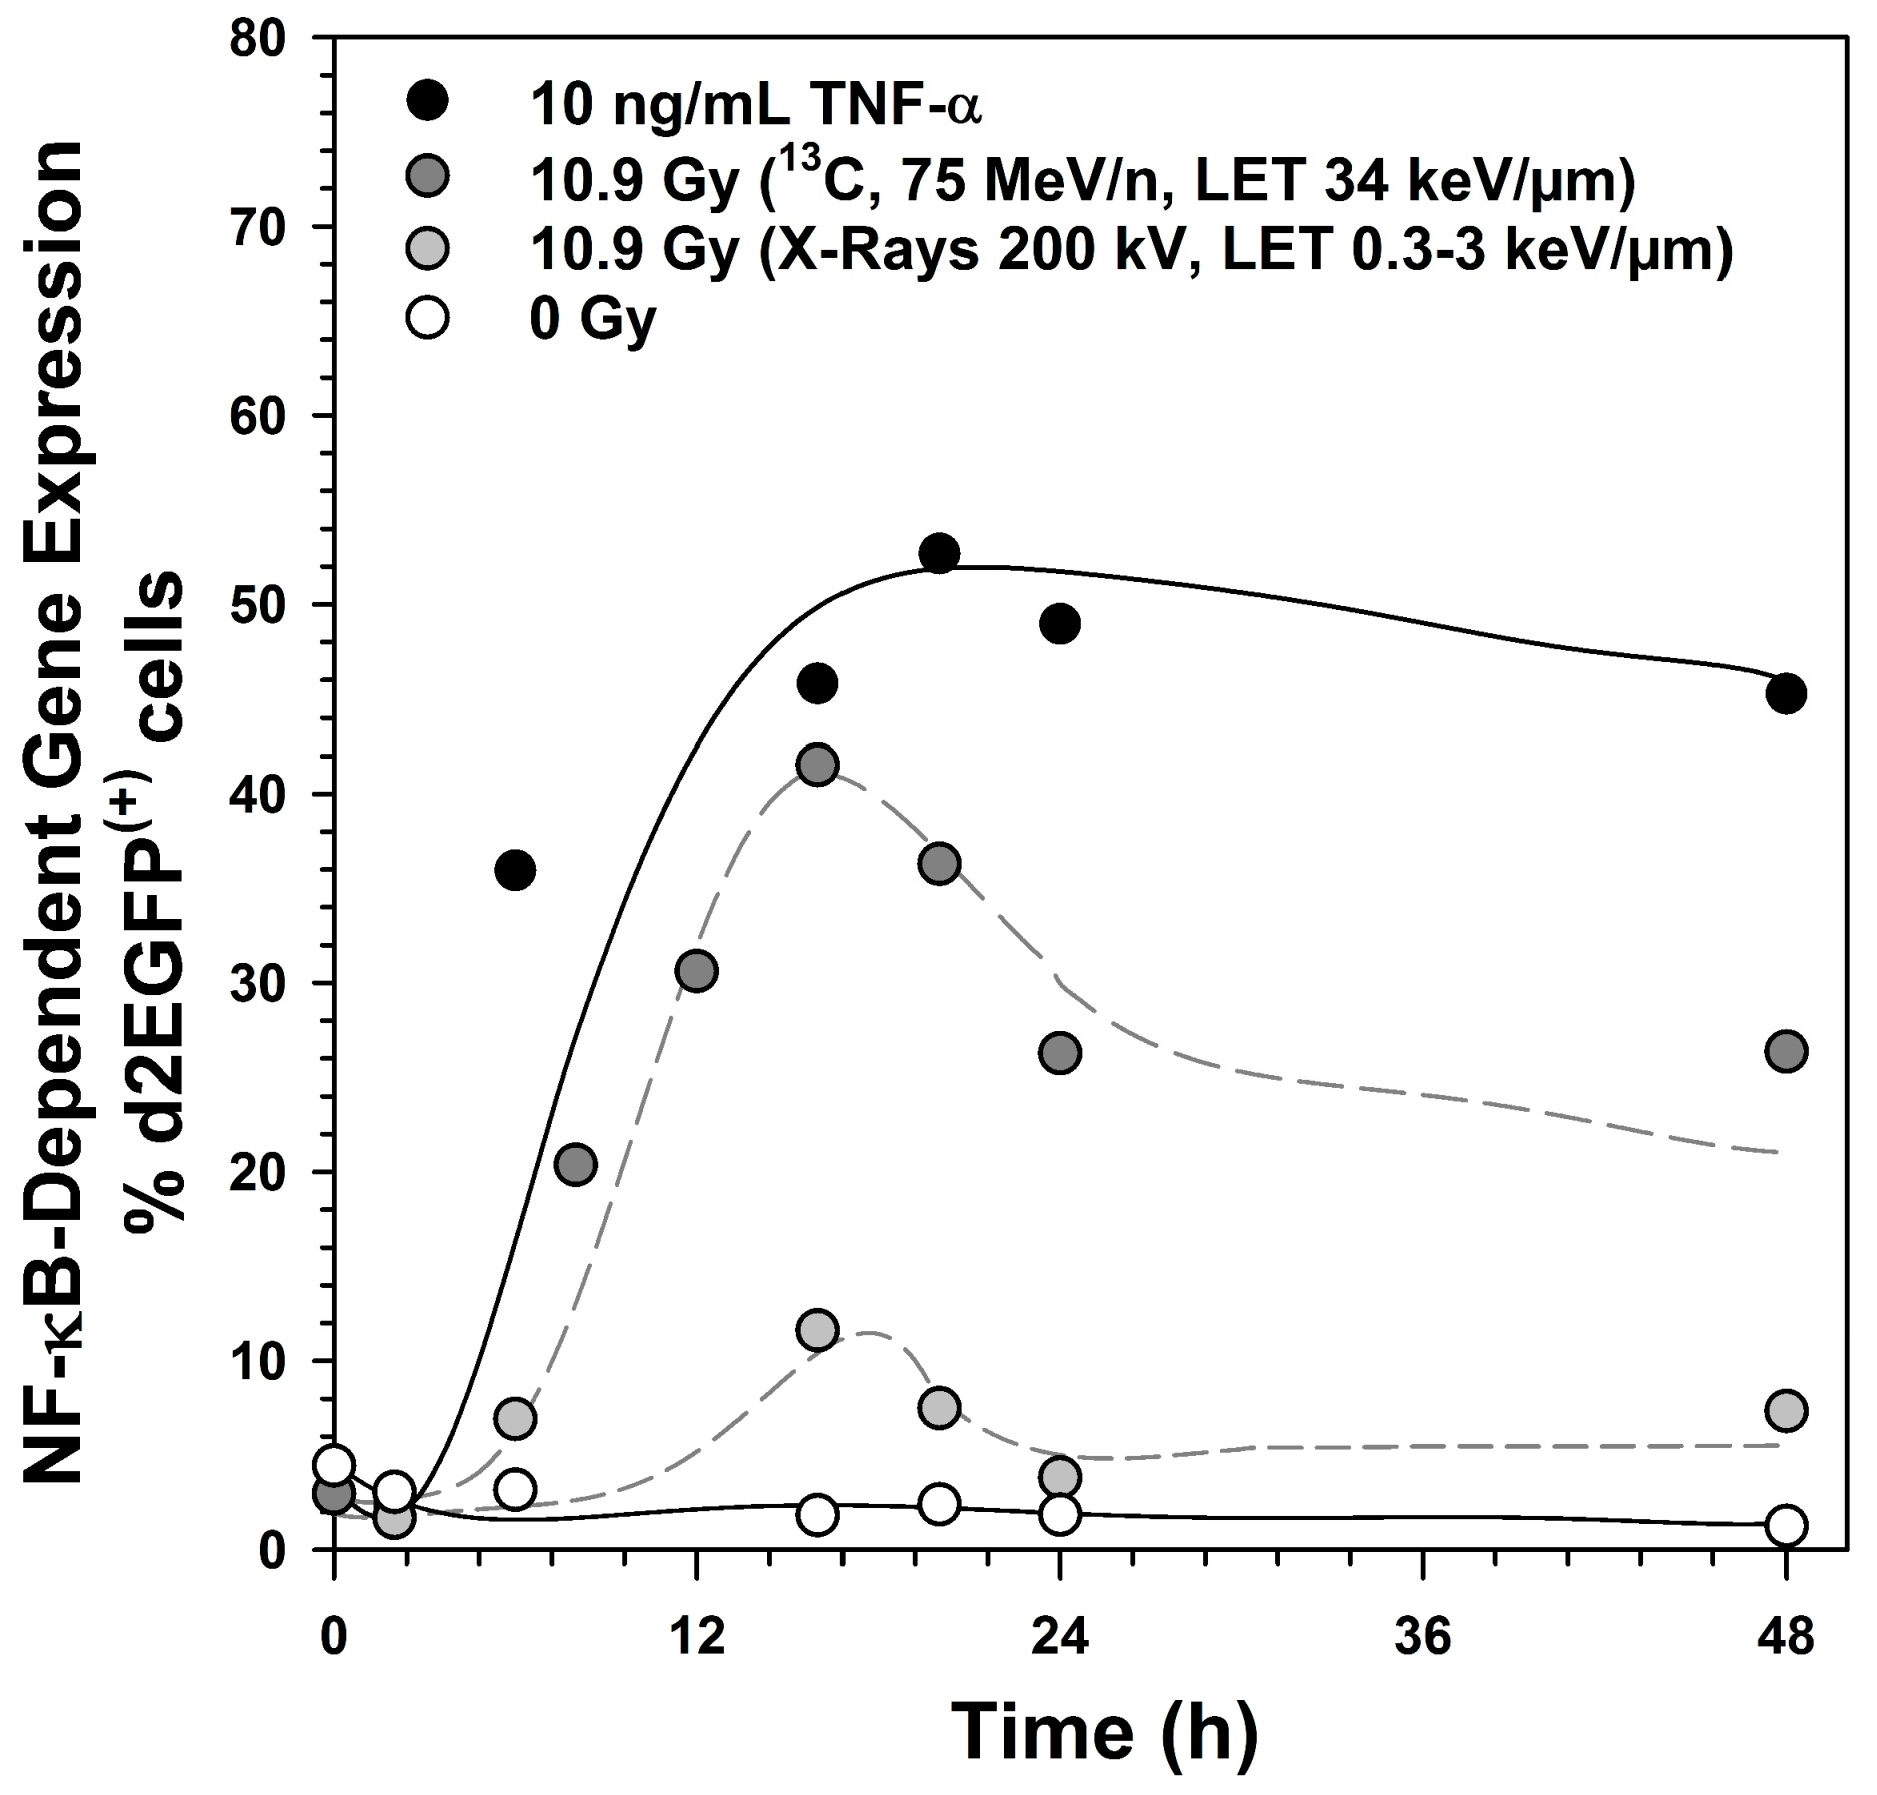
2.1. Kinetics of NF-κB Activation
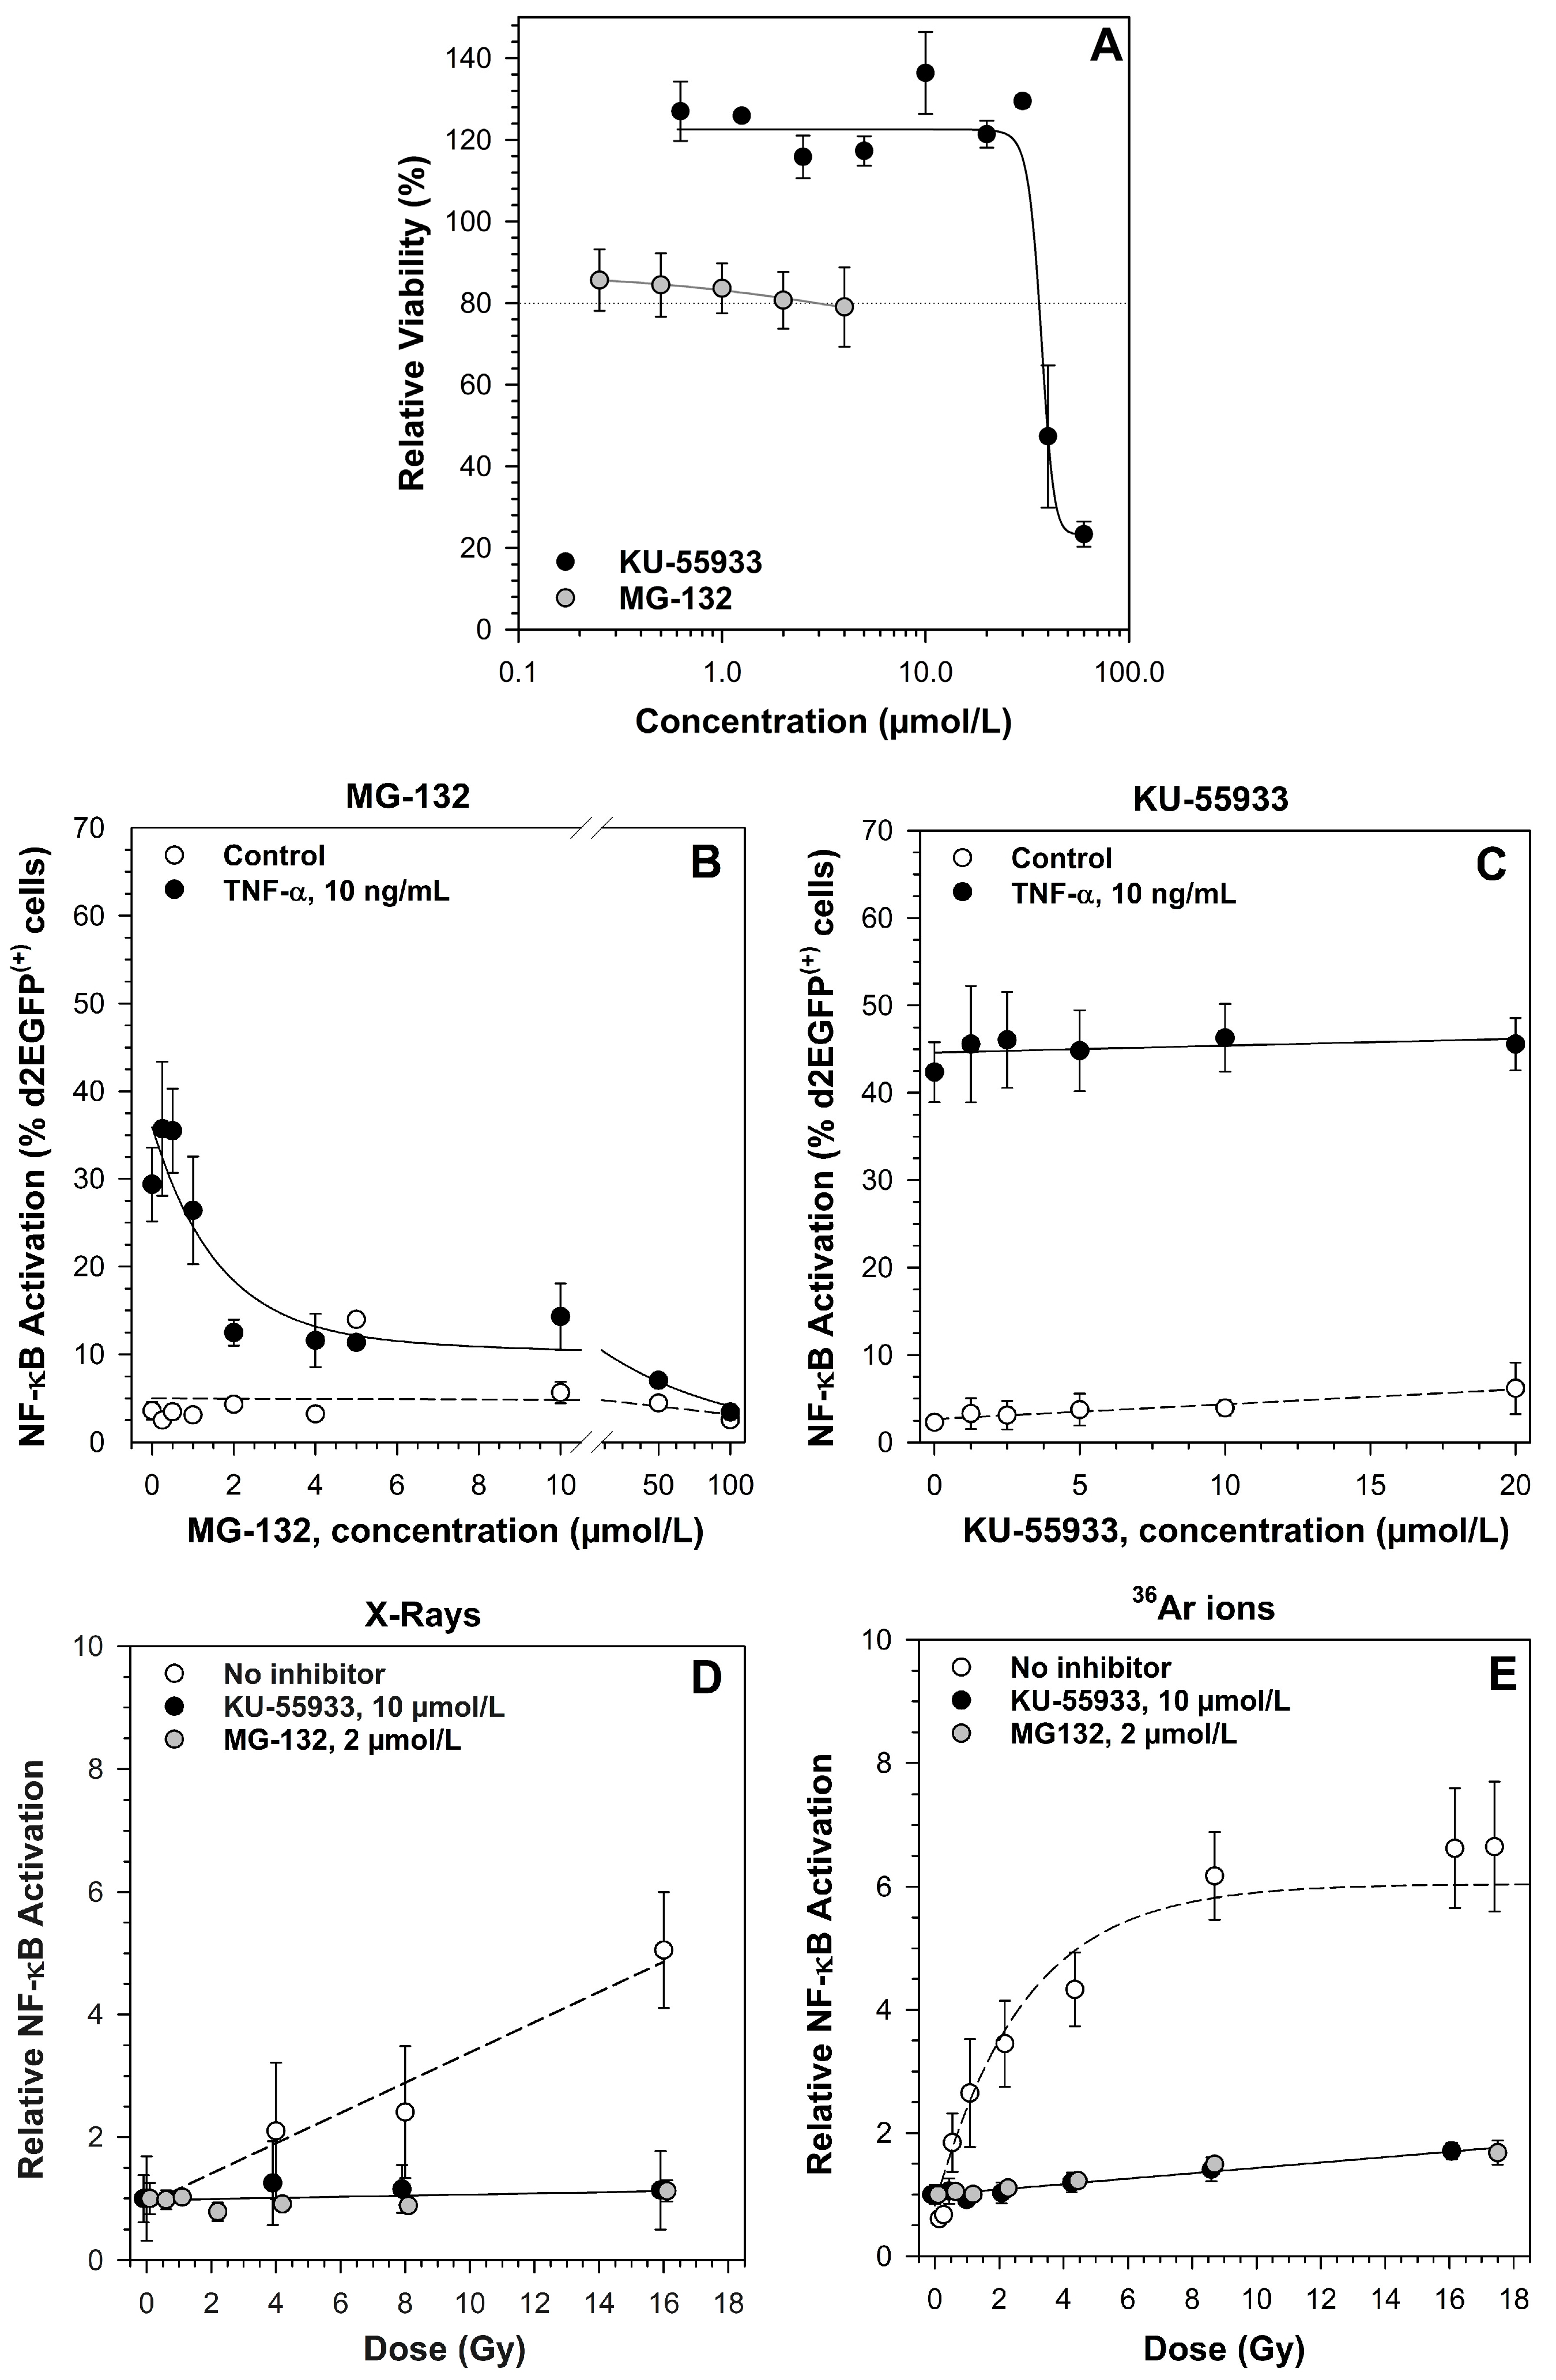
2.2. Ataxia Telangiectasia Mutated (ATM) and the Proteasome Are Required for NF-κB Activation by X-rays and Heavy Ion Exposure
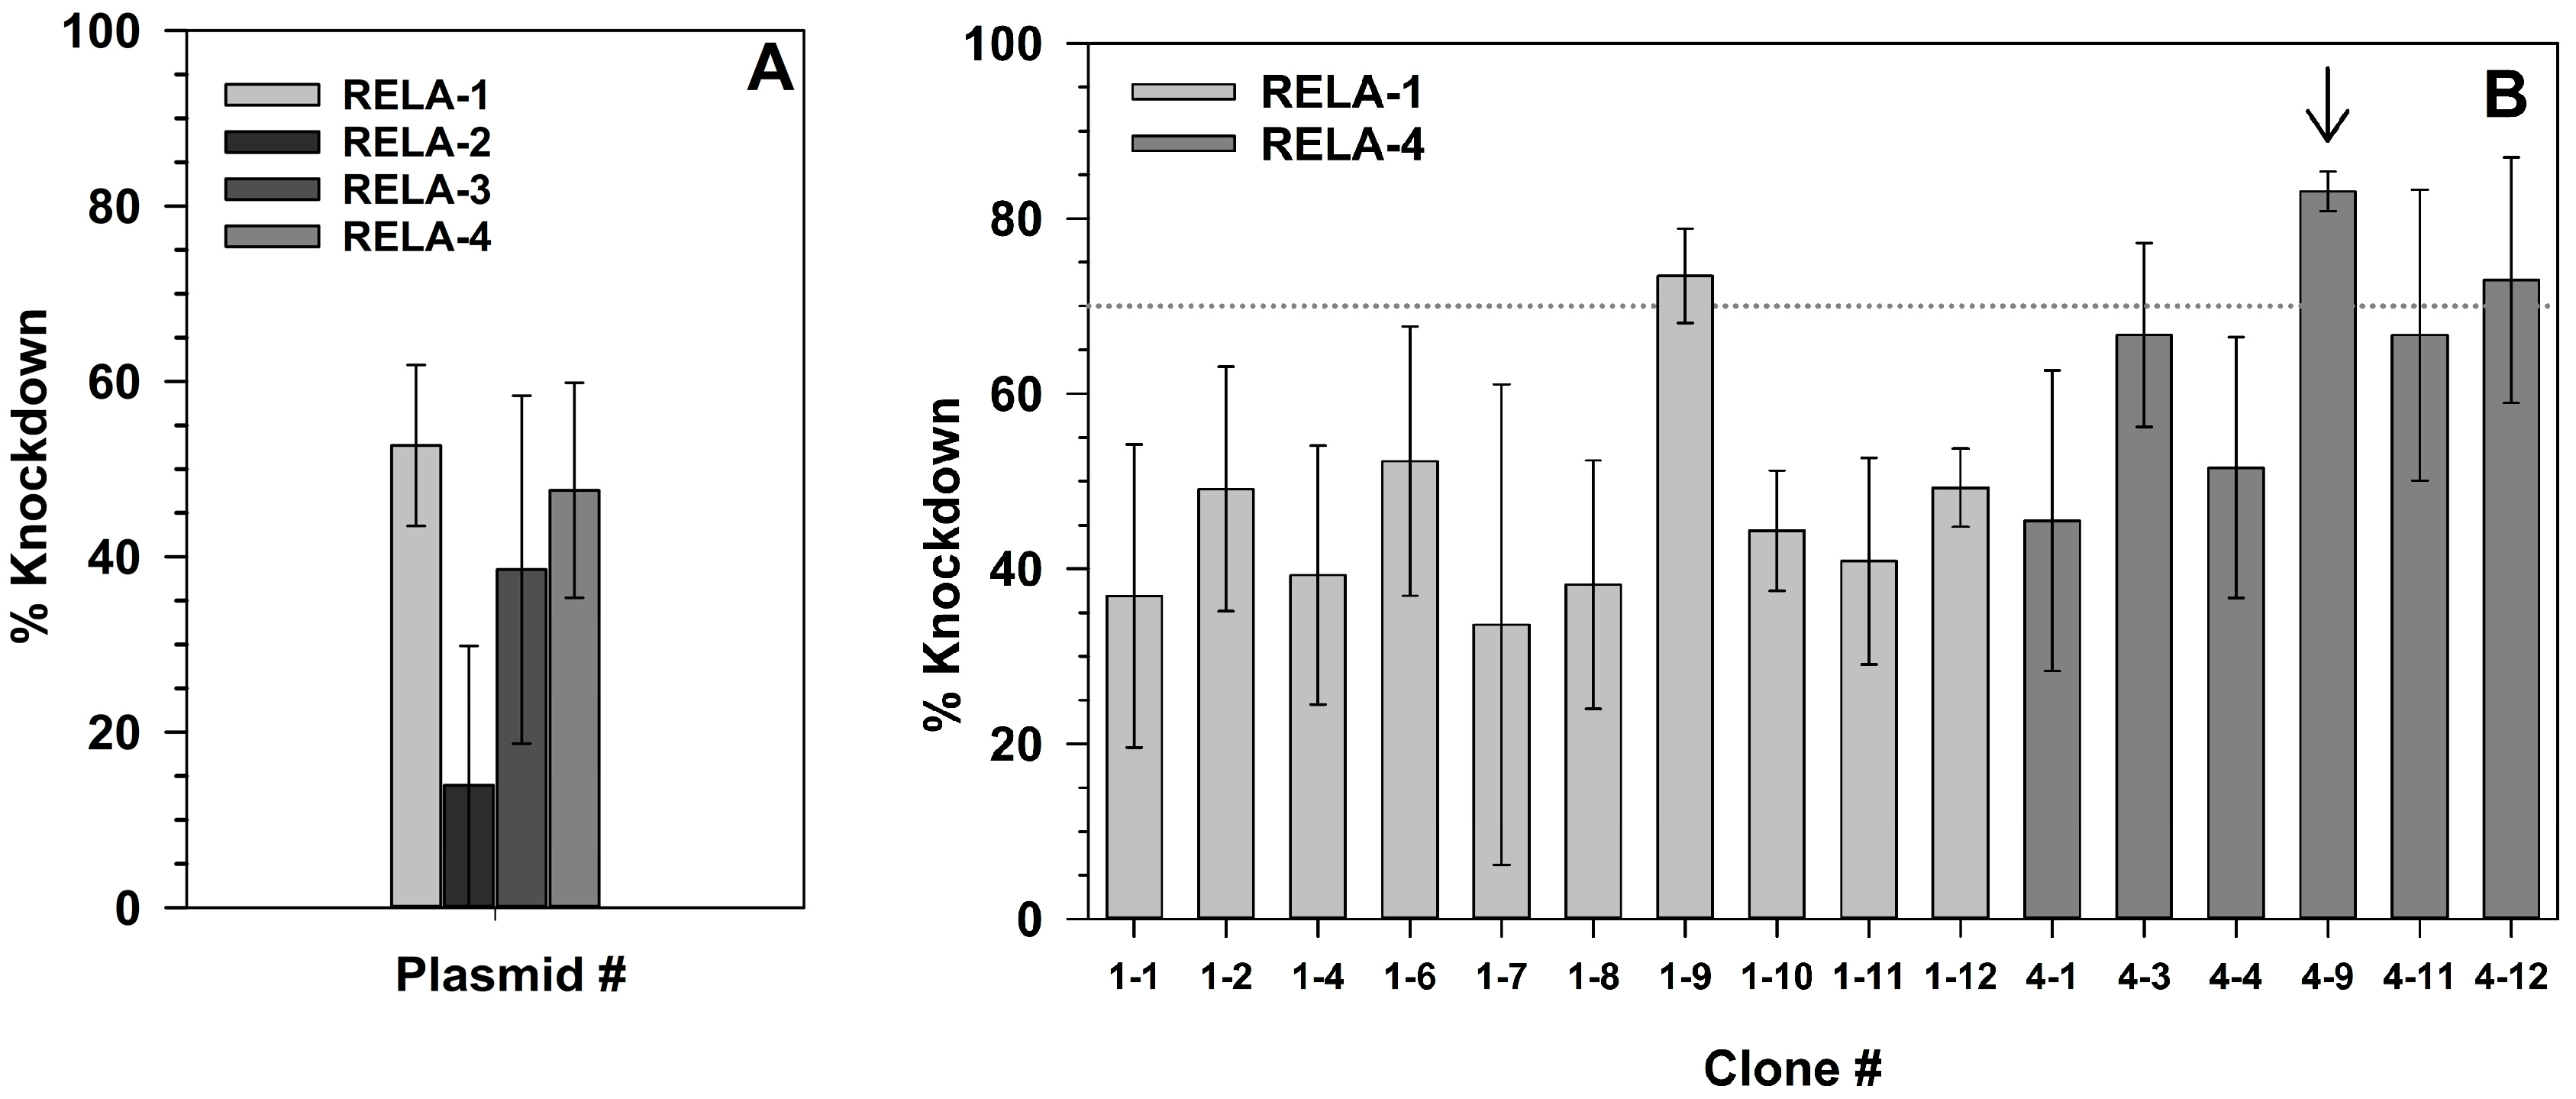
2.3. Effect of RelA Knock-Down on NF-κB-Dependent Gene Expression
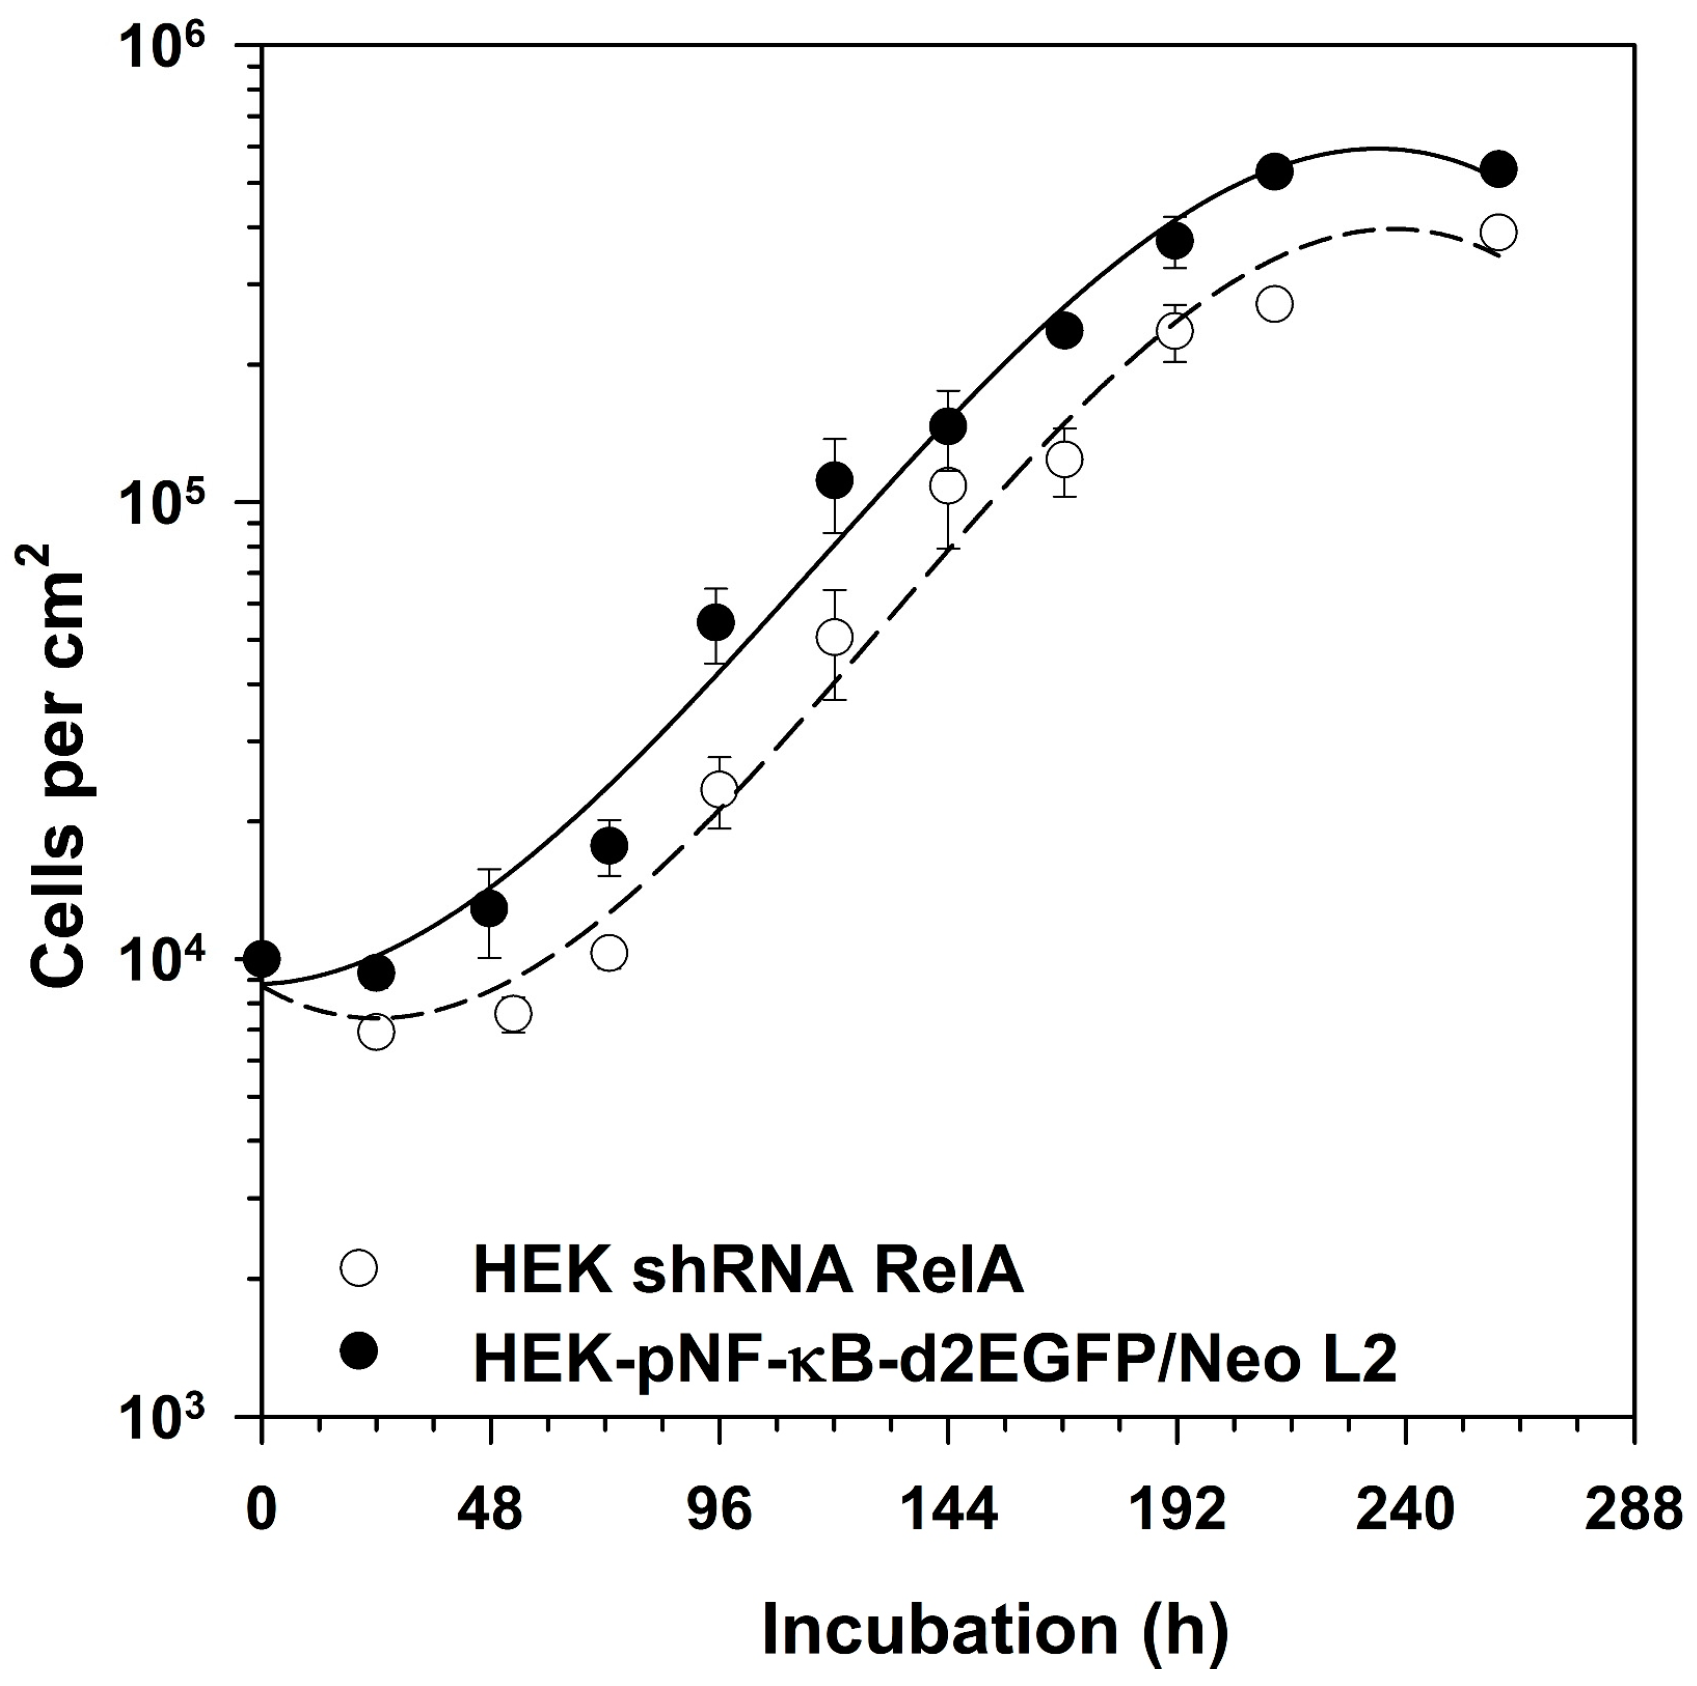
2.4. Growth of RelA Knock-Down Cells
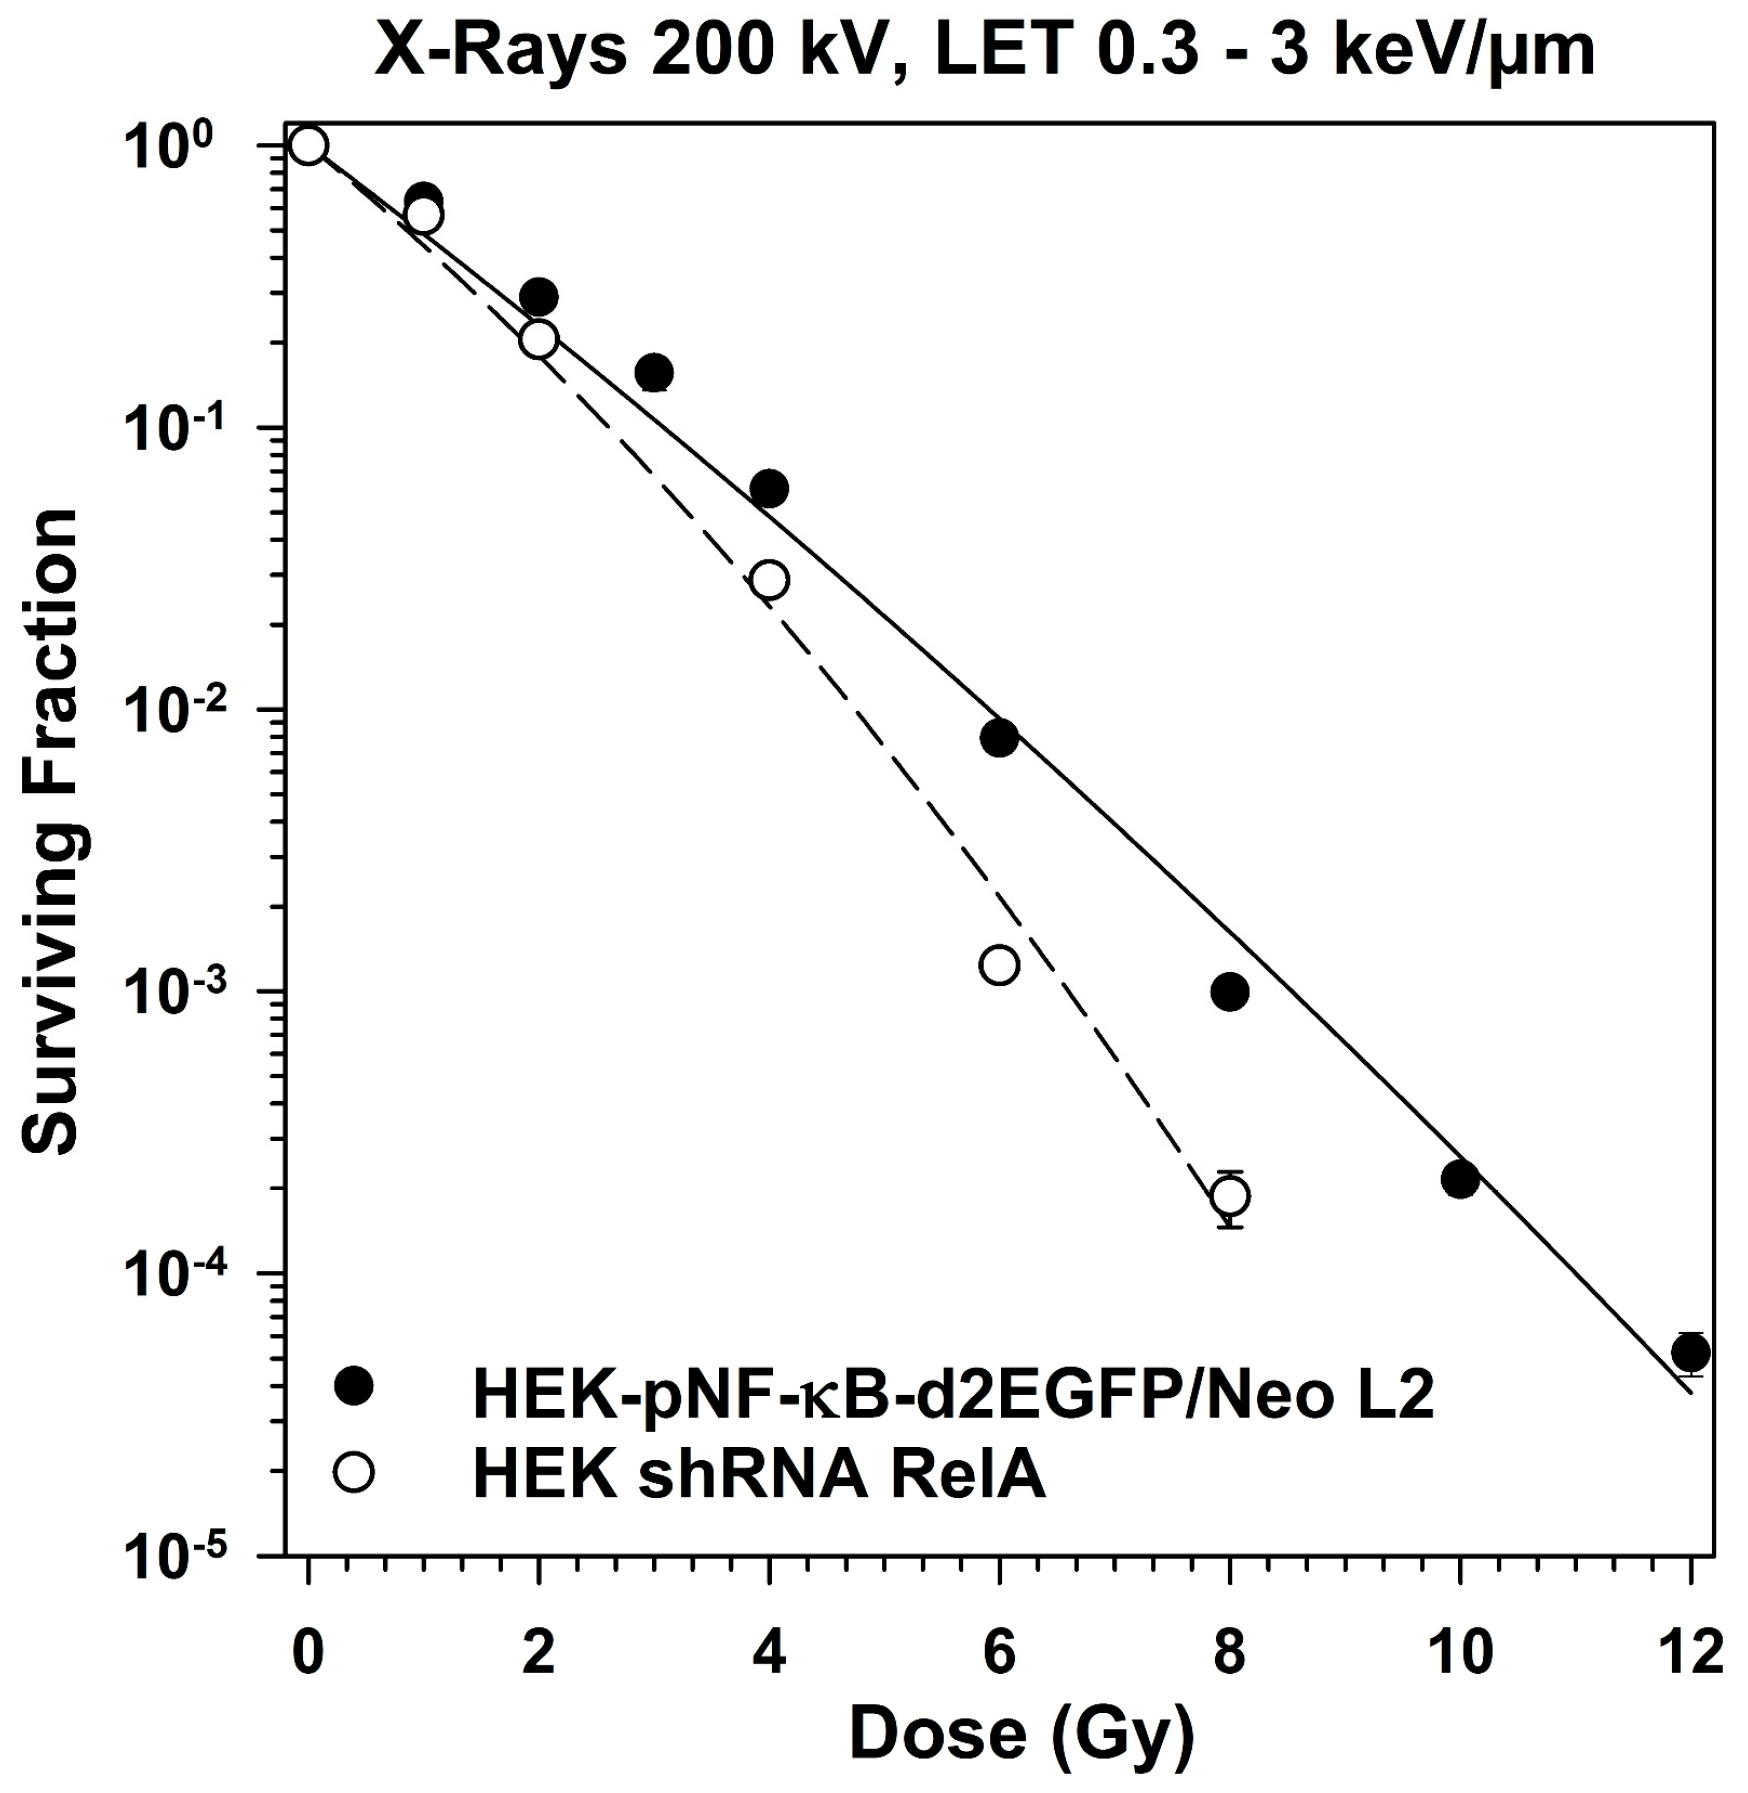
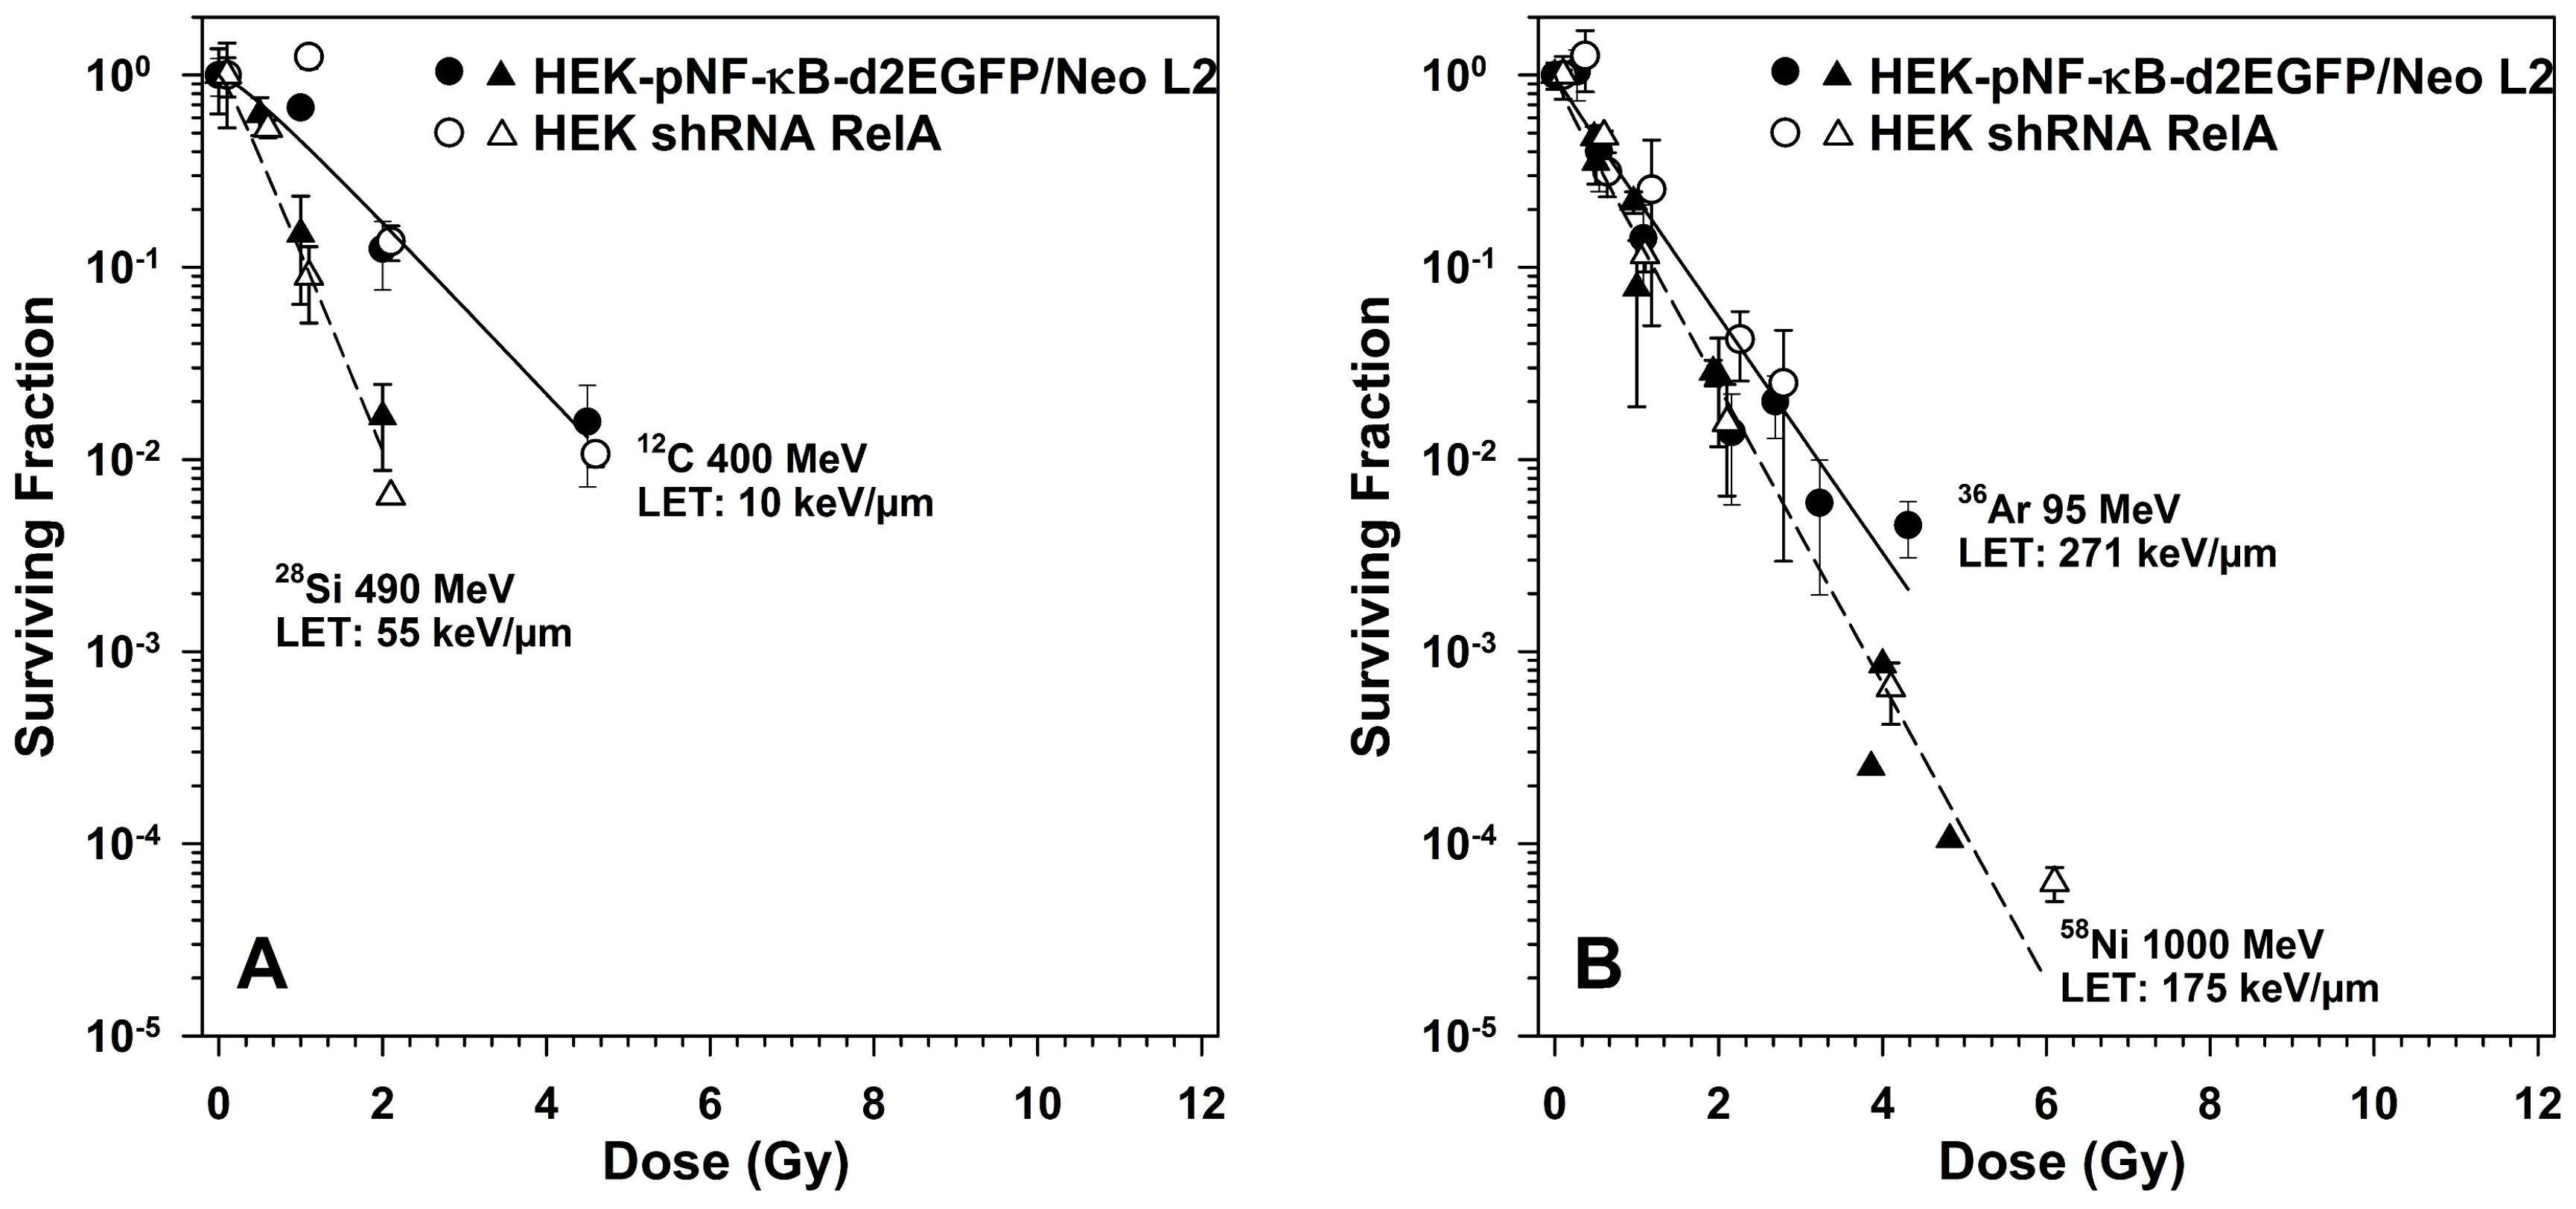
2.5. Survival of RelA Knock-Down Cells After X-ray and after Heavy Ion Exposure
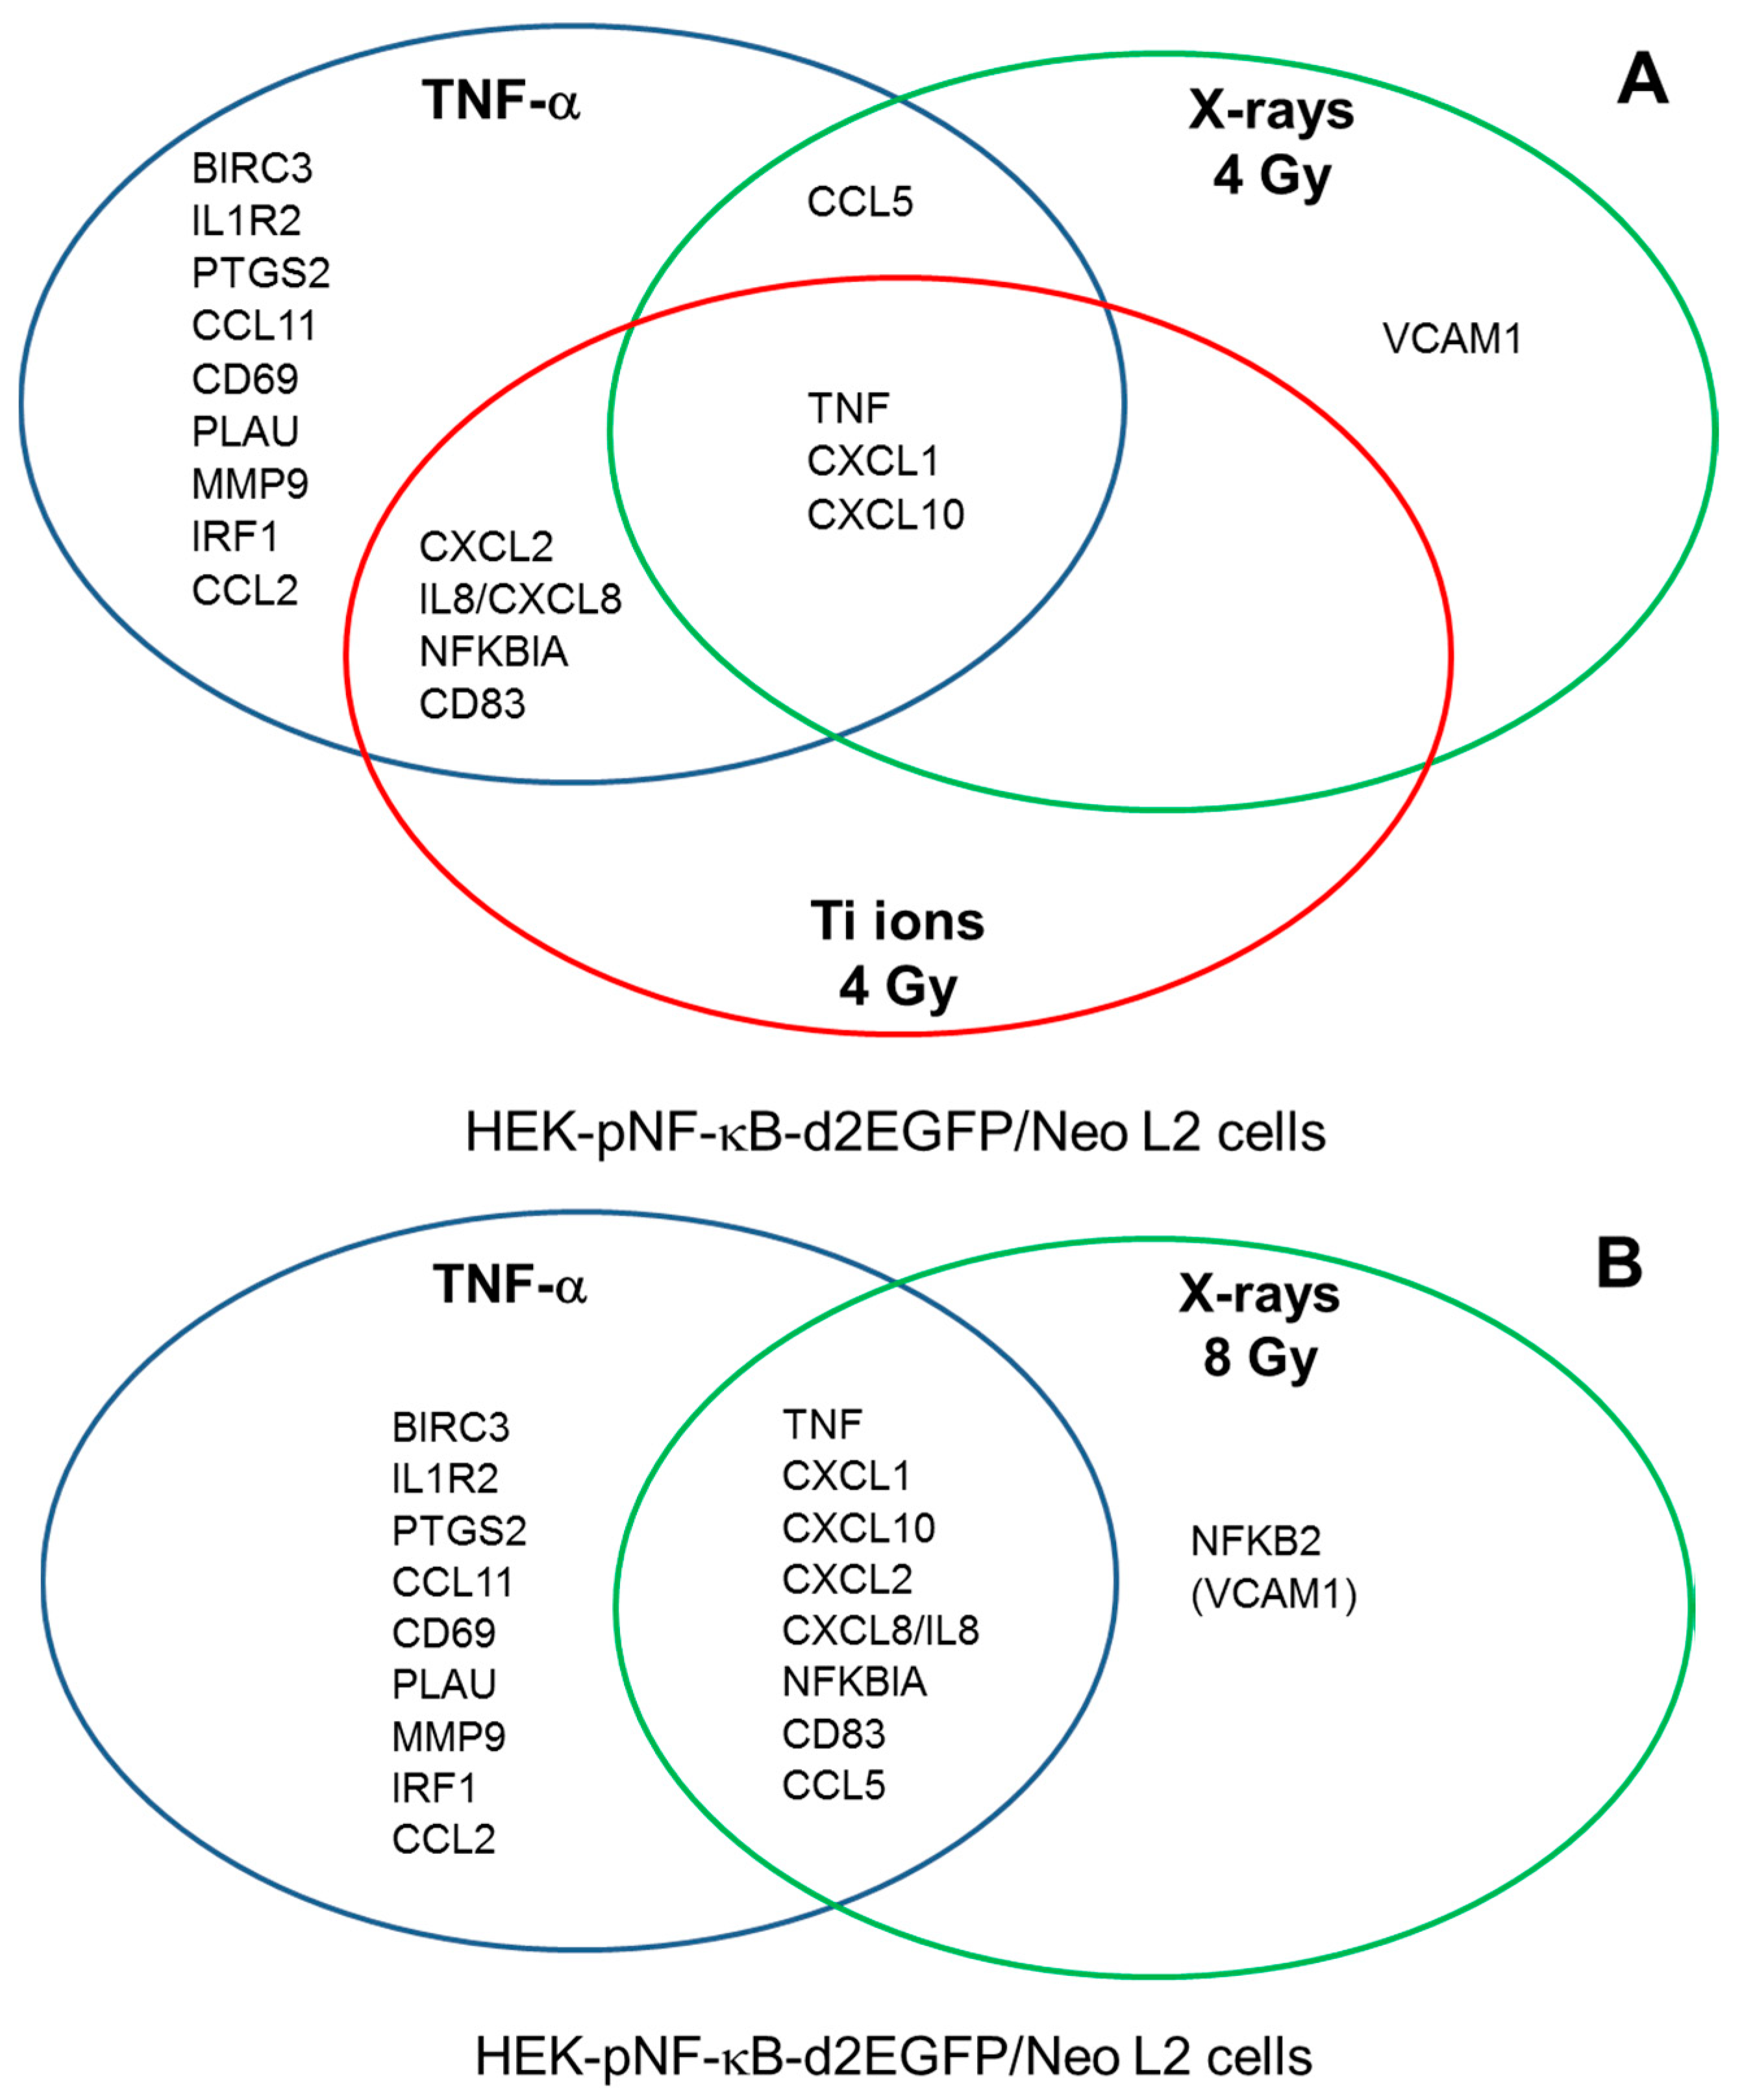
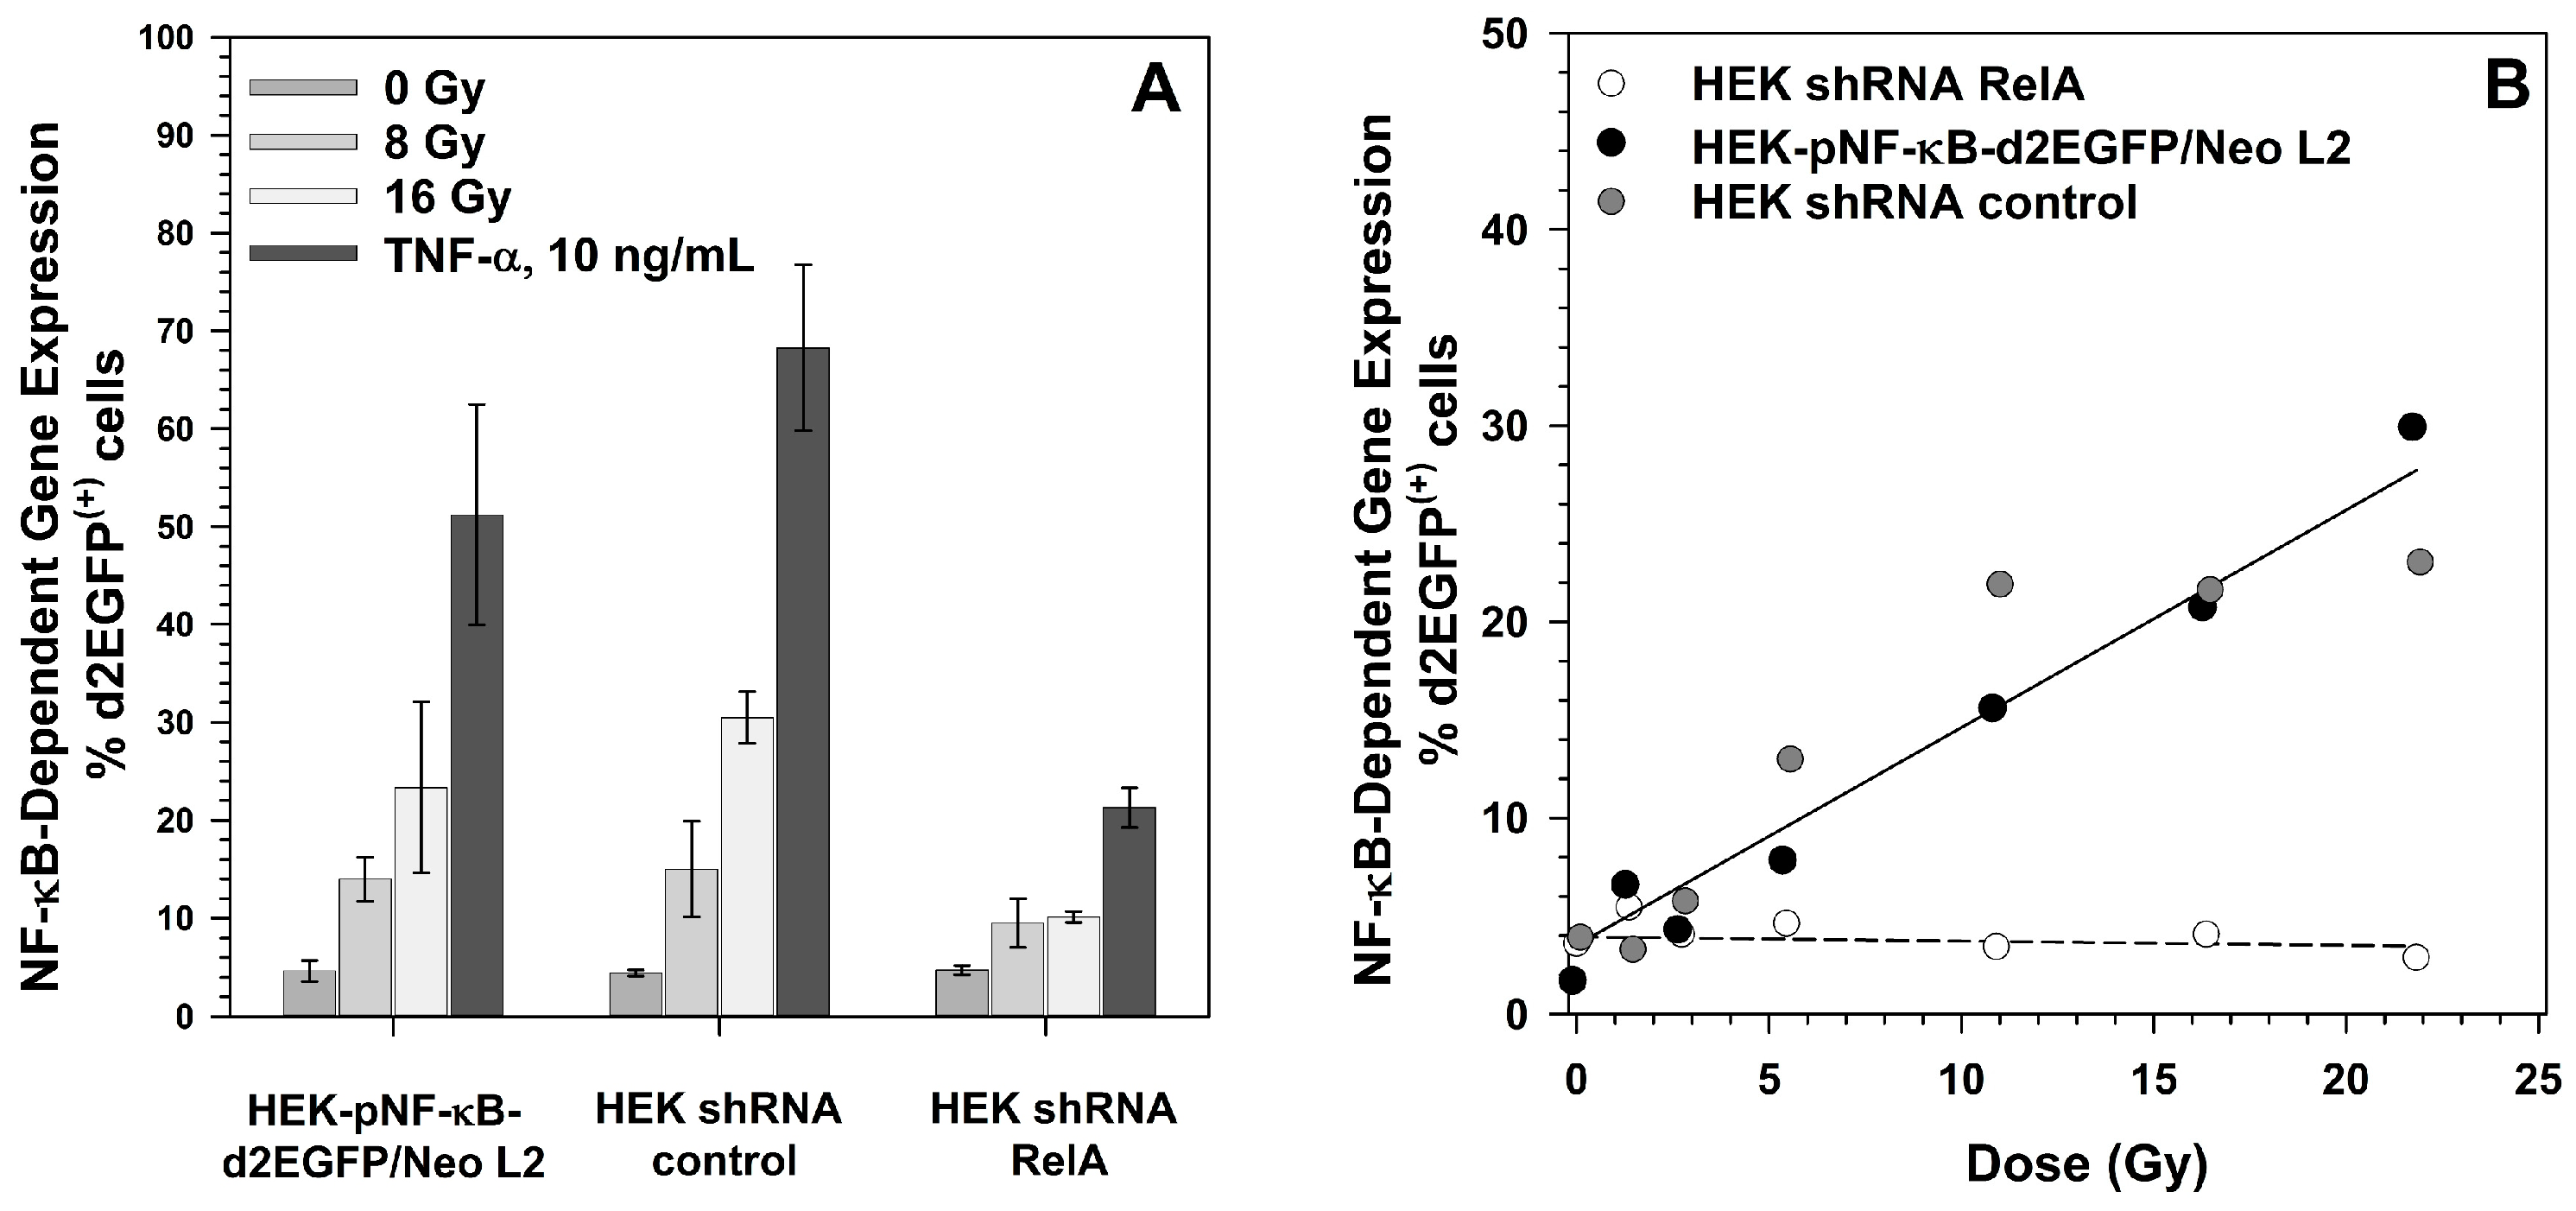
2.6. Induction of NF-κB Target Gene Expression by Exposure to Different Radiation Qualities
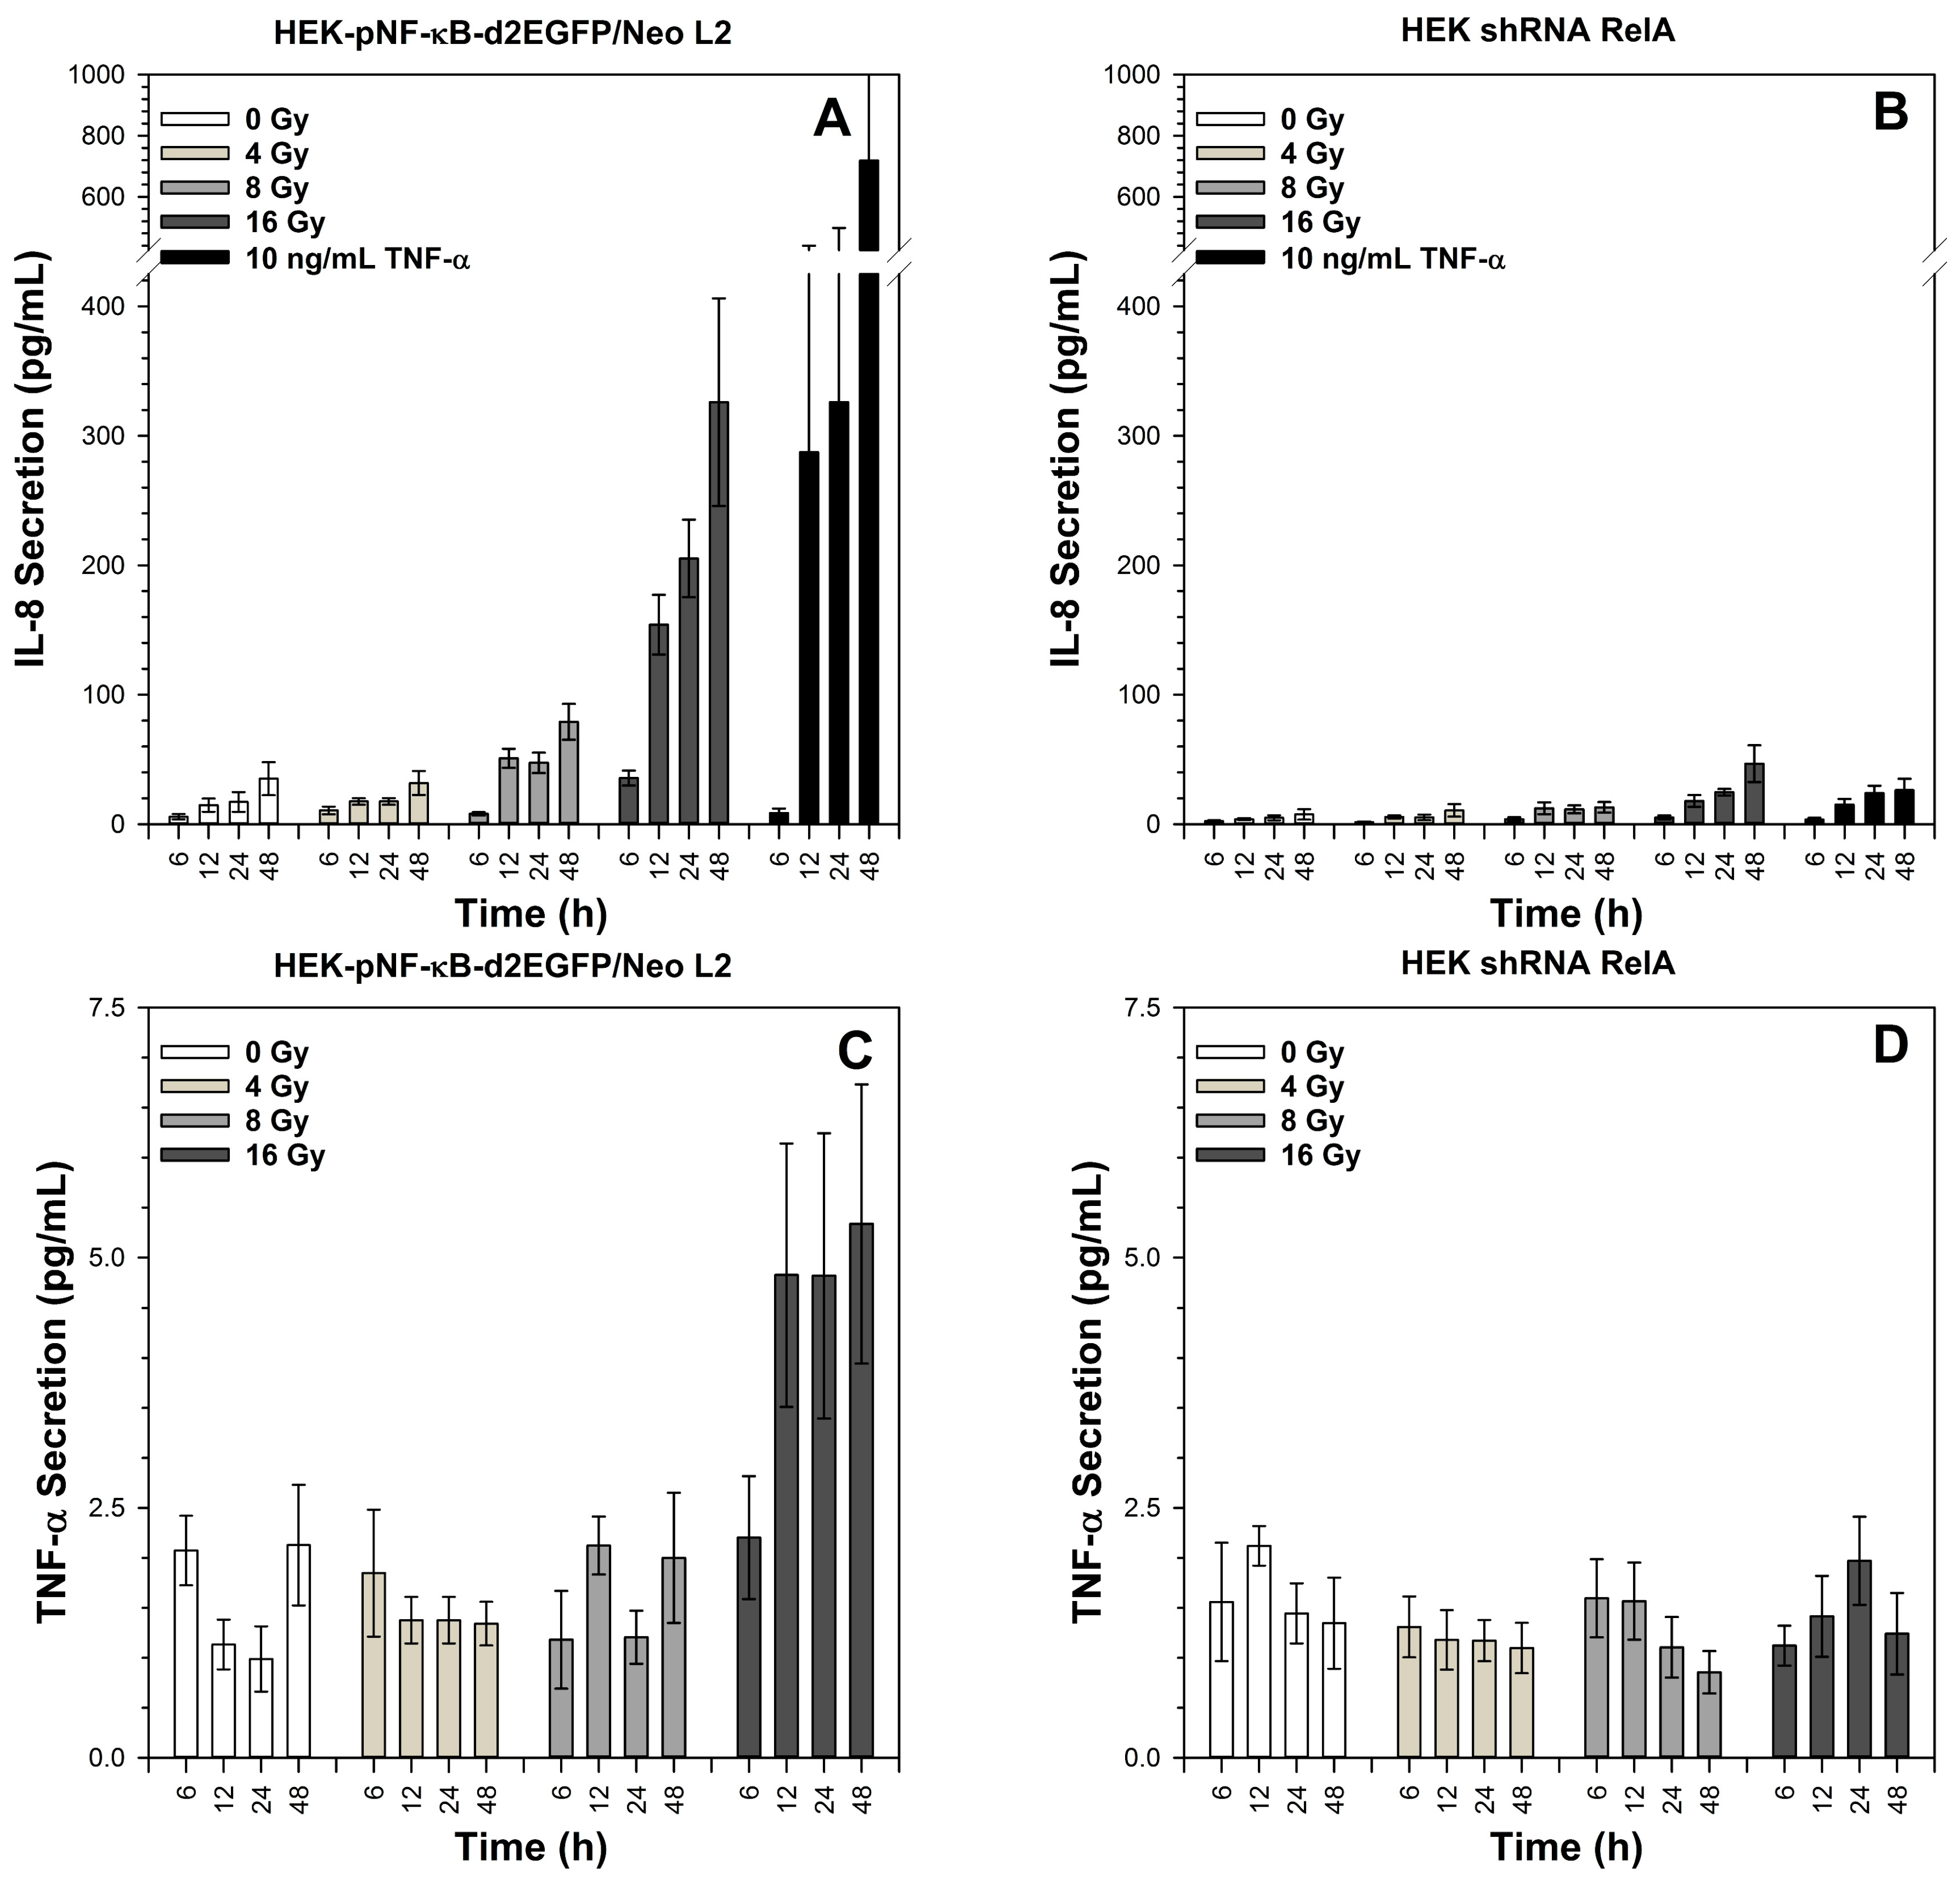
2.7. Secretion of TNF-α and IL-8 after X-Irradiation
3. Discussion
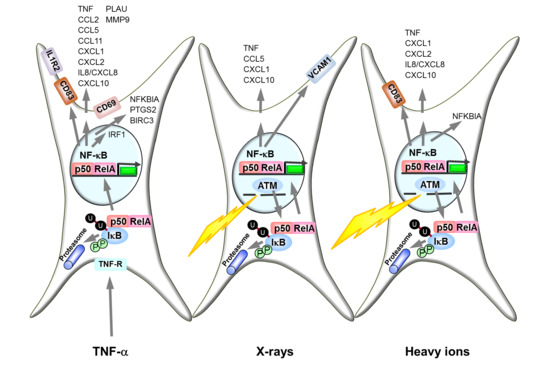
3.1. Activation of the NF-κB Pathway by Different Radiation Qualities
3.2. NF-κB Activation by Ionizing Radiation Is ATM Dependent
3.3. IκB Degradation by the Proteasome Is Essential for TNF-α and Ionizing Radiation-Induced NF-κB Activity
3.4. Role of RelA in Cell Proliferation
3.5. Role of RelA in Clonogenic Survival after Exposure to Different Radiation Qualities
3.6. Role of RelA in the Expression of NF-κB Target Genes after Exposure to Different Radiation Qualities
3.7. Role of RelA in IL-8 and TNF-α Production for Survival after Exposure to Different Radiation Qualities
3.8. Implications for Countermeasure Development
3.9. Conclusions
4. Materials and Methods
4.1. Transformation and Preparation of Plasmid DNA
4.2. Cell Culture
4.3. Stable Transfection
4.4. Growth Kinetics
4.5. Treatment Modalities
4.5.1. Cytokine Treatment
4.5.2. X-Irradiation
4.5.3. Heavy Ion Exposure
4.6. Cytotoxicity of Chemical Inhibitors
4.7. Colony Forming Ability
4.8. Flow Cytometry
4.9. Gene Expression Analysis
4.9.1. RNA Isolation
4.9.2. cDNA Synthesis
4.9.3. Setting Up RT-qPCR Validation of Knock-Down-Level
4.9.4. Human RT2 Profiler PCR Array
4.10. Measurement of Cytokine Secretion
4.11. Statistics
Author Contributions
Funding
Acknowledgments
Conflicts of Interest
Abbreviations
| AP-1 | activated protein 1 |
| ATCC | American Type Culture Collection |
| CIMAP | Centre de recherches sur les Ions, les Matériaux et la Photonique |
| d2EGFP | destabilized EGFP |
| DDR | DNA damage response |
| DNA-PK | DNA-dependent protein kinase |
| DSB | double strand break |
| EGFP | Enhanced Green Fluorescent Protein |
| ESCC | esophageal squamous cell cancer |
| EXO1 | exonuclease 1 |
| FBS | fetal bovine serum |
| GANIL | “Grand Accélérateur National d’Ions Lourds” |
| GSI | GSI Helmholtzzentrum für Schwerionenforschung GmbH |
| HEK | human embryonic kidney |
| HIMAC | Heavy Ion Medical Accelerator in Chiba |
| HR | Homologous Recombination |
| HSPC | hematopoietic stem and progenitor cells |
| IAP | inhibitor of apoptosis protein |
| IκBα | inhibitor of NF-κB α |
| IKK | IκB kinase |
| IκBα-SR | super-repressor variant of IκBα |
| ISS | International Space Station |
| k.d. | knock-down |
| LARIA | “Laboratoire d’Accueil en Radiobiologie avec les Ions Accélérés” |
| LET | linear energy transfer |
| MDR1 | multi-drug resistance |
| MeV/n | Mega electron Volt per nucleon |
| MnSOD | manganese superoxide dismutase |
| mRNA | messenger RNA |
| NF-κB | Nuclear factor κB |
| NHEJ | Non-Homologous Endjoining |
| NPCs | neural progenitor cells |
| NRE | NF-κB response element |
| NSCs | neural stem cells |
| P | probability |
| PBL | peripheral blood lymphocytes |
| PBS | phosphate buffered saline |
| PI3K | phosphatidyl inositol kinase 3 |
| RBE | relative biologic effectiveness |
| Rel | Reticuloendotheliosis |
| RT-qPCR | Reverse Transcriptase real-time quantitative PCR |
| shRNA RelA | RelA short-hairpin RNA |
| SD | standard deviation |
| SE | standard error |
| TK | thymidine kinase |
| TLR5 | Toll-like receptor 5 |
| TNF-α | tumor necrosis factor α |
| TP53 | tumor protein p53 |
Appendix A

| UniGene | GeneBank | Symbol | Description | Gene Names |
|---|---|---|---|---|
| Hs.441047 | NM_001124 | ADM | Adrenomedullin | AM |
| Hs.19383 | NM_000029 | AGT | Angiotensinogen (serpin peptidase inhibitor, clade A, member 8) | ANHU, FLJ92595, FLJ97926, SERPINA8 |
| Hs.525622 | NM_005163 | AKT1 | V-akt murine thymoma viral oncogene homolog 1 | AKT, MGC99656, PKB, PKB-ALPHA, PRKBA, RAC, RAC-ALPHA |
| Hs.499886 | NM_000382 | ALDH3A2 | Aldehyde dehydrogenase 3 family, member A2 | ALDH10, DKFZp686E23276, FALDH, FLJ20851, SLS |
| Hs.227817 | NM_004049 | BCL2A1 | BCL2-related protein A1 | ACC-1, ACC-2, BCL2L5, BFL1, GRS, HBPA1 |
| Hs.516966 | NM_138578 | BCL2L1 | BCL2-like 1 | BCL-XL, S, BCL2L, BCLX, BCLXL, BCLXS, Bcl-X, DKFZp781P2092, bcl-xL, bcl-xS |
| Hs.696238 | NM_001166 | BIRC2 | Baculoviral IAP repeat containing 2 | API1, HIAP2, Hiap-2, MIHB, RNF48, c-IAP1, cIAP1 |
| Hs.127799 | NM_001165 | BIRC3 | Baculoviral IAP repeat containing 3 | AIP1, API2, CIAP2, HAIP1, HIAP1, MALT2, MIHC, RNF49, c-IAP2 |
| Hs.529053 | NM_000064 | C3 | Complement component 3 | AHUS5, ARMD9, ASP, CPAMD1 |
| Hs.54460 | NM_002986 | CCL11 | Chemokine (C-C motif) ligand 11 | MGC22554, SCYA11 |
| Hs.303649 | NM_002982 | CCL2 | Chemokine (C-C motif) ligand 2 | GDCF-2, HC11, HSMCR30, MCAF, MCP-1, MCP1, MGC9434, SCYA2, SMC-CF |
| Hs.534347 | NM_002990 | CCL22 | Chemokine (C-C motif) ligand 22 | ABCD-1, DC, B-CK, MDC, MGC34554, SCYA22, STCP-1 |
| Hs.514821 | NM_002985 | CCL5 | Chemokine (C-C motif) ligand 5 | D17S136E, MGC17164, RANTES, SCYA5, SISd, TCP228 |
| Hs.523852 | NM_053056 | CCND1 | Cyclin D1 | BCL1, D11S287E, PRAD1, U21B31 |
| Hs.450802 | NM_000579 | CCR5 | Chemokine (C-C motif) receptor 5 | CC-CKR-5, CCCKR5, CD195, CKR-5, CKR5, CMKBR5, FLJ78003, IDDM22 |
| Hs.472860 | NM_001250 | CD40 | CD40 molecule, TNF receptor superfamily member 5 | Bp50, CDW40, MGC9013, TNFRSF5, p50 |
| Hs.208854 | NM_001781 | CD69 | CD69 molecule | CLEC2C |
| Hs.838 | NM_005191 | CD80 | CD80 molecule | B7, B7-1, B7.1, BB1, CD28LG, CD28LG1, LAB7 |
| Hs.595133 | NM_004233 | CD83 | CD83 molecule | BL11, HB15 |
| Hs.370771 | NM_000389 | CDKN1A | Cyclin-dependent kinase inhibitor 1A (p21, Cip1) | CAP20, CDKN1, CIP1, MDA-6, P21, SDI1, WAF1, p21CIP1 |
| Hs.69771 | NM_001710 | CFB | Complement factor B | AHUS4, BF, BFD, CFAB, FB, FBI12, FLJ54899, GBG, H2-Bf, PBF2 |
| Hs.591402 | NM_000757 | CSF1 | Colony stimulating factor 1 (macrophage) | MCSF, MGC31930 |
| Hs.1349 | NM_000758 | CSF2 | Colony stimulating factor 2 (granulocyte-macrophage) | GMCSF, MGC131935, MGC138897 |
| Hs.592192 | NM_000395 | CSF2RB | Colony stimulating factor 2 receptor, beta, low-affinity (granulocyte-macrophage) | CD131, CDw131, IL3RB, IL5RB |
| Hs.2233 | NM_000759 | CSF3 | Colony stimulating factor 3 (granulocyte) | C17orf33, CSF3OS, GCSF, MGC45931 |
| Hs.789 | NM_001511 | CXCL1 | Chemokine (C-X-C motif) ligand 1 (melanoma growth stimulating activity, alpha) | FSP, GRO1, GROa, MGSA, MGSA-a, NAP-3, SCYB1 |
| Hs.632586 | NM_001565 | CXCL10 | Chemokine (C-X-C motif) ligand 10 | C7, IFI10, INP10, IP-10, SCYB10, crg-2, gIP-10, mob-1 |
| Hs.590921 | NM_002089 | CXCL2 | Chemokine (C-X-C motif) ligand 2 | CINC-2a, GRO2, GROb, MGSA-b, MIP-2a, MIP2, MIP2A, SCYB2 |
| Hs.77367 | NM_002416 | CXCL9 | Chemokine (C-X-C motif) ligand 9 | CMK, Humig, MIG, SCYB9, crg-10 |
| Hs.488293 | NM_005228 | EGFR | Epidermal growth factor receptor | ERBB, ERBB1, HER1, PIG61, mENA |
| Hs.1395 | NM_000399 | EGR2 | Early growth response 2 | AT591, CMT1D, CMT4E, DKFZp686J1957, FLJ14547, KROX20 |
| Hs.62192 | NM_001993 | F3 | Coagulation factor III (thromboplastin, tissue factor) | CD142, FLJ17960, TF, TFA |
| Hs.654450 | NM_000132 | F8 | Coagulation factor VIII, procoagulant component | AHF, DXS1253E, F8B, F8C, FVIII, HEMA |
| Hs.244139 | NM_000043 | FAS | Fas (TNF receptor superfamily, member 6) | ALPS1A, APO-1, APT1, CD95, FAS1, FASTM, TNFRSF6 |
| Hs.2007 | NM_000639 | FASLG | Fas ligand (TNF superfamily, member 6) | APT1LG1, CD178, CD95-L, CD95L, FASL, TNFSF6 |
| Hs.110571 | NM_015675 | GADD45B | Growth arrest and DNA-damage-inducible, beta | DKFZp566B133, GADD45BETA, MYD118 |
| Hs.643447 | NM_000201 | ICAM1 | Intercellular adhesion molecule 1 | BB2, CD54, P3.58 |
| Hs.93177 | NM_002176 | IFNB1 | Interferon, beta 1, fibroblast | IFB, IFF, IFNB, MGC96956 |
| Hs.856 | NM_000619 | IFNG | Interferon, gamma | IFG, IFI |
| Hs.674 | NM_002187 | IL12B | Interleukin 12B (natural killer cell stimulatory factor 2, cytotoxic lymphocyte maturation factor 2, p40) | CLMF, CLMF2, IL-12B, NKSF, NKSF2 |
| Hs.654378 | NM_000585 | IL15 | Interleukin 15 | IL-15, MGC9721 |
| Hs.1722 | NM_000575 | IL1A | Interleukin 1, alpha | IL-1A, IL1, IL1-ALPHA, IL1F1 |
| Hs.126256 | NM_000576 | IL1B | Interleukin 1, beta | IL-1, IL1-BETA, IL1F2 |
| Hs.25333 | NM_004633 | IL1R2 | Interleukin 1 receptor, type II | CD121b, IL1RB, MGC47725 |
| Hs.81134 | NM_000577 | IL1RN | Interleukin 1 receptor antagonist | DIRA, ICIL-1RA, IL-1RN, IL-1ra, IL-1ra3, IL1F3, IL1RA, IRAP, MGC10430, MVCD4 |
| Hs.89679 | NM_000586 | IL2 | Interleukin 2 | IL-2, TCGF, lymphokine |
| Hs.231367 | NM_000417 | IL2RA | Interleukin 2 receptor, alpha | CD25, IDDM10, IL2R, TCGFR |
| Hs.73917 | NM_000589 | IL4 | Interleukin 4 | BCGF-1, BCGF1, BSF-1, BSF1, IL-4, MGC79402 |
| Hs.654458 | NM_000600 | IL6 | Interleukin 6 (interferon, beta 2) | BSF2, HGF, HSF, IFNB2, IL-6 |
| Hs.624 | NM_000584 | IL8 | Interleukin 8 | CXCL8, GCP-1, GCP1, LECT, LUCT, LYNAP, MDNCF, MONAP, NAF, NAP-1, NAP1 |
| Hs.654579 | NM_000207 | INS | Insulin | IDDM2, ILPR, IRDN, MODY10 |
| Hs.436061 | NM_002198 | IRF1 | Interferon regulatory factor 1 | IRF-1, MAR |
| Hs.36 | NM_000595 | LTA | Lymphotoxin alpha (TNF superfamily, member 1) | LT, TNFB, TNFSF1 |
| Hs.376208 | NM_002341 | LTB | Lymphotoxin beta (TNF superfamily, member 3) | TNFC, TNFSF3, p33 |
| Hs.463978 | NM_002758 | MAP2K6 | Mitogen-activated protein kinase kinase 6 | MAPKK6, MEK6, MKK6, PRKMK6, SAPKK3 |
| Hs.297413 | NM_004994 | MMP9 | Matrix metallopeptidase 9 (gelatinase B, 92kDa gelatinase, 92kDa type IV collagenase) | CLG4B, GELB, MANDP2, MMP-9 |
| Hs.202453 | NM_002467 | MYC | V-myc myelocytomatosis viral oncogene homolog (avian) | MRTL, bHLHe39, c-Myc |
| Hs.82116 | NM_002468 | MYD88 | Myeloid differentiation primary response gene (88) | MYD88D |
| Hs.592142 | NM_181659 | NCOA3 | Nuclear receptor coactivator 3 | ACTR, AIB-1, AIB1, CAGH16, CTG26, KAT13B, MGC141848, RAC3, SRC-3, SRC3, TNRC14, TNRC16, TRAM-1, bHLHe42, pCIP |
| Hs.654408 | NM_003998 | NFKB1 | Nuclear factor of kappa light polypeptide gene enhancer in B-cells 1 | DKFZp686C01211, EBP-1, KBF1, MGC54151, NF-kappa-B, NF-kappaB, NFKB-p105, NFKB-p50, NFkappaB, p105, p50 |
| Hs.73090 | NM_002502 | NFKB2 | Nuclear factor of kappa light polypeptide gene enhancer in B-cells 2 (p49/p100) | LYT-10, LYT10, p52 |
| Hs.81328 | NM_020529 | NFKBIA | Nuclear factor of kappa light polypeptide gene enhancer in B-cells inhibitor, alpha | IKBA, MAD-3, NFKBI |
| Hs.406515 | NM_000903 | NQO1 | NAD(P)H dehydrogenase, quinone 1 | DHQU, DIA4, DTD, NMOR1, NMORI, QR1 |
| Hs.563344 | NM_006186 | NR4A2 | Nuclear receptor subfamily 4, group A, member 2 | HZF-3, NOT, NURR1, RNR1, TINUR |
| Hs.1976 | NM_002608 | PDGFB | Platelet-derived growth factor beta polypeptide | FLJ12858, PDGF2, SIS, SSV, c-sis |
| Hs.77274 | NM_002658 | PLAU | Plasminogen activator, urokinase | ATF, UPA, URK, u-PA |
| Hs.196384 | NM_000963 | PTGS2 | Prostaglandin-endoperoxide synthase 2 (prostaglandin G/H synthase and cyclooxygenase) | COX-2, COX2, GRIPGHS, PGG, HS, PGHS-2, PHS-2, hCox-2 |
| Hs.631886 | NM_002908 | REL | V-rel reticuloendotheliosis viral oncogene homolog (avian) | C-Rel |
| Hs.502875 | NM_021975 | RELA | V-rel reticuloendotheliosis viral oncogene homolog A (avian) | MGC131774, NFKB3, p65 |
| Hs.654402 | NM_006509 | RELB | V-rel reticuloendotheliosis viral oncogene homolog B | I-REL, IREL, REL-B |
| Hs.89546 | NM_000450 | SELE | Selectin E | CD62E, ELAM, ELAM1, ESEL, LECAM2 |
| Hs.73800 | NM_003005 | SELP | Selectin P (granule membrane protein 140kDa, antigen CD62) | CD62, CD62P, FLJ45155, GMP140, GRMP, LECAM3, PADGEM, PSEL |
| Hs.167317 | NM_003081 | SNAP25 | Synaptosomal-associated protein, 25kDa | FLJ23079, RIC-4, RIC4, SEC9, SNAP, SNAP-25, bA416N4.2, dJ1068F16.2 |
| Hs.487046 | NM_000636 | SOD2 | Superoxide dismutase 2, mitochondrial | IPOB, MNSOD, MVCD6 |
| Hs.642990 | NM_007315 | STAT1 | Signal transducer and activator of transcription 1, 91kDa | DKFZp686B04100, ISGF-3, STAT91 |
| Hs.463059 | NM_003150 | STAT3 | Signal transducer and activator of transcription 3 (acute-phase response factor) | APRF, FLJ20882, HIES, MGC16063 |
| Hs.595276 | NM_012448 | STAT5B | Signal transducer and activator of transcription 5B | STAT5 |
| Hs.241570 | NM_000594 | TNF | Tumor necrosis factor | DIF, TNF-alpha, TNFA, TNFSF2 |
| Hs.256278 | NM_001066 | TNFRSF1B | Tumor necrosis factor receptor superfamily, member 1B | CD120b, TBPII, TNF-R-II, TNF-R75, TNFBR, TNFR1B, TNFR2, TNFR80, p75, p75TNFR |
| Hs.478275 | NM_003810 | TNFSF10 | Tumor necrosis factor (ligand) superfamily, member 10 | APO2L, Apo-2L, CD253, TL2, TRAIL |
| Hs.654481 | NM_000546 | TP53 | Tumor protein p53 | FLJ92943, LFS1, P53, TRP53 |
| Hs.522506 | NM_021138 | TRAF2 | TNF receptor-associated factor 2 | MGC:45012, TRAP, TRAP3 |
| Hs.109225 | NM_001078 | VCAM1 | Vascular cell adhesion molecule 1 | CD106, DKFZp779G2333, INCAM-100, MGC99561 |
| Hs.356076 | NM_001167 | XIAP | X-linked inhibitor of apoptosis | API3, BIRC4, FLJ26913, IAP-3, ILP1, MIHA, XLP2, hIAP-3, hIAP3 |
| Hs.520640 | NM_001101 | ACTB | Actin, beta | PS1TP5BP1 |
| Hs.534255 | NM_004048 | B2M | Beta-2-microglobulin | - |
| Hs.592355 | NM_002046 | GAPDH | Glyceraldehyde-3-phosphate dehydrogenase | G3PD, GAPD, MGC88685 |
| Hs.412707 | NM_000194 | HPRT1 | Hypoxanthine phosphoribosyltransferase 1 | HGPRT, HPRT |
| Hs.546285 | NM_001002 | RPLP0 | Ribosomal protein, large, P0 | L10E, LP0, MGC111226, MGC88175, P0, PRLP0, RPP0 |
| N/A | SA_00105 | HGDC | Human Genomic DNA Contamination | HIGX1A |
| UniGene | GeneBank | Symbol | Description | Gene Names |
|---|---|---|---|---|
| Hs.131431 | NM_002759 | EIF2AK2 | Eukaryotic translation initiation factor 2-alpha kinase 2 | EIF2AK1/PKR |
| Hs.141125 | NM_004346 | CASP3 | Caspase 3, apoptosis-related cysteine peptidase | CPP32/CPP32B |
| Hs.146806 | NM_003592 | CUL1 | Cullin 1 | MGC149834 |
| Hs.147433 | NM_182649 | PCNA | Proliferating cell nuclear antigen | MGC8367 |
| Hs.160953 | NM_022112 | P53AIP1 | P53-regulated apoptosis-inducing protein 1 | P53AIP1 |
| Hs.1770 | NM_000234 | LIG1 | Ligase I, DNA, ATP-dependent | MGC117397 |
| Hs.191334 | NM_003362 | UNG | Uracil-DNA glycosylase | DGU/DKFZp781L1143 |
| Hs.191356 | NM_001515 | GTF2H2 | General transcription factor IIH, polypeptide 2, 44 kDa | BTF2/BTF2P44 |
| Hs.193717 | NM_000572 | IL10 | Interleukin 10 | CSIF/IL-10 |
| Hs.194143 | NM_007294 | BRCA1 | Breast cancer 1, early onset | BRCAI/BRCC1 |
| Hs.2420 | NM_003102 | SOD3 | Superoxide dismutase 3, extracellular | EC-SOD |
| Hs.244723 | NM_001238 | CCNE1 | Cyclin E1 | CCNE |
| Hs.24529 | NM_001274 | CHEK1 | CHK1 checkpoint homolog (S. pombe) | CHK1 |
| Hs.271791 | NM_001184 | ATR | Ataxia telangiectasia and Rad3 related | FRP1/MEC1 |
| Hs.290758 | NM_001923 | DDB1 | Damage-specific DNA binding protein 1, 127 kDa | DDBA/UV-DDB1 |
| Hs.291363 | NM_007194 | CHEK2 | CHK2 checkpoint homolog (S. pombe) | CDS1/CHK2 |
| Hs.31210 | NM_005178 | BCL3 | B-cell CLL/lymphoma 3 | BCL4/D19S37 |
| Hs.321045 | NM_014002 | IKBKE | Inhibitor of kappa light polypeptide gene enhancer in B-cells, kinase epsilon | IKK-i/IKKE |
| Hs.326035 | NM_001964 | EGR1 | Early growth response 1 | AT225/G0S30 |
| Hs.329502 | NM_001229 | CASP9 | Caspase 9, apoptosis-related cysteine peptidase | APAF-3/APAF3 |
| Hs.334562 | NM_001786 | CDC2 | Cell division cycle 2, G1 to S and G2 to M | CDC28A/CDK1 |
| Hs.34012 | NM_000059 | BRCA2 | Breast cancer 2, early onset | BRCC2/FACD |
| Hs.367437 | NM_000051 | ATM | Ataxia telangiectasia mutated | AT1/ATA |
| Hs.380271 | NM_002542 | OGG1 | 8-oxoguanine DNA glycosylase | HMMH/HOGG1 |
| Hs.388739 | NM_021141 | XRCC5 | X-ray repair complementing defective repair in Chinese hamster cells 5 (double-strand-break rejoining; Ku autoantigen, 80 kDa) | KARP-1/KARP1 |
| Hs.408528 | NM_000321 | RB1 | Retinoblastoma 1 (including osteosarcoma) | OSRC/RB |
| Hs.431850 | NM_002745 | MAPK1 | Mitogen-activated protein kinase 1 | ERK/ERK2 |
| Hs.43505 | NM_003639 | IKBKG | Inhibitor of kappa light polypeptide gene enhancer in B-cells, kinase gamma | AMCBX1/FIP-3 |
| Hs.437705 | NM_001789 | CDC25A | Cell division cycle 25 homolog A (S. pombe) | CDC25A2 |
| Hs.443914 | NM_000454 | SOD1 | Superoxide dismutase 1, soluble (amyotrophic lateral sclerosis 1 (adult)) | ALS/ALS1 |
| Hs.445203 | NM_001539 | DNAJA1 | DnaJ (Hsp40) homolog, subfamily A, member 1 | DJ-2/DjA1 |
| Hs.460996 | NM_003789 | TRADD | TNFRSF1A-associated via death domain | Hs.89862 |
| Hs.469872 | NM_000122 | ERCC3 | Excision repair cross-complementing rodent repair deficiency, complementation group 3 (xeroderma pigmentosum group B complementing) | BTF2/GTF2H |
| Hs.492208 | NM_002485 | NBN | Nibrin | AT-V1/AT-V2 |
| Hs.498248 | NM_130398 | EXO1 | Exonuclease 1 | HEX1/hExoI |
| Hs.502302 | NM_001752 | CAT | Catalase | MGC138422 |
| Hs.505033 | NM_004985 | KRAS | V-Ki-ras2 Kirsten rat sarcoma viral oncogene homolog | C-K-RAS/K-RAS2A |
| Hs.505777 | NM_004083 | DDIT3 | DNA-damage-inducible transcript 3 | CEBPZ/CHOP |
| Hs.512599 | NM_000077 | CDKN2A | Cyclin-dependent kinase inhibitor 2A (melanoma, p16, inhibits CDK4) | ARF/CDK4I |
| Hs.514527 | NM_001168 | BIRC5 | Baculoviral IAP repeat-containing 5 (survivin) | API4/EPR-1 |
| Hs.520028 | NM_005345 | HSPA1A | Heat shock 70 kDa protein 1A | HSP70-1/HSP72 |
| Hs.523185 | NM_012423 | RPL13A | Ribosomal protein L13a | RPL13A |
| Hs.523560 | NM_001040141 | HSP90AA2 | Heat shock protein 90 kDa alpha (cytosolic), class A member 2 | HSP90ALPHA/HSPCA |
| Hs.523968 | NM_005426 | TP53BP2 | Tumor protein p53 binding protein, 2 | 53BP2/ASPP2 |
| Hs.525704 | NM_002228 | JUN | Jun oncogene | AP1/c-Jun |
| Hs.530227 | NM_005526 | HSF1 | Heat shock transcription factor 1 | HSTF1 |
| Hs.531704 | NM_002737 | PRKCA | Protein kinase C, alpha | AAG6/PKC-alpha |
| Hs.544577 | NM_002046 | GAPDH | Glyceraldehyde-3-phosphate dehydrogenase | G3PD/GAPD |
| Hs.553498 | NM_006218 | PIK3CA | Phosphoinositide-3-kinase, catalytic, alpha polypeptide | PI3K/p110-alpha |
| Hs.567303 | NM_002392 | MDM2 | Mdm2, transformed 3T3 cell double minute 2, p53 binding protein (mouse) | HDMX/hdm2 |
| Hs.567387 | NM_057749 | CCNE2 | Cyclin E2 | CYCE2 |
| Hs.591084 | NM_004629 | FANCG | Fanconi anemia, complementation group G | FAG/XRCC9 |
| Hs.591980 | NM_000378 | WT1 | Wilms tumor 1 | GUD/WAGR |
| Hs.592325 | NM_005432 | XRCC3 | X-ray repair complementing defective repair in Chinese hamster cells 3 | XRCC3 |
| Hs.592839 | NM_005633 | SOS1 | Son of sevenless homolog 1 (Drosophila) | GF1/GGF1 |
| Hs.61188 | NM_033276 | XRCC6BP1 | XRCC6 binding protein 1 | KUB3 |
| Hs.631709 | NM_002875 | RAD51 | RAD51 homolog (RecA homolog, E. coli) (S. cerevisiae) | BRCC5/HRAD51 |
| Hs.647093 | NM_005431 | XRCC2 | X-ray repair complementing defective repair in Chinese hamster cells 2 | DKFZp781P0919 |
| Hs.647371 | NM_005953 | MT2A | Metallothionein 2A | MT2 |
| Hs.654393 | NM_005225 | E2F1 | E2F transcription factor 1 | E2F-1/RBBP3 |
| Hs.654532 | NM_003263 | TLR1 | Toll-like receptor 1 | CD281/DKFZp547I0610 |
| Hs.655354 | NM_004584 | RAD9A | RAD9 homolog A (S. pombe) | RAD9 |
| Hs.655983 | NM_001228 | CASP8 | Caspase 8, apoptosis-related cysteine peptidase | ALPS2B/CAP4 |
| Hs.656458 | NM_001556 | IKBKB | Inhibitor of kappa light polypeptide gene enhancer in B-cells, kinase beta | IKK-beta/IKK2 |
| Hs.695926 | NM_002890 | RASA1 | RAS p21 protein activator (GTPase activating protein) 1 | CM-AVM/CMAVM |
| Hs.697294 | NM_005427 | TP73 | Tumor protein p73 | P73 |
| Hs.706746 | NM_000625 | NOS2A | Nitric oxide synthase 2A (inducible, hepatocytes) | HEP-NOS/INOS |
| Hs.708288 | NM_000165 | GJA1 | Gap junction protein, alpha 1, 43 kDa | CX43/DFNB38 |
| Hs.73133 | NM_005954 | MT3 | Metallothionein 3 | GIF/GIFB |
| Hs.76686 | NM_000581 | GPX1 | Glutathione peroxidase 1 | GSHPX1 |
| Hs.80409 | NM_001924 | GADD45A | Growth arrest and DNA-damage-inducible, alpha | DDIT1/GADD45 |
| Hs.87247 | NM_003806 | HRK | Harakiri, BCL2 interacting protein (contains only BH3 domain) | DP5/HARAKIRI |
| Hs.9701 | NM_006705 | GADD45G | Growth arrest and DNA-damage-inducible, gamma | CR6/DDIT2 |
| Hs.98493 | NM_006297 | XRCC1 | X-ray repair complementing defective repair in Chinese hamster cells 1 | RCC |
| Symbol | µ | SE | Symbol | µ | SE | Symbol | µ | SE |
|---|---|---|---|---|---|---|---|---|
| ACTB | 1.02 | 0.06 | CFB | −1.12 | 0.13 | HSP90AA2 | 1.74 | 0.19 |
| ADM | 1.42 | 0.23 | CHEK1 | 1.01 | 0.16 | HSPA1A | 1.86 | 0.33 |
| AGT | −1.02 | 0.13 | CHEK2 | −1.11 | 0.06 | ICAM1 | 1.13 | 0.16 |
| AKT1 | −1.11 | 0.10 | CSF1 | −1.24 | 0.06 | IFNB1 | −1.00 | 0.05 |
| ALDH3A2 | −1.15 | 0.03 | CSF2 | 1.06 | 0.18 | IFNG | −1.00 | 0.05 |
| ATM | −1.79 | 0.02 | CSF2RB | −1.00 | 0.05 | IKBKB | −1.37 | 0.06 |
| ATR | 1.40 | 0.08 | CSF3 | 1.35 | 0.20 | IKBKE | −2.40 | 0.02 |
| B2M | −1.03 | 0.07 | CUL1 | 1.04 | 0.12 | IKBKG | 1.10 | 0.27 |
| BCL2A1 | 1.06 | 0.11 | CXCL1 | −1.59 | 0.12 | IL10 | 1.67 | 0.43 |
| BCL2L1 | 1.08 | 0.13 | CXCL10 | −1.32 | 0.15 | IL12B | −1.15 | 0.06 |
| BCL3 | −1.15 | 0.21 | CXCL2 | 1.11 | 0.24 | IL15 | −1.36 | 0.11 |
| BIRC2 | −1.03 | 0.09 | CXCL9 | 1.57 | 0.38 | IL1A | 1.12 | 0.17 |
| BIRC3 | 1.23 | 0.30 | DDB1 | 1.21 | 0.28 | IL1B | 1.09 | 0.08 |
| BIRC5 | 1.06 | 0.10 | DDIT3 | 1.62 | 0.51 | IL1R2 | −1.05 | 0.24 |
| BRCA2 | 1.08 | 0.12 | DNAJA1 | −1.23 | 0.09 | IL1RN | −1.00 | 0.05 |
| BRCA5 | −1.04 | 0.28 | E2F1 | 1.27 | 0.40 | IL2 | −1.00 | 0.05 |
| C3 | 1.88 | 0.69 | EGFR | −1.04 | 0.11 | IL2RA | −1.00 | 0.05 |
| CASP3 | 1.27 | 0.09 | EGR1 | 2.15 | 0.30 | IL4 | 1.97 | 0.33 |
| CASP8 | −1.22 | 0.30 | EGR2 | 1.30 | 0.30 | IL6 | 1.27 | 0.28 |
| CASP9 | −1.07 | 0.06 | EIF2AK2 | −1.24 | 0.04 | IL8 | −2.31 | 0.13 |
| CAT | 1.03 | 0.22 | ERCC3 | −1.18 | 0.09 | INS | −1.00 | 0.05 |
| CCL11 | 1.22 | 0.32 | EXO1 | −1.19 | 0.21 | IRF1 | −1.11 | 0.08 |
| CCL2 | 1.36 | 0.11 | F3 | 1.20 | 0.15 | JUN | 4.96 | 1.85 |
| CCL22 | −1.00 | 0.05 | F8 | 1.16 | 0.06 | KRAS | −1.08 | 0.02 |
| CCL5 | 15.57 | 8.77 | FANCG | −1.48 | 0.04 | LIG1 | −1.18 | 0.23 |
| CCND1 | −2.99 | 0.05 | FAS | −1.30 | 0.13 | LTA | 1.54 | 0.33 |
| CCNE1 | 1.03 | 0.08 | FASLG | 2.50 | 0.54 | LTB | 1.09 | 0.25 |
| CCNE2 | 1.18 | 0.23 | GADD45A | −1.27 | 0.06 | MAP2K6 | −1.23 | 0.13 |
| CCR5 | 1.53 | 0.28 | GADD45B | 3.63 | 1.08 | MAPK1 | −1.10 | 0.12 |
| CD40 | −1.02 | 0.15 | GADD45G | −1.17 | 0.19 | MDM2 | −1.24 | 0.11 |
| CD69 | −1.00 | 0.05 | GAPDH | 1.13 | 0.07 | MMP9 | −1.03 | 0.23 |
| CD80 | 1.18 | 0.26 | GJA1 | −1.22 | 0.16 | MT2A | 1.01 | 0.07 |
| CD83 | −1.50 | 0.09 | GPX1 | 1.52 | 0.17 | MT3 | 1.88 | 0.80 |
| CDC2 | 1.12 | 0.21 | GTF2H2 | −1.24 | 0.06 | MYC | 1.14 | 0.20 |
| CDC25A | 1.22 | 0.10 | HPRT1 | 1.21 | 0.08 | MYD88 | −1.33 | 0.17 |
| CDKN1A | 1.37 | 0.31 | HRK | 1.12 | 0.48 | NBN | −2.37 | 0.09 |
| CDKN2A | 1.11 | 0.06 | HSF1 | 1.06 | 0.21 | NCOA3 | 1.33 | 0.06 |
| NFKB1 | 1.00 | 0.06 | RB1 | 1.00 | 0.04 | TNF | −1.69 | 0.12 |
| NFKB2 | 1.19 | 0.16 | REL | −1.27 | 0.04 | TNFRSF1B | 1.02 | 0.25 |
| NFKBIA | −1.64 | 0.08 | RELA | −4.93 | 0.02 | TNFSF10 | −1.01 | 0.23 |
| NOS2 | 1.40 | 0.32 | RELB | 1.14 | 0.22 | TP53 | −1.17 | 0.04 |
| NQO1 | 1.28 | 0.19 | RPL13A | −1.12 | 0.13 | TP53BP2 | −1.13 | 0.10 |
| NR4A2 | 2.40 | 0.23 | RPLP0 | −1.19 | 0.06 | TP73 | 1.02 | 0.09 |
| OGG1 | 1.02 | 0.18 | SELE | 1.64 | 0.38 | TRADD | −1.46 | 0.04 |
| P53AIP1 | 1.45 | 0.30 | SELP | −1.00 | 0.05 | TRAF2 | −1.12 | 0.03 |
| PCNA | 1.28 | 0.16 | SNAP25 | 1.79 | 0.38 | UNG | 1.66 | 0.18 |
| PDGFB | −1.00 | 0.05 | SOD1 | 1.21 | 0.15 | VCAM1 | −1.00 | 0.05 |
| PIK3Ca | 1.13 | 0.07 | SOD2 | −1.09 | 0.06 | WT1 | 1.25 | 0.19 |
| PLAU | −1.52 | 0.14 | SOD3 | 2.03 | 0.75 | XIAP | −1.10 | 0.12 |
| PRKCA | −1.03 | 0.12 | SOS1 | −1.11 | 0.13 | XRCC1 | 1.01 | 0.09 |
| PTGS2 | 1.96 | 0.38 | STAT1 | 1.25 | 0.05 | XRCC2 | −1.52 | 0.07 |
| RAD51 | 1.02 | 0.05 | STAT3 | −1.10 | 0.04 | XRCC3 | 1.04 | 0.31 |
| RAD9A | 1.04 | 0.04 | STAT5B | −1.08 | 0.09 | XRCC5 | 1.10 | 0.11 |
| RASA1 | −1.24 | 0.05 | TLR1 | 1.15 | 0.03 | XRCC6BP1 | −1.20 | 0.10 |
| HEK wt | RelA k.d. | |||
|---|---|---|---|---|
| Symbol | µ | SE | µ | SE |
| ACTB | −1.19 | 0.05 | −1.26 | 0.07 |
| ADM | −1.88 | 0.08 | 1.39 | 0.27 |
| AGT | 1.57 | 0.42 | −1.06 | 0.11 |
| AKT1 | −1.36 | 0.08 | 1.04 | 0.16 |
| ALDH3A2 | −1.19 | 0.02 | −1.23 | 0.03 |
| ATM | −1.01 | 0.03 | 1.19 | 0.06 |
| ATR | −1.50 | 0.05 | 1.35 | 0.03 |
| B2M | 1.58 | 0.14 | 1.27 | 0.07 |
| BCL2A1 | 2.22 | 0.32 | 1.47 | 0.20 |
| BCL2L1 | 1.65 | 0.19 | 1.17 | 0.08 |
| BCL3 | 2.38 | 0.44 | 1.67 | 0.47 |
| BIRC2 | 1.54 | 0.13 | 1.27 | 0.12 |
| BIRC3 | 4.76 | 0.98 | 2.03 | 0.47 |
| BIRC5 | −1.36 | 0.10 | −1.09 | 0.01 |
| BRCA2 | 1.21 | 0.07 | 1.48 | 0.22 |
| BRCA5 | 2.04 | 0.67 | 1.47 | 0.33 |
| C3 | 5.97 | 1.39 | 1.97 | 0.57 |
| CASP3 | −1.04 | 0.10 | 1.44 | 0.02 |
| CASP8 | 1.97 | 0.74 | 1.80 | 0.56 |
| CASP9 | 1.08 | 0.07 | −1.02 | 0.05 |
| CAT | −1.44 | 0.18 | −1.18 | 0.11 |
| CCL11 | 3.73 | 1.51 | 1.84 | 0.57 |
| CCL2 | 3.04 | 0.24 | −1.28 | 0.09 |
| CCL22 | 1.39 | 0.24 | −1.15 | 0.04 |
| CCL5 | 4.79 | 1.79 | 29.02 | 12.66 |
| CCND1 | −2.35 | 0.11 | −1.55 | 0.09 |
| CCNE1 | −1.13 | 0.09 | −1.10 | 0.04 |
| CCNE2 | 1.40 | 0.33 | 1.56 | 0.22 |
| CCR5 | 1.61 | 0.49 | −2.87 | 0.06 |
| CD40 | 2.83 | 0.53 | 1.51 | 0.30 |
| CD69 | 3.37 | 0.23 | −1.15 | 0.04 |
| CD80 | 2.06 | 0.50 | 2.32 | 0.77 |
| CD83 | 5.68 | 0.82 | 1.67 | 0.08 |
| CDC2 | 1.16 | 0.16 | 1.38 | 0.31 |
| CDC25A | 1.25 | 0.02 | −1.04 | 0.11 |
| CDKN1A | 2.85 | 0.50 | 2.59 | 0.59 |
| CDKN2A | −1.35 | 0.04 | −1.14 | 0.04 |
| CFB | 2.21 | 0.36 | 1.36 | 0.17 |
| CHEK1 | 1.35 | 0.25 | 1.15 | 0.15 |
| CHEK2 | 1.18 | 0.06 | 1.14 | 0.09 |
| CSF1 | 2.55 | 0.25 | −1.14 | 0.02 |
| CSF2 | 1.16 | 0.37 | −1.32 | 0.10 |
| CSF2RB | −1.07 | 0.05 | −1.15 | 0.04 |
| CSF3 | 1.07 | 0.30 | 1.13 | 0.21 |
| CUL1 | 1.08 | 0.15 | −1.09 | 0.06 |
| CXCL1 | 47.46 | 11.75 | −1.05 | 0.08 |
| CXCL10 | 23.38 | 5.72 | −1.18 | 0.06 |
| CXCL2 | 18.29 | 3.92 | 1.72 | 0.33 |
| CXCL9 | 2.08 | 0.62 | 1.72 | 0.45 |
| DDB1 | −1.10 | 0.27 | −1.33 | 0.10 |
| DDIT3 | 1.88 | 0.63 | 1.91 | 0.50 |
| DNAJA1 | 1.48 | 0.24 | 1.07 | 0.02 |
| E2F1 | −1.31 | 0.28 | −1.28 | 0.18 |
| EGFR | 1.80 | 0.20 | 1.33 | 0.14 |
| EGR1 | −1.06 | 0.18 | 1.23 | 0.03 |
| EGR2 | 1.98 | 0.57 | 1.81 | 0.47 |
| EIF2AK2 | 1.06 | 0.06 | 1.09 | 0.04 |
| ERCC3 | 1.26 | 0.01 | 1.12 | 0.17 |
| EXO1 | 1.97 | 0.67 | −4.29 | 0.02 |
| F3 | 2.66 | 0.30 | 1.66 | 0.22 |
| F8 | −1.23 | 0.10 | 1.26 | 0.02 |
| FANCG | 1.26 | 0.08 | 1.18 | 0.05 |
| FAS | −1.39 | 0.13 | −1.13 | 0.16 |
| FASLG | 1.28 | 0.47 | −1.01 | 0.18 |
| GADD45A | 1.38 | 0.15 | 1.86 | 0.00 |
| GADD45B | 2.01 | 0.56 | 2.60 | 0.91 |
| GADD45G | −1.01 | 0.24 | 1.12 | 0.20 |
| GAPDH | −1.29 | 0.06 | −1.32 | 0.04 |
| GJA1 | −1.03 | 0.12 | −1.46 | 0.17 |
| GPX1 | −1.17 | 0.13 | −1.34 | 0.03 |
| GTF2H2 | 1.42 | 0.02 | 1.24 | 0.13 |
| HPRT1 | −1.13 | 0.07 | 1.40 | 0.17 |
| HRK | 2.12 | 0.76 | 2.45 | 1.08 |
| HSF1 | 1.60 | 0.44 | −1.00 | 0.07 |
| HSP90AA2 | 1.17 | 0.16 | 1.05 | 0.07 |
| HSPA1A | −1.51 | 0.15 | −1.04 | 0.08 |
| ICAM1 | 2.12 | 0.36 | −2.56 | 0.05 |
| IFNB1 | −1.01 | 0.05 | −1.15 | 0.04 |
| IFNG | −1.36 | 0.17 | −1.15 | 0.04 |
| IKBKB | 1.20 | 0.14 | 1.05 | 0.00 |
| IKBKE | 1.22 | 0.08 | −1.83 | 0.03 |
| IKBKG | 1.01 | 0.33 | −1.75 | 0.06 |
| IL10 | 1.41 | 0.26 | −1.80 | 0.17 |
| IL12B | 1.82 | 0.32 | 1.42 | 0.07 |
| IL15 | 2.83 | 0.63 | 1.59 | 0.07 |
| IL1A | 1.59 | 0.19 | 1.38 | 0.23 |
| IL1B | −1.10 | 0.07 | 1.27 | 0.12 |
| IL1R2 | 4.02 | 1.29 | 1.71 | 0.30 |
| IL1RN | 1.39 | 0.24 | −1.15 | 0.04 |
| IL2 | −1.27 | 0.13 | −1.15 | 0.04 |
| IL2RA | 1.35 | 0.21 | −1.15 | 0.04 |
| IL4 | 1.62 | 0.43 | −1.12 | 0.14 |
| IL6 | 1.01 | 0.23 | 1.05 | 0.18 |
| IL6 | 1.86 | 0.58 | 2.39 | 0.50 |
| IL8 | 17.83 | 5.19 | −1.15 | 0.04 |
| INS | −1.27 | 0.12 | 1.29 | 0.11 |
| IRF1 | 3.16 | 0.40 | −1.18 | 0.12 |
| JUN | 1.39 | 0.69 | 1.15 | 0.01 |
| KRAS | 1.11 | 0.02 | −1.42 | 0.10 |
| LIG1 | −1.24 | 0.29 | 1.58 | 0.38 |
| LTA | 1.52 | 0.51 | 2.06 | 0.67 |
| LTB | 1.92 | 0.58 | −1.80 | 0.13 |
| MAP2K6 | −1.57 | 0.12 | −1.08 | 0.11 |
| MAPK1 | −1.13 | 0.13 | 1.02 | 0.13 |
| MDM2 | −1.01 | 0.13 | 2.01 | 0.37 |
| MMP9 | 3.34 | 0.61 | −1.53 | 0.06 |
| MT2A | −1.13 | 0.02 | −1.04 | 0.45 |
| MT3 | 1.86 | 0.58 | −1.10 | 0.16 |
| MYC | −1.84 | 0.08 | 2.09 | 0.70 |
| MYD88 | 1.49 | 0.35 | 1.01 | 0.29 |
| NBN | −1.18 | 0.06 | 1.12 | 0.08 |
| NCOA3 | −1.02 | 0.06 | 1.22 | 0.04 |
| NFKB1 | 2.88 | 0.28 | 1.47 | 0.13 |
| NFKB2 | 2.90 | 0.61 | 1.79 | 0.40 |
| NFKBIA | 11.88 | 1.66 | 2.52 | 0.30 |
| NOS2 | 1.91 | 0.52 | 1.32 | 0.20 |
| NQO1 | −1.76 | 0.10 | −1.10 | 0.05 |
| NR4A2 | 1.17 | 0.18 | 1.22 | 0.21 |
| OGG1 | −1.19 | 0.10 | −1.19 | 0.19 |
| P53AIP1 | 1.64 | 0.09 | 1.42 | 0.41 |
| PCNA | 1.36 | 0.14 | 1.25 | 0.18 |
| PDGFB | 1.17 | 0.12 | −1.15 | 0.04 |
| PIK3Ca | 1.20 | 0.08 | 1.19 | 0.06 |
| PLAU | 3.35 | 0.57 | 2.64 | 0.58 |
| PRKCA | −1.00 | 0.17 | −1.21 | 0.05 |
| PTGS2 | 3.99 | 0.53 | 2.17 | 0.39 |
| RAD51 | −1.00 | 0.02 | 1.00 | 0.07 |
| RAD9A | 1.10 | 0.02 | −1.31 | 0.04 |
| RASA1 | 1.11 | 0.07 | 1.27 | 0.07 |
| RB1 | 1.07 | 0.03 | 1.08 | 0.05 |
| REL | 2.40 | 0.25 | 1.33 | 0.07 |
| RELA | 1.69 | 0.17 | −1.11 | 0.06 |
| RELB | 1.82 | 0.55 | 1.21 | 0.23 |
| RPL13A | −1.29 | 0.09 | −1.12 | 0.15 |
| RPLP0 | 1.46 | 0.12 | 1.10 | 0.05 |
| SELE | 1.86 | 0.71 | 1.06 | 0.19 |
| SELP | 1.17 | 0.11 | −1.15 | 0.04 |
| SNAP25 | 1.48 | 0.31 | 2.06 | 0.64 |
| SOD1 | −1.28 | 0.13 | −1.16 | 0.05 |
| SOD2 | −1.17 | 0.09 | −1.10 | 0.06 |
| SOD3 | 1.86 | 0.58 | −1.42 | 0.27 |
| SOS1 | 1.25 | 0.19 | 1.08 | 0.14 |
| STAT1 | 1.07 | 0.11 | 1.01 | 0.04 |
| STAT3 | −1.15 | 0.09 | 1.02 | 0.06 |
| STAT5B | 1.35 | 0.18 | 1.28 | 0.17 |
| TLR1 | −1.40 | 0.01 | −2.09 | 0.02 |
| TNF | 60.95 | 12.42 | 3.40 | 0.54 |
| TNFRSF1B | 1.49 | 0.34 | 4.13 | 2.29 |
| TNFSF10 | 1.73 | 0.37 | 2.07 | 0.78 |
| TP53 | 1.17 | 0.05 | 1.16 | 0.06 |
| TP53BP2 | 1.31 | 0.17 | −1.00 | 0.09 |
| TP73 | 1.11 | 0.12 | −2.03 | 0.04 |
| TRADD | 1.09 | 0.06 | −1.42 | 0.04 |
| TRAF2 | 1.23 | 0.11 | 1.04 | 0.05 |
| UNG | −1.23 | 0.12 | −1.09 | 0.05 |
| VCAM1 | −1.36 | 0.15 | −1.15 | 0.04 |
| WT1 | 1.20 | 0.01 | −1.64 | 0.13 |
| XIAP | 1.50 | 0.21 | 1.37 | 0.17 |
| XRCC1 | 1.04 | 0.13 | −1.17 | 0.02 |
| XRCC2 | 1.17 | 0.14 | 1.42 | 0.11 |
| XRCC3 | −1.28 | 0.27 | −1.65 | 0.13 |
| XRCC5 | −1.17 | 0.12 | 1.05 | 0.01 |
| XRCC6BP1 | −1.08 | 0.02 | −1.09 | 0.15 |
| HEK wt | RelA k.d. | |||||||||||
|---|---|---|---|---|---|---|---|---|---|---|---|---|
| 0.5 Gy | 4 Gy | 8 Gy | 0.5 Gy | 4 Gy | 8 Gy | |||||||
| Symbol | µ | SE | µ | SE | µ | SE | µ | SE | µ | SE | µ | SE |
| ADM | −1.09 | 0.11 | −1.04 | 0.09 | −1.16 | 0.08 | 1.02 | 0.20 | 1.18 | 0.23 | 1.15 | 0.22 |
| AGT | −1.35 | 0.23 | 1.80 | 0.57 | 1.56 | 0.47 | 1.07 | 0.12 | 1.17 | 0.13 | −1.00 | 0.11 |
| AKT1 | 1.08 | 0.06 | 1.05 | 0.05 | 1.12 | 0.05 | 1.22 | 0.19 | 1.31 | 0.20 | 1.29 | 0.20 |
| ALDH3A2 | 1.16 | 0.04 | 1.01 | 0.07 | −1.08 | 0.06 | 1.06 | 0.04 | −1.03 | 0.04 | −1.01 | 0.04 |
| BCL2A1 | 1.15 | 0.19 | 1.31 | 0.15 | −1.15 | 0.12 | −1.02 | 0.13 | 1.45 | 0.19 | 1.04 | 0.14 |
| BCL2L1 | 1.01 | 0.11 | −1.18 | 0.09 | −1.12 | 0.13 | −1.41 | 0.05 | 1.21 | 0.09 | −1.24 | 0.06 |
| BIRC2 | −1.17 | 0.06 | −1.14 | 0.04 | 1.02 | 0.07 | −1.37 | 0.07 | −1.02 | 0.09 | −1.08 | 0.08 |
| BIRC3 | −1.31 | 0.11 | 1.96 | 0.38 | 2.53 | 0.29 | −1.86 | 0.12 | −1.02 | 0.23 | −1.22 | 0.19 |
| C3 | 1.98 | 0.32 | 1.98 | 0.32 | 1.05 | 0.14 | −1.72 | 0.17 | 1.43 | 0.42 | 1.20 | 0.35 |
| CCL11 | 1.40 | 0.57 | 2.66 | 0.78 | 2.63 | 0.77 | 1.88 | 0.58 | 1.90 | 0.59 | 1.23 | 0.38 |
| CCL2 | −1.21 | 0.08 | 1.24 | 0.15 | 2.25 | 0.20 | 1.25 | 0.15 | 1.10 | 0.13 | 1.04 | 0.12 |
| CCL22 | 1.73 | 0.32 | 1.14 | 0.31 | 1.08 | 0.24 | 1.08 | 0.05 | 1.17 | 0.06 | 1.15 | 0.05 |
| CCL5 | −1.42 | 0.24 | 3.68 | 1.53 | 3.34 | 1.40 | 1.55 | 0.68 | 2.07 | 0.90 | −1.47 | 0.30 |
| CCND1 | 1.02 | 0.19 | 1.15 | 0.18 | 1.20 | 0.18 | 1.46 | 0.21 | 2.16 | 0.30 | 2.13 | 0.30 |
| CCR5 | −1.34 | 0.28 | 1.78 | 0.61 | 1.49 | 0.44 | 1.55 | 0.28 | 1.52 | 0.27 | −1.01 | 0.18 |
| CD40 | 1.09 | 0.18 | 1.27 | 0.15 | 1.21 | 0.16 | −1.02 | 0.19 | 1.42 | 0.28 | −1.14 | 0.17 |
| CD69 | 1.28 | 0.10 | 1.14 | 0.11 | −1.01 | 0.08 | 1.08 | 0.05 | 1.17 | 0.06 | 1.15 | 0.05 |
| CD80 | −1.63 | 0.17 | 1.45 | 0.35 | 1.29 | 0.25 | −1.34 | 0.25 | 2.42 | 0.80 | −1.35 | 0.24 |
| CD83 | −1.01 | 0.03 | 2.47 | 0.08 | 3.75 | 0.18 | 1.12 | 0.06 | 1.67 | 0.08 | 2.27 | 0.11 |
| CDKN1A | 1.41 | 0.19 | 1.81 | 0.19 | 1.84 | 0.21 | 1.17 | 0.33 | 1.58 | 0.45 | 2.04 | 0.58 |
| CFB | 1.21 | 0.14 | −1.09 | 0.08 | −1.20 | 0.09 | −1.33 | 0.09 | −1.39 | 0.09 | −1.15 | 0.11 |
| CSF1 | 1.31 | 0.12 | 1.52 | 0.13 | 1.92 | 0.14 | 1.13 | 0.02 | 1.28 | 0.03 | 1.30 | 0.03 |
| CSF2 | −1.49 | 0.27 | −1.02 | 0.32 | 1.30 | 0.46 | 1.44 | 0.19 | 1.41 | 0.19 | −1.06 | 0.13 |
| CSF2RB | 1.07 | 0.08 | −1.00 | 0.08 | −1.13 | 0.06 | 1.08 | 0.05 | 1.17 | 0.06 | 1.15 | 0.05 |
| CSF3 | −1.55 | 0.22 | 1.53 | 0.54 | 1.82 | 0.62 | 1.26 | 0.23 | 1.03 | 0.19 | −1.31 | 0.14 |
| CXCL1 | 1.04 | 0.20 | 3.57 | 0.56 | 6.96 | 1.01 | 1.06 | 0.09 | 1.52 | 0.12 | 2.02 | 0.16 |
| CXCL10 | −1.10 | 0.16 | 4.68 | 0.60 | 14.58 | 2.57 | 1.05 | 0.08 | 2.23 | 0.16 | 2.04 | 0.15 |
| CXCL2 | −1.35 | 0.13 | 2.33 | 0.33 | 3.01 | 0.40 | −1.04 | 0.19 | 1.55 | 0.30 | 1.29 | 0.25 |
| CXCL9 | −2.11 | 0.17 | 1.58 | 0.56 | 1.75 | 0.48 | −1.43 | 0.18 | 1.38 | 0.36 | −1.25 | 0.21 |
| EGFR | 1.25 | 0.12 | 1.43 | 0.11 | 1.57 | 0.13 | −1.10 | 0.10 | 1.04 | 0.11 | −1.07 | 0.10 |
| EGR2 | −1.77 | 0.19 | 1.03 | 0.24 | 1.32 | 0.31 | −1.65 | 0.16 | 1.95 | 0.51 | −1.02 | 0.26 |
| F3 | −1.05 | 0.11 | 1.35 | 0.11 | 1.56 | 0.13 | 1.13 | 0.15 | 1.31 | 0.17 | 1.67 | 0.22 |
| F8 | −1.39 | 0.10 | −1.36 | 0.08 | −1.45 | 0.08 | −1.35 | 0.01 | −1.55 | 0.01 | −1.48 | 0.01 |
| FAS | 1.35 | 0.30 | 1.31 | 0.21 | 1.57 | 0.25 | 1.68 | 0.31 | 1.85 | 0.34 | 1.86 | 0.34 |
| FASLG | −1.78 | 0.25 | 1.81 | 0.77 | 2.39 | 0.97 | 1.28 | 0.23 | 1.40 | 0.25 | −1.61 | 0.11 |
| GADD45B | −1.83 | 0.17 | 1.66 | 0.49 | 1.50 | 0.37 | −1.30 | 0.27 | −1.43 | 0.24 | −1.60 | 0.22 |
| ICAM1 | 1.46 | 0.24 | 1.29 | 0.17 | 1.03 | 0.16 | −1.02 | 0.12 | −1.00 | 0.12 | 1.11 | 0.14 |
| IFNB1 | 1.12 | 0.07 | 1.27 | 0.06 | −1.27 | 0.09 | 1.08 | 0.05 | 1.17 | 0.06 | 1.15 | 0.05 |
| IFNG | −1.32 | 0.22 | 1.44 | 0.39 | 1.41 | 0.41 | 1.08 | 0.05 | 1.17 | 0.06 | 1.15 | 0.05 |
| IL12B | −1.36 | 0.16 | 1.45 | 0.33 | 1.64 | 0.31 | −1.02 | 0.05 | 2.01 | 0.10 | 1.13 | 0.05 |
| IL15 | 1.14 | 0.23 | 2.22 | 0.58 | 2.31 | 0.49 | 1.08 | 0.05 | 1.46 | 0.06 | 1.55 | 0.07 |
| IL1A | −1.52 | 0.11 | −1.33 | 0.11 | −1.31 | 0.09 | −1.70 | 0.12 | 1.26 | 0.27 | −1.24 | 0.17 |
| IL1B | 1.03 | 0.09 | −1.12 | 0.10 | −1.36 | 0.09 | 1.02 | 0.10 | 1.10 | 0.11 | 1.08 | 0.10 |
| IL1R2 | −1.80 | 0.16 | −1.00 | 0.24 | −1.29 | 0.18 | −1.27 | 0.14 | 1.41 | 0.25 | −1.13 | 0.16 |
| IL1RN | 1.73 | 0.32 | 1.14 | 0.31 | 1.08 | 0.24 | 1.08 | 0.05 | 1.17 | 0.06 | 1.15 | 0.05 |
| IL2 | −1.16 | 0.18 | 1.14 | 0.19 | 1.03 | 0.18 | 1.08 | 0.05 | 1.17 | 0.06 | 1.15 | 0.05 |
| IL2RA | 1.67 | 0.28 | 1.21 | 0.27 | 1.30 | 0.18 | 1.08 | 0.05 | 1.17 | 0.06 | 1.15 | 0.05 |
| IL4 | −1.36 | 0.23 | 1.51 | 0.46 | 1.20 | 0.33 | 1.10 | 0.18 | −1.17 | 0.14 | −1.60 | 0.10 |
| IL6 | −1.30 | 0.22 | 1.75 | 0.51 | 1.53 | 0.45 | 1.19 | 0.12 | 1.09 | 0.11 | 1.07 | 0.11 |
| IL8 | −1.73 | 0.19 | 2.42 | 0.66 | 3.74 | 0.86 | 1.20 | 0.19 | 1.38 | 0.22 | 1.01 | 0.16 |
| INS | −1.16 | 0.17 | 1.22 | 0.20 | 1.48 | 0.34 | 1.08 | 0.05 | 1.17 | 0.06 | 1.15 | 0.05 |
| IRF1 | 1.27 | 0.14 | 1.45 | 0.15 | 2.19 | 0.25 | 1.08 | 0.09 | 1.41 | 0.12 | 1.56 | 0.13 |
| LTA | −1.19 | 0.35 | 1.77 | 0.64 | 1.89 | 0.60 | −1.29 | 0.19 | 1.86 | 0.45 | 1.00 | 0.24 |
| LTB | −1.87 | 0.20 | 1.23 | 0.38 | 1.13 | 0.30 | −1.54 | 0.21 | 2.67 | 0.87 | 1.30 | 0.42 |
| MAP2K6 | −1.20 | 0.18 | −1.91 | 0.10 | −2.78 | 0.06 | −1.15 | 0.21 | −1.09 | 0.22 | −1.02 | 0.24 |
| MMP9 | −1.37 | 0.04 | −1.36 | 0.03 | −1.48 | 0.03 | −1.42 | 0.13 | −1.28 | 0.14 | −1.18 | 0.16 |
| MYC | 1.03 | 0.05 | −1.02 | 0.06 | −1.22 | 0.04 | −1.19 | 0.15 | −1.24 | 0.14 | −1.24 | 0.14 |
| MYD88 | −1.89 | 0.14 | 1.24 | 0.36 | 1.13 | 0.27 | 1.57 | 0.53 | 1.60 | 0.54 | 1.41 | 0.47 |
| NCOA3 | 1.04 | 0.08 | −1.15 | 0.05 | −1.20 | 0.05 | −1.13 | 0.06 | −1.11 | 0.06 | −1.33 | 0.05 |
| NFKB1 | −1.08 | 0.13 | 1.62 | 0.17 | 2.73 | 0.30 | 1.17 | 0.03 | 1.21 | 0.04 | 1.31 | 0.04 |
| NFKB2 | 1.01 | 0.12 | 2.93 | 0.33 | 4.07 | 0.45 | 1.09 | 0.18 | 1.48 | 0.24 | 1.62 | 0.26 |
| NFKBIA | −1.07 | 0.08 | 2.65 | 0.34 | 4.26 | 0.40 | −1.13 | 0.10 | 1.47 | 0.17 | 1.69 | 0.19 |
| NQO1 | 1.10 | 0.12 | −1.10 | 0.12 | −1.17 | 0.10 | 1.18 | 0.06 | 1.21 | 0.06 | 1.49 | 0.08 |
| NR4A2 | 1.43 | 0.25 | −1.10 | 0.19 | 1.03 | 0.23 | −1.02 | 0.17 | 1.08 | 0.19 | 1.73 | 0.30 |
| PDGFB | 1.41 | 0.16 | 1.13 | 0.17 | −1.02 | 0.14 | 1.08 | 0.05 | 1.17 | 0.06 | 1.15 | 0.05 |
| PLAU | −1.11 | 0.15 | 2.09 | 0.49 | 2.18 | 0.41 | 1.22 | 0.27 | 1.26 | 0.28 | −1.29 | 0.17 |
| PTGS2 | −1.03 | 0.03 | 1.41 | 0.03 | 1.77 | 0.05 | −1.62 | 0.11 | −1.21 | 0.15 | −1.35 | 0.13 |
| REL | 1.10 | 0.15 | 1.02 | 0.14 | 1.40 | 0.17 | −1.32 | 0.04 | −1.07 | 0.05 | −1.07 | 0.05 |
| RELA | 1.10 | 0.06 | 1.07 | 0.04 | 1.19 | 0.05 | 1.00 | 0.06 | 1.14 | 0.07 | 1.05 | 0.06 |
| RELB | −1.73 | 0.21 | 1.68 | 0.60 | 1.87 | 0.51 | −1.13 | 0.17 | 1.09 | 0.20 | 1.02 | 0.19 |
| SELE | −1.79 | 0.25 | 1.70 | 0.68 | 1.92 | 0.71 | 1.36 | 0.24 | 1.32 | 0.24 | −1.41 | 0.13 |
| SELP | 1.41 | 0.15 | −1.01 | 0.21 | −1.08 | 0.15 | 1.08 | 0.05 | 1.17 | 0.06 | 1.15 | 0.05 |
| SNAP25 | 1.05 | 0.26 | 1.21 | 0.22 | 1.06 | 0.19 | 1.59 | 0.49 | 1.86 | 0.58 | 1.96 | 0.61 |
| SOD2 | −1.05 | 0.07 | −1.08 | 0.05 | −1.00 | 0.07 | −1.03 | 0.09 | 1.02 | 0.10 | 1.15 | 0.11 |
| STAT1 | 1.15 | 0.14 | −1.17 | 0.09 | −1.10 | 0.10 | −1.08 | 0.04 | −1.14 | 0.04 | −1.25 | 0.03 |
| STAT3 | −1.14 | 0.10 | 1.03 | 0.11 | 1.12 | 0.13 | −1.13 | 0.06 | −1.15 | 0.05 | −1.16 | 0.05 |
| STAT5B | 1.08 | 0.16 | 1.33 | 0.19 | 1.24 | 0.15 | 1.00 | 0.13 | −1.08 | 0.12 | −1.17 | 0.11 |
| TNF | 1.01 | 0.11 | 5.10 | 0.99 | 12.90 | 1.72 | 1.08 | 0.05 | 1.17 | 0.06 | 1.15 | 0.05 |
| TNFRSF1B | −1.81 | 0.16 | 1.02 | 0.22 | 1.11 | 0.22 | −2.15 | 0.26 | 4.10 | 2.28 | 2.39 | 1.33 |
| TNFSF10 | −1.48 | 0.17 | 1.11 | 0.21 | −1.02 | 0.18 | −1.61 | 0.23 | 2.81 | 1.06 | 1.64 | 0.62 |
| TP53 | 1.13 | 0.02 | 1.39 | 0.04 | 1.67 | 0.08 | −1.14 | 0.02 | −1.02 | 0.02 | −1.04 | 0.02 |
| TRAF2 | 1.06 | 0.11 | 1.04 | 0.09 | 1.12 | 0.10 | 1.10 | 0.05 | −1.10 | 0.04 | −1.03 | 0.04 |
| VCAM1 | −1.27 | 0.20 | 4.24 | 1.56 | 2.94 | 0.87 | 1.08 | 0.05 | 1.17 | 0.06 | 1.15 | 0.05 |
| XIAP | −1.07 | 0.11 | −1.18 | 0.09 | −1.23 | 0.07 | −1.13 | 0.11 | −1.17 | 0.10 | −1.27 | 0.10 |
| ACTB | 1.12 | 0.10 | −1.16 | 0.08 | −1.08 | 0.07 | 1.21 | 0.17 | 1.08 | 0.16 | −1.04 | 0.14 |
| B2M | −1.05 | 0.07 | 1.29 | 0.14 | 1.29 | 0.09 | −1.09 | 0.04 | −1.06 | 0.04 | 1.08 | 0.04 |
| GAPDH | −1.14 | 0.04 | −1.03 | 0.04 | −1.10 | 0.05 | 1.03 | 0.05 | −1.06 | 0.05 | −1.17 | 0.04 |
| HPRT1 | 1.04 | 0.04 | 1.01 | 0.03 | −1.02 | 0.04 | −1.08 | 0.12 | 1.10 | 0.14 | 1.21 | 0.16 |
| RPLP0 | 1.06 | 0.05 | 1.03 | 0.07 | 1.01 | 0.05 | 1.01 | 0.05 | 1.00 | 0.05 | −1.01 | 0.05 |
| HEK wt | RelA k.d. | |||||||
|---|---|---|---|---|---|---|---|---|
| 0.5 Gy | 4 Gy | 0.5 Gy | 4 Gy | |||||
| Symbol | µ | SE | µ | SE | µ | SE | µ | SE |
| ADM | −1.44 | 0.08 | 1.14 | 0.13 | 1.22 | 0.24 | 1.24 | 0.24 |
| AGT | −1.88 | 0.16 | −1.48 | 0.21 | −1.36 | 0.08 | 1.11 | 0.13 |
| AKT1 | −1.01 | 0.05 | 1.11 | 0.06 | −1.11 | 0.14 | −1.16 | 0.13 |
| ALDH3A2 | −1.05 | 0.03 | −1.16 | 0.03 | 1.08 | 0.04 | −1.15 | 0.04 |
| BCL2A1 | −1.21 | 0.13 | 1.04 | 0.17 | 1.12 | 0.15 | −1.23 | 0.11 |
| BCL2L1 | 1.17 | 0.13 | −1.16 | 0.10 | 1.36 | 0.10 | −1.68 | 0.04 |
| BIRC2 | 1.08 | 0.07 | 1.06 | 0.07 | 1.26 | 0.12 | −1.17 | 0.08 |
| BIRC3 | 1.34 | 0.20 | 1.66 | 0.24 | 1.29 | 0.30 | −1.16 | 0.20 |
| C3 | 1.58 | 0.25 | 1.03 | 0.16 | −1.46 | 0.20 | −1.99 | 0.15 |
| CCL11 | 1.97 | 0.81 | 1.10 | 0.45 | 1.46 | 0.45 | 1.68 | 0.52 |
| CCL2 | 1.18 | 0.11 | 2.94 | 0.27 | 1.57 | 0.19 | 2.64 | 0.31 |
| CCL22 | 1.24 | 0.23 | 1.57 | 0.29 | −1.26 | 0.04 | −1.12 | 0.04 |
| CCL5 | −1.97 | 0.17 | −1.56 | 0.22 | −1.89 | 0.23 | 1.22 | 0.53 |
| CCND1 | −1.77 | 0.11 | 1.03 | 0.19 | −1.23 | 0.11 | −1.24 | 0.11 |
| CCR5 | −1.02 | 0.37 | −2.13 | 0.18 | 1.04 | 0.19 | 1.35 | 0.24 |
| CD40 | 1.58 | 0.26 | −1.17 | 0.14 | 1.15 | 0.23 | −1.30 | 0.15 |
| CD69 | −1.09 | 0.07 | 1.16 | 0.09 | −1.26 | 0.04 | −1.12 | 0.04 |
| CD80 | −1.01 | 0.27 | −1.55 | 0.18 | 2.03 | 0.67 | −1.53 | 0.22 |
| CD83 | 1.25 | 0.04 | 4.37 | 0.14 | 1.09 | 0.05 | 1.42 | 0.07 |
| CDKN1A | −1.39 | 0.10 | 1.21 | 0.17 | −1.35 | 0.21 | −1.07 | 0.26 |
| CFB | 1.01 | 0.12 | 1.14 | 0.14 | 1.57 | 0.20 | −1.01 | 0.12 |
| CSF1 | −1.15 | 0.08 | 1.69 | 0.15 | −1.06 | 0.02 | −1.01 | 0.02 |
| CSF2 | −1.82 | 0.22 | −1.30 | 0.31 | −3.46 | 0.04 | 1.48 | 0.20 |
| CSF2RB | −1.30 | 0.06 | −1.03 | 0.07 | −1.26 | 0.04 | −1.12 | 0.04 |
| CSF3 | −1.44 | 0.24 | −1.44 | 0.24 | 1.02 | 0.19 | 1.46 | 0.27 |
| CXCL1 | 1.01 | 0.19 | 7.55 | 1.44 | −1.48 | 0.05 | 1.21 | 0.10 |
| CXCL10 | −1.27 | 0.14 | 6.70 | 1.20 | −1.30 | 0.06 | −1.15 | 0.06 |
| CXCL2 | 1.30 | 0.22 | 3.48 | 0.59 | 1.11 | 0.21 | 1.00 | 0.19 |
| CXCL9 | 1.02 | 0.37 | −2.17 | 0.17 | 1.14 | 0.30 | −1.66 | 0.16 |
| EGFR | −1.33 | 0.07 | −1.12 | 0.09 | −1.05 | 0.10 | −1.08 | 0.10 |
| EGR2 | 1.17 | 0.39 | −1.66 | 0.20 | 1.57 | 0.41 | −1.52 | 0.17 |
| F3 | −1.15 | 0.10 | 1.47 | 0.17 | −1.01 | 0.13 | −1.00 | 0.13 |
| F8 | −1.22 | 0.12 | −1.06 | 0.13 | 1.19 | 0.01 | −1.01 | 0.01 |
| FAS | −2.11 | 0.11 | −1.61 | 0.14 | 1.14 | 0.21 | 1.15 | 0.21 |
| FASLG | −1.40 | 0.32 | −1.51 | 0.30 | −1.10 | 0.16 | 1.15 | 0.21 |
| GADD45B | −1.06 | 0.30 | 2.19 | 0.69 | 1.69 | 0.59 | 2.06 | 0.72 |
| ICAM1 | −1.57 | 0.10 | −1.64 | 0.10 | 1.14 | 0.14 | 1.37 | 0.17 |
| IFNB1 | −1.24 | 0.05 | 1.02 | 0.06 | −1.26 | 0.04 | −1.12 | 0.04 |
| IFNG | −1.84 | 0.16 | −1.46 | 0.20 | −1.26 | 0.04 | −1.12 | 0.04 |
| IL12B | −1.35 | 0.16 | −1.49 | 0.14 | 1.25 | 0.06 | 1.30 | 0.06 |
| IL15 | −1.32 | 0.15 | 1.07 | 0.22 | −1.21 | 0.04 | −1.41 | 0.03 |
| IL1A | −1.39 | 0.12 | −1.83 | 0.09 | 1.57 | 0.33 | −1.40 | 0.15 |
| IL1B | −1.35 | 0.07 | −1.07 | 0.09 | −1.02 | 0.10 | −1.18 | 0.08 |
| IL1R2 | −1.29 | 0.22 | −1.99 | 0.14 | 1.01 | 0.18 | −1.80 | 0.10 |
| IL1RN | 1.24 | 0.23 | 1.57 | 0.29 | −1.26 | 0.04 | −1.12 | 0.04 |
| IL2 | −1.62 | 0.13 | −1.28 | 0.16 | −1.26 | 0.04 | −1.12 | 0.04 |
| IL2RA | 1.20 | 0.20 | 1.52 | 0.25 | −1.26 | 0.04 | −1.12 | 0.04 |
| IL4 | −1.12 | 0.28 | −1.17 | 0.26 | −1.26 | 0.13 | 1.02 | 0.16 |
| IL6 | −1.81 | 0.15 | −1.43 | 0.20 | −1.27 | 0.08 | 1.09 | 0.11 |
| IL8 | 1.38 | 0.44 | 6.10 | 1.96 | −1.26 | 0.13 | 1.44 | 0.23 |
| INS | −1.62 | 0.12 | −1.28 | 0.15 | −1.26 | 0.04 | −1.12 | 0.04 |
| IRF1 | 1.06 | 0.12 | 2.85 | 0.33 | −1.09 | 0.08 | 1.40 | 0.11 |
| LTA | 1.05 | 0.44 | −2.07 | 0.20 | 1.28 | 0.31 | −1.39 | 0.17 |
| LTB | 1.16 | 0.44 | −2.18 | 0.17 | 1.91 | 0.62 | −1.49 | 0.22 |
| MAP2K6 | −1.17 | 0.19 | −1.63 | 0.13 | 1.99 | 0.48 | 1.44 | 0.35 |
| MMP9 | 1.24 | 0.07 | −1.04 | 0.06 | 1.09 | 0.20 | 1.07 | 0.20 |
| MYC | −1.14 | 0.04 | 1.21 | 0.05 | 1.67 | 0.29 | 1.97 | 0.35 |
| MYD88 | −1.05 | 0.24 | −1.25 | 0.21 | −1.35 | 0.25 | −1.10 | 0.30 |
| NCOA3 | −1.18 | 0.06 | 1.06 | 0.08 | 1.18 | 0.08 | −1.17 | 0.06 |
| NFKB1 | −1.24 | 0.12 | 2.09 | 0.30 | 1.04 | 0.03 | 1.05 | 0.03 |
| NFKB2 | −1.25 | 0.09 | 2.52 | 0.29 | −1.02 | 0.16 | 1.04 | 0.17 |
| NFKBIA | −1.11 | 0.08 | 3.55 | 0.31 | 1.05 | 0.12 | 1.47 | 0.17 |
| NQO1 | −1.27 | 0.09 | −1.34 | 0.08 | 1.13 | 0.06 | −1.14 | 0.04 |
| NR4A2 | 1.09 | 0.19 | 1.11 | 0.19 | −1.20 | 0.14 | −1.40 | 0.12 |
| PDGFB | 1.02 | 0.11 | 1.28 | 0.14 | −1.26 | 0.04 | −1.12 | 0.04 |
| PLAU | −1.64 | 0.10 | 1.08 | 0.18 | −1.09 | 0.20 | −1.47 | 0.15 |
| PTGS2 | 1.39 | 0.04 | 2.12 | 0.06 | 1.07 | 0.19 | 1.01 | 0.18 |
| REL | 1.11 | 0.15 | 1.84 | 0.25 | 1.02 | 0.05 | −1.17 | 0.04 |
| RELA | 1.17 | 0.07 | 1.48 | 0.08 | 1.21 | 0.07 | 1.15 | 0.07 |
| RELB | −1.39 | 0.26 | −1.09 | 0.33 | 1.01 | 0.19 | −1.20 | 0.16 |
| SELE | −1.09 | 0.41 | −1.34 | 0.33 | −1.00 | 0.18 | 1.06 | 0.19 |
| SELP | 1.01 | 0.11 | 1.28 | 0.13 | −1.26 | 0.04 | −1.12 | 0.04 |
| SNAP25 | −1.74 | 0.14 | −2.36 | 0.10 | −1.32 | 0.24 | −1.69 | 0.18 |
| SOD2 | −1.17 | 0.06 | −1.06 | 0.06 | 1.24 | 0.12 | 1.29 | 0.13 |
| STAT1 | 1.19 | 0.14 | 1.40 | 0.17 | −1.01 | 0.04 | −1.03 | 0.04 |
| STAT3 | −1.29 | 0.09 | −1.32 | 0.09 | 1.11 | 0.07 | −1.08 | 0.06 |
| STAT5B | −1.16 | 0.13 | −1.18 | 0.13 | −1.14 | 0.12 | −1.40 | 0.10 |
| TNF | 1.08 | 0.12 | 6.72 | 0.76 | −1.26 | 0.04 | −1.12 | 0.04 |
| TNFRSF1B | 1.07 | 0.30 | −2.04 | 0.14 | 2.88 | 1.60 | −2.65 | 0.21 |
| TNFSF10 | 1.06 | 0.27 | −1.65 | 0.15 | 1.58 | 0.60 | −2.19 | 0.17 |
| TP53 | −1.03 | 0.02 | 1.49 | 0.03 | −1.12 | 0.02 | −1.03 | 0.02 |
| TRAF2 | −1.13 | 0.09 | 1.32 | 0.14 | −1.00 | 0.04 | 1.15 | 0.05 |
| VCAM1 | −1.77 | 0.15 | −1.10 | 0.24 | −1.26 | 0.04 | −1.12 | 0.04 |
| XIAP | −1.01 | 0.12 | 1.19 | 0.14 | −1.02 | 0.12 | −1.32 | 0.09 |
| ACTB | 1.25 | 0.11 | 1.12 | 0.10 | 1.19 | 0.17 | 1.24 | 0.18 |
| B2M | −1.08 | 0.07 | −1.01 | 0.08 | −1.06 | 0.04 | −1.07 | 0.04 |
| GAPDH | −1.02 | 0.05 | −1.12 | 0.04 | 1.13 | 0.05 | 1.10 | 0.05 |
| HPRT1 | −1.10 | 0.04 | −1.05 | 0.04 | −1.21 | 0.11 | −1.21 | 0.11 |
| RPLP0 | 1.01 | 0.05 | 1.10 | 0.05 | 1.01 | 0.05 | 1.01 | 0.05 |
References
- Berger, T.; Bilski, P.; Hajek, M.; Puchalska, M.; Reitz, G. The MATROSHKA Experiment: Results and Comparison from Extravehicular Activity (MTR-1) and Intravehicular Activity (MTR-2A/2B) Exposure. Radiat. Res. 2013, 180, 622–637. [Google Scholar] [CrossRef] [PubMed] [Green Version]
- Puchalska, M.; Bilski, P.; Berger, T.; Hajek, M.; Horwacik, T.; Korner, C.; Olko, P.; Shurshakov, V.; Reitz, G. NUNDO: A Numerical Model of a Human Torso Phantom and Its Application to Effective Dose Equivalent Calculations for Astronauts at the ISS. Radiat. Environ. Biophys. 2014, 53, 719–727. [Google Scholar] [CrossRef] [PubMed]
- Zeitlin, C.; Hassler, D.M.; Cucinotta, F.A.; Ehresmann, B.; Wimmer-Schweingruber, R.F.; Brinza, D.E.; Kang, S.; Weigle, G.; Bottcher, S.; Bohm, E.; et al. Measurements of Energetic Particle Radiation in Transit to Mars on the Mars Science Laboratory. Science 2013, 340, 1080–1084. [Google Scholar] [CrossRef] [PubMed]
- Hassler, D.M.; Zeitlin, C.; Wimmer-Schweingruber, R.F.; Ehresmann, B.; Rafkin, S.; Eigenbrode, J.L.; Brinza, D.E.; Weigle, G.; Bottcher, S.; Bohm, E.; et al. Mars’ Surface Radiation Environment Measured with the Mars Science Laboratory’s Curiosity Rover. Science 2014, 343, 1244797. [Google Scholar] [CrossRef] [PubMed]
- National Council on Radiation Protection and Measurements. Information Needed to Make Radiation Protection Recommendations for Space Missions beyond Low-Earth Orbit: Recommendations of the National Council on Radiation Protection and Measurements; National Council on Radiation Protection and Measurements: Bethesda, MD, USA, 2006.
- Cucinotta, F.A.; Manuel, F.K.; Jones, J.; Iszard, G.; Murrey, J.; Djojonegro, B.; Wear, M. Space Radiation and Cataracts in Astronauts. Radiat. Res. 2001, 156, 460–466. [Google Scholar] [CrossRef]
- Chylack, L.T., Jr.; Peterson, L.E.; Feiveson, A.H.; Wear, M.L.; Manuel, F.K.; Tung, W.H.; Hardy, D.S.; Marak, L.J.; Cucinotta, F.A. NASA Study of Cataract in Astronauts (NASCA). Report 1: Cross-Sectional Study of the Relationship of Exposure to Space Radiation and Risk of Lens Opacity. Radiat. Res. 2009, 172, 10–20. [Google Scholar] [CrossRef] [PubMed]
- Hughson, R.L.; Helm, A.; Durante, M. Heart in Space: Effect of the Extraterrestrial Environment on the Cardiovascular System. Nat. Rev. Cardiol. 2018, 15, 167–180. [Google Scholar] [CrossRef] [PubMed]
- Jandial, R.; Hoshide, R.; Waters, J.D.; Limoli, C.L. Space-Brain: The Negative Effects of Space Exposure on the Central Nervous System. Surg. Neurol. Intern. 2018, 9, 9. [Google Scholar]
- Sanzari, J.K.; Wan, X.S.; Muehlmatt, A.; Lin, L.; Kennedy, A.R. Comparison of Changes over Time in Leukocyte Counts in Yucatan Minipigs Irradiated with Simulated Solar Particle Event-Like Radiation. Life Sci. Space Res. 2015, 4, 11–16. [Google Scholar] [CrossRef] [PubMed]
- Sanzari, J.K.; Diffenderfer, E.S.; Hagan, S.; Billings, P.C.; Gridley, D.S.; Seykora, J.T.; Kennedy, A.R.; Cengel, K.A. Dermatopathology Effects of Simulated Solar Particle Event Radiation Exposure in the Porcine Model. Life Sci. Space Res. 2015, 6, 21–28. [Google Scholar] [CrossRef] [PubMed]
- Pecaut, M.J.; Gridley, D.S. The Impact of Mouse Strain on Iron Ion Radio-Immune Response of Leukocyte Populations. Int. J. Radiat. Biol. 2010, 86, 409–419. [Google Scholar] [CrossRef] [PubMed]
- Georgakilas, A.G.; O’Neill, P.; Stewart, R.D. Induction and Repair of Clustered DNA Lesions: What do We Know So Far? Radiat. Res. 2013, 180, 100–109. [Google Scholar] [CrossRef] [PubMed]
- Hellweg, C.E.; Spitta, L.F.; Henschenmacher, B.; Diegeler, S.; Baumstark-Khan, C. Transcription Factors in the Cellular Response to Charged Particle Exposure. Front. Oncol. 2016, 6, 61. [Google Scholar] [CrossRef] [PubMed] [Green Version]
- Colombo, F.; Zambrano, S.; Agresti, A. NF-kappaB, the Importance of Being Dynamic: Role and Insights in Cancer. Biomedicines 2018, 6, 45. [Google Scholar] [CrossRef] [PubMed]
- Brach, M.A.; Hass, R.; Sherman, M.L.; Gunji, H.; Weichselbaum, R.; Kufe, D. Ionizing Radiation Induces Expression and Binding Activity of the Nuclear Factor Kappa B. J. Clin. Investig. 1991, 88, 691–695. [Google Scholar] [CrossRef] [PubMed]
- Sen, R.; Baltimore, D. Inducibility of Kappa Immunoglobulin Enhancer-Binding Protein Nf-Kappa B by a Posttranslational Mechanism. Cell 1986, 47, 921–928. [Google Scholar] [CrossRef]
- Baumstark-Khan, C.; Hellweg, C.E.; Arenz, A.; Meier, M.M. Cellular Monitoring of the Nuclear Factor kappaB Pathway for Assessment of Space Environmental Radiation. Radiat. Res. 2005, 164, 527–530. [Google Scholar] [CrossRef] [PubMed]
- Hellweg, C.E.; Baumstark-Khan, C.; Schmitz, C.; Lau, P.; Meier, M.M.; Testard, I.; Berger, T.; Reitz, G. Carbon-Ion-Induced Activation of the NF-kappaB Pathway. Radiat. Res. 2011, 175, 424–431. [Google Scholar] [CrossRef] [PubMed]
- Hellweg, C.E.; Baumstark-Khan, C.; Schmitz, C.; Lau, P.; Meier, M.M.; Testard, I.; Berger, T.; Reitz, G. Activation of the Nuclear Factor kappaB Pathway by Heavy Ion Beams of Different Linear Energy Transfer. Int. J. Radiat. Biol. 2011, 87, 954–963. [Google Scholar] [CrossRef] [PubMed]
- Reitz, G.; Berger, T.; Bilski, P.; Facius, R.; Hajek, M.; Petrov, V.; Puchalska, M.; Zhou, D.; Bossler, J.; Akatov, Y.; et al. Astronaut’s Organ Doses Inferred from Measurements in a Human Phantom Outside the International Space Station. Radiat. Res. 2009, 171, 225–235. [Google Scholar] [CrossRef] [PubMed]
- Habraken, Y.; Piette, J. NF-kappaB Activation by Double-Strand Breaks. Biochem. Pharmacol. 2006, 72, 1132–1141. [Google Scholar] [CrossRef] [PubMed]
- Hellweg, C.E. The Nuclear Factor kappaB Pathway: A link to the Immune System in the Radiation Response. Cancer Lett. 2015, 368, 275–289. [Google Scholar] [CrossRef] [PubMed]
- Ghosh, S.; May, M.J.; Kopp, E.B. NF-kappa B and Rel Proteins: Evolutionarily Conserved Mediators of Immune Responses. Annu. Rev. Immunol. 1998, 16, 225–260. [Google Scholar] [CrossRef] [PubMed]
- Baichwal, V.R.; Baeuerle, P.A. Activate NF-kappa B or Die? Curr. Biol. 1997, 7, R94–96. [Google Scholar] [CrossRef]
- Chishti, A.A.; Baumstark-Khan, C.; Koch, K.; Kolanus, W.; Feles, S.; Konda, B.; Azhar, A.; Spitta, L.F.; Henschenmacher, B.; Diegeler, S.; et al. Linear Energy Transfer Modulates Radiation-Induced NF-kappa B Activation and Expression of its Downstream Target Genes. Radiat. Res. 2018, 189, 354–370. [Google Scholar] [CrossRef] [PubMed]
- Hellweg, C.E.; Baumstark-Khan, C.; Horneck, G. Generation of Stably Transfected Mammalian Cell Lines as Fluorescent Screening Assay for NF-kappaB Activation-Dependent Gene Expression. J. Biomol. Screen. 2003, 8, 511–521. [Google Scholar] [CrossRef] [PubMed]
- Li, X.; Zhao, X.; Fang, Y.; Jiang, X.; Duong, T.; Fan, C.; Huang, C.C.; Kain, S.R. Generation of Destabilized Green Fluorescent Protein as a Transcription Reporter. J. Biol. Chem. 1998, 273, 34970–34975. [Google Scholar] [CrossRef] [PubMed] [Green Version]
- Natarajan, M.; Aravindan, N.; Meltz, M.L.; Herman, T.S. Post-Translational Modification of I-kappa B Alpha Activates NF-kappa B in Human Monocytes Exposed to 56Fe Ions. Radiat. Environ. Biophys. 2002, 41, 139–144. [Google Scholar] [CrossRef] [PubMed]
- Tungjai, M.; Whorton, E.B.; Rithidech, K.N. Persistence of Apoptosis and Inflammatory Responses in the Heart and Bone Marrow of Mice Following Whole-Body Exposure to (2)(8)Silicon ((2)(8)Si) ions. Radiat. Environ. Biophys. 2013, 52, 339–350. [Google Scholar] [CrossRef] [PubMed]
- Hickson, I.; Zhao, Y.; Richardson, C.J.; Green, S.J.; Martin, N.M.; Orr, A.I.; Reaper, P.M.; Jackson, S.P.; Curtin, N.J.; Smith, G.C. Identification and Characterization of a Novel and Specific Inhibitor of the Ataxia-Telangiectasia Mutated Kinase ATM. Cancer Res. 2004, 64, 9152–9159. [Google Scholar] [CrossRef] [PubMed] [Green Version]
- Xue, L.; Yu, D.; Furusawa, Y.; Okayasu, R.; Tong, J.; Cao, J.; Fan, S. Regulation of ATM in DNA Double Strand Break Repair Accounts for the Radiosensitivity in Human Cells Exposed to High Linear Energy Transfer Ionizing Radiation. Mutat. Res. 2009, 670, 15–23. [Google Scholar] [CrossRef] [PubMed]
- Takahashi, A.; Yamakawa, N.; Kirita, T.; Omori, K.; Ishioka, N.; Furusawa, Y.; Mori, E.; Ohnishi, K.; Ohnishi, T. DNA Damage Recognition Proteins Localize along Heavy Ion Induced Tracks in the Cell Nucleus. J. Radiat. Res. 2008, 49, 645–652. [Google Scholar] [CrossRef] [PubMed] [Green Version]
- Ghosh, S.; Narang, H.; Sarma, A.; Krishna, M. DNA Damage Response Signaling in Lung Adenocarcinoma A549 Cells Following Gamma and Carbon Beam Irradiation. Mutat. Res. 2011, 716, 10–19. [Google Scholar] [CrossRef] [PubMed]
- Li, Q.; Gao, Y.; Xu, Z.G.; Jiang, H.; Yu, Y.Y.; Zhu, Z.G. Effect of Antisense Oligodeoxynucleotide Targeted Against NF-kappaB/P65 on Cell Proliferation and Tumorigenesis of Gastric Cancer. Clin. Exp. Med. 2013, 13, 11–19. [Google Scholar] [CrossRef] [PubMed]
- Wang, F.; He, W.; Fanghui, P.; Wang, L.; Fan, Q. NF-kappaBP65 Promotes Invasion and Metastasis of Oesophageal Squamous Cell Cancer by Regulating Matrix Metalloproteinase-9 and Epithelial-to-Mesenchymal Transition. Cell Biol. Int. 2013, 37, 780–788. [Google Scholar] [CrossRef] [PubMed]
- Bonavia, R.; Inda, M.M.; Vandenberg, S.; Cheng, S.Y.; Nagane, M.; Hadwiger, P.; Tan, P.; Sah, D.W.; Cavenee, W.K.; Furnari, F.B. EGFRvIII Promotes Glioma Angiogenesis and Growth through the NF-kappaB, Interleukin-8 Pathway. Oncogene 2012, 31, 4054–4066. [Google Scholar] [CrossRef] [PubMed]
- Shi, Y.; Wang, S.Y.; Yao, M.; Sai, W.L.; Wu, W.; Yang, J.L.; Cai, Y.; Zheng, W.J.; Yao, D.F. Chemosensitization of HepG2 Cells by Suppression of NF-kappaB/p65 Gene Transcription with Specific-siRNA. World J. Gastroenterol. 2015, 21, 12814–12821. [Google Scholar] [CrossRef] [PubMed]
- Xiao, J.; Duan, X.; Yin, Q.; Miao, Z.; Yu, H.; Chen, C.; Zhang, Z.; Wang, J.; Li, Y. The Inhibition of Metastasis and Growth of Breast Cancer by Blocking the NF-kappaB Signaling Pathway Using Bioreducible PEI-based/p65 shRNA Complex Nanoparticles. Biomaterials 2013, 34, 5381–5390. [Google Scholar] [CrossRef] [PubMed]
- Toualbi-Abed, K.; Daniel, F.; Guller, M.C.; Legrand, A.; Mauriz, J.L.; Mauviel, A.; Bernuau, D. Jun D Cooperates with p65 to Activate the Proximal kappaB Site of the Cyclin D1 Promoter: Role of PI3K/PDK-1. Carcinogenesis 2008, 29, 536–543. [Google Scholar] [CrossRef] [PubMed]
- Widera, D.; Mikenberg, I.; Elvers, M.; Kaltschmidt, C.; Kaltschmidt, B. Tumor Necrosis Factor Alpha Triggers Proliferation of Adult Neural Stem Cells via IKK/NF-kappaB Signaling. BMC Neurosci. 2006, 7, 64. [Google Scholar] [CrossRef] [PubMed]
- Guttridge, D.C.; Albanese, C.; Reuther, J.Y.; Pestell, R.G.; Baldwin, A.S., Jr. NF-kappaB Controls Cell Growth and Differentiation through Transcriptional Regulation of Cyclin D1. Mol. Cell. Biol. 1999, 19, 5785–5799. [Google Scholar] [CrossRef] [PubMed]
- Galardi, S.; Mercatelli, N.; Farace, M.G.; Ciafre, S.A. NF-kB and c-Jun Induce the Expression of the Oncogenic miR-221 and miR-222 in Prostate Carcinoma and Glioblastoma Cells. Nucleic Acids Res. 2011, 39, 3892–3902. [Google Scholar] [CrossRef] [PubMed]
- Williams, J.R.; Zhang, Y.; Zhou, H.; Osman, M.; Cha, D.; Kavet, R.; Cuccinotta, F.; Dicello, J.F.; Dillehay, L.E. Predicting Cancer Rates in Astronauts from Animal Carcinogenesis Studies and Cellular Markers. Mutat. Res. 1999, 430, 255–269. [Google Scholar] [CrossRef]
- Watson, C.; Miller, D.A.; Chin-Sinex, H.; Losch, A.; Hughes, W.; Sweeney, C.; Mendonca, M.S. Suppression of NF-kappaB Activity by Parthenolide Induces X-ray Sensitivity through Inhibition of Split-Dose Repair in TP53 Null Prostate Cancer Cells. Radiat. Res. 2009, 171, 389–396. [Google Scholar] [CrossRef] [PubMed]
- Veuger, S.J.; Hunter, J.E.; Durkacz, B.W. Ionizing Radiation-Induced NF-kappaB Activation Requires PARP-1 Function to Confer Radioresistance. Oncogene 2009, 28, 832–842. [Google Scholar] [CrossRef] [PubMed]
- Wang, C.Y.; Mayo, M.W.; Baldwin, A.S., Jr. TNF- and Cancer Therapy-Induced Apoptosis: Potentiation by Inhibition of NF-kappaB. Science 1996, 274, 784–787. [Google Scholar] [CrossRef] [PubMed]
- Jung, M.; Dritschilo, A. NF-kappa B Signaling Pathway as a Target for Human Tumor Radiosensitization. Semin. Radiat. Oncol. 2001, 11, 346–351. [Google Scholar] [CrossRef] [PubMed]
- Russo, S.M.; Tepper, J.E.; Baldwin, A.S., Jr.; Liu, R.; Adams, J.; Elliott, P.; Cusack, J.C., Jr. Enhancement of Radiosensitivity by Proteasome Inhibition: Implications for a Role of NF-kappaB. Int. J. Radiat. Oncol. Biol. Phys. 2001, 50, 183–193. [Google Scholar] [CrossRef]
- Criswell, T.; Leskov, K.; Miyamoto, S.; Luo, G.; Boothman, D.A. Transcription Factors Activated in Mammalian Cells after Clinically Relevant Doses of Ionizing Radiation. Oncogene 2003, 22, 5813–5827. [Google Scholar] [CrossRef] [PubMed]
- Thyss, R.; Virolle, V.; Imbert, V.; Peyron, J.F.; Aberdam, D.; Virolle, T. NF-kappaB/Egr-1/Gadd45 are Sequentially Activated upon UVB Irradiation to Mediate Epidermal Cell Death. EMBO J. 2005, 24, 128–137. [Google Scholar] [CrossRef] [PubMed]
- Kraft, D.; Rall, M.; Volcic, M.; Metzler, E.; Groo, A.; Stahl, A.; Bauer, L.; Nasonova, E.; Salles, D.; Taucher-Scholz, G.; et al. NF-kappaB-dependent DNA Damage-Signaling Differentially Regulates DNA Double-Strand Break Repair Mechanisms in Immature and Mature Human Hematopoietic Cells. Leukemia 2015, 29, 1543–1554. [Google Scholar] [CrossRef] [PubMed]
- Mori, E.; Takahashi, A.; Yamakawa, N.; Kirita, T.; Ohnishi, T. High LET Heavy Ion Radiation Induces p53-independent Apoptosis. J. Radiat. Res. 2009, 50, 37–42. [Google Scholar] [CrossRef] [PubMed]
- Takahashi, A.; Matsumoto, H.; Yuki, K.; Yasumoto, J.; Kajiwara, A.; Aoki, M.; Furusawa, Y.; Ohnishi, K.; Ohnishi, T. High-LET Radiation Enhanced Apoptosis but Not Necrosis Regardless of p53 Status. Int. J. Radiat. Oncol. Biol. Phys. 2004, 60, 591–597. [Google Scholar] [CrossRef] [PubMed]
- Lu, W.; Zhang, G.; Zhang, R.; Flores, L.G., 2nd; Huang, Q.; Gelovani, J.G.; Li, C. Tumor Site-Specific Silencing of NF-kappaB p65 by Targeted Hollow Gold Nanosphere-Mediated Photothermal Transfection. Cancer Res. 2010, 70, 3177–3188. [Google Scholar] [CrossRef] [PubMed]
- Vlahopoulos, S.; Boldogh, I.; Casola, A.; Brasier, A.R. Nuclear Factor-kappaB-dependent Induction of Interleukin-8 Gene Expression by Tumor Necrosis Factor Alpha: Evidence for an Antioxidant Sensitive Activating Pathway Distinct from Nuclear Translocation. Blood 1999, 94, 1878–1889. [Google Scholar] [PubMed]
- Janus, P.; Szoltysek, K.; Zajac, G.; Stokowy, T.; Walaszczyk, A.; Widlak, W.; Wojtas, B.; Gielniewski, B.; Iwanaszko, M.; Braun, R.; et al. Pro-Inflammatory Cytokine and High Doses of Ionizing Radiation have Similar Effects on the Expression of NF-kappaB-dependent Genes. Cell. Signal. 2018, 46, 23–31. [Google Scholar] [CrossRef] [PubMed]
- Roach, D.R.; Bean, A.G.; Demangel, C.; France, M.P.; Briscoe, H.; Britton, W.J. TNF Regulates Chemokine Induction Essential for Cell Recruitment, Granuloma Formation, and Clearance of Mycobacterial Infection. J. Immunol. 2002, 168, 4620–4627. [Google Scholar] [CrossRef] [PubMed] [Green Version]
- Imadome, K.; Iwakawa, M.; Nojiri, K.; Tamaki, T.; Sakai, M.; Nakawatari, M.; Moritake, T.; Yanagisawa, M.; Nakamura, E.; Tsujii, H.; et al. Upregulation of Stress-Response Genes with Cell Cycle Arrest Induced by Carbon Ion Irradiation in Multiple Murine Tumors Models. Cancer Biol. Ther. 2008, 7, 208–217. [Google Scholar] [CrossRef] [PubMed]
- Coward, W.R.; Okayama, Y.; Sagara, H.; Wilson, S.J.; Holgate, S.T.; Church, M.K. NF-kappa B and TNF-alpha: A Positive Autocrine Loop in Human Lung Mast Cells? J. Immunol. 2002, 169, 5287–5293. [Google Scholar] [CrossRef] [PubMed]
- May, M.J.; Ghosh, S. Signal Transduction through NF-kappa B. Immunol. Today 1998, 19, 80–88. [Google Scholar] [CrossRef]
- Baldwin, A.S., Jr. The NF-kappa B and I kappa B Proteins: New Discoveries and Insights. Annu. Rev. Immunol. 1996, 14, 649–683. [Google Scholar] [CrossRef] [PubMed]
- Matsumoto, Y.; Iwakawa, M.; Furusawa, Y.; Ishikawa, K.; Aoki, M.; Imadome, K.; Matsumoto, I.; Tsujii, H.; Ando, K.; Imai, T. Gene Expression Analysis in Human Malignant Melanoma Cell Lines Exposed to Carbon Beams. Int. J. Radiat. Biol. 2008, 84, 299–314. [Google Scholar] [CrossRef] [PubMed]
- Souto-Carneiro, M.M.; Fritsch, R.; Sepulveda, N.; Lagareiro, M.J.; Morgado, N.; Longo, N.S.; Lipsky, P.E. The NF-kappaB Canonical Pathway is Involved in the Control of the Exonucleolytic Processing of Coding Ends during V(D)J Recombination. J. Immunol. 2008, 180, 1040–1049. [Google Scholar] [CrossRef] [PubMed]
- Nelson, G.A.; Jones, T.A.; Chesnut, A.; Smith, A.L. Radiation-Induced Gene Expression in the Nematode Caenorhabditis Elegans. J. Radiat. Res. 2002, 43, S199–S203. [Google Scholar] [CrossRef] [PubMed]
- Alwood, J.S.; Shahnazari, M.; Chicana, B.; Schreurs, A.S.; Kumar, A.; Bartolini, A.; Shirazi-Fard, Y.; Globus, R.K. Ionizing Radiation Stimulates Expression of Pro-Osteoclastogenic Genes in Marrow and Skeletal Tissue. J. Interferon Cytokine Res. 2015, 35, 480–487. [Google Scholar] [CrossRef] [PubMed]
- Josson, S.; Xu, Y.; Fang, F.; Dhar, S.K.; St Clair, D.K.; St Clair, W.H. RelB Regulates Manganese Superoxide Dismutase Gene and Resistance to Ionizing Radiation of Prostate Cancer Cells. Oncogene 2006, 25, 1554–1559. [Google Scholar] [CrossRef] [PubMed]
- Xu, Y.; Fang, F.; St Clair, D.K.; Josson, S.; Sompol, P.; Spasojevic, I.; St Clair, W.H. Suppression of RelB-Mediated Manganese Superoxide Dismutase Expression Reveals a Primary Mechanism for Radiosensitization Effect of 1alpha,25-dihydroxyvitamin D(3) in Prostate Cancer Cells. Mol. Cancer Ther. 2007, 6, 2048–2056. [Google Scholar] [CrossRef] [PubMed]
- Xu, Y.; Fang, F.; St Clair, D.K.; Sompol, P.; Josson, S.; St Clair, W.H. SN52, A Novel Nuclear Factor-kappaB Inhibitor, Blocks Nuclear Import of RelB:p52 Dimer and Sensitizes Prostate Cancer Cells to Ionizing Radiation. Mol. Cancer Ther. 2008, 7, 2367–2376. [Google Scholar] [CrossRef] [PubMed]
- Holley, A.K.; Xu, Y.; St Clair, D.K.; St Clair, W.H. RelB Regulates Manganese Superoxide Dismutase Gene and Resistance to Ionizing Radiation of Prostate Cancer Cells. Ann. N. Y. Acad. Sci. 2010, 1201, 129–136. [Google Scholar] [CrossRef] [PubMed]
- Ray, M.; Yunis, R.; Chen, X.; Rocke, D.M. Comparison of Low and High Dose Ionising Radiation Using Topological Analysis of Gene Coexpression Networks. BMC Genom. 2012, 13, 190. [Google Scholar] [CrossRef] [PubMed]
- Fujimoto, Y.; Tedder, T.F. CD83: A Regulatory Molecule of the Immune System with Great Potential for Therapeutic Application. J. Med. Dent. Sci. 2006, 53, 85–91. [Google Scholar] [PubMed]
- McKinsey, T.A.; Chu, Z.; Tedder, T.F.; Ballard, D.W. Transcription Factor NF-kappaB Regulates Inducible CD83 Gene Expression in Activated T Lymphocytes. Mol. Immunol. 2000, 37, 783–788. [Google Scholar] [CrossRef]
- Yang, Y.; Wang, X.; Moore, D.R.; Lightfoot, S.A.; Huycke, M.M. TNF-alpha Mediates Macrophage-Induced Bystander Effects through Netrin-1. Cancer Res. 2012, 72, 5219–5229. [Google Scholar] [CrossRef] [PubMed]
- Onizawa, M.; Nagaishi, T.; Kanai, T.; Nagano, K.; Oshima, S.; Nemoto, Y.; Yoshioka, A.; Totsuka, T.; Okamoto, R.; Nakamura, T.; et al. Signaling Pathway via TNF-alpha/NF-kappaB in Intestinal Epithelial Cells may be Directly Involved in Colitis-Associated Carcinogenesis. Am. J. Physiol. Gastrointest. Liver Physiol. 2009, 296, G850–G859. [Google Scholar] [CrossRef] [PubMed]
- Chan, A.T.; Ogino, S.; Giovannucci, E.L.; Fuchs, C.S. Inflammatory Markers are Associated with Risk of Colorectal Cancer and Chemopreventive Response to Anti-Inflammatory Drugs. Gastroenterology 2011, 140, 799–808. [Google Scholar] [CrossRef] [PubMed]
- Thommesen, L.; Laegreid, A. Distinct Differences between TNF Receptor 1- and TNF Receptor 2-mediated Activation of NFkappaB. J. Biochem. Mol. Biol. 2005, 38, 281–289. [Google Scholar] [PubMed]
- Chen, G.; Goeddel, D.V. TNF-R1 Signaling: A Beautiful Pathway. Science 2002, 296, 1634–1635. [Google Scholar] [CrossRef] [PubMed]
- Meng, Z.; Lou, S.; Tan, J.; Xu, K.; Jia, Q.; Zheng, W. Nuclear Factor-kappa B Inhibition can Enhance Apoptosis of Differentiated Thyroid Cancer Cells Induced by 131I. PLoS ONE 2012, 7, e33597. [Google Scholar] [CrossRef] [PubMed]
- Baggiolini, M.; Walz, A.; Kunkel, S.L. Neutrophil-Activating Peptide-1/interleukin 8, a Novel Cytokine that Activates Neutrophils. J. Clin. Inv. 1989, 84, 1045–1049. [Google Scholar] [CrossRef] [PubMed]
- Stein, B.; Baldwin, A.S., Jr. Distinct Mechanisms for Regulation of the Interleukin-8 Gene Involve Synergism and Cooperativity between C/EBP and NF-kappa B. Mol. Cell. Biol. 1993, 13, 7191–7198. [Google Scholar] [CrossRef] [PubMed]
- Wu, G.D.; Lai, E.J.; Huang, N.; Wen, X. Oct-1 and CCAAT/enhancer-binding Protein (C/EBP) Bind to Overlapping Elements within the Interleukin-8 Promoter. The role of Oct-1 as a Transcriptional Repressor. J. Biol. Chem. 1997, 272, 2396–2403. [Google Scholar] [CrossRef] [PubMed]
- Stewart, J.; Ko, Y.H.; Kennedy, A.R. Protective Effects of L-Selenomethionine on Space Radiation Induced Changes in Gene Expression. Radiat. Environ. Biophys. 2007, 46, 161–165. [Google Scholar] [CrossRef] [PubMed]
- Walenta, S.; Mueller-Klieser, W. Differential Superiority of Heavy Charged-Particle Irradiation to X-rays: Studies on Biological Effectiveness and Side Effect Mechanisms in Multicellular Tumor and Normal Tissue Models. Front. Oncol. 2016, 6, 30. [Google Scholar] [CrossRef] [PubMed]
- Tschachojan, V.; Schroer, H.; Averbeck, N.; Mueller-Klieser, W. Carbon Ions and X-rays Induce Proinflammatory Effects in 3D Oral Mucosa Models with and without PBMCs. Oncol. Rep. 2014, 32, 1820–1828. [Google Scholar] [CrossRef] [PubMed]
- Parihar, V.K.; Maroso, M.; Syage, A.; Allen, B.D.; Angulo, M.C.; Soltesz, I.; Limoli, C.L. Persistent Nature of Alterations in Cognition and Neuronal Circuit Excitability after Exposure to Simulated Cosmic Radiation in Mice. Exp. Neurol. 2018, 305, 44–55. [Google Scholar] [CrossRef] [PubMed]
- Parihar, V.K.; Allen, B.D.; Caressi, C.; Kwok, S.; Chu, E.; Tran, K.K.; Chmielewski, N.N.; Giedzinski, E.; Acharya, M.M.; Britten, R.A.; et al. Cosmic Radiation Exposure and Persistent Cognitive Dysfunction. Sci. Rep. 2016, 6, 34774. [Google Scholar] [CrossRef] [PubMed]
- Choudhury, A.; Cuddihy, A.; Bristow, R.G. Radiation and New Molecular Agents Part I: Targeting ATM-ATR Checkpoints, DNA Repair, and the Proteasome. Semin. Radiat. Oncol. 2006, 16, 51–58. [Google Scholar] [CrossRef] [PubMed]
- Ao, N.; Chen, Q.; Liu, G. The Small Molecules Targeting Ubiquitin-Proteasome System for Cancer Therapy. Comb. Chem. High Throughput Screen. 2017, 20, 403–413. [Google Scholar] [CrossRef] [PubMed]
- Salminen, A.; Lehtonen, M.; Suuronen, T.; Kaarniranta, K.; Huuskonen, J. Terpenoids: Natural Inhibitors of NF-kappaB Signaling with Anti-Inflammatory and Anticancer Potential. Cell. Mol. Life Sci. 2008, 65, 2979–2999. [Google Scholar] [CrossRef] [PubMed]
- Jain, H.; Dhingra, N.; Narsinghani, T.; Sharma, R. Insights into the Mechanism of Natural Terpenoids as NF-kappaB Inhibitors: An Overview on Their Anticancer Potential. Exp. Oncol. 2016, 38, 158–168. [Google Scholar] [PubMed]
- Hellweg, C.E.; Langen, B.; Klimow, G.; Ruscher, R.; Schmitz, C.; Baumstark-Khan, C.; Reitz, G. Up-Stream Events in the Nuclear Factor κB Activation Cascade in Response to Sparsely Ionizing Radiation. Adv. Space Res. 2009, 44, 907–916. [Google Scholar] [CrossRef]
- Burdelya, L.G.; Krivokrysenko, V.I.; Tallant, T.C.; Strom, E.; Gleiberman, A.S.; Gupta, D.; Kurnasov, O.V.; Fort, F.L.; Osterman, A.L.; Didonato, J.A.; et al. An Agonist of Toll-Like Receptor 5 Has Radioprotective Activity in Mouse and Primate Models. Science 2008, 320, 226–230. [Google Scholar] [CrossRef] [PubMed] [Green Version]
- Graham, F.L.; Smiley, J.; Russell, W.C.; Nairn, R. Characteristics of a Human Cell Line Transformed by DNA from Human Adenovirus Type 5. J. Gen. Virol. 1977, 36, 59–74. [Google Scholar] [CrossRef] [PubMed]
- Durantel, F.; Balanzat, E.; Cassimi, A.; Chevalier, F.; Ngono-Ravache, Y.; Madi, T.; Poully, J.-C.; Ramillon, J.M.; Rothard, H.; Ropars, F.; et al. Dosimetry for Radiobiology Experiments at GANIL. Nucl. Instrum. Methods Phys. Res. Sect. A: Accel. Spectrom. Detect. Assoc. Equip. 2016, 816, 70–77. [Google Scholar] [CrossRef]
- Wulf, H.; Kraft-Weyrather, W.; Miltenburger, H.G.; Blakely, E.A.; Tobias, C.A.; Kraft, G. Heavy-Ion Effects on Mammalian Cells: Inactivation Measurements with Different Cell Lines. Radiat. Res. Suppl. 1985, 8, S122–S134. [Google Scholar] [CrossRef] [PubMed]


| Gene Symbol | Description | Relative Gene Expression (µ ± SE) |
|---|---|---|
| CCL5 | Chemokine (C-C motif) ligand 5 | 15.57 ± 8.77 |
| CCND1 | Cyclin D1 | −2.99 ± 0.05 |
| IL8/CXCL8 | Interleukin-8 | −8.12 ± 5.20 |
| GADD45B | Growth arrest and DNA-damage-inducible, beta | 3.63 ± 1.08 |
| JUN | Jun oncogene | 4.96 ± 1.85 |
| RELA | V-rel reticuloendotheliosis viral oncogene homolog A | −4.93 ± 0.02 ** |
| Gene Symbol | Description | Relative Gene Expression | |
|---|---|---|---|
| HEK wt | RelA k.d. | ||
| BIRC3 | Baculoviral IAP repeat containing 3 | 4.76 ± 0.98 | 2.03 ± 0.47 |
| C3 | Complement component 3 | 5.97 ± 1.39 | 1.97 ± 0.57 |
| CCL2 | Chemokine (C-C motif) ligand 2 | 3.04 ± 0.24 | −1.28 ± 0.09 |
| CCL11 | Chemokine (C-C motif) ligand 11 | 3.73 ± 1.51 | 1.84 ± 0.57 |
| CCL5 | Chemokine (C-C motif) ligand 5 | 4.79 ± 1.79 | 29.02 ±12.66 |
| CD69 | CD69 molecule | 3.37 ± 0.23 | −1.15 ± 0.04 |
| CD83 | CD83 molecule | 5.68 ± 0.82 | 1.67 ± 0.08 |
| CXCL1 | Chemokine (C-X-C motif) ligand 1 | 47.46 ± 11.75 | −1.05 ± 0.08 |
| CXCL10 | Chemokine (C-X-C motif) ligand 10 | 23.38 ± 5.72 | −1.18 ± 0.06 |
| CXCL2 | Chemokine (C-X-C motif) ligand 2 | 18.29 ± 3.92 | 1.72 ± 0.33 |
| EXO1 | Exonuclease 1 | 1.97 ± 0.67 | −4.92 ± 0.02 |
| IL1R2 | Interleukin 1 receptor, type II | 4.02 ± 1.29 | 1.71 ± 0.30 |
| IL8/CXCL8 | Interleukin-8 | 17.83 ± 5.19 | 2.39 ± 0.50 |
| IRF1 | Interferon regulatory factor 1 | 3.16 ± 0.40 | 1.29 ± 0.11 |
| MMP9 | Matrix metallopeptidase 9 | 3.34 ± 0.61 | 2.01 ± 0.37 |
| NFKBIA | Nuclear factor of kappa light polypeptide gene enhancer in B-cells inhibitor, alpha | 11.88 ± 1.66 | 1.22 ± 0.04 |
| PLAU | Plasminogen activator, urokinase | 3.35 ± 0.57 | 2.64 ± 0.58 |
| PTGS2 | Prostaglandin-endoperoxide synthase 2 | 3.99 ± 0.53 | 2.17 ± 0.39 |
| TNF | Tumor necrosis factor | 60.95 ± 12.42 | 3.40 ± 0.54 |
| TNFRSF1B | Tumor necrosis factor receptor superfamily, member 1B | 1.49 ± 0.34 | 4.13 ± 2.29 |
| D0 (Gy) | n | Dq (Gy) | Significance Level for D0 | |||||
|---|---|---|---|---|---|---|---|---|
| Radiation Quality | LET (keV/µm) | HEK wt | RelA k.d. | HEK wt | RelA k.d. | HEK wt | RelA k.d. | p = 2α |
| X-rays | 0.3–3 | 1.20 ± 0.05 | 0.76 ± 0.04 | 1.31 ± 0.84 | 2.43 ± 1.06 | 0.33 ± 0.71 | 0.68 ± 0.33 | <0.005 |
| 12C | 10 | 1.03 ± 0.14 | 0.91 ± 0.22 | 1.17 ± 0.34 | 1.64 ± 1.15 | 0.15 ± 0.36 | 0.34 ± 0.71 | 0.6006 |
| 28Si | 55 | 0.47 ± 0.05 | 0.38 ± 0.04 | 1.28 ± 0.34 | 1.31 ± 0.12 | 0.12 ± 0.14 | 0.10 ± 0.12 | 0.1923 |
| 58Ni | 175 | 0.53 ± 0.02 | 0.61 ± 0.04 | 1.0 ± 0.26 | 0.73 ± 0.26 | 0.0 ± 0.12 | −0.19 ± 0.19 | 0.0607 |
| 36Ar | 271 | 0.72 ± 0.09 | 0.68 ± 0.08 | 0.82 ± 0.36 | 1.11 ± 0.29 | −0.14 ± 0.27 | 0.08 ± 0.19 | 0.8371 |
| Radiation Quality | X-rays | 48Ti ions | ||||||||
|---|---|---|---|---|---|---|---|---|---|---|
| Dose (Gy) | 0.5 | 4.0 | 8.0 | 0.5 | 4.0 | |||||
| Gene Symbol/Cell Line | HEK wt | RelA k.d. | HEK wt | RelA k.d. | HEK wt | RelA k.d. | HEK wt | RelA k.d. | HEK wt | RelA k.d. |
| CCL5 | −1.42 ± 0.24 | 1.55 ± 0.68 | 3.68 ± 1.53 | 2.07 ± 0.90 | 3.34 ± 1.40 | −1.47 ± 0.30 | −1.97 ± 0.17 | −1.89 ± 0.23 | −1.56 ± 0.22 | 1.22 ± 0.53 |
| CD83 | −1.01 ± 0.03 | 1.12 ± 0.06 | 2.47 ± 0.08 | 1.67 ± 0.08 | 3.75 ± 0.18 | 2.27 ± 0.11 | 1.25 ± 0.04 | 1.09 ± 0.05 | 4.37 ± 0.14 | 1.42 ± 0.07 |
| CXCL1 | 1.04 ± 0.20 | 1.06 ± 0.09 | 3.57 ± 0.56 | 1.52 ± 0.12 | 6.96 ± 1.01 | 2.02 ± 0.16 | 1.01 ± 0.19 | −1.48 ± 0.05 | 7.55 ± 1.44 | 1.21 ± 0.10 |
| CXCL2 | −1.35 ± 0.13 | −1.04 ± 0.19 | 2.33 ± 0.33 | 1.55 ± 0.30 | 3.01 ± 0.40 | 1.29 ± 0.25 | 1.30 ± 0.22 | 1.11 ± 0.21 | 3.48 ± 0.59 | 1.00 ± 0.19 |
| CXCL10 | −1.10 ± 0.16 | 1.05 ± 0.08 | 4.68 ± 0.60 | 2.23 ± 0.16 | 14.58± 2.57 | 2.04 ± 0.15 | −1.27 ± 0.14 | −1.30 ± 0.06 | 6.70 ± 1.20 | −1.15 ± 0.06 |
| CXCL8/IL8 | −1.73 ± 0.19 | 1.20 ± 0.19 | 2.42 ± 0.66 | 1.38 ± 0.22 | 3.74 ± 0.86 | 1.01 ± 0.16 | 1.38 ± 0.44 | −1.26 ± 0.13 | 6.10 ± 1.96 | 1.44 ± 0.23 |
| NFKB2 | 1.01 ±0.12 | 1.09 ± 0.18 | 2.93 ± 0.33 | 1.48 ± 0.24 | 4.07 ± 0.45 | 1.62 ± 0.26 | −1.25 ± 0.09 | −1.02 ± 0.16 | 2.52 ± 0.29 | 1.04 ± 0.17 |
| NFKBIA | −1.07 ± 0.08 | −1.13 ± 0.10 | 2.65 ± 0.34 | 1.47 ± 0.17 | 4.26 ± 0.40 | 1.69 ± 0.19 | −1.11 ± 0.08 | 1.05 ± 0.12 | 3.55 ± 0.31 | 1.47 ± 0.17 |
| TNF | 1.01 ± 0.11 | 1.08 ± 0.05 | 5.10 ± 0.99 | 1.17 ± 0.06 | 12.90 ± 1.72 | 1.15 ± 0.05 | 1.08 ± 0.12 | −1.26 ± 0.04 | 6.72 ± 0.76 | −1.12 ± 0.04 |
| TNFRSF1B | −1.81 ± 0.16 | −2.15 ± 0.26 | 1.02 ± 0.22 | 4.10 ± 2.28 | 1.11 ± 0.22 | 2.39 ± 1.33 | 1.07 ± 0.30 | 2.88 ± 1.60 | −2.04 ± 0.14 | −2.65 ± 0.21 |
| VCAM1 | −1.27 ± 0.20 | 1.08 ± 0.05 | 4.24 ± 1.56 | 1.17 ± 0.06 | 2.94 ± 0.87 | 1.15 ± 0.05 | −1.77 ± 0.15 | −1.26 ± 0.04 | −1.10 ± 0.24 | −1.12 ± 0.04 |
| Energy (MeV/n) a | LET (keV/µm) | Penetration Depth (µm) | Accelerator | ||
|---|---|---|---|---|---|
| Ion Species | Beam | on Target b | in H2O | ||
| Carbon (12C) | 400.0 | 400.0 | 10.0 | 272,900 | HIMAC |
| Carbon (13C) | 75.0 | 71.4 | 34.2 | 15,120 | GANIL |
| Silicon (28Si) | 490.0 | 490.0 | 55.0 | 161,300 | HIMAC |
| Titanium (48Ti) | 1000.0 | 996.9 | 107.7 | 319,900 | GSI |
| Nickel (58Ni) | 1000.0 | 996.9 | 174.5 | 263,600 | GSI |
| Argon (36Ar) | 95.0 | 83.8 | 271.5 | 6336 | GANIL |
| Gene Symbol | REF SEQ ACC. # | Amplicon Size | Melting Temperature |
|---|---|---|---|
| RELA | NM_021975.3 | 65 bp | 80.0 °C |
| HPRT1 | NM_000194.2 | 89 bp | 76.5 °C |
© 2018 by the authors. Licensee MDPI, Basel, Switzerland. This article is an open access article distributed under the terms and conditions of the Creative Commons Attribution (CC BY) license (http://creativecommons.org/licenses/by/4.0/).
Share and Cite
Hellweg, C.E.; Spitta, L.F.; Koch, K.; Chishti, A.A.; Henschenmacher, B.; Diegeler, S.; Konda, B.; Feles, S.; Schmitz, C.; Berger, T.; et al. The Role of the Nuclear Factor κB Pathway in the Cellular Response to Low and High Linear Energy Transfer Radiation. Int. J. Mol. Sci. 2018, 19, 2220. https://doi.org/10.3390/ijms19082220
Hellweg CE, Spitta LF, Koch K, Chishti AA, Henschenmacher B, Diegeler S, Konda B, Feles S, Schmitz C, Berger T, et al. The Role of the Nuclear Factor κB Pathway in the Cellular Response to Low and High Linear Energy Transfer Radiation. International Journal of Molecular Sciences. 2018; 19(8):2220. https://doi.org/10.3390/ijms19082220
Chicago/Turabian StyleHellweg, Christine E., Luis F. Spitta, Kristina Koch, Arif A. Chishti, Bernd Henschenmacher, Sebastian Diegeler, Bikash Konda, Sebastian Feles, Claudia Schmitz, Thomas Berger, and et al. 2018. "The Role of the Nuclear Factor κB Pathway in the Cellular Response to Low and High Linear Energy Transfer Radiation" International Journal of Molecular Sciences 19, no. 8: 2220. https://doi.org/10.3390/ijms19082220
APA StyleHellweg, C. E., Spitta, L. F., Koch, K., Chishti, A. A., Henschenmacher, B., Diegeler, S., Konda, B., Feles, S., Schmitz, C., Berger, T., & Baumstark-Khan, C. (2018). The Role of the Nuclear Factor κB Pathway in the Cellular Response to Low and High Linear Energy Transfer Radiation. International Journal of Molecular Sciences, 19(8), 2220. https://doi.org/10.3390/ijms19082220