Article

Design of a Seed-Specific Chimeric Promoter with a Modified Expression Profile to Improve Seed Oil Content

Department of Biology, Shizuoka University, 836 Ohya Suruga-ku, Shizuoka 422-8529, Japan
*
Author to whom correspondence should be addressed.
Int. J. Mol. Sci. 2018, 19(6), 1667; https://doi.org/10.3390/ijms19061667
Submission received: 12 May 2018 / Revised: 29 May 2018 / Accepted: 2 June 2018 / Published: 5 June 2018
(This article belongs to the Section Molecular Plant Sciences)

Abstract

:
Increasing the yield of plant oil is an important objective to meet the demand for sustainable resources and energy. Some attempts to enhance the expression of genes involved in oil synthesis in seeds have succeeded in increasing oil content. In many cases, the promoters of seed-storage protein genes have been used as seed-specific promoters. However, conventional promoters are developmentally regulated and their expression periods are limited. We constructed a chimeric promoter that starts to express in the early stage of seed development, and high-level expression is retained until the later stage by connecting the promoters of the biotin carboxyl carrier protein 2 (BCCP2) gene encoding the BCCP2 subunit of acetyl-CoA carboxylase and the fatty acid elongase 1 (FAE1) gene from Arabidopsis. The constructed promoter was ligated upstream of the TAG1 gene encoding diacylglycerol acyltransferase 1 and introduced into Arabidopsis. Seeds from transgenic plants carrying AtTAG1 under the control of the chimeric promoter showed increased oil content (up by 18–73%) compared with wild-type seeds. The novel expression profile of the chimeric promoter showed that this could be a promising strategy to manipulate the content of seed-storage oils and other compounds.

1. Introduction

Many plants accumulate storage reserves such as oil, carbohydrate and protein in seeds, and these reserves are important not only for growth of juvenile seedlings but also for human nutrition and as a source of chemicals for industry. Among these storage reserves, the demand for vegetable oils as fuels and chemical resources has increased because there is a need to increase the use of sustainable energy and chemical resources. However, the yield of plant oil is not enough to meet this demand. Therefore, there is an urgent need to improve the yield of oil crops.
The relative proportions of oil, carbohydrate and protein vary depending on the plant species. The accumulation of each class of storage component requires the coordination of many genes that encode the enzymes in the respective pathways [1,2]. Therefore, it is important to reveal the regulation of these genes involved in the metabolism of these storage components to understand how the carbon resources in seeds are allocated to each storage component.
During early embryogenesis, carbon and other nutrients are used mainly for rapid cell division and embryo growth. After cell division ceases, during the maturation phase, the resources are allocated to synthesize storage compounds. In Arabidopsis, starch accumulates transiently in the early stage of the maturation phase, followed by a major increase in oil and protein contents. The transiently accumulated starch disappears later and presumably is used as a carbon source for fatty acid and protein synthesis. During the subsequent late maturation and desiccation phases, the overall biosynthetic activity decreases as the seed prepares for dormancy [3].
The temporal patterns of gene expression reflect the accumulation of storage compounds. In the early stage of Arabidopsis seed development, transcripts for starch synthesis are increased transiently and then reduced to low levels by 8–10 days after flowering (DAF). On the other hand, transcripts for fatty acid synthesis increase gradually from the early stage to maximum level at 10–12 DAF and then start to decrease before those for storage protein synthesis. Transcripts for protein synthesis start to increase at ~8 DAF, and high transcript levels are retained at 13 DAF [4]. Because carbon resources are limited in developing seeds, there is probably competition for these between fatty acid synthesis and protein synthesis.
Seed storage oils are synthesized in the form of triacylglycerol (TAG). In plants, TAG synthesis occurs in different subcellular compartments. Fatty acids are synthesized in plastids and then exported to the cytosol and activated to form acyl-CoA, which serves as the substrate for the esterification of glycerol-3-phosphate at the endoplasmic reticulum to form glycerolipids. The expression of TAG synthesis genes can be characterized by two main expression patterns in Arabidopsis [4]. The expression of many genes for fatty acid synthesis followed a bell-shaped pattern that increased during early developmental stages, peaked between eight and 12 DAF, and then decreased as mentioned previously. The first committed step of fatty acid synthesis is catalyzed by acetyl-CoA carboxylase (ACCase). Most plants, except for Gramineae, have a heteromeric form of ACCase in plastids, and the expression of genes for subunits of the heteromeric ACCase, such as biotin carboxyl carrier protein 1 (BCCP1), BCCP2 and biotin carboxylase, shows a bell-shaped pattern during seed development. On the other hand, the expression patterns of genes for enzymes that function outside of the plastids and are involved in the modification of fatty acids, such as FAD3 encoding linoleate desaturase and FAE1 encoding fatty acid elongase 1, show a different profile. Their expression starts to increase at ~8 DAF with maximum expression later in development, and a high level of expression is retained at 13 DAF. Recent research revealed that many of the genes for fatty acid synthesis are regulated by the transcription factor WRINKLED 1 (WRI1) [5,6].
To date, there have been several trials to manipulate plant oil content and composition [7,8]. In order to increase oil content in seeds, genes for enzymes involved in oil synthesis, such as cytosolic acetyl-CoA carboxylase (homomeric ACCase), lysophosphatidic acid acyltransferase and diacylglycerol acyltransferase 1 (DGAT1), have been overexpressed in seeds and have succeeded in enhancing seed oil content [9,10,11,12]. Several genes have also been manipulated simultaneously to further increase seed oil content [13,14,15].
In this article, we tried to construct a suitable promoter to express genes involved in oil synthesis to increase seed oil content. We suspect that the bell-shaped expression pattern of genes for fatty acid synthesis is one of the limiting factors for oil content in seeds, because the expression of genes for protein synthesis continued to increase after that of fatty acid synthesis genes was reduced. Therefore, we constructed a promoter that started to express at an early stage of seed development, and high-level expression was kept for later in development by connecting the promoters of the AtBCCP2 gene encoding the BCCP2 subunit of acetyl-CoA carboxylase (ACCase) and the AtFAE1 gene. The constructed promoter was ligated upstream of the AtTAG1 gene encoding DGAT1 and introduced into Arabidopsis. Seeds from the transgenic plants carrying the AtTAG1 gene under the control of the chimeric promoter showed higher oil content (up by 18–73%) compared with that of the wild-type (WT).

2. Results

2.1. Construction of the Chimeric Promoter

Previously, our research showed that the 5′-untranslated region (UTR) and 273-bp-upstream sequence from the transcriptional start site (TSS) was enough for AtBCCP2 gene expression in seeds [16]. The 5′-UTR contains two WRI1 binding sites (AW box) and was strongly induced by WRI1 [17]. The AtBCCP2 gene shows seed-specific expression, and the expression starts from the early stage of seed development, peaks at 10–12 DAF, and then decreases [18]. The FAE1 promoter has been used as a seed-specific promoter. The 1-kb-upstream region from the translation initiation site (TIS) is sufficient for AtFAE1 expression [19]. Its expression starts to increase slightly later than that of the AtBCCP2 gene, at ~8 DAF, increases during seed maturation, and decreases after maturation [4,16].
To construct a promoter that was expressed from the early stage of seed development to the later stage of seed maturation, we made a chimeric promoter that contained the regulatory regions of both AtBCCP2 and AtFAE1. Because previous data indicated that the WRI1 binding sequence should be close to the transcription start site [16], the 1.2-kb-upstream region from the TIS of AtFAE1 was ligated to the 5′ site of the AtBCCP2 gene. Because the fragment of FAE1 promoter contains the core promoter and the 5′-UTR of the AtBCCP2 gene contains two AW boxes, the upstream region from the TSS of AtBCCP2 gene was not used for construction of the chimeric promoter. We named the promoter as seed-specific chimeric (SSC) promoter (Figure 1a).

2.2. The Chimeric Promoter Shows Prolonged and Enhanced Activity during Seed Development

In order to examine the promoter activity, we constructed a reporter vector containing the β-glucuronidase (GUS) gene ligated downstream of the SSC promoter (Figure 1a). The SSC promoter (SSCpro):GUS gene was introduced into Arabidopsis and we obtained several transgenic plants. We stained the developing seeds at 4, 6, 8, 10, 12, 14, 16, 18 and 20 DAF. GUS staining was observed from 4 to 20 DAF, and the strongest staining was observed from 8 to 12 DAF (Figure 1b). To compare the promoter activity, we also made transgenic plants containing the 500-bp-upstream sequence from the TIS of the AtBCCP2 gene fused with the GUS gene (BCCP2pro:GUS) and a 1.2-kb-upstream sequence from the TIS of the AtFAE1 gene fused with GUS gene (FAE1pro:GUS), and stained the developing seeds from these transgenic plants (Figure 1). The staining patterns indicated that the period of the expression of the SSC promoter was the sum of those of the BCCP2 and FAE1 promoters (Figure 1b).
To estimate the strength of the promoter, we measured the GUS activity of the transgenic plants. The GUS activities in seeds at 8, 12 and 16 DAF from SSCpro:GUS, BCCP2pro:GUS and FAE1pro:GUS plants were measured. The GUS activity of seeds from the SSCpro:GUS plants was higher than each activity of BCCP2pro:GUS and FAE1pro:GUS plants, and appeared to be the sum of each activity (Figure 2). The results showed that the SSC promoter was strongly expressed over the long term for seed development.

2.3. Oil Accumulation in Plants Containing SSCpro:TAG1

Next, we tried to increase oil content using the SSC promoter. Because TAG1 encoding DGAT1 is one of the good candidates to express in seeds to increase oil content [11,12], we used the AtTAG1 gene first. The AtTAG1 gene was ligated to the SSC promoter and introduced into Arabidopsis. For comparison, we also made transgenic plants carrying FAE1pro:TAG1. The oil content of mature seeds from 11 independent transgenic plants was measured.
The oil content in both transgenic plants varied depending on the lines (Figure 3). In both transgenic plants, at least five plants contained significantly increased levels of oil compared with the WT (SSCpro:TAG1 plants #1, #3, #7, #9 and #14, and FAE1pro:TAG1 plants #2, #14, #15, #22 and #24). Although oil accumulated to similar levels in both SSCpro:TAG1 and FAE1pro:TAG1, SSCpro:TAG1 #7 accumulated much higher levels of oil (72% increase compared with WT). The highest oil content among FAE1pro:TAG1 plants (#22) was increased by 37% compared with WT.
The average weights of 100 seeds from all of SSCpro:TAG1 were heavier than that of WT (Figure 4). Therefore, oil contents per seed in plants carrying SSCpro:TAG1 were higher than WT, while some FAE1pro:TAG1 plants (#7, #18 and #19) showed lower oil contents than WT (Figure S1). The TAG content of SSCpro:TAG1 #7 per seed was doubled, and that of FAE1pro:TAG1 #22 (the highest oil content among FAE1pro:TAG1 plants) was increased by 56% compared with WT.
The seed size of transgenic seeds that contained the three highest amounts of oil (SSCpro:TAG1 plants #1, #7 and #14, and FAE1pro:TAG1 plants #2, #14 and #22) was measured. All of these seeds were significantly larger than WT seeds (Figure 5).
The fatty acid composition in seeds form SSCpro:TAG1 and FAE1pro:TAG1 plants was analyzed. There was no notable difference in fatty acid composition in both SSCpro:TAG1 and FAE1pro:TAG1 plants compared with the WT. Figure 6 shows a representative example of the fatty acid composition of SSCpro:TAG1 #7 and FAE1pro:TAG1 #22, which accumulated the highest amounts of oil in each transgenic line.

2.4. TAG1 Gene Expression in Transgenic Plants

We examined the expression level of TAG1 in transgenic plants that accumulated higher levels of oil. SSCpro:TAG1 plants #1, #7 and #14, and FAE1pro:TAG1 plants # 2, #14 and #22, were analyzed. Seeds at 8, 12 and 16 DAF were collected, and expression levels were measured by quantitative reverse transcription–polymerase chain reaction (qRT–PCR). Figure 7 shows the relative expression level of TAG1 in each sample relative to the level of seeds from WT plants at 8 DAF, which was taken as 1. In WT seeds, TAG1 expression was increased in seeds at 12 DAF (1.7-fold higher than seeds at 8 DAF) and then decreased in seeds at 16 DAF to similar levels as in seeds at 8 DAF.
In SSCpro:TAG1 plants, the highest expression was observed in seeds at 8 DAF, from 16 to 26-fold higher than WT seeds, but expression was slightly decreased in seeds at 12 DAF. Although the expression was decreased in seeds at 16 DAF, the expression was still higher than that of WT seeds (relative value from 2.1 to 5.6-fold). On the other hand, FAE1pro:TAG1 plants showed the highest TAG1 expression in seeds at 12 DAF (relative value from 16 to 23-fold). The expression in both seeds at 8 DAF and 16 DAF was also higher than WT seeds (relative value from 4 to 10-fold in seeds at 8 DAF and from 2 to 4-fold in seeds at 16 DAF).
These results indicated that much higher TAG1 expression levels in seeds at 8 DAF in SSCpro:TAG1 plants than FAE1pro:TAG1 plants were not related to the amount of oil accumulation because the oil levels in these transgenic plants except for SSCpro:TAG1 #7 were similar. TAG1 expression levels in seeds at 8 and 12 DAF in SSCpro:TAG1 plant #7, which accumulated the highest level of oil in seeds, was lowest among the three transgenic plants, whereas the expression in seeds at 16 DAF was highest.

3. Discussion

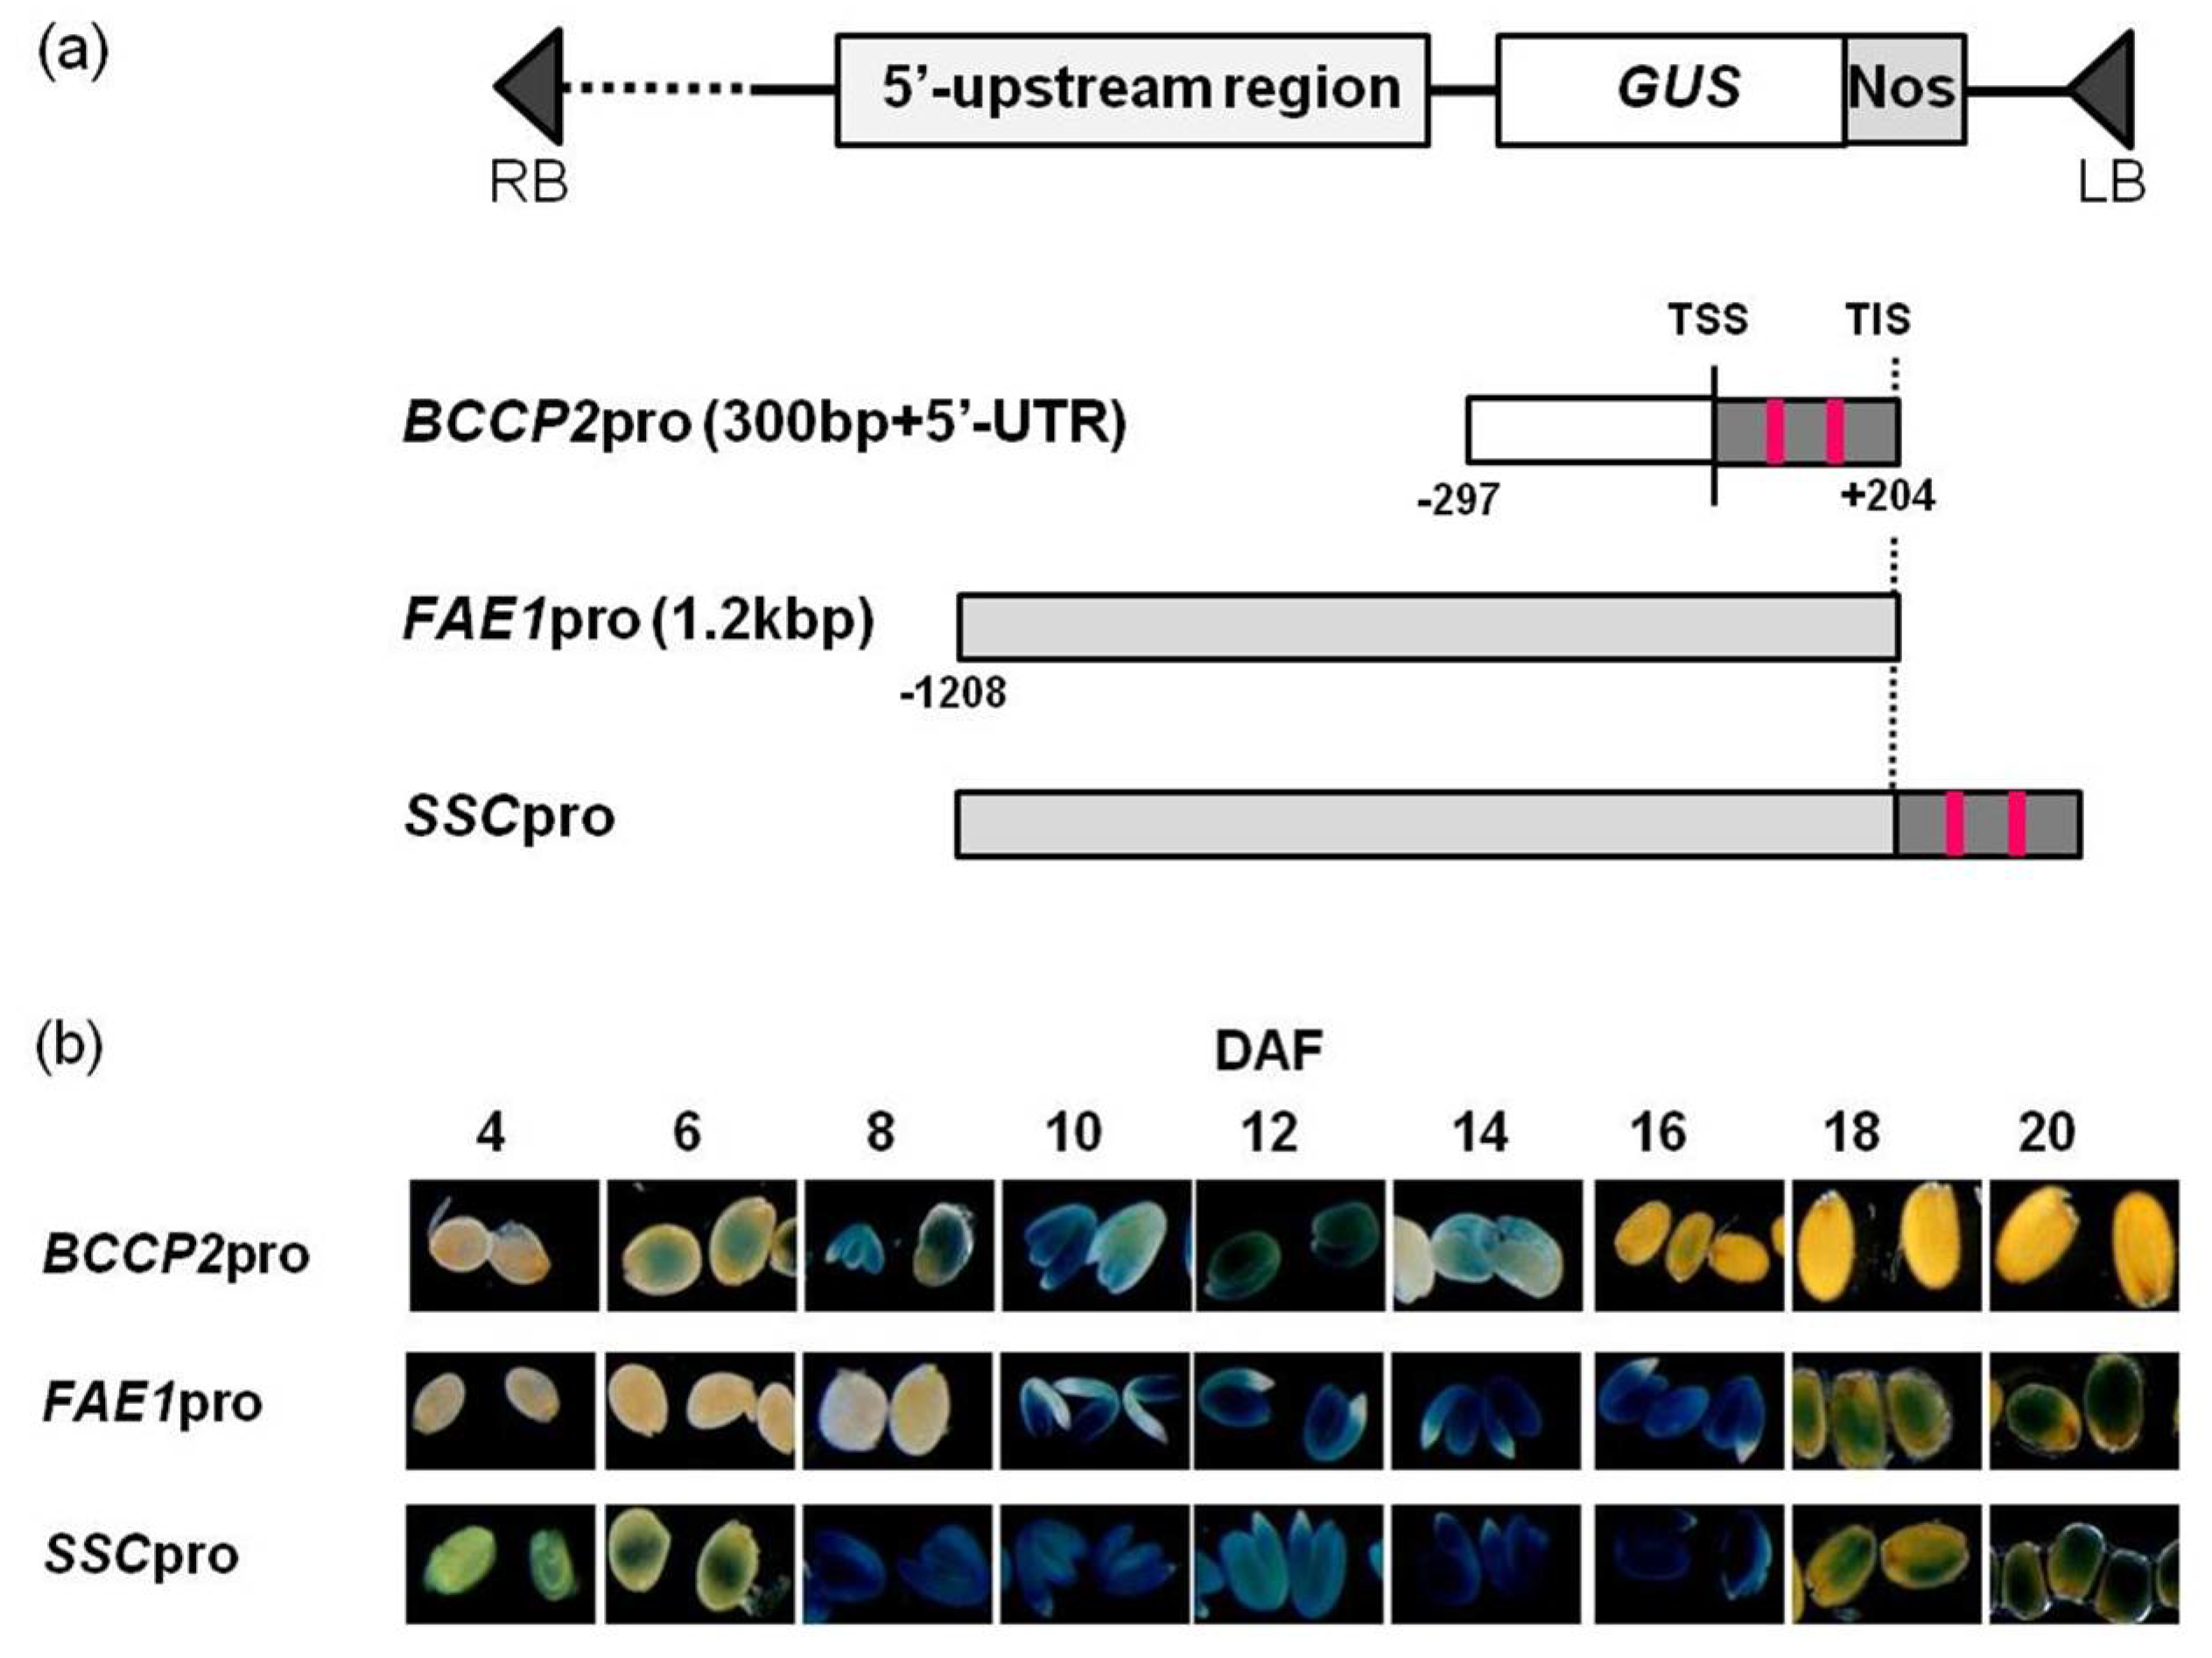
We constructed a chimeric promoter that showed strong activity from early to late stages of seed development by fusing the 5′-UTR of AtBCCP2 to a 1.2 kb region from the TIS of AtFAE1 gene (Figure 1 and Figure 2).
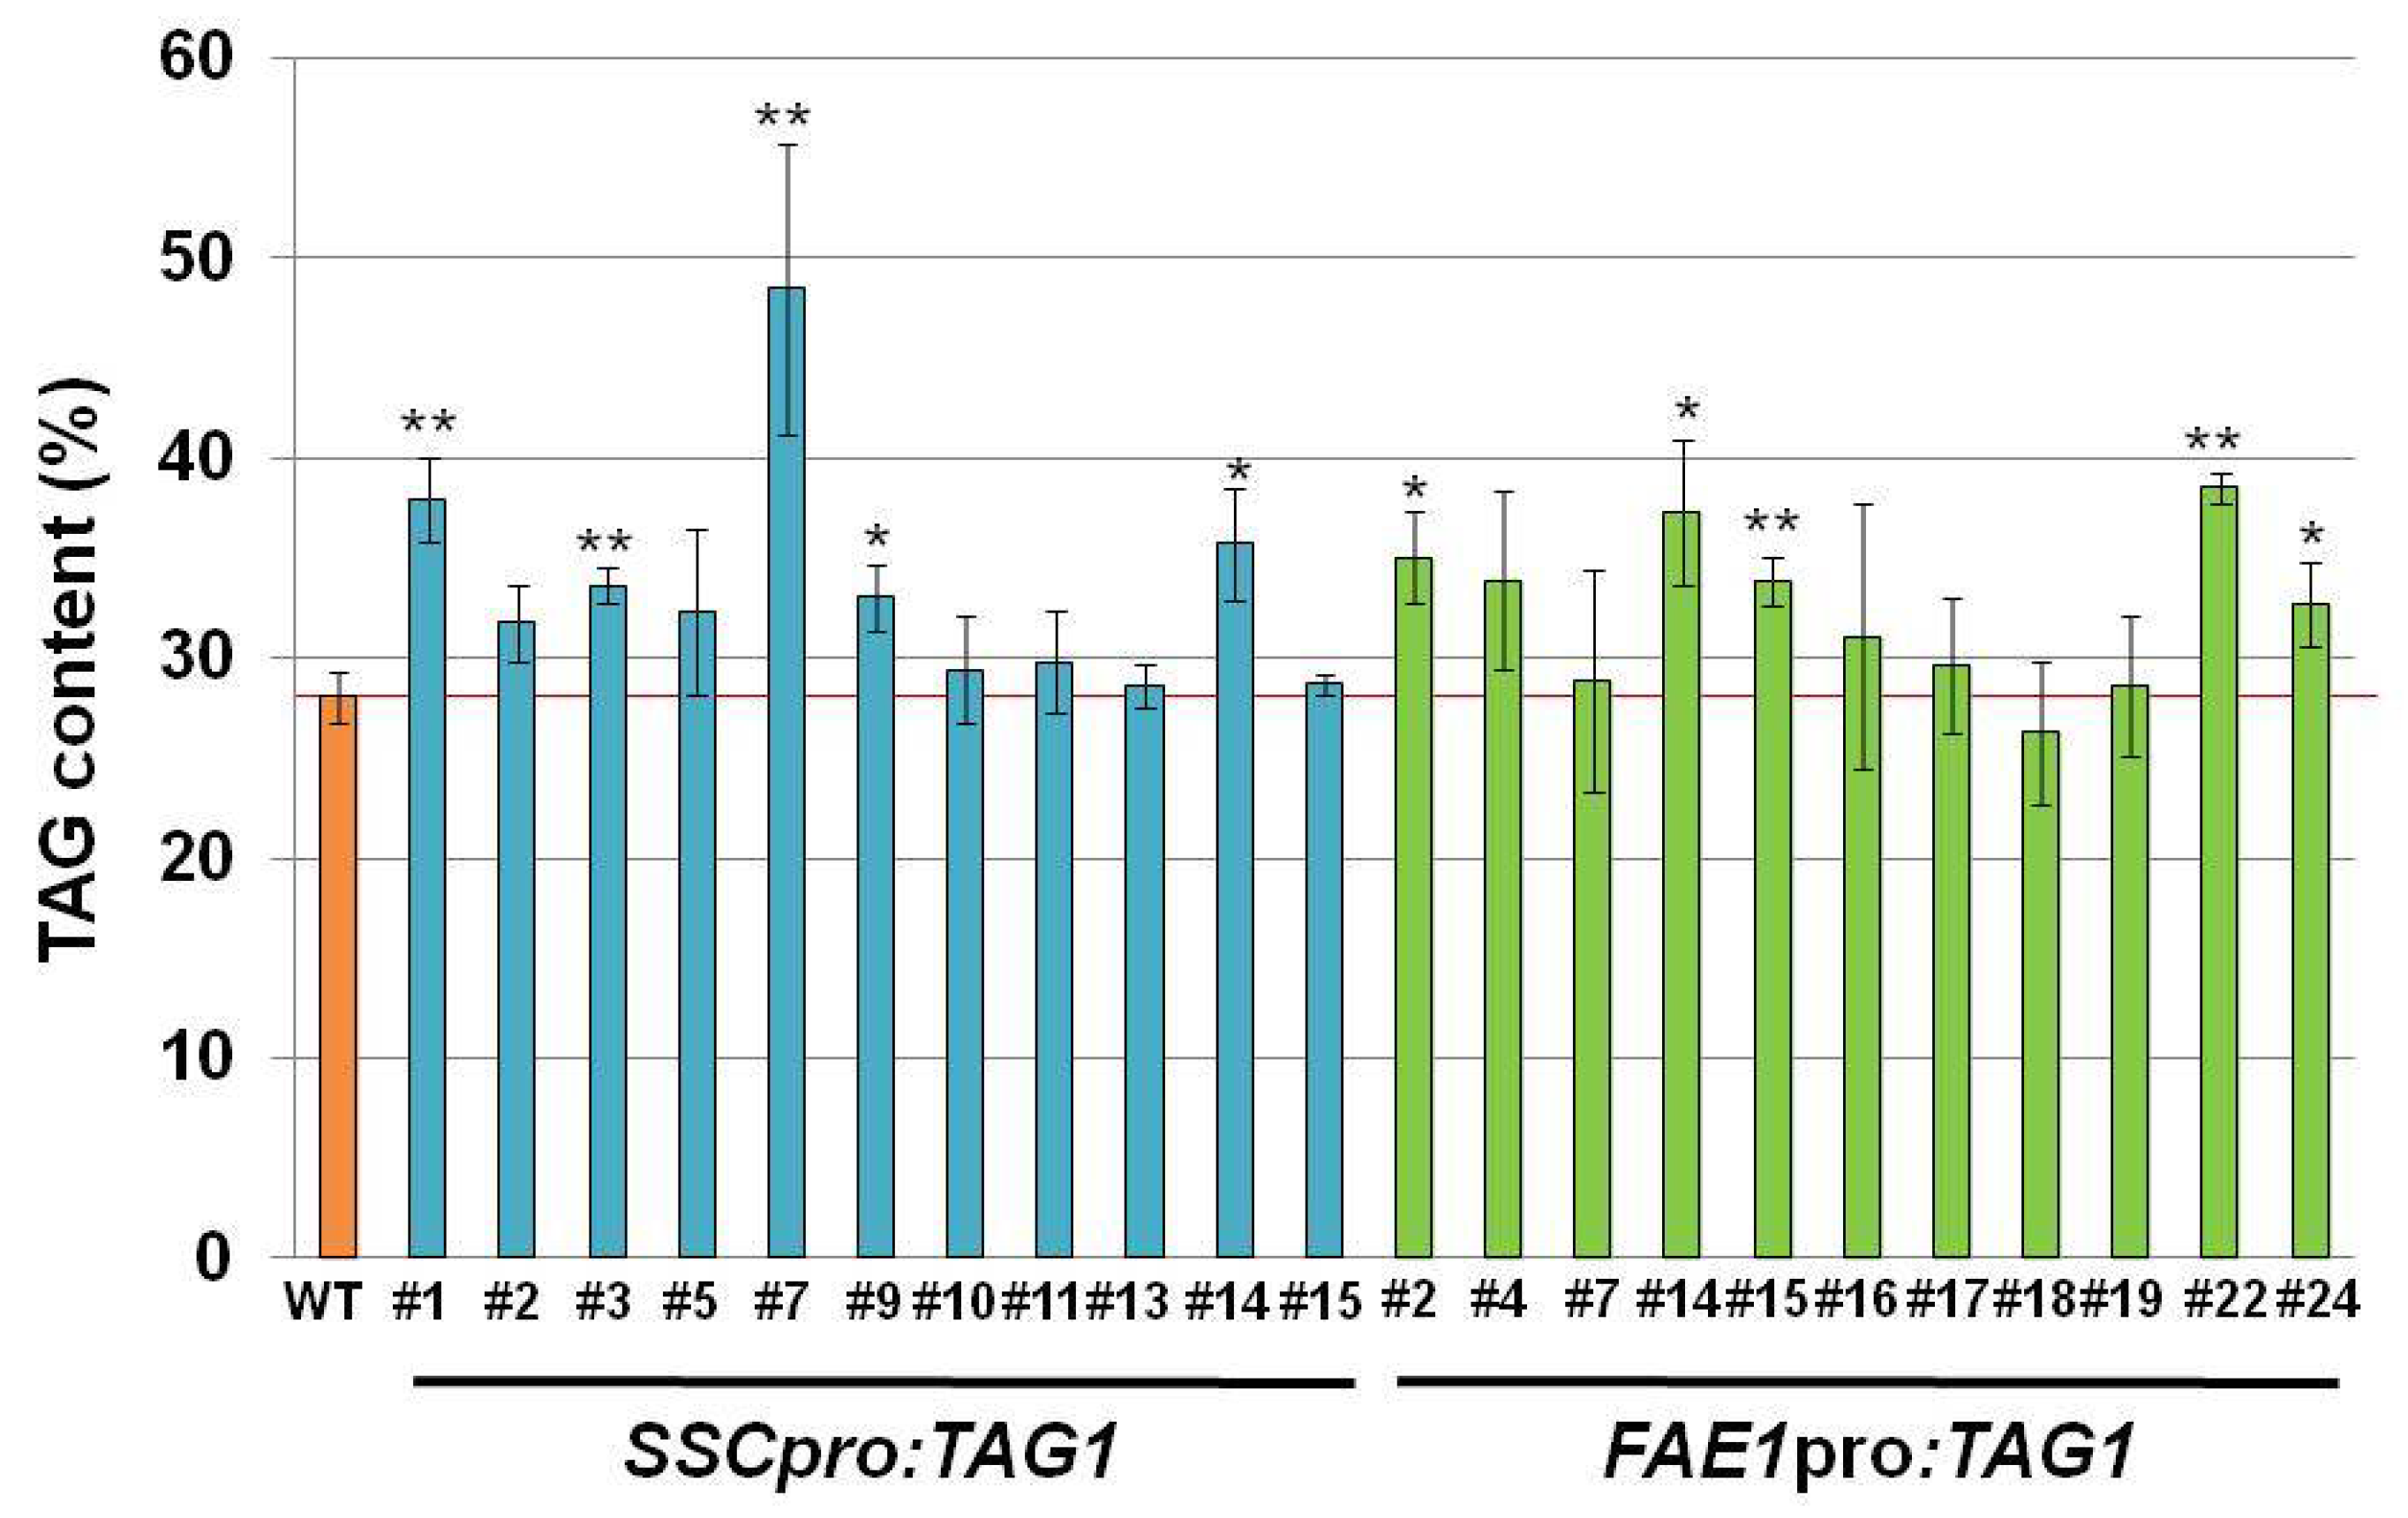
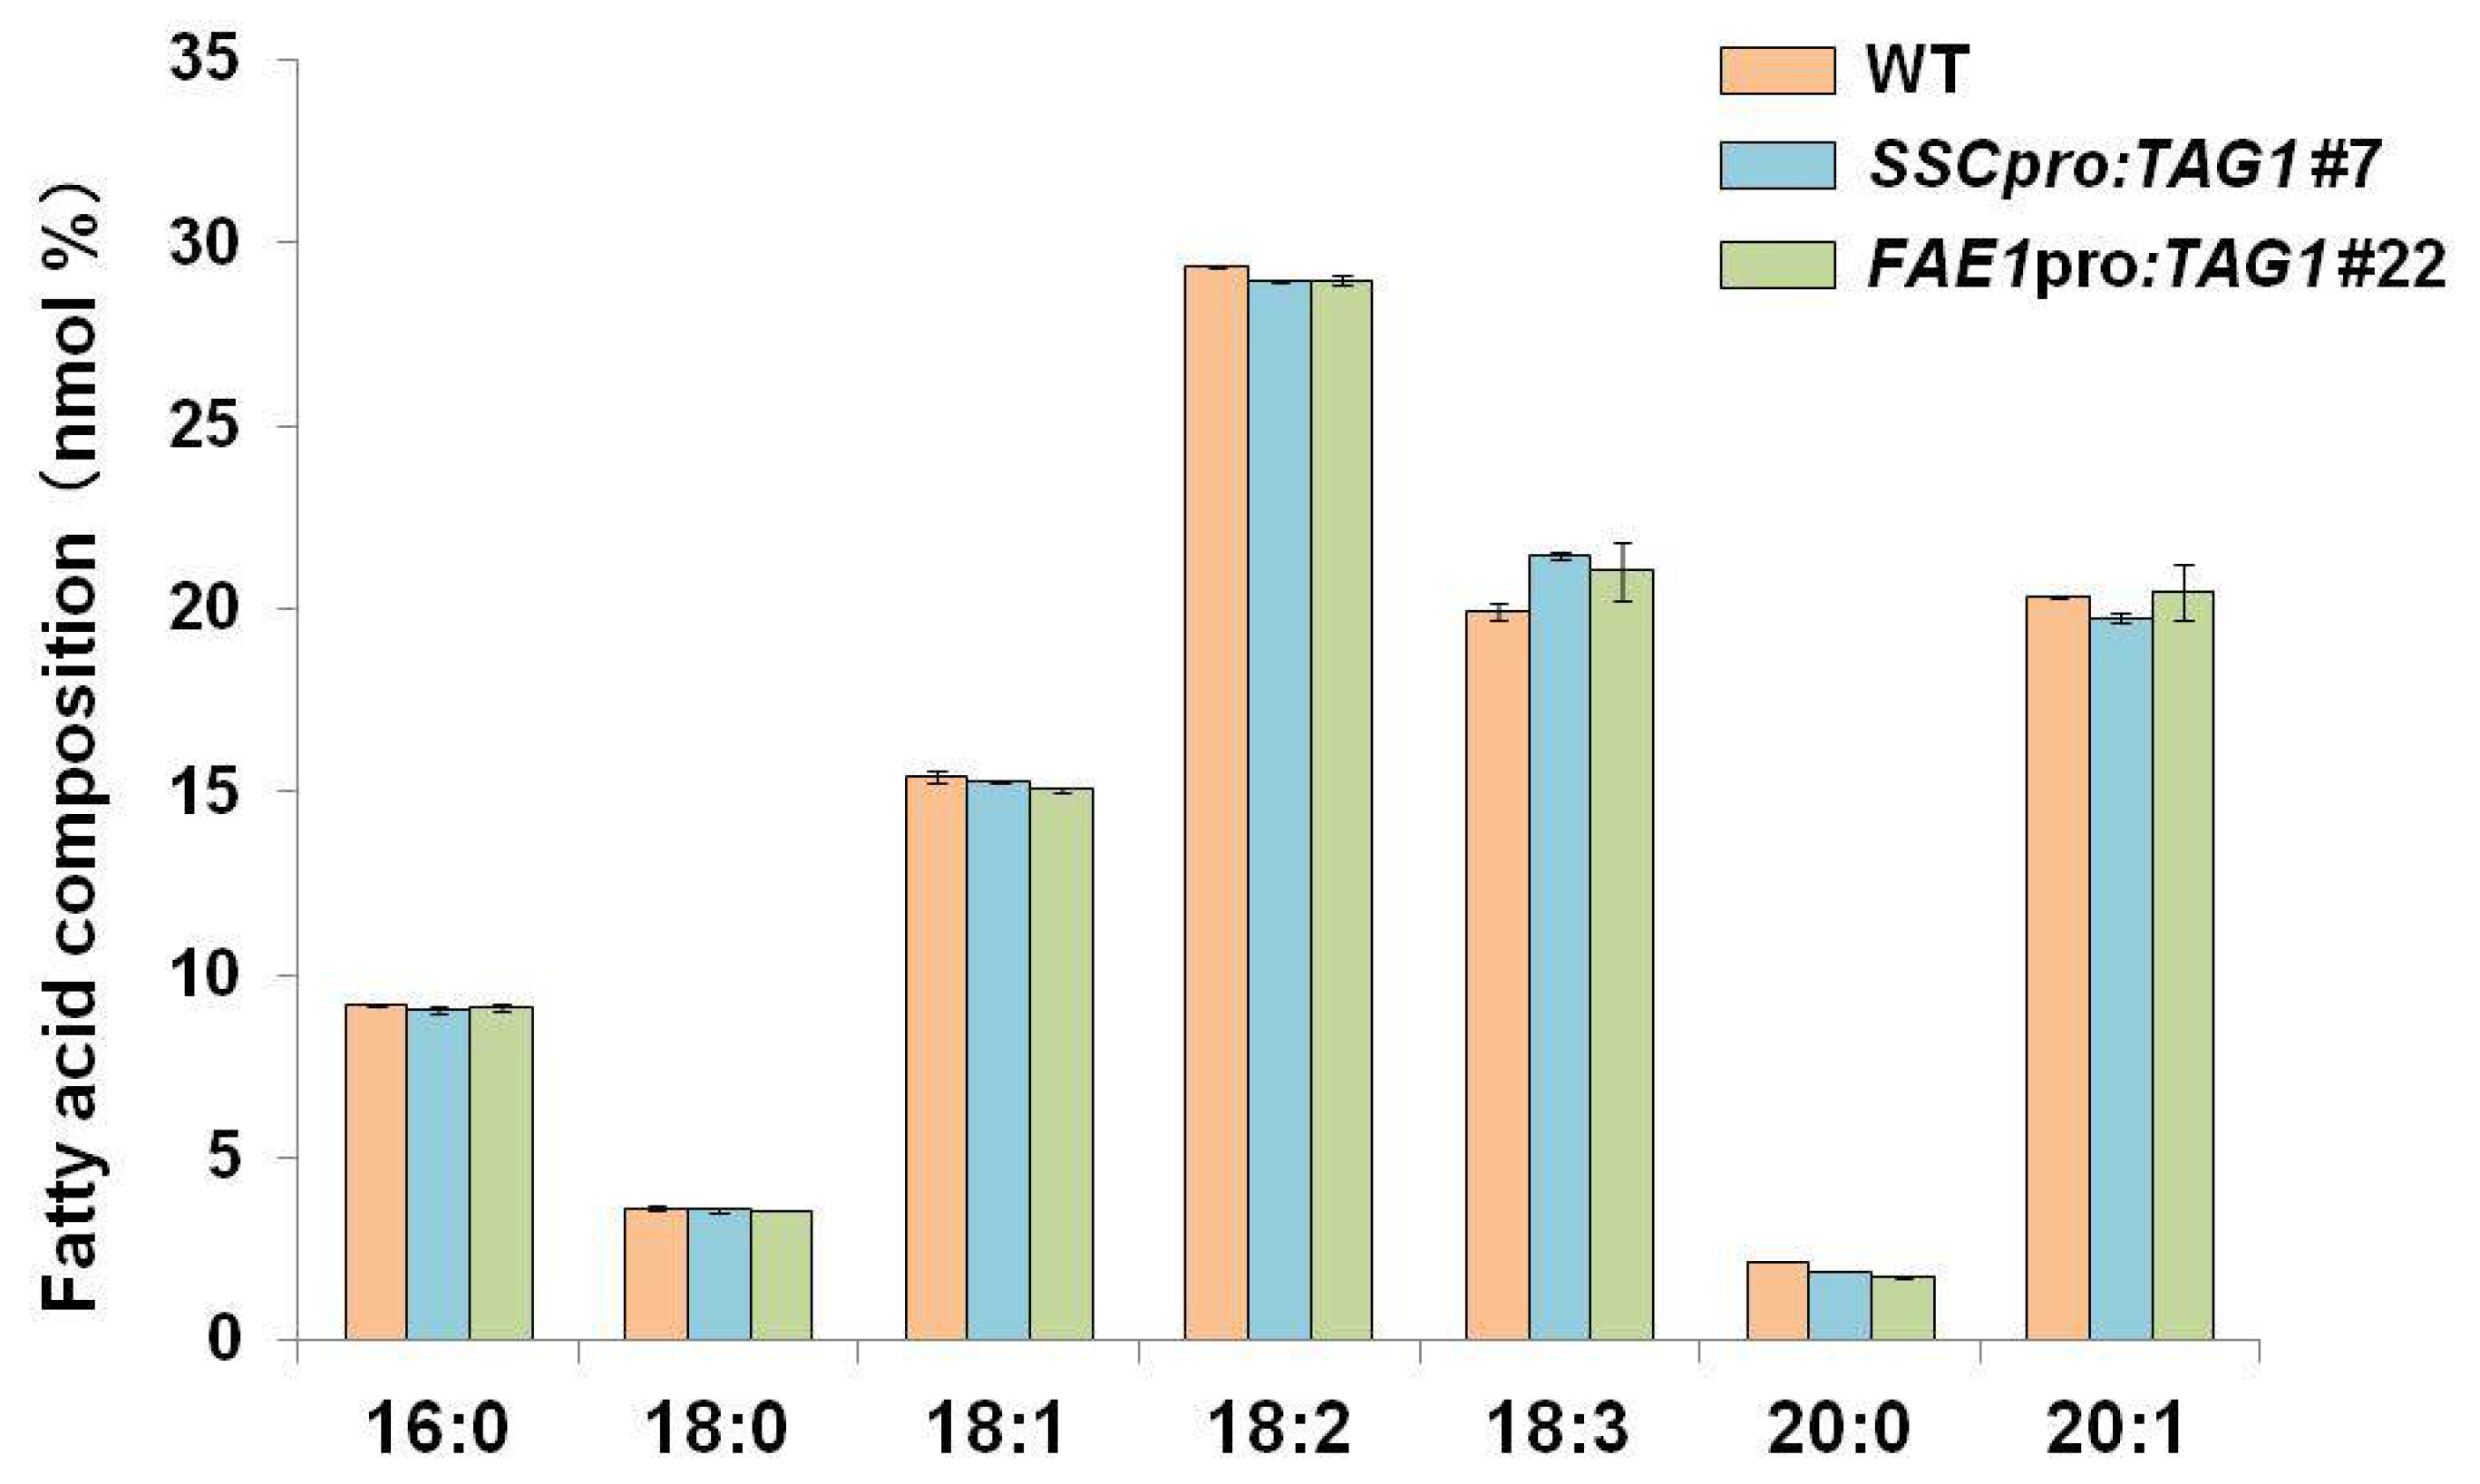
Transgenic plants carrying SSCpro:TAG1 showed increased amounts of storage oil in seeds compared with WT plants. Compared with plants carrying FAE1pro:TAG1, similarly increased levels of seed oil were seen in SSCpro:TAG1 plants (Figure 3). However, one line containing SSCpro:TAG1, #7, accumulated much more oil in seeds than the other transgenic plants (
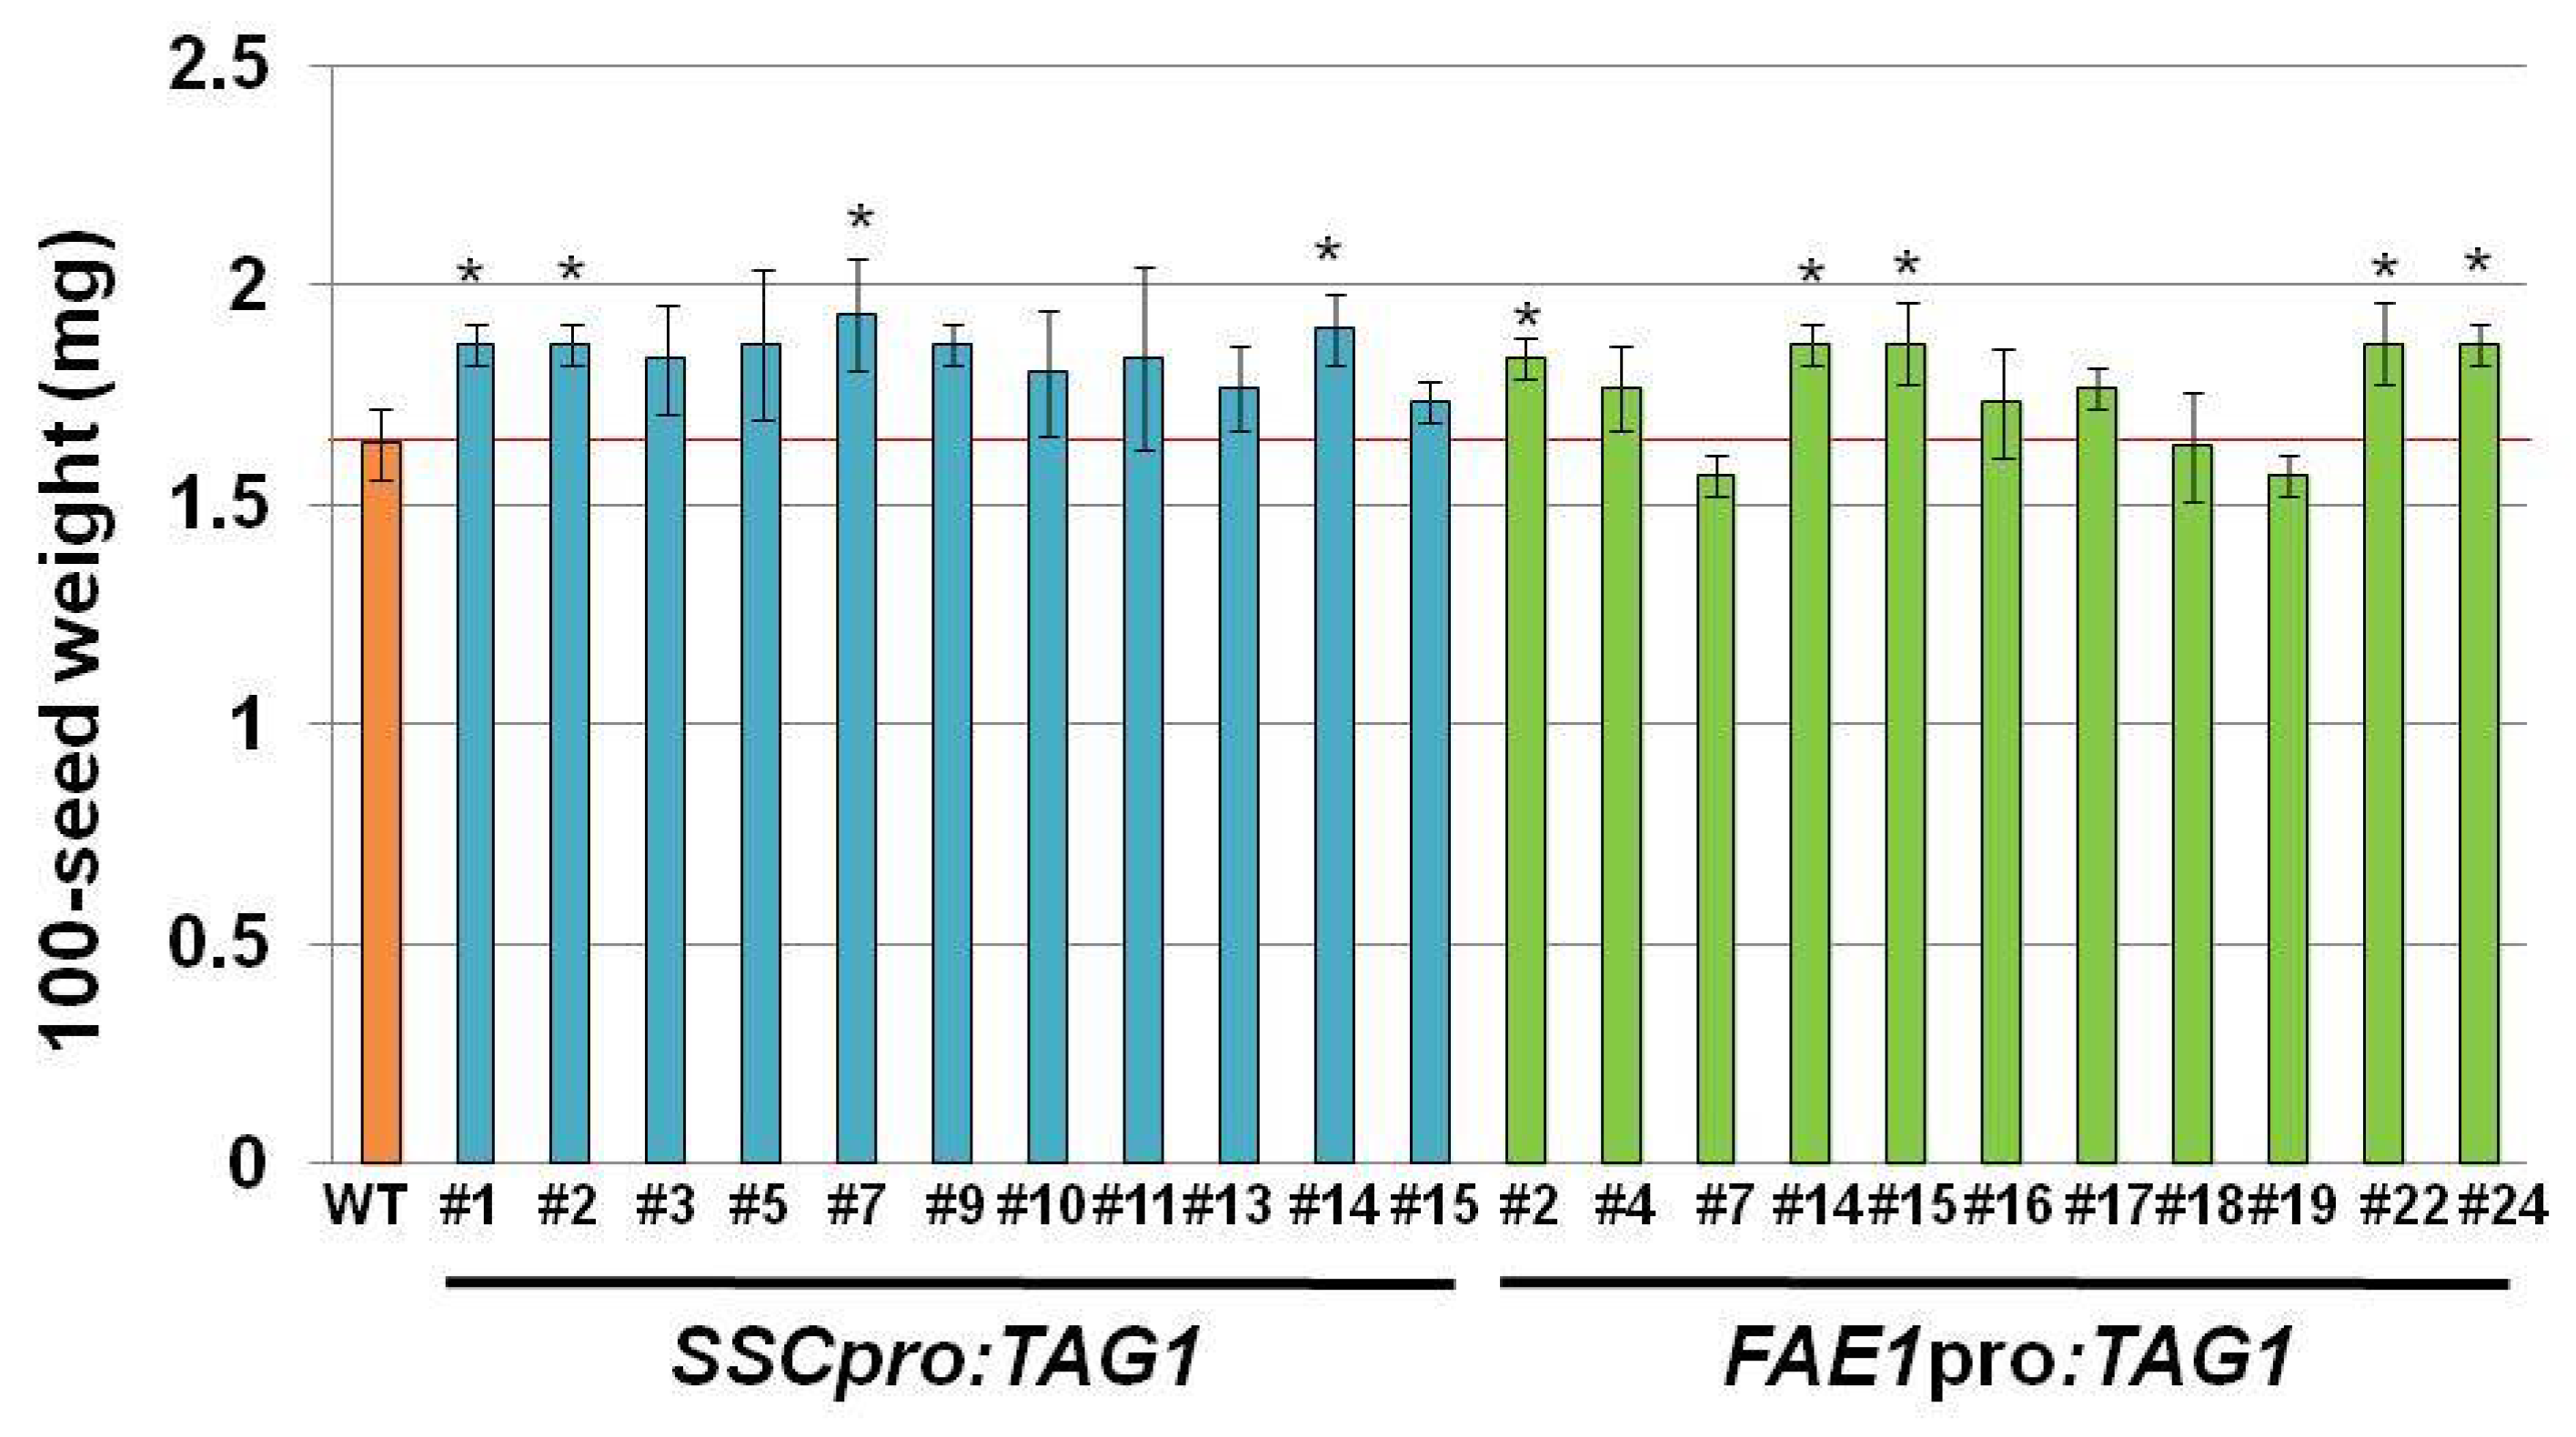
Figure 3). The seed weight and seed size in plant line #7 was also heavier and larger than other seeds. Because we used transgenic plants carrying a single copy transgene, which was confirmed by segregation analysis and quantitative PCR, the effect of copy number on the expression of transgene can be excluded.
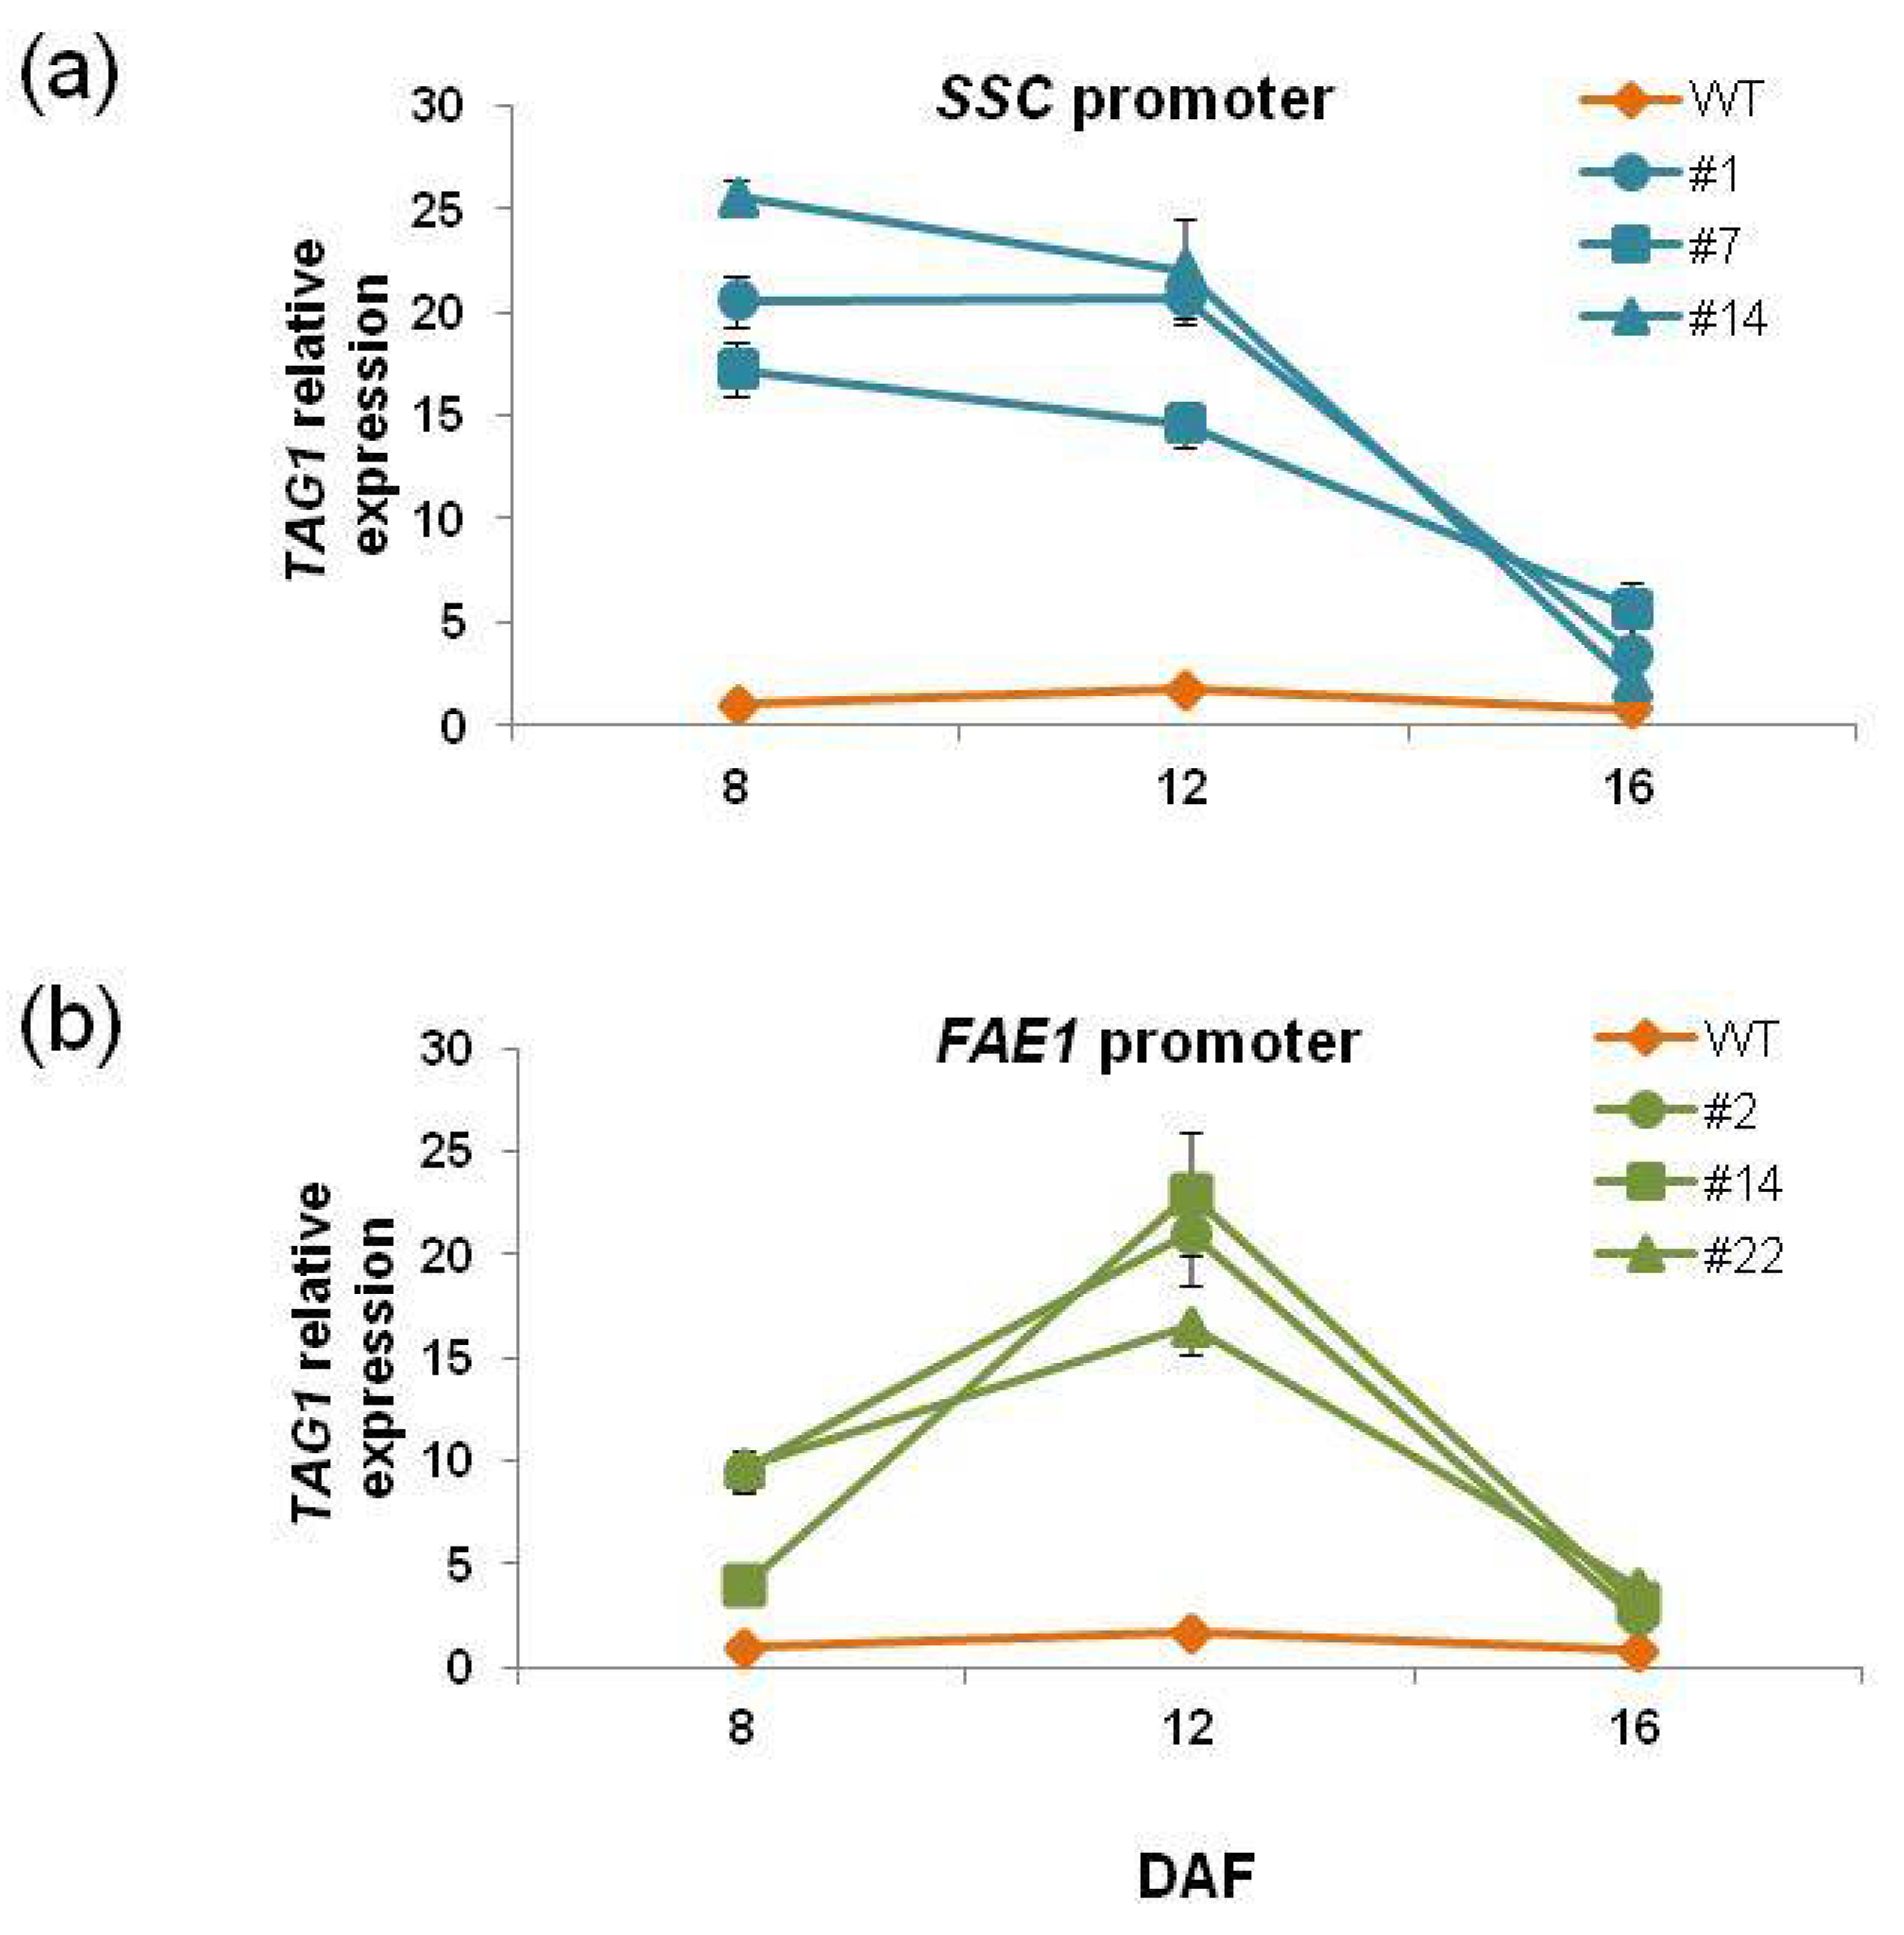
Expression of the TAG1 gene in transgenic plants showed a unique pattern (Figure 7). TAG1 expression in SSCpro:TAG1 plants at 8 DAF was much higher than that of WT plants. The level was slightly decreased at 12 DAF, and then at 16 DAF, the TAG1 expression level was lowest among the timepoints measured. On the other hand, TAG1 expression was highest at 12 DAF in FAE1pro:TAG1 plants.
We could not find a correlation between oil content and TAG1 expression level at 8 DAF and 12 DAF. However, it appeared that there was a correlation between oil content and the expression level at 16 DAF. The SSCpro:TAG1 plant line with highest oil contents (#7) showed the highest expression level of TAG1 at 16 DAF (relative value 5.6 times), and plant line #14, which accumulated the lowest oil content among the three transgenic lines carrying SSCpro:TAG1, showed the lowest expression of TAG1 at 16 DAF (relative value 2.1-fold). Similarly, in plants carrying FAEpro:TAG1, TAG1 expression at 16 DAF showed a correlation with oil content; the TAG1 expression relative value of plant line #22, which had the highest oil content, was 4.0-fold and that in plant line #2, with the lowest oil content, was 2.4-fold. The results indicated that higher expression levels of the TAG1 gene at 16 DAF (late stage of seed development) were important for higher oil content. In this respect, high expression of the TAG1 gene in the early stage in SSCpro:TAG1 plants was not advantageous to accumulate higher content of TAG. However, the chimeric promoter showed high expression in the late stage of seed development, which the FAE1 promoter could not produce (Figure 2 and Figure 7). Therefore, transgenic plants with ideal expression levels of TAG1, such as plant line #7 (Figure 7), which accumulate much more oil than other transgenic plants, could be produced by using the chimeric promoter.
The timing of gene expression is important. Kanai et al. (2015) [15] showed that the AtWRI1 gene under control of the FUSCA3 (FUS3) promoter, which is activated during the middle phase of seed development (peaking at around 8 DAF), enhanced Arabidopsis seed oil content much more than that under the control of the 35S promoter or the LEA promoter, which is activated in the late phase of seed development (increases from >8 DAF). Previous studies also showed that activation of WRI1 during the late phase of seed development was not effective in increasing oil content [5,20]. Because fatty acids are essential not only for oil synthesis but also for membrane biogenesis, which is required for embryo development, fatty acid synthesis probably has to be largely activated during the early-to-middle phase of seed development. Moreover, if there is competition between oil synthesis and protein synthesis for carbon resources during seed development, enhancement of fatty acid synthesis should be started before protein synthesis starts to increase. On the other hand, activation of the TAG1 gene in the late phase of seed development successfully increased oil content [11,12]. TAG1 encodes DGAT1, which catalyzes the last step of TAG synthesis and is originally expressed in the later stage of seed development in Arabidopsis [21]. Therefore, later expression is probably more effective for the TAG1 gene to enhance oil production.
In this study, we succeeded in increasing seed oil content using a constructed chimeric promoter. However, expressing genes for enzymes or transcription factors involved in fatty acid synthesis, such as genes for WRI1 or homomeric ACCase (cytosolic ACCase or ACCase from Garmineae), which play a pivotal role in fatty acid synthesis, can take advantage of the properties of the SCC promoter fully because high expression of these genes in the early stage of seed development is required for high accumulation of TAG.
Because the promoter contains the WRI1 binding site and the FAE1 promoter, which is reported to be regulated by B3 domain factors, LEAFY COTYKEDON 2 and FUS3, through the RY motif [22], we can use the chimeric promoter in other plants that have similar transcriptional regulation of seed development to Arabidopsis. Brassicaceae, including Camelina sativa and Brassica napus, may be good target plants to be manipulated using the chimeric promoter. Expression of target genes in novel expression patterns could be a promising strategy for substance production in seeds or research on seed development.

4. Materials and Methods

4.1. Plant Materials and Growth Conditions

The surfaces of seeds were sterilized in 20% bleach for 15 min, rinsed five times with sterile water, and then plated on half-strength Murashige and Skoog (1/2 MS) medium, pH 5.7, 0.8% agar, and 1% sucrose. The transgenic plants were screened on the 1/2 MS with kanamycin (30 μg mL−1). The seeds from homozygous transgenic and WT plants were placed on 1/2 MS without kanamycin. Plates were first placed at 4 °C for 2 days and then transferred to a growth chamber at 23 °C with a light period of 16 h (65 μmol m2 s−1) and a dark period of 8 h. Seedlings were transferred to soil at 7–10 days after germination.
To collect developmental-stage siliques, colored threads were used to tag flowers on the day of flowering (day 0) when petals just appeared. The siliques that developed from the tagged flowers were collected at specific time points.
For measurement of oil content in seeds, mature seeds were collected from homozygous transgenic T3 plants which were planted at same time and grown under the same condition.

4.2. Construction of Binary Vector and Transformation

Primers used in PCR reactions are described in Table 1. The 5′-UTR fragment of the AtBCCP2 gene was amplified using primers BCCP2XF/BCCP2SlR. The promoter of the AtFAE1 gene was amplified using primers FAEp2kSalF/FAEpSalR. The PCR products were cloned into pCR-Blunt (Invitrogen, Carlsbad, CA, USA). The 5′-UTR fragment of the AtBCCP2 was digested with XhoI and SalI, and the FAE1 promoter was digested with SalI and HindIII whose site is located 1.2 kb upstream of the TIS of the AtFAE1 gene. Each fragment was collected and ligated to the HindIII/SalI site of pBI101 to construct SSCpro:GUS. To construct FAE1pro:TAG1, HindIII/SalI fragment of the FAE1 promoter was ligated to the HindIII/SalI site of pBI101.
In order to increase the restriction sites to insert the TAG1 gene, the GUS gene was replaced by the GFP gene with several restriction sites on both the 3′ and 5′ sites. The GFP gene was amplified using primer set GFPXXHF/GFPHSSR and the amplified fragment was digested with SalI and SacI. The SSCpro:GUS vector was digested with SalI and SacI and the GUS gene was replaced by the GFP fragment (SSCpro:GFP). The TAG1 fragment was amplified using primer set TAG1XbaSmaF/TAG1EcoRVR and digested with XbaI/EcoRV, and was ligated into the XbaI/SmaI sites of the SSCpro:GFP vector to construct SSCpro:TAG1.
Arabidopsis thaliana (ecotype Col-0) was transformed with Agrobacterium tumefaciens (strains GV3101) using the floral dip method [23]. Several transgenic lines were screened on 1/2 MS with kanamycin (30 μg mL−1) and homozygous transformant lines were established from isolated independent transgenic lines. We confirmed the introduced gene by PCR using a primer set TAG1XbaSmaF/TAG1EcoRVR.

4.3. GUS Staining Assay and GUS Fluorometric Assay

Histochemical staining of GUS activity was conducted using transgenic plants as described previously [16]. Fresh tissue was incubated in reaction solution (1 mM X-Gluc, 50 mM sodium phosphate buffer pH 7.0, 1 mM potassium ferricyanide/ferrocyanide mixture, 0.01% Triton X-100, 10 mM 2-mercaptoethanol, 20% methanol, 1 mM EDTA) at 37 °C for 12 h. After staining, the tissue was fixed in a mixture of ethanol:acetic acid at a 6:1 ratio and rinsed with 70% ethanol. Tissues were observed and photographed using a dissecting microscope.
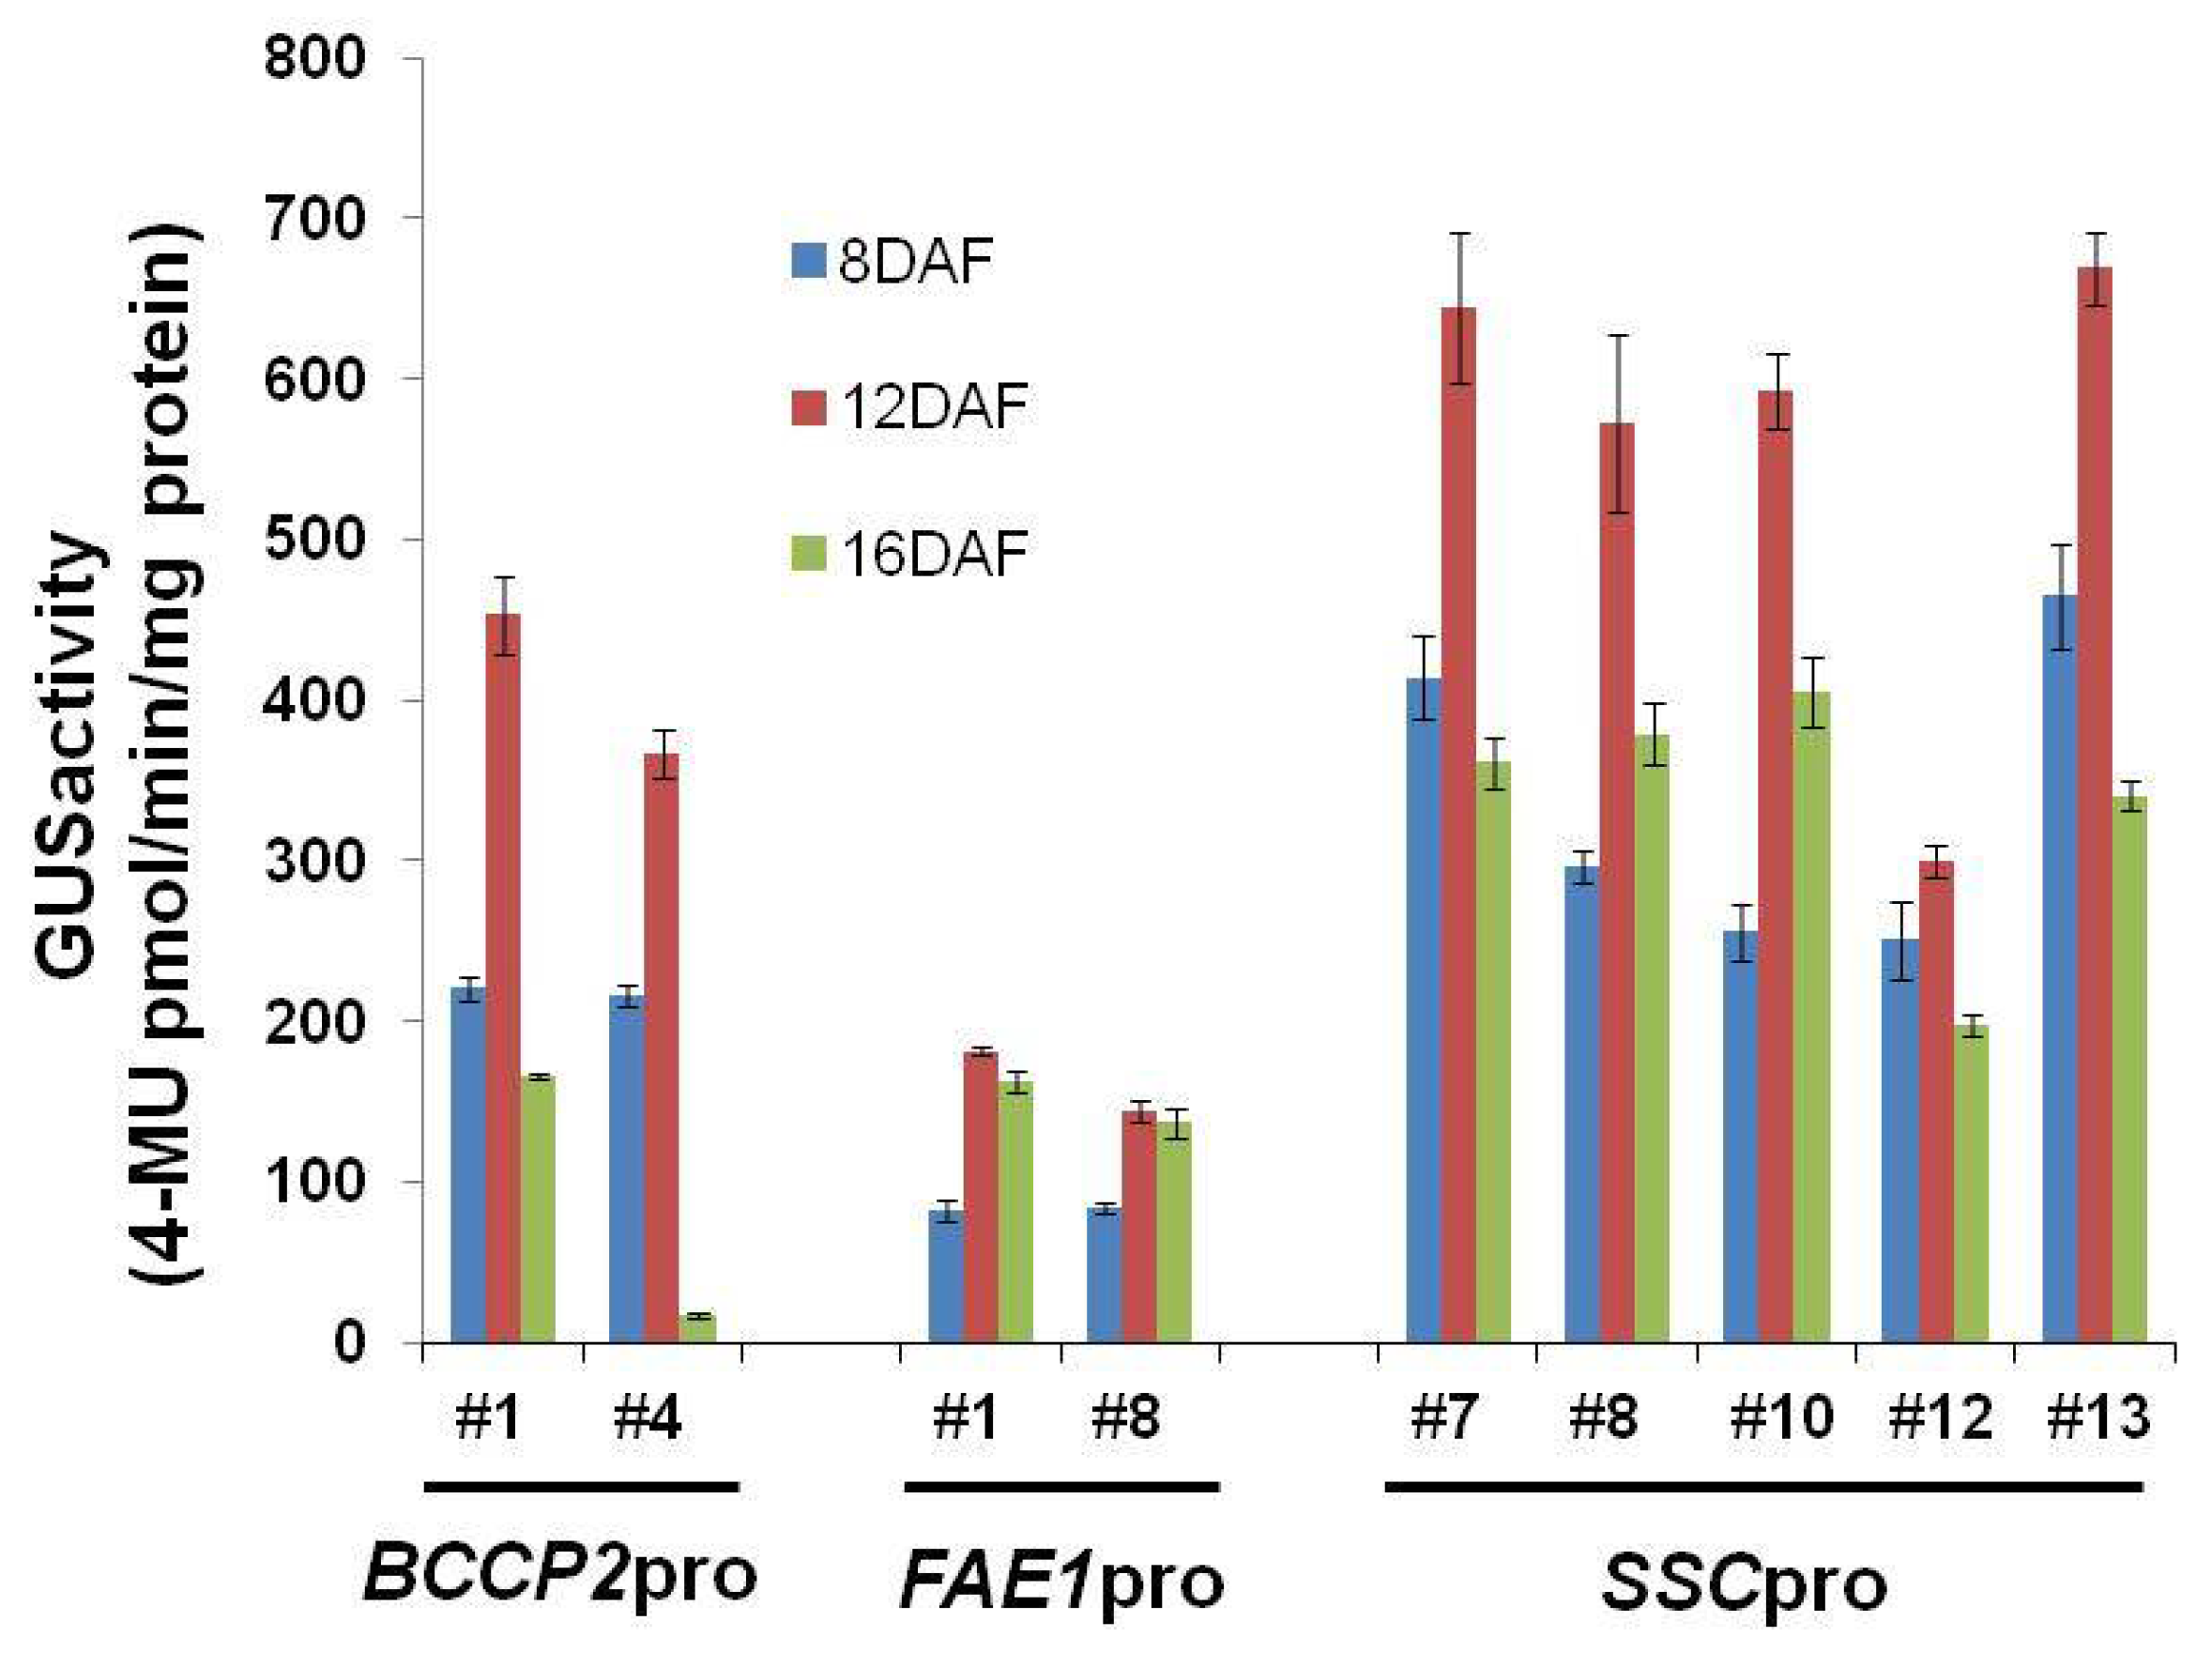
GUS activity in protein extracts was measured using the fluorogenic substrate 4-methylumbelliferyl b-d-glucuronide (MUG) as described previously [16]. Proteins were extracted from seeds at 8, 12, and 16 DAF (more than five independent plants). Total protein extracts were prepared by grinding the tissues in extraction buffer (50 mM sodium phosphate, pH 7.0, 10 mM EDTA, 10 mM β-mercaptoethanol) containing 0.1% (w/v) SDS and 1% Triton X-100, followed by centrifugation at 13,000× g for 10 min. GUS activity in the supernatants was measured in extraction buffer containing 1 mM MUG and 20% methanol. Reactions were stopped by adding 0.2 M Na2CO3, and the amount of 4-methylumbelliferone was calculated by relating relative fluorescence units with those of a standard of known concentration. The protein concentration of extracts was determined using Protein Assay Kits (Bio-Rad, Hercules, CA, USA).

4.4. Measurement of Oil Content

Lipids were extracted in accordance with the Folch method [24] with some modifications.
A total of 10 mg of seeds was ground in a glass tube, and 2 mL of chloroform:methanol (1:1, v/v) was added. After standing at room temperature for 30 min, 1 mL of 0.9% NaCl solution (w/v) was added and mixed by vortexing. The extract was centrifuged at 845× g for 15 min at 4 °C. The lower layer was transferred to a new tube. Again, 1 mL of 0.9% NaCl solution (w/v) was added to the collected extract and mixed by vortexing. The extract was centrifuged at 845× g for 5 min at 4 °C. The same process was repeated once again. Finally, the lower layer was transferred to a glass vial and the extract was dried and dissolved in 100 μL of chloroform. A 20 μL aliquot of lipid sample was spotted onto a silica gel thin-layer chromatography (TLC) plate (Merck Millipore, Darmstadt, Germany) to separate TAG from total lipid. TLC separation was carried out using petroleum ether:diethyl ether:acetic acid (70:30:1). The TAG spot was transferred to a glass tube, and 1 mL of hydrogen chloride methanol solution was added and heated at 80 °C for 30 min. After cooling, 1 mL hexane and 1 mL 0.9% NaCl solution was added and mixed by vortexing. The sample was centrifuged at 845× g for 5 min at 4 °C and 800 μL of supernatant was transferred to a new tube. The collected solution was dried and the collected fatty acid methyl ester was dissolved in 50 μL of hexane. The fatty acid methyl esters were quantified using gas–liquid chromatography (GC2014, Shimadzu, Kyoto, Japan) using a capillary column (BPX-90, SGE Analytical Science, Ringwood, VIC, Australia).

4.5. Expression Analysis

Total RNA was isolated from seeds at 8, 12, and 16 DAF using TriPure (Roche Diagnostics, Mannheim, Germany) and Fruitmate (TAKARA, Ohtsu, Japan). cDNA was synthesized using 0.5 μg of RNA as a template and ReverTra Ace (TOYOBO, Ohsaka, Japan).
Real-time PCR amplification of cDNAs was conducted using a LightCycler 480 (Roche Diagnostics) in a 384-well PCR plate. The reaction was carried out in a 10 μL reaction volume containing 5 μL SYBR Premix Ex Taq II (TAKARA) with 0.2 μM each of the forward and reverse primers and 1 μL cDNA (10-fold dilution). The primer sets used for real-time PCR are shown in Table 1. The primers for amplification of TAG1 were synthesized according to Yang et al. (2011) [25]. Expression levels of ELONGATION FACTOR1 αA4 (EF1αA4) were used for signal normalization of real-time PCR. The EF1αA4 primers were designed by the Universal ProbeLibrary Assay Design Center (Roche Diagnostics). All reactions were performed independently at least five times, and at least three sets of consistent data were used for analyses. Relative gene expression levels were calculated using the 2−ΔΔCT method [26]. To validate the reliability of the data, amplification efficiencies between the target genes and the house-keeping genes of all the real-time PCR reactions were compared, and dissociation curves of all PCR products were examined to ensure the quality of the PCR.

Supplementary Materials

Supplementary materials can be found at https://www.mdpi.com/1422-0067/19/6/1667/s1.

Author Contributions

The design of the study was made by A.K.; Experiments were performed by T.A. and M.K.; A.K. drafted the manuscript. All authors read and approved the final manuscript.

Funding

This work was supported by A-STEP programs of JST.

Acknowledgments

The authors thank Koichiro Awai (Shizuoka University) for supporting the oil analysis.

Conflicts of Interest

The authors declare no conflict of interest.

References

  1. Baud, S.; Boutin, J.-P.; Miquel, M.; Lepiniec, L.; Rochat, C. An integrated overview of seed development in Arabidopsis thaliana ecotype WS. Plant Physiol. Biochem. 2002, 40, 151–160. [Google Scholar] [CrossRef]
  2. Yu, B.; Grubera, M.; Khachatourians, G.G.; Hegedus, D.D.; Hannoufa, A. Gene expression profiling of developing Brassica napus seed in relation to changes in major storage compounds. Plant Sci. 2010, 178, 381–389. [Google Scholar] [CrossRef]
  3. Mansfield, S.G.; Briarty, L.G. Cotyledon cell development in Arabidopsis thaliana during reserve deposition. Can. J. Bot. 1992, 70, 151–164. [Google Scholar] [CrossRef]
  4. Ruuska, S.A.; Girke, T.; Benning, C.; Ohlrogge, J.B. Contrapuntal networks of gene expression during Arabidopsis seed filling. Plant Cell 2002, 14, 1191–1206. [Google Scholar] [CrossRef] [PubMed]
  5. Cernac, A.; Benning, C. WRINKLED1 encodes an AP2/EREB domain protein involved in the control of storage compound biosynthesis in Arabidopsis. Plant J. 2004, 40, 575–585. [Google Scholar] [CrossRef] [PubMed] [Green Version]
  6. To, A.; Joubes, J.; Barthole, G.; Lecureuil, A.; Scagnelli, A.; Jasinski, S.; Lepiniec, L.; Baud, S. WRINKLED transcription factors orchestrate tissue-specific regulation of fatty acid biosynthesis in Arabidopsis. Plant Cell 2012, 24, 5007–5023. [Google Scholar] [CrossRef] [PubMed]
  7. Vanhercke, T.; Wood, C.C.; Stymne, S.; Singh, S.P.; Green, A.G. Metabolic engineering of plant oils and waxes for use as industrial feedstocks. Plant Biotechnol. J. 2013, 11, 197–210. [Google Scholar] [CrossRef] [PubMed]
  8. Napier, J.A.; Haslam, R.P.; Beaudoin, F.; Cahoon, E.B. Understanding and manipulating plant lipid composition: Metabolic engineering leads the way. Curr. Opin. Plant Biol. 2014, 19, 68–75. [Google Scholar] [CrossRef] [PubMed]
  9. Roesler, K.; Shintani, D.; Savage, L.; Boddupalli, S.; Ohlrogge, J. Targeting of the Arabidopsis homomeric acetyl-coenzyme A carboxylase to plastids of rapeseeds. Plant Physiol. 1997, 113, 75–81. [Google Scholar] [CrossRef] [PubMed] [Green Version]
  10. Zou, J.; Katavic, V.; Giblin, E.M.; Barton, D.L.; MacKenzie, S.L.; Keller, W.A.; Hu, X.; Taylor, D.C. Modification of seed oil content and acyl composition in the brassicaceae by expression of a yeast sn-2 acyltransferase gene. Plant Cell 1997, 9, 909–923. [Google Scholar] [CrossRef] [PubMed]
  11. Weselake, R.J.; Shah, S.; Tang, M.; Quant, P.A.; Snyder, C.L.; Furukawa-Stoffer, T.L.; Zhu, W.; Taylor, D.C.; Zou, J.; Kumar, A.; et al. Metabolic control analysis is helpful for informed genetic manipulation of oilseed rape (Brassica napus) to increase seed oil content. J. Exp. Bot. 2008, 59, 3543–3549. [Google Scholar] [CrossRef] [PubMed]
  12. Jako, C.; Kumar, A.; Wei, Y.; Zou, J.; Barton, D.L.; Giblin, E.M.; Covello, P.S.; Taylor, D.C. Seed-specific over-expression of an Arabidopsis cDNA encoding a diacylglycerol acyltransferase enhances seed oil content and seed weight. Plant Physiol. 2001, 126, 861–874. [Google Scholar] [CrossRef] [PubMed]
  13. Vanhercke, T.; El Tahchy, A.; Shrestha, P.; Zhou, X.R.; Singh, S.P.; Petrie, J.R. Synergistic effect of WRI1 and DGAT1 coexpression on triacylglycerol biosynthesis in plants. FEBS Lett. 2013, 587, 364–369. [Google Scholar] [CrossRef] [PubMed] [Green Version]
  14. Van Erp, H.; Kelly, A.A.; Menard, G.; Eastmond, P.J. Multigene engineering of triacylglycerol metabolism boosts seed oil content in Arabidopsis. Plant Physiol. 2014, 165, 30–36. [Google Scholar] [CrossRef] [PubMed]
  15. Kanai, M.; Mano, S.; Kondo, M.; Hayashi, M.; Nishimura, M. Extension of oil biosynthesis during the mid-phase of seed development enhances oil content in Arabidopsis seeds. Plant Biotechnol. J. 2016, 14, 1241–1250. [Google Scholar] [CrossRef] [PubMed]
  16. Fukuda, N.; Ikawa, Y.; Aoyagi, T.; Kozaki, A. Expression of the genes coding for plastidic acetyl-CoA carboxylase subunits is regulated by a location-sensitive transcription factor binding site. Plant Mol. Biol. 2013, 82, 473–483. [Google Scholar] [CrossRef] [PubMed] [Green Version]
  17. Maeo, K.; Tokuda, T.; Ayame, A.; Mitsui, N.; Kawai, T.; Tsukagoshi, H.; Ishiguro, S.; Nakamura, K. An AP2-type transcription factor, WRINKLED1, of Arabidopsis thaliana binds to the AW-box sequence conserved among proximal upstream regions of genes involved in fatty acid synthesis. Plant J. 2009, 60, 476–487. [Google Scholar] [CrossRef] [PubMed] [Green Version]
  18. Chen, M.; Mooney, B.P.; Hajduch, M.; Joshi, T.; Zhou, M.; Xu, D.; Thelen, J.J. System analysis of an Arabidopsis mutant altered in de novo fatty acid synthesis reveals diverse changes in seed composition and metabolism. Plant Physiol. 2009, 150, 27–41. [Google Scholar] [CrossRef] [PubMed]
  19. Rossak, M.; Smith, M.; Kunst, L. Expression of the FAE1 gene and FAE1 promoter activity in developing seeds of Arabidopsis thaliana. Plant Mol. Biol. 2001, 46, 717–725. [Google Scholar] [CrossRef] [PubMed]
  20. Baud, S.; Wuilleme, S.; To, A.; Rochat, C.; Lepiniec, L. Role of WRINKLED1 in the transcriptional regulation of glycolytic and fatty acid biosynthetic genes in Arabidopsis. Plant J. 2009, 60, 933–947. [Google Scholar] [CrossRef] [PubMed]
  21. Lu, C.L.; de Noyer, S.B.; Hobbs, D.H.; Kang, J.; Wen, Y.; Krachtus, D.; Hills, M.J. Expression pattern of diacylglycerol acyltransferase-1, an enzyme involved in triacylglycerol biosynthesis, in Arabidopsis thaliana. Plant Mol. Biol. 2003, 52, 31–41. [Google Scholar] [CrossRef] [PubMed]
  22. Wang, F.; Perry, S.E. Identification of direct targets of FUSCA3, a key regulator of Arabidopsis seed development. Plant Physiol. 2013, 161, 1251–1264. [Google Scholar] [CrossRef] [PubMed]
  23. Clough, S.J.; Bent, A.F. Floral dip: A simplified method for Agrobacterium-mediated transformation of Arabidopsis thaliana. Plant J. 1998, 16, 735–743. [Google Scholar] [CrossRef] [PubMed]
  24. Folch, J.; Lees, M.; Sloane Stanley, G.H. A simple method for the isolation and purification of total lipides from animal tissues. J. Biol. Chem. 1957, 226, 497–509. [Google Scholar] [PubMed]
  25. Yang, Y.; Yu, X.; Song, L.; An, C. ABI4 activates DGAT1 expression in Arabidopsis seedlings during nitrogen deficiency. Plant. Physiol. 2011, 156, 873–883. [Google Scholar] [CrossRef] [PubMed]
  26. Livak, K.J.; Schmittgen, T.D. Analysis of relative gene expression data using real-time quantitative PCR and the 2−ΔΔCT Method. Methods 2001, 25, 402–408. [Google Scholar] [CrossRef] [PubMed]
Figure 1. β-glucuronidase (GUS) expression analysis of transgenic plants containing the chimeric promoter. (a) Schematic diagram of the promoter: GUS constructs analyzed. The pink bars indicate the location of the AW box (WRI1 binding sequence). TIS: translational initiation sites. TSS: transcriptional start sites. LB: left border. RB: right border; (b) Histochemical staining of seeds at 4, 6, 8, 10, 12, 14, 16, 18 and 20 days after flowering (DAF) from plants carrying BCCP2pro:GUS, FAE1pro:GUS and SSCpro:GUS. For staining, seeds from #4 (BCCP2pro:GUS), #1 (FAE1pro:GUS) and #7 (SSCpro:GUS) in Figure 2 were used.
Ijms 19 01667 g001
Figure 2. β-glucuronidase (GUS) activity in seeds at 8, 12 and 16 days after flowering (DAF). Quantitative analysis of β-glucuronidase (GUS) activity in seeds at 8, 12 and 16 days after flowering (DAF) from transgenic plants containing the biotin carboxyl carrier protein 2 (BCCP2), fatty acid elongase 1 (FAE1) and the seed-specific chimeric (SSC) promoters. Values represent means of three independent experiments. Statistical analysis carried out by Student’s t-test. Error bars represent standard deviation.
Ijms 19 01667 g002
Figure 3. Triacylglycerol (TAG) content in seeds. TAG content in mature seeds from independent transgenic lines expressing AtTAG1 under control of the seed-specific chimeric (SSC) promoter or fatty acid elongase 1 (FAE1) promoter. TAG content is expressed as a percentage of mature seed weight. Values are means ± standard deviation of measurements of 3–5 independent experiments. Statistical analysis carried out by Student’s t-test. Asterisks indicate a significant difference between the wild-type (WT) and transgenic lines at p < 0.01 (**) and p < 0.05 (*).
Ijms 19 01667 g003
Figure 4. Seed weight of independent transgenic lines. Seed weight of independent transgenic lines expressing TAG1 under control of the SSC promoter or FAE1 promoter. Values are means ± standard deviation of three independent measurements of the weight of 100 seeds. Statistical analysis carried out by Student’s t-test. Asterisks indicate a significant difference between the WT and transgenic lines at p < 0.05 (*).
Ijms 19 01667 g004
Figure 5. Seed size of transgenic plants. (a) Images and (b) the length of seeds that accumulated the three highest amounts of TAG among transgenic lines expressing TAG1 under control of the SSC promoter or FAE1 promoter. Scale bars = 0.5 mm. Values are means ± standard deviation of measurements of 50 seeds. Asterisks indicate a significant difference between the wild-type (WT) and transgenic lines at p < 0.01 (**).
Ijms 19 01667 g005
Figure 6. Fatty acid (FA) composition in seeds from transgenic plants. As representatives, FA compositions of seeds from transgenic lines that accumulated the highest amounts of TAG; lines SSCpro:TAG1 #7 and FAE1:TAG1 #22 are shown compared with that of WT seeds. Values are means ± standard deviation of measurements of 3 independent experiments.
Ijms 19 01667 g006
Figure 7. TAG1 expression in seeds from transgenic plants. The expression levels of TAG1 in seeds at 8, 12 and 16 days after flowering (DAF) in (a) SSCpro:TAG1 and (b) FAE1pro:TAG1 seeds were quantified by quantitative reverse transcription–polymerase chain reaction (qRT–PCR) and presented as relative values versus the level in WT seeds at 8 DAF. The gene expression levels were normalized using ELONGATION FACTOR1 αA4 (EF1αA4). Data shown represent the mean ± standard deviation of 3 (seeds at 8 DAF) and 5 (seeds at 12 and 16 DAF) biological replicates.
Ijms 19 01667 g007
Table 1. Primers used in this study.
NameSequence
Construction of Chimeric Promoter
BCCP2 5'-UTRBCCP2X FGCGCTCGAGACAAAAGGAGCGGTTTTGG
BCCP2Sl RGCGGTCGACTGACGCCATTGTTGAGAC
FAE1FAEp2kSal FCGTCGACGGATCCCGGATTCTATTCACTCTATC
FAEpSal RGGTCGACTCTGTTTGTGTCGGAAAATAATGG
GFPGFPXXH FCTCGAGTCTAGAAAGCTTATGGGTAAGGGAGAAGAAC
GFPHSS RGAGCTCCCCGGGAAGCTTTTATTTGTATAGTTCATCC
TAG1TAG1XbaSma FTCTAGACCCGGGATGGCGATTTTGGATTCTG
TAG1EcoRV RGCGATATCTCATGACATCGATCCTTTTCG
qRT-PCR
TAG1AtDGAT1 FAATGTGGAATATGCCTGTTCATAAA
AtDGAT1 RCCCACCGTTGAGCCAAACC
EF1αA4Real-time EF1aA4 FCTTGGTGTCAAGCAGATGATTT
Real-time EF1aA4 RCGTACCTAGCCTTGGAGTATTTG

