Article

Application of 3D-QSAR, Pharmacophore, and Molecular Docking in the Molecular Design of Diarylpyrimidine Derivatives as HIV-1 Nonnucleoside Reverse Transcriptase Inhibitors

Key Laboratory for Green Chemical Process of Ministry of Education, School of Chemical Engineering and Pharmacy, Wuhan Institute of Technology, Wuhan 430205, China
*
Authors to whom correspondence should be addressed.
Int. J. Mol. Sci. 2018, 19(5), 1436; https://doi.org/10.3390/ijms19051436
Submission received: 27 March 2018 / Revised: 8 May 2018 / Accepted: 9 May 2018 / Published: 11 May 2018
(This article belongs to the Section Molecular Biophysics)

Abstract

:
Diarylpyrimidines (DAPYs), acting as HIV-1 nonnucleoside reverse transcriptase inhibitors (NNRTIs), have been considered to be one of the most potent drug families in the fight against acquired immunodeficiency syndrome (AIDS). To better understand the structural requirements of HIV-1 NNRTIs, three-dimensional quantitative structure–activity relationship (3D-QSAR), pharmacophore, and molecular docking studies were performed on 52 DAPY analogues that were synthesized in our previous studies. The internal and external validation parameters indicated that the generated 3D-QSAR models, including comparative molecular field analysis (CoMFA, q 2 = 0.679, R 2 = 0.983, and r pred 2 = 0.884) and comparative molecular similarity indices analysis (CoMSIA, q 2 = 0.734, R 2 = 0.985, and r pred 2 = 0.891), exhibited good predictive abilities and significant statistical reliability. The docking results demonstrated that the phenyl ring at the C4-position of the pyrimidine ring was better than the cycloalkanes for the activity, as the phenyl group was able to participate in π–π stacking interactions with the aromatic residues of the binding site, whereas the cycloalkanes were not. The pharmacophore model and 3D-QSAR contour maps provided significant insights into the key structural features of DAPYs that were responsible for the activity. On the basis of the obtained information, a series of novel DAPY analogues of HIV-1 NNRTIs with potentially higher predicted activity was designed. This work might provide useful information for guiding the rational design of potential HIV-1 NNRTI DAPYs.

Graphical Abstract

1. Introduction

Acquired immunodeficiency syndrome (AIDS) is a potentially fatal infectious disease caused by the human immunodeficiency virus (HIV) [1]. The lack of effective vaccines or drugs at present is still a major obstacle in the fight against HIV infection [2,3]. According to the data reported by the World Health Organization on 17 May 2017, it is estimated that approximately 1.1 million people died from HIV-related diseases in 2015, and 36.7 million people had been infected with HIV by the end of 2015. By mid-2016, 18.2 million AIDS patients worldwide were administered the highly active antiretroviral therapy (HAART), which can dramatically reduce the mortality of HIV-infected patients by inhibiting HIV replication [4].
Nonnucleoside reverse transcriptase inhibitors (NNRTIs), as an indispensable part of HAART, have attracted wide attention because of their potent antiviral activity, high specificity, and low cytotoxicity [5]. The NNRTIs mainly inhibit the reverse transcriptase (RT) of HIV type 1 (HIV-1) by binding to a hydrophobic pocket localized about 10 Å from the catalytic site of the enzyme [6,7]. Until now, a large amount of NNRTIs with diverse chemical structures have been reported, such as dihydroalkoxybenzyloxopyrimidines, benzophenones, diaryl ethers, diaryltriazines, and diarylpyrimidines (DAPYs). Among these series of NNRTIs, DAPYs are considered to be one of the most successful anti-HIV families [8]. Etravirine (TMC125) and rilpivirine (TMC278) (Figure 1), two representative members of DAPYs, have been approved by the U.S. Food and Drug Administration in 2008 and 2011, respectively. Compared to the first or second generation of NNRTIs, such as delavirdine and efavirenz, etravirine and rilpivirine exhibit excellent potencies against wild-type (WT) HIV-1 and resistant mutants such as K103N. However, hypersensitivity reactions, rash, and Stevens–Johnson syndrome were observed in clinical cases of etravirine [9]. Additionally, AIDS patients in which therapy failed were found to show increased drug resistance to rilpivirine compared to efavirenz [10].
Because of the fact that the right wing of the DAPY structure has been confirmed as a key pharmacophore for anti-HIV-1 activity [11], the structural modifications were mainly carried on the left wing, the central pyrimidine ring, and their linker (L–C bridge) (Figure 1). Recently, we synthesized a series of DAPYs (Figure 1) by modifying the left wing as well as the linker, and most of them exhibited potent anti-HIV-1 activity [5,8]. However, when modifying the left wing, the modifications were often confined to different substituted aromatic groups without considering cycloalkyl groups. Thus, in a previous study, we also examined whether the introduction of a cycloalkyl group on the left wing of DAPYs to replace the phenyl group could provide a novel structural scaffold to improve the anti-HIV-1 activity [11]. Several synthesized cycloalkyl arylpyrimidines (CAPYs) (Figure 1) also show moderate anti-HIV-1 activity. However, the three-dimensional quantitative structure–activity relationships (3D-QSARs) of these DAPYs and CAPYs and their interaction mechanisms as HIV-1 NNRTIs were not well understood.
To further explore the relationships between the inhibitory activity of HIV-1 NNRTIs and their structural features, in this work, 3D-QSAR studies including comparative molecular field analysis (CoMFA) and comparative molecular similarity indices analysis (CoMSIA) were applied on a series of DAPYs and CAPYs. In addition, pharmacophore modeling and molecular docking were performed to investigate the binding pattern of DAPYs and CAPYs with the enzyme. All the developed models could provide some useful information about structural modifications in designing novel and potent DAPYs as HIV-1 NNRTIs.

2. Results and Discussion

2.1. CoMFA and CoMSIA Statistical Results

The classical parameters of CoMFA and CoMSIA models, including q 2 , ONC, R 2 , r pred 2 , SEE, and F-values, are listed in Table 1. The other important validation parameters, such as RMSE, MAE, r 2 , r 0 2 , r 0 2 , k, k’, r m 2 , r m / 2 , Δ r m 2 , and r m 2 ¯ are listed in Table 2. The results from the CoMFA model indicated that q 2 , R 2 , r pred 2 , MAE, RMSE, Δ r m 2 , and r m 2 ¯ were 0.679, 0.983, 0.884, 0.124, 0.160, 0.1215 (or 0.0026), and 0.7829 (or 0.9690), respectively. These data proved that the constructed CoMFA model was reliable, and its predictive accuracy was acceptable ( r pred 2 > 0.5). The steric and electrostatic fields contributions were 46.30% and 53.70%, respectively, indicating that the electrostatic fields gave an important contribution.
For the CoMSIA analysis, different combinations of descriptor fields were used to construct different CoMSIA models. All possible combinations of fields were performed to determine the optimal predictive model [12]. According to the experimental data in Table 1, it could be found that a model consisting of steric, electrostatic, hydrophobic, hydrogen-bond donor and hydrogen-bond acceptor fields led to relatively higher q 2 , R 2 , r pred 2 and relatively lower SEE. Therefore, the model (S + E + H + D + A, Table 1) was considered to be the best possible combination, which assigned satisfactory values to the parameters q 2 , R 2 , r pred 2 , MAE, RMSE, Δ r m 2 , and r m 2 ¯ , i.e., 0.734, 0.985, 0.891, 0.108, 0.155, 0.1387 (or 0.0171), and 0.7389 (or 0.9763), respectively. The corresponding contributions of steric, electrostatic, hydrophobic, hydrogen-bond acceptor, and hydrogen-bond donor fields were 12.30%, 41.40%, 27.60%, 7.5%, and 11.20%, respectively. Compared to the CoMFA model, the CoMSIA model seemed to show a somewhat better predictivity. It was also found that the electrostatic fields were significant contributors in the optimal CoMSIA model. These results indicate that the constructed models are powerful to predict the activity of DAPYs and CAPYs. The field contributions revealed that the electrostatic fields play important roles in the CoMFA and CoMSIA models.
Then, we used the models to predict the activity of the training and test set compounds. The actual and predicted pEC50 (−logEC50) values of DAPYs and CAPYs are listed in Table 3. The correlations between actual and predicted pEC50 values are shown in Figure 2. The predicted pEC50 values were close to the experimental data, and most of the points were located on or near the trend line, which indicated the predictivity and reliability of both models. The above results indicate that constructed CoMFA and CoMSIA models are reasonable and have the ability to predict the anti-HIV-1 activity of the training and test compounds of DAPYs and CAPYs.

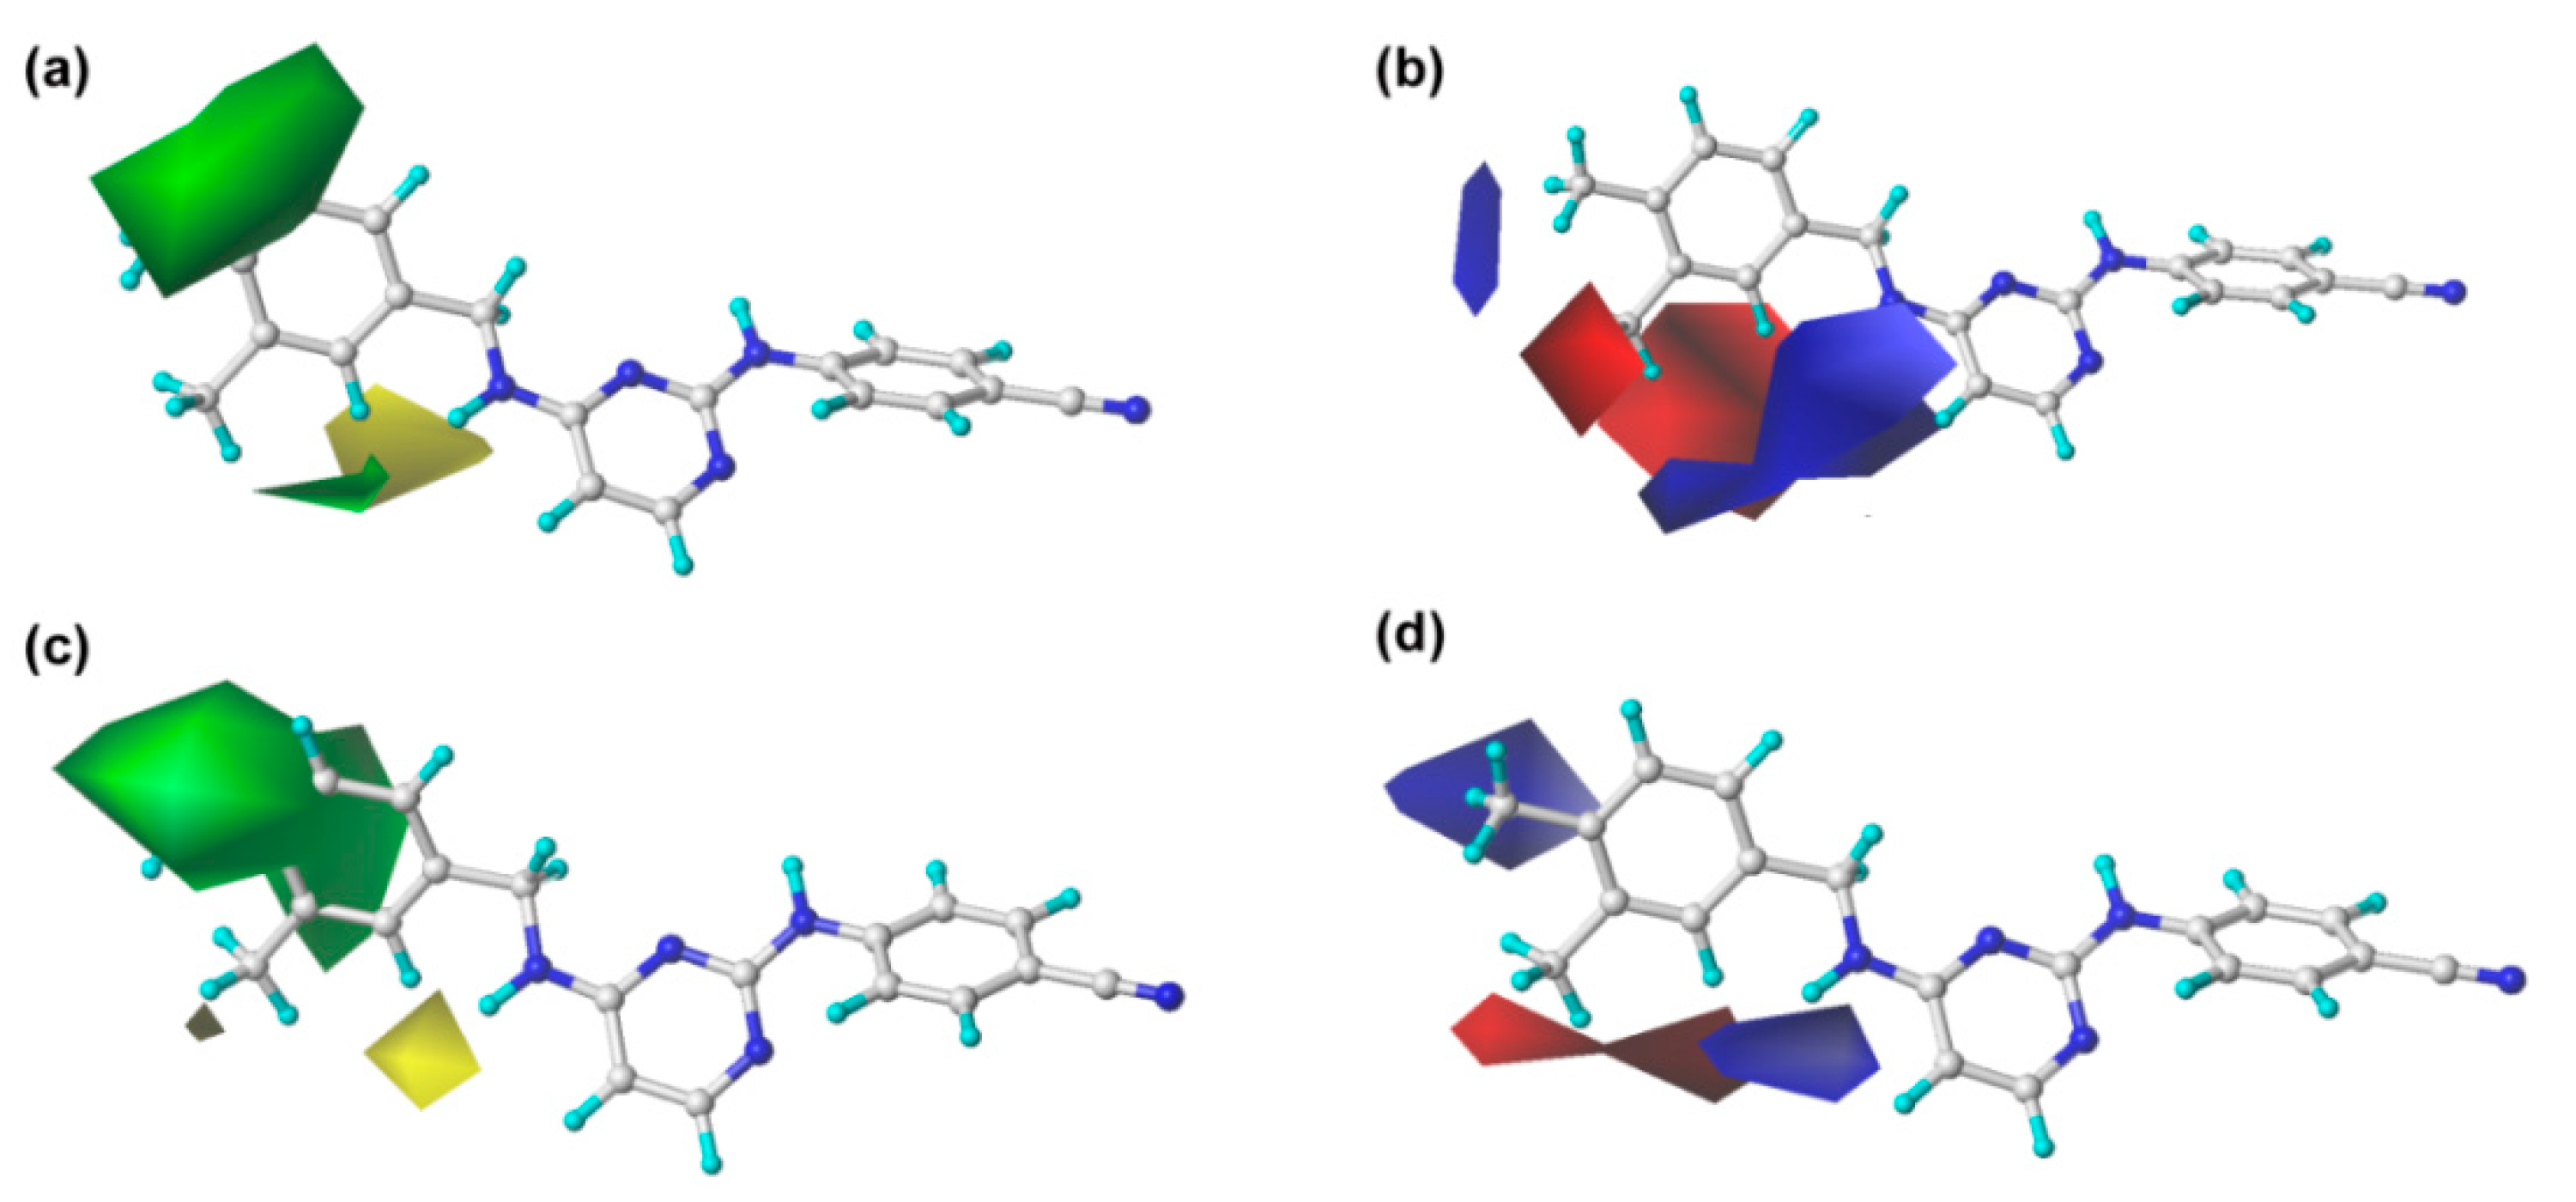
2.2. CoMFA and CoMSIA Contour Maps

To visualize the different field effects in three-dimensional spaces where the modifications could increase the activity of the target compounds, contour maps were generated subsequently in the CoMFA and CoMSIA models. Compound 43 with the highest activity was used as a reference structure to illustrate all the contour maps.
The steric and electrostatic contour maps of CoMFA and CoMSIA are shown in Figure 3. In the steric fields, the green contours indicate sterically favorable bulky substituents, whereas the yellow contours indicate where the substituents are sterically unfavorable [13]. It should be noted that the steric contour maps of CoMSIA are similar to those of the CoMFA model, which proves the consistency of the results. As shown in Figure 3, a large green contour surrounding the C3 (or C5) and C4 positions of the left phenyl ring indicates that bulky groups here are beneficial for enhancing the activity. This finding might explain why the activity of compound 43 is significantly higher than that of other compounds. However, the structure–activity relationships of several compounds with single substitution at the C3 or C4 position were not coincident with this finding, as seen, for example, for compounds 6 (4-Br) < 9 (4-F). This might have been caused by other properties of the substitutions or the effects of other fields and remains to be studied. On the other hand, there was a small yellow contour surrounding the C2-position of the left phenyl ring, which suggested that bulky substituents at this site might be unfavorable for the activity, as observed for the following compounds in this order: 4 (2-Br) < 1 (2-Cl) < 7 (2-F) and 16 (2-CF3) < 10 (2-CH3) < 24 (2-H).
For the electrostatic maps, the blue contours denote regions where positively charged substituents will improve the inhibitory activity, whereas the red regions show negatively charged substituents are helpful for enhancing the activity. As shown in Figure 3, a large blue contour around the C4-position of the left phenyl ring reveals that the positively charged substituents at this position are favorable for increasing the inhibitory activity. This finding can be supported by examples as follows: compound 36 with a methyl substituent at the C4-position showed higher inhibition activity compared to compounds 30 (4-Cl), 33 (4-Br), and 35 (4-F); the activity order was 36 (4-CH3) > 33 (4-Br) > 30 (4-Cl) > 35 (4-F). Moreover, a big blue irregular contour near the linker between the left wing and the central pyrimidine indicates that the presence of a positively charged group in this region is beneficial to the bioactivity, which is consistent with the experimental data, showing, for example, 27 (linker = –NH) > 24 (linker = –O). Two small red contours surrounding the C2 and C3 positions of the left phenyl ring, respectively, indicating that the presence of negative charges in these regions will be favorable for bioactivity. For example, compounds 1 (2-Cl), 4 (2-Br), and 7 (2-F) showed higher activity than compound 10 (2-CH3), and the order of their inhibitory activity was 7 (2-F) > 1 (2-Cl) > 4 (2-Br) > 10 (2-CH3). This result is also reflected in the fact that the activity of compound 34, with a fluorine (negative charge) at the C3-position, was increased significantly compared with that of compound 41 bearing a trifluoromethyl (positive charge).
As shown in Table 1 and Figure 4a, the hydrophobic field also plays an important role in the optimal CoMSIA model. Two large orange contours are located near the C3 and C4 positions of the left phenyl ring, indicating that a hydrophobic substituent in these two positions will be favorable to the inhibitory activity. For example, compound 43 with methyl groups in these two zones showed higher activity than compound 24 with hydrogens. Besides, there is a white contour close to the C2-position of the left phenyl ring, which suggests that the presence of a hydrophilic group in this position might increase the inhibitory activity. For instance, the activity of compound 7 with a fluorine group at the C2-position of the left phenyl ring was higher than that of compound 24 with a hydrogen at this position.
Furthermore, the hydrogen-bond donor and acceptor fields also play relatively important roles in the bioactivity of the compounds. As shown in Figure 4b, c, a cyan contour surrounds the linker between the central pyrimidine and the left wing, which signifies that hydrogen-bond donor groups at this position will be beneficial to the bioactivity. This can be certified by the fact that the inhibitory activity of compound 27 (linker = –NH) was significantly higher than that of compound 24 (linker = –O). Moreover, it also can be observed that there are two violet contours around the C3-position of the left phenyl ring and the X substituent of the linker (Figure 1), respectively, indicating that hydrogen-bond acceptor groups in these positions are not beneficial for the biological activity. This result is supported by the biological activity of the compounds that contain an oxygen atom as X substituent, such as compounds 45, 46, and 47.

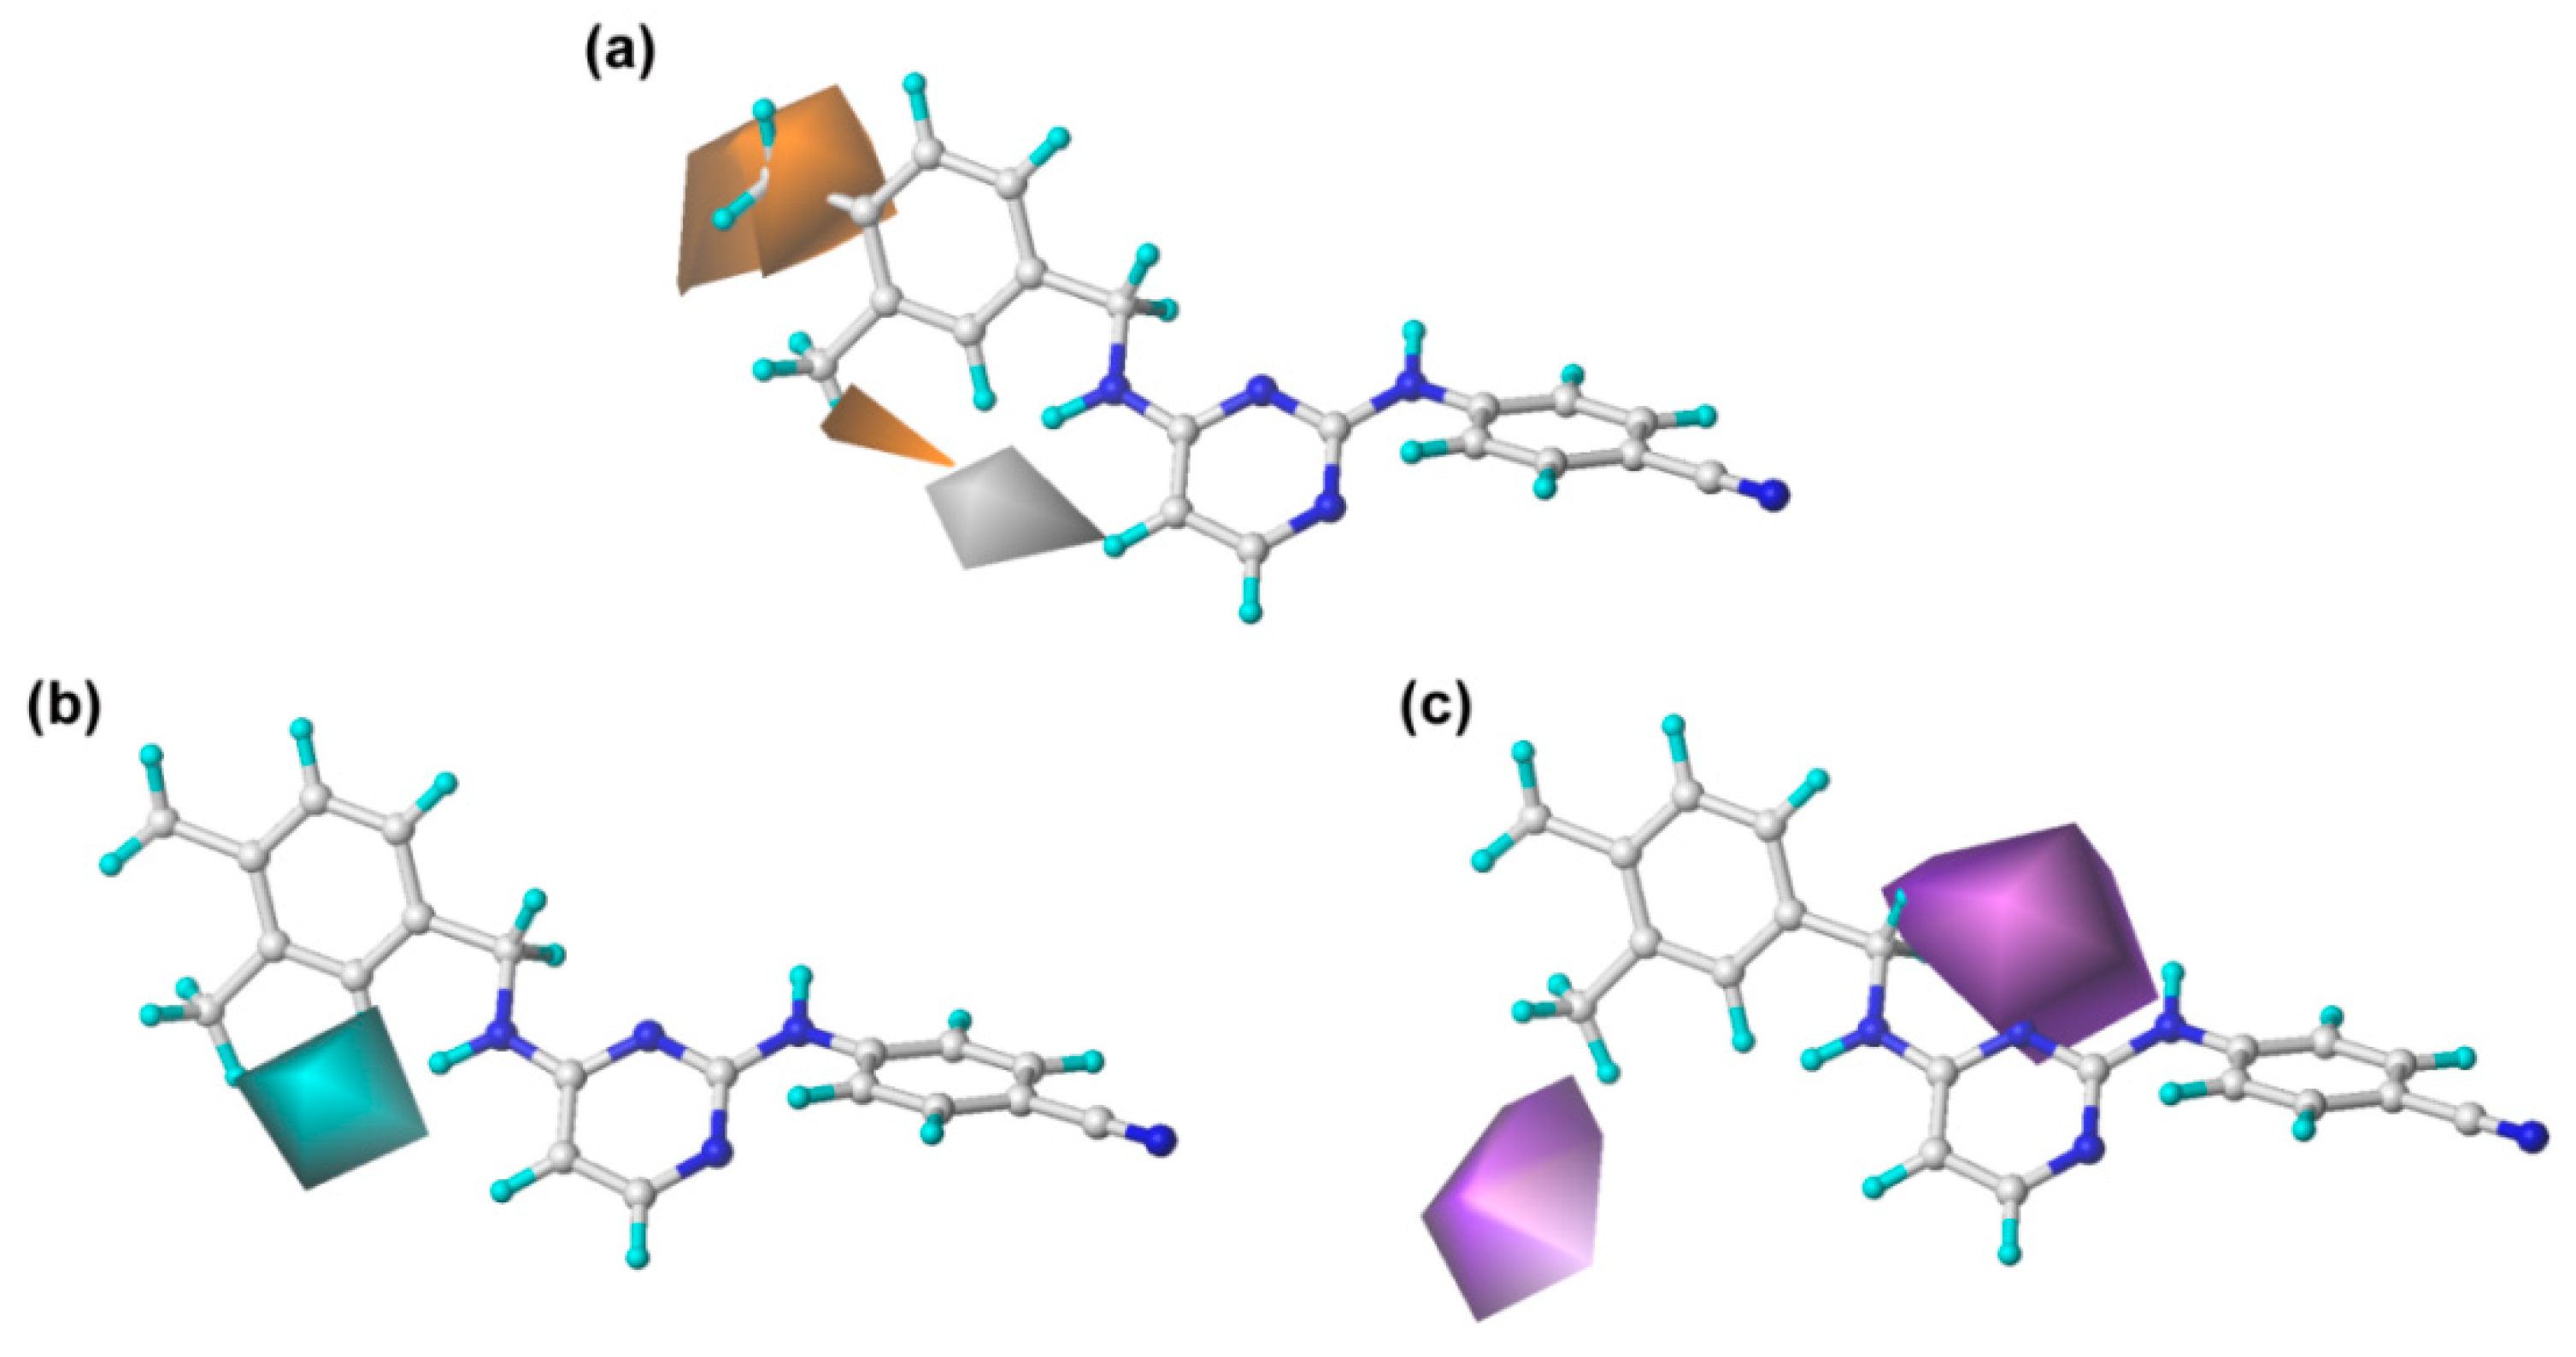
2.3. Pharmacophore Model

The pharmacophore model was constructed using nine compounds with diverse structures and relatively high activities as a training set. Twenty pharmacophore models were generated after Genetic Algorithm with Linear Assignment of Hypermolecular Alignment of Datasets (GALAHAD) run, each of which represented a different trade-off among the competing criteria. The lower the strain energy (SE) values, and the higher the steric overlap (SO) and pharmacophoric similarity (PhS) values, the better the model. According to the experimental results, it was found that the parameters of the best generated model were: SE = 2.982, SO = 255.80, and PhS = 123.30. The pharmacophore model with the alignment of nine compounds is shown in Figure 5, indicating a satisfactory superimposition. As depicted in Figure 5, the magenta, green, and cyan spheres represent hydrogen-bond donor atoms (DAs), hydrogen-bond acceptor atoms (AAs), and hydrophobes (HYs), respectively. The best model is formed by nine pharmacophore features: two hydrogen-bond DAs, four hydrogen-bond AAs, and three HY centers. One of the hydrogen-bond DAs is the nitrogen atom of an imine group, and the four hydrogen-bond AAs correspond to the nitrogen atoms of a pyrimidine ring, imine group, and nitrile group, respectively. These features reflect the importance of the DAPY/CAPY common scaffold for the inhibitory activity. Another hydrogen-bond DA is located at the linker atom, indicating that a hydrogen-bond donor groups such as –NH at this position may increase the inhibitory activity, which is in accordance with the hydrogen-bond donor fields results in the CoMSIA contour maps. The three hydrophobic centers are located at the center of the left phenyl ring, the center of the pyrimidine ring, and the center of the right phenyl ring, respectively, which suggests that a large hydrophobic structure on the left wing is favorable for the activity. These results are in agreement with the actual activities and the steric fields of the 3D-QSAR contour maps.

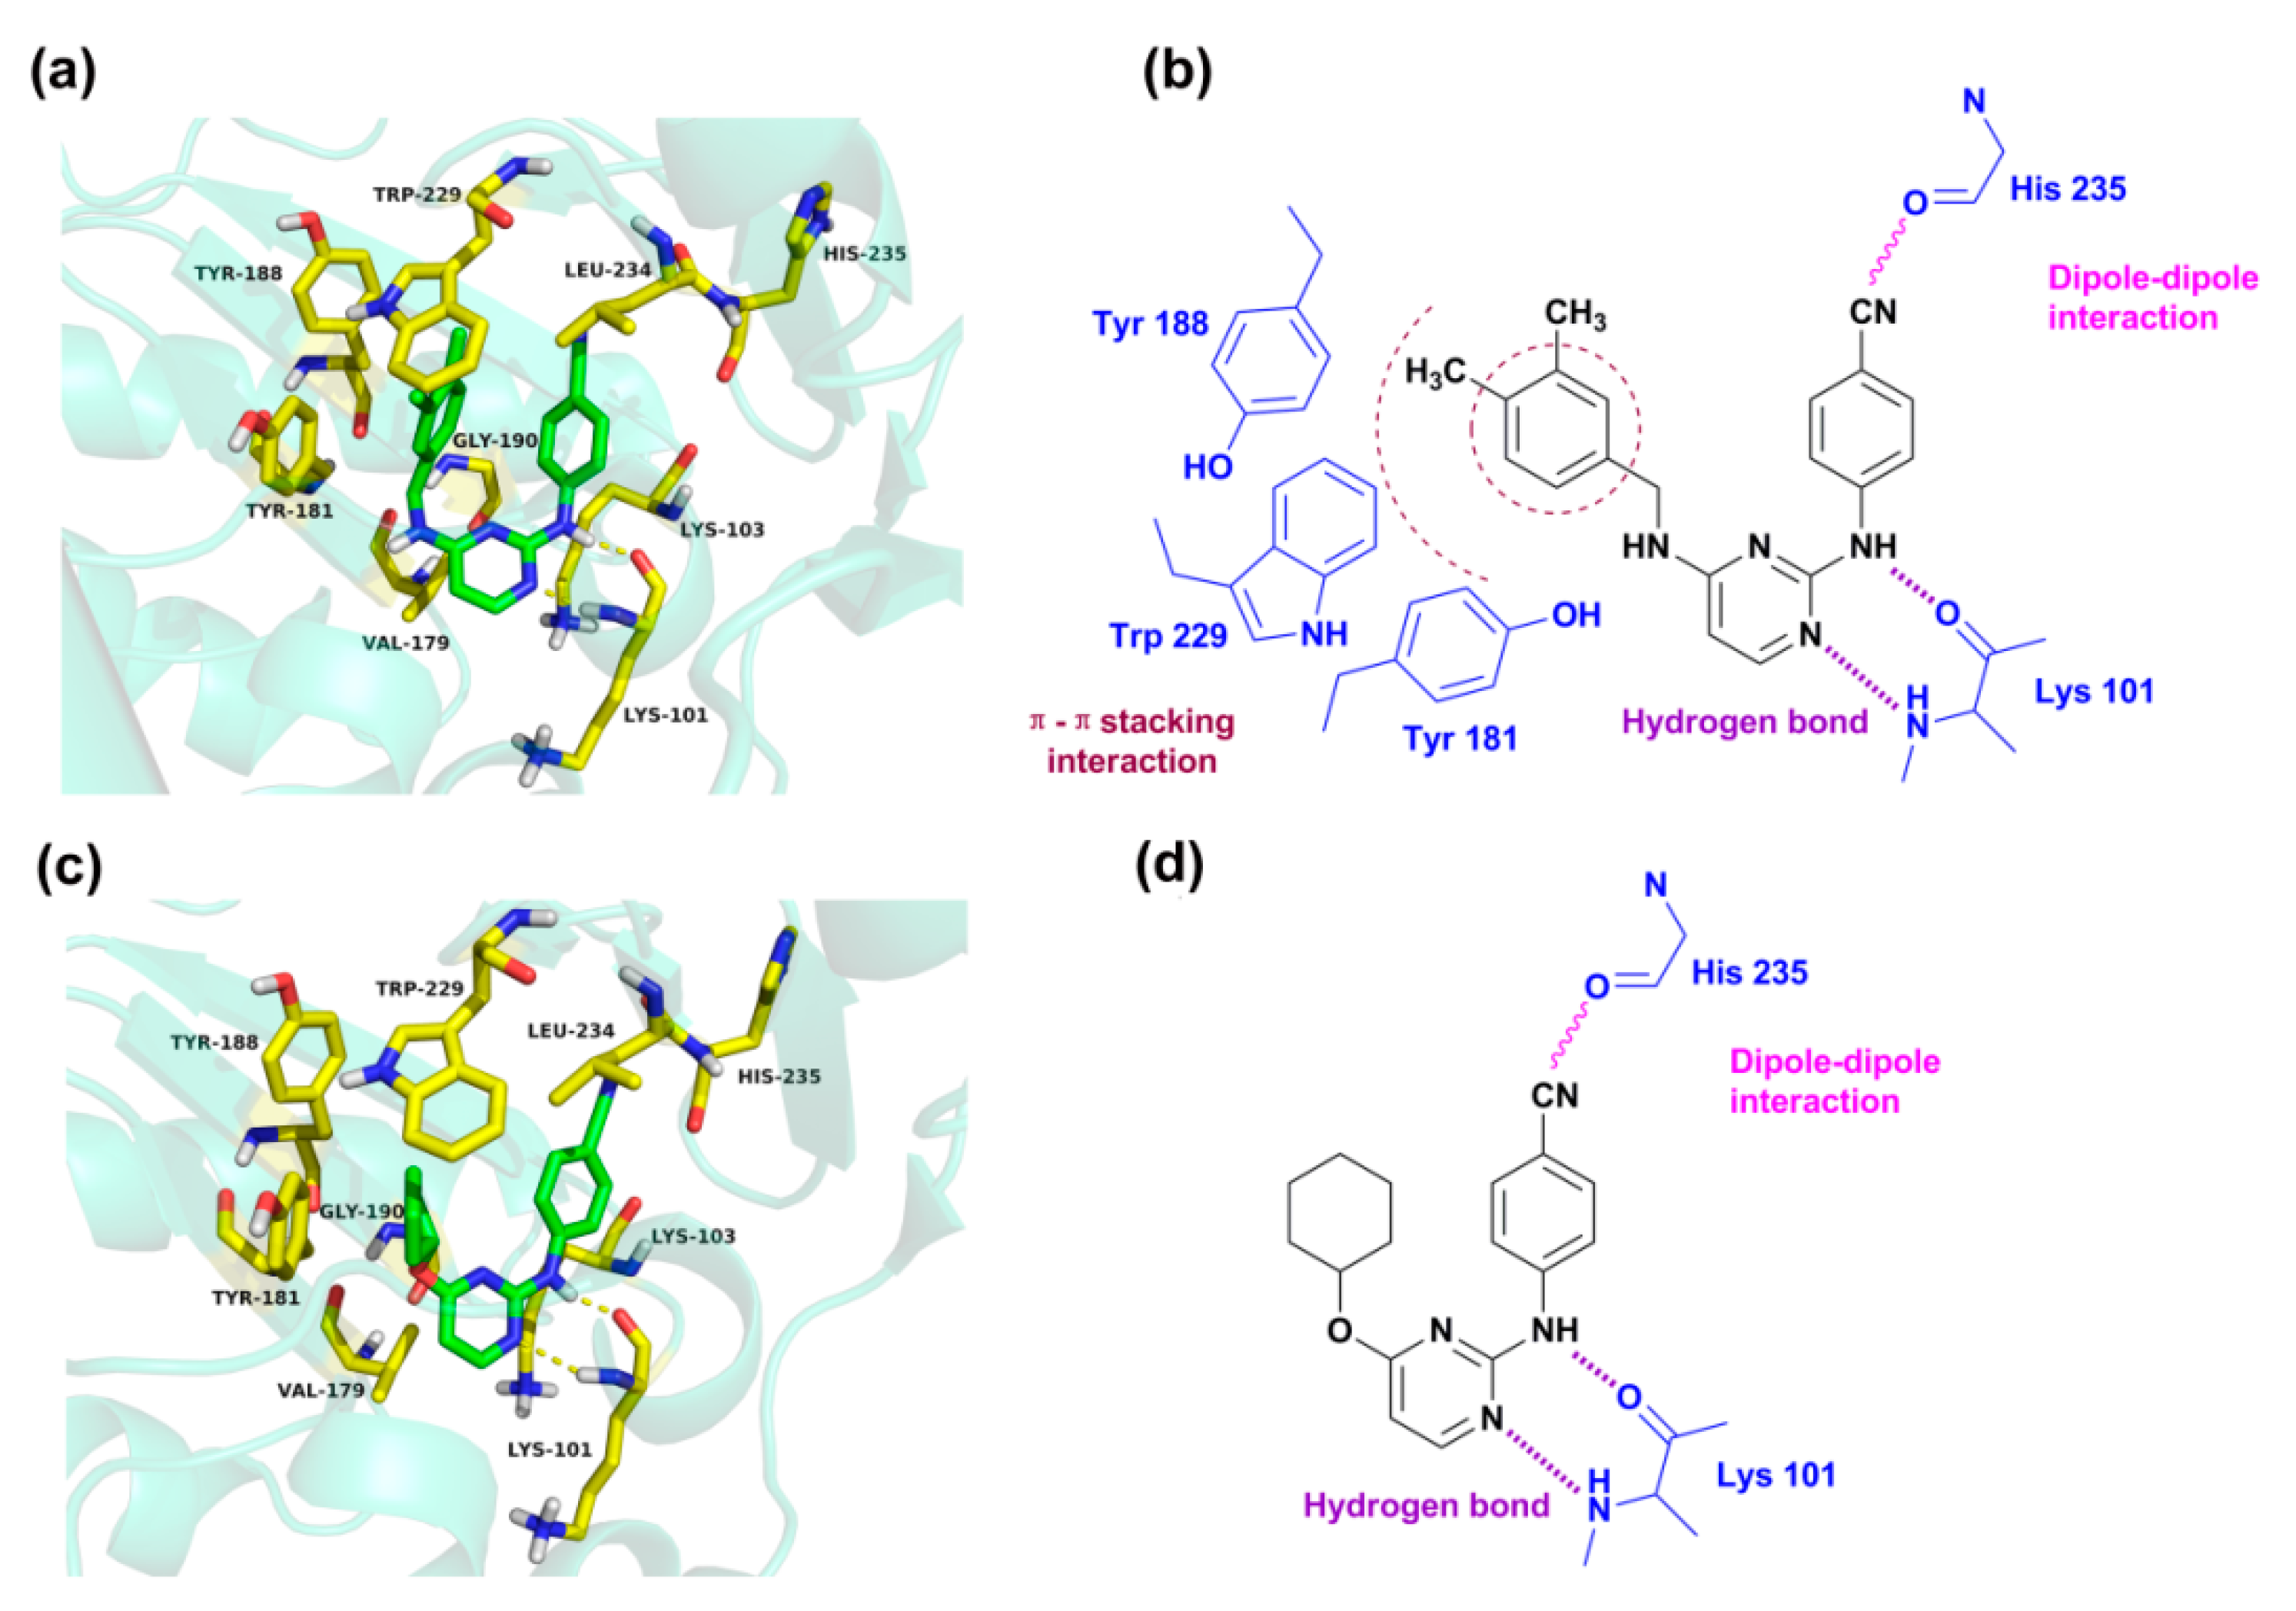
2.4. Molecular Docking Analysis

To validate the docking reliability, a cognate ligand, i.e., etravirine, which was extracted from the crystal structure of the WT HIV-1 RT (PDB ID: 3MEC), was first re-docked into the binding site using surflex-docking. The redocked conformation was compared with the original crystallographic conformation of the ligand [14]. As shown in Figure 6a, the redocked etravirine and the crystal etravirine in the complex are almost completely superimposable, and the root-mean-square deviation (RMSD) of the two conformations for all atoms is 0.25 Å. These results suggest that the surflex docking method and the used parameters are reasonable and reliable [15]. The DAPYs and CAPYs were then docked into the binding site in the same way. The generated binding pocket is shown in Figure 6b.
After validating the docking reliability, all the DAPYs and CAPYs were docked into the binding pocket. The superimposition of the most active compound 43 and the least active compound 46 with the redocked etravirine is shown in Figure 6c. It should be noted that compound 43 superimposes with etravirine better than compound 46, although their docking conformations are in a similar orientation. The docking score of compound 43 (total-score = 9.5247) was higher than that of compound 46 (total-score = 8.2434), which is in agreement with their activities.
Figure 7 presents the detailed interacting modes of compounds 43 and 46 in the binding site of the HIV-1 RT (3MEC). As seen from Figure 7a,c, the two compounds have the same orientation and adopt a horseshoe or a “U”-shaped conformation in the pocket, as previously reported [16,17]. As shown in Figure 7a,b, the backbone of Lys 101 forms two hydrogen bonds with the nitrogen atoms of the pyrimidine and -NH linker of compound 43, respectively. This result is in agreement with our previous report that the residue Lys101 might interact with DAPYs and CAPYs through hydrogen bonds [8]. The same interactions were also observed in the binding mode of compound 46. The hydrogen bond distances and angles are shown in Table 4.
It was also found that some amino acid residues in the binding pocket, including Tyr318, Tyr232, Phe 227, Trp239, Trp229, Pro225, Pro226, Met230, Ile94, and Val189, formed hydrophobic interactions with compounds 43 and 46 [18]. According to the pharmacophore model, it could also be concluded that bulky lipophilic substituents, such as an aromatic ring on the left wing of DAPYs, might make hydrophobic contacts with these amino acid residues. Moreover, van der Waals interactions could be established between the docked compounds and amino acid residues such as Leu100, Lys103, Val179, Gly190, and Leu234. The cyano group in the right aryl wing could establish a dipole–dipole interaction with the carbonyl of His235. These interactions might allow the inhibitors to maintain a horseshoe or a “U”-shaped conformation.
Additionally, π–π stacking interactions were found between the left phenyl ring of compound 43 and aromatic amino acid residues such as Tyr188, Tyr181, and Trp229 [11,19]. As shown in Figure 7a, the left phenyl group is parallel to Tyr181 or Tyr188, and the 4-CH3 on the phenyl ring points towards the highly conserved Trp229. However, π–π stacking interactions are not found in the docking results of compound 46 because of its lack of an aromatic ring on the left wing. The results indicate that the cyclohexyl or cyclopentyl substituents on the left wing of CAPYs are unfavorable for inhibitory activity, which might be due to the loss of the π–π stacking interactions.

2.5. Newly Designed DAPYs

Based on the combination analysis of the 3D-QSAR, pharmacophore, and molecular docking results, structure–activity relationships of DAPYs were obtained and subsequently utilized to design new DAPYs as potential HIV-1 NNRTIs. Ten novel DAPYs were designed, and their anti-HIV-1 activities were predicted by the CoMFA and the best CoMSIA models, as seen in Table 5. Several principles were considered in the design of these novel DAPYs. First, the left phenyl ring was retained as a core moiety in the designed compounds because it is able to participate in π–π stacking interactions with the aromatic amino acid residues in the binding pocket. Second, the contour maps of the hydrogen-bond donor fields and pharmacophore features indicate that hydrogen-bond donors located at the left linker are preferred to enhance the activity, thus an imino group was retained as a linker instead of an oxygen atom. Third, different substitutions were introduced into the left phenyl group according to the contour maps analysis as follows: (a) a bulky, positively charged, and/or hydrophobic substituent, such as –CH2CH3, –CH(CH3)2, –C(CH3)3, and –NH2, at the C4-position; (b) a negatively charged and/or hydrophobic group, such as –CN, –NO2, and –OOCCH3, at the C3-position; (c) a small, negatively charged, and/or hydrophilic substituent, such as –OH and –F, at the C2-position.
As shown in Table 5, the predicted activities of the newly designed molecules are all remarkable. Three compounds (54, 60, and 62) demonstrated a higher activity in the CoMFA and the optimal CoMSIA models than the most active compound 43. These results indicate that the molecular simulation study was able to provide a reference for optimizing the structure and evaluating new potent DAPYs. However, future studies on synthesis methods, activity assays, and pharmacokinetic tests of these newly designed DAPYs are necessary.

3. Materials and Methods

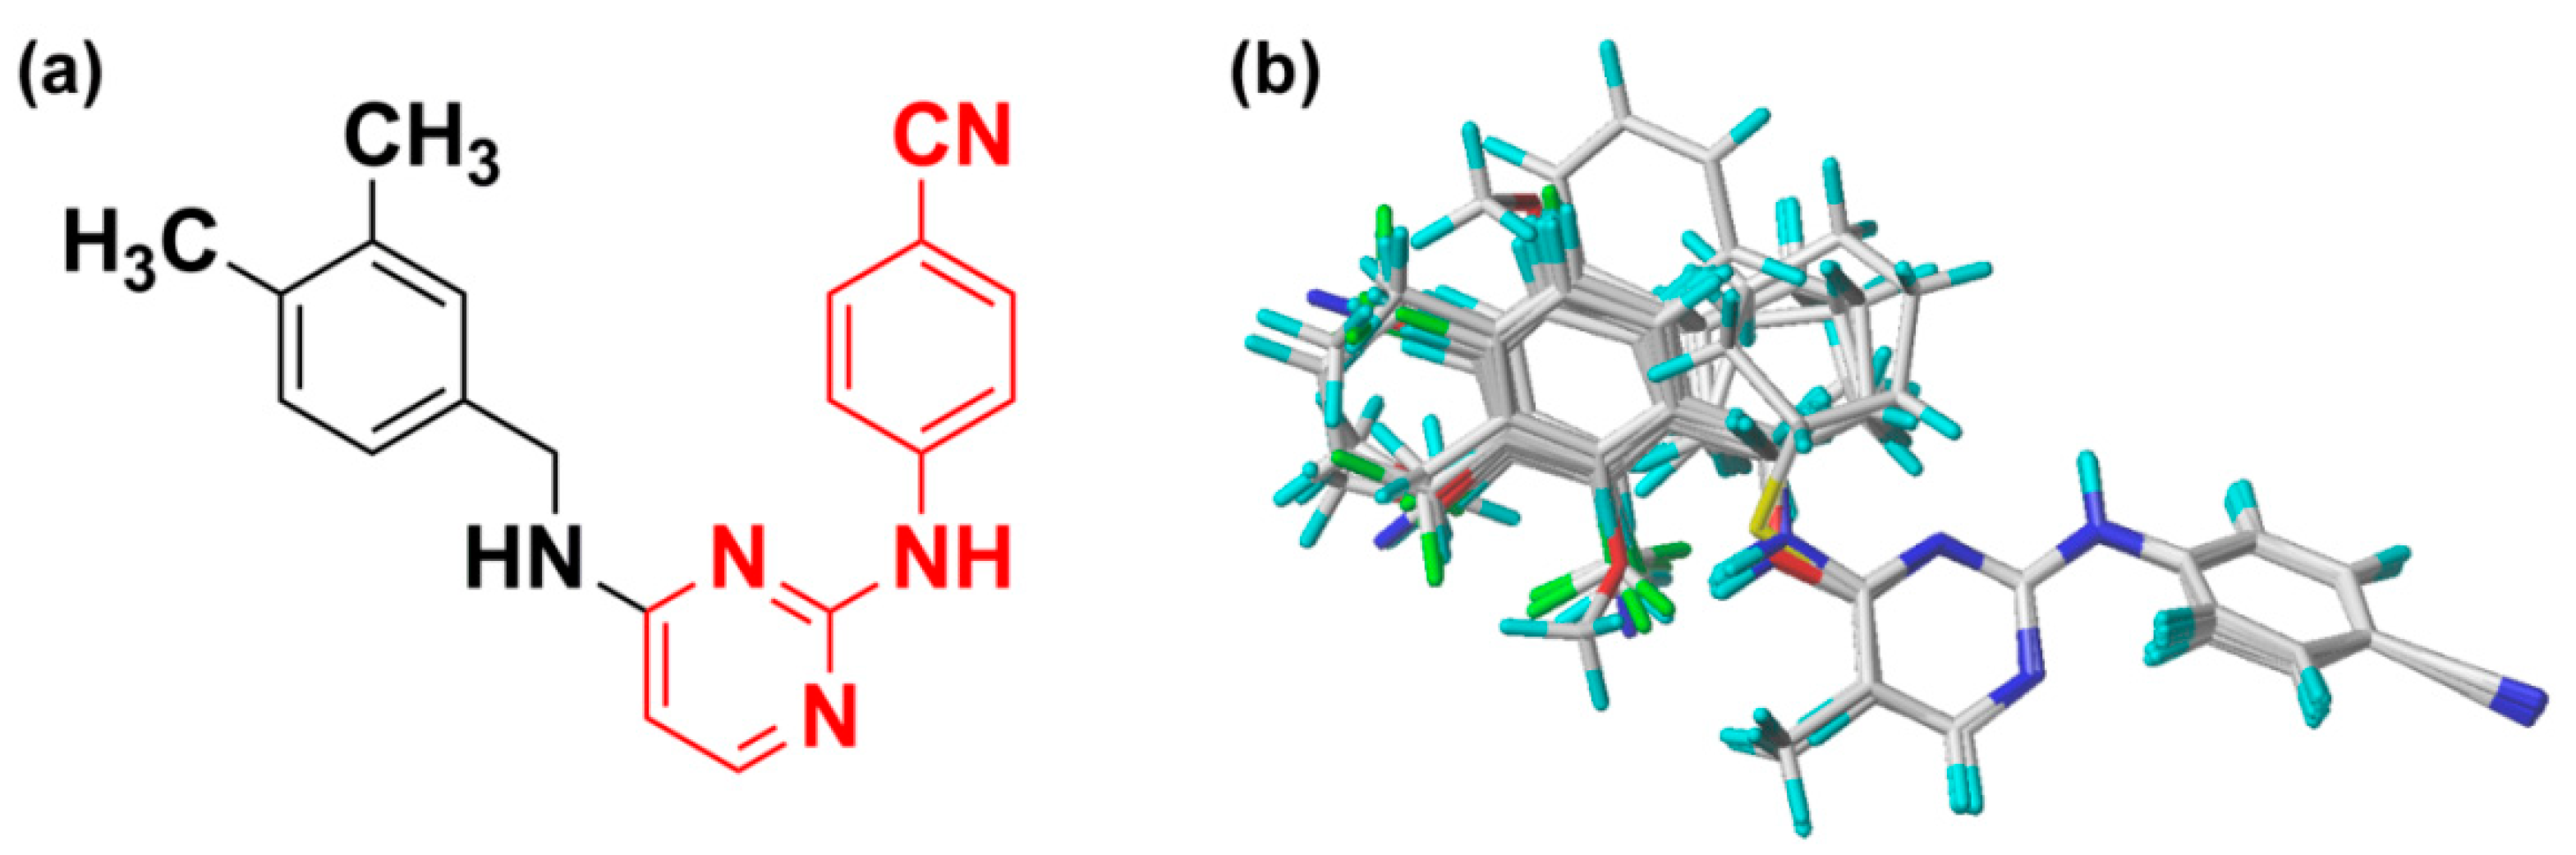
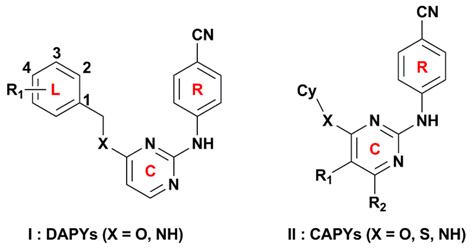
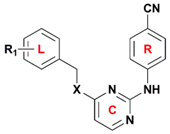
3.1. Dataset and Alignment

Fifty-two DAPY and CAPY compounds belonging to the HIV-1 NNRTI class were obtained from our previous studies and used to set up the 3D-QSAR models [5,8,11]. All the compounds were randomly divided into two sets, including 40 compounds as a training set to generate the model and 12 compounds as a test set to validate the model. The bioactivity of all the compounds was converted into −logEC50 (pEC50). Their structures and bioactivity are given in Table 3. All calculations were carried out using the SYBYL-X 2.1 software (Tripos Inc., St. Louis, MO, USA) running on a windows 7 workstation. Energy optimization of all molecules used the Gasteiger–Hückel charges and Tripos force field with a gradient descent method, with a gradient convergence criterion of 0.005 kcal/mol·Å and a maximum iteration coefficient of 10,000 [20]. The other parameters were set to default values. In order to obtain an optimal alignment, the conformation of compound 43 with the highest bioactivity was selected as a template, and the other molecules were aligned on it by common substructure alignment and manual adjustment. The common skeleton (red atoms) for the molecular alignment is shown in Figure 8a, and the superimposed structures of the training set are shown in Figure 8b.

3.2. CoMFA and CoMSIA Models

The 3D-QSAR models were generated using the CoMFA and CoMSIA methods which could help us better understand visually the relationships between the structural features of DAPYs and their inhibitory activity [21]. The alignment quality has an important impact on the robustness and predictivity of the generated models [22]. The contour maps of the CoMFA and CoMSIA models were graphically presented using the field type of “Stdev*Coeff”. For the CoMFA models, the physicochemical properties, such as the steric and electrostatic fields, were calculated at every grid point of a regularly grid spacing of 2.0 Å, using a sp3 hybridized carbon probe with a +1 charge. For the CoMSIA models, five physicochemical properties, including steric, electrostatic, hydrophobic, hydrogen-bond donor and acceptor fields, were respectively calculated by using the same lattice box that were also used in the CoMFA model and a sp3 carbon probe with +1 charge, +1 hydrophobicity, +1 hydrogen-bond donor, and +1 hydrogen-bond acceptor properties.
To verify the reliability of the generated models, internal validation and external validation are usually performed [23]. The leave-one-out (LOO) method is used for the internal validation and extracts a molecule from the dataset as a test set and considers the rest of the molecules as a training set to generate the QSAR models and predict the extracted molecule. This methodology can gain the optimal number of components (ONC) based on the highest cross-validated correlation coefficient ( q 2 ) [23,24], which is defined as follows:
q 2 = 1 ( r pred r exp ) 2 ( r exp r mean ) 2
where r pred, r exp, and r mean represent the predicted, experimental, and mean pEC50 values, respectively.
For the external validation, the predictive correlation coefficient ( r pred 2 ) is usually used to judge the quality of prediction, which can be calculated according to the following formula:
r pred 2 = SDEP PRESS SDEP
where the standard deviation error of predictions (SDEP) is the sum of the squared deviations between the experimental activities of the test set and the mean activities of the training set compounds, and the predicted residuals sum of squares (PRESS) is the sum of the squared deviations between the predicted and the experimental activity for all compounds of the test set.
In addition, a novel metric r m 2 , is also used for additional internal validation (training set validation) and external validation (test set validation) represented by r m ( LOO ) 2 and r m ( test ) 2 , respectively. This metric can be calculated according to the following equation:
r m 2 = r 2 × ( 1 r 2 r 0 2 )
where r 2 and r 0 2 are determination coefficients for the least squares regression with and without intercept, respectively, which is based on predicted pEC50 values in the x-axis and experimental pEC50 values in the y-axis.
In order to avoid the overestimation of the predicted quality resulting from classical metrics ( q 2 and r pred 2 ), several other important validation parameters such as RMSE (root mean square error), MAE (mean absolute error) [25], k, k’, and different r m 2 values ( r m / 2 , Δ r m 2 and r m 2 ¯ ) are also used to estimate the quality of the predictions. A model is eligible to be selected for further analysis if the following requirements are satisfied: q 2 > 0.5, R 2 > 0.6, r pred 2 > 0.5, 0.85 ≤ k (or k’) ≤ 1.15, r 2     r 0   2 ( r 0 2 ) r 2 < 0.1 , Δ r m 2 < 0.2 and r m 2 ¯ > 0.5 [23,25,26].

3.3. Pharmacophore Model

The pharmacophore hypothesis model was generated using the Tripos proprietary technology, GALAHAD, which is capable of identifying a set of ligand conformations of the optimal combination and is mainly determined by strain energy (SE), steric overlap (SO), and pharmacophoric similarity (PhS) [27].
To avoid redundancy of information, similar compounds with similar affinities were removed. Nine molecules were chosen to develop the pharmacophore model on the basis of their high activities and diverse structures. These compounds were aligned with each other, with a population size of 50 and a maximum generation of 100. Then GALAHAD parameters were set to Hypermolecule Construction. Default values were used for the other settings. According to the Pareto ranking, the model with the best SE, SO, and PhS values was chosen for analysis.

3.4. Molecular Docking

It is well known that molecular docking is of great significance to understand the mechanisms of interaction between the ligand and the receptor protein when designing new chemical molecules. In order to analyze the intermolecular interactions between DAPYs/CAPYs and HIV-1 RT effectively, molecular docking was implemented using the surflex-docking package of Sybyl-X 2.1. A cocrystal of WT HIV-1 RT with TMC125 (3MEC), whose ligand is highly similar to DAPYs, was obtained from RCSB Protein Data Bank. Before docking, 3MEC was prepared by removing water and sulfate ions and extracting the ligand [28]. Besides that, addition of hydrogen and charges and treatment of the terminal residues were also performed on 3MEC. Then, the “protomol” was generated by adopting the ligand-based mode, and an appropriate binding pocket was formed [29]. The reliability validation of the surflex-docking was conducted by redocking the cognate ligand into the binding pocket. Next, all of the DAPYs were docked into the binding pocket, and 20 possible docked conformations were obtained with different scores. Finally, the docked conformations of the most active compound 43 and the least active compound 46 were used to analyze the interaction mechanism.

4. Conclusions

In this paper, 3D-QSAR, pharmacophore, and docking studies were performed on 52 DAPY derivatives to investigate the relationships between their structures and anti-HIV activity. The CoMFA and CoMSIA models with high statistical significance and good predictive capacity were constructed, and a potential pharmacophore model was established. The docking results demonstrated the interaction modes of DAPYs in the binding pocket of the HIV-1 RT and suggested that the left phenyl ring of DAPYs played a key role in anti-HIV-1 activity. The pharmacophore model and 3D-QSAR contour maps allowed the visualization of the feature requirements to improve the activity. Several novel DAPYs with enhanced predicted activity were designed. However, these newly designed DAPYs remain to be synthesized and tested. Their pharmacokinetic profiles also need to be determined if they exhibit improved inhibitory activities against HIV-1 RT. Overall, the constructed models and obtained information have potential to be applied for further rational design of novel and potent DAPY analogues.

Author Contributions

G.L., S.G., and X.J. conceived and designed the experiments; G.L. and W.W. performed the experiments; G.L., W.W., and Y.W. analyzed the data; G.L. and W.W. wrote the paper.

Acknowledgments

We gratefully acknowledge financial support from the Graduate Innovative Fund of Wuhan Institute of Technology (No. CX2017141), the Natural Science Foundation of Hubei Province of China (No. 2017CFB121), and the Hubei Provincial Department of Education of China (No. Q20171503).

Conflicts of Interest

The authors declare no conflict of interest.

Abbreviations

DAPYdiarylpyrimidine
NNRTInonnucleoside reverse transcriptase inhibitor
AIDSacquired immunodeficiency syndrome
3D-QSARthree-dimensional quantitative structure-activity relationship
CoMFAcomparative molecular field analysis
CoMSIAcomparative molecular similarity indices analysis
HIVhuman immunodeficiency virus
HAARThighly active antiretroviral therapy
RTreverse transcriptase
HIV-1HIV type 1
WTwild-type
CAPYcycloalkyl arylpyrimidine
q 2 cross-validated correlation coefficient
ONCoptimal number of components
R 2 non-cross-validated correlation coefficient
r pred 2 predictive correlation coefficient
SEEstandard error of estimate
FF-statistic values
RMSEroot mean square error
MAEmean absolute error
GALAHADGenetic Algorithm with Linear Assignment of Hypermolecular Alignment of Datasets
SEstrain energy
SOsteric overlap
PhSpharmacophoric similarity
DAhydrogen-bond donor atom
AAhydrogen-bond acceptor atom
HYhydrophobe
RMSDroot-mean-square deviation
LOOleave one out
SDEPstandard deviation error of predictions
PRESSpredicted residuals sum of squares

References

  1. Fauci, A.S. HIV and AIDS: 20 years of science. Nat. Med. 2003, 9, 839–843. [Google Scholar] [CrossRef] [PubMed]
  2. Chen, X.; Zhan, P.; Li, D.; De Clercq, E.; Liu, X. Recent advances in DAPYs and related analogues as HIV-1 NNRTIs. Curr. Med. 2011, 18, 359–376. [Google Scholar] [CrossRef]
  3. Das, K.; Martinez, S.E.; Bauman, J.D.; Arnold, E. HIV-1 reverse transcriptase complex with DNA and nevirapine reveals non-nucleoside inhibition mechanism. Nat. Struct. Mol. Biol. 2012, 19, 253–259. [Google Scholar] [CrossRef] [PubMed]
  4. World Health Organization. Available online: http://www.who.int/gho/publications/world_health_statistics/en/ (accessed on 31 July 2017).
  5. Gu, S.X.; Qiao, H.; Zhu, Y.Y.; Shu, Q.C.; Liu, H.; De Clercq, E.; Balzarini, J.; Pannecouque, C. A novel family of diarylpyrimidines (DAPYs) featuring a diatomic linker: Design, synthesis and anti-HIV activities. Bioorg. Med. Chem. 2015, 23, 6587–6593. [Google Scholar] [CrossRef] [PubMed]
  6. Unissa, A.N.; Hanna, L.E. Insights into computational analysis of HIV-1 reverse transcriptase resistance to non-nucleoside inhibitors: Efavirenz, etravirine, nevirapine and rilpivine. Int. J. Pharma Bio Sci. 2017, 8, 839–848. [Google Scholar] [CrossRef]
  7. De Clercq, E. The role of non-nucleoside reverse transcriptase inhibitors (NNRTIs) in the therapy of HIV-1 infection. Antivir. Res. 1998, 38, 153–179. [Google Scholar] [CrossRef]
  8. Lu, H.H.; Xue, P.; Zhu, Y.Y.; Jiu, X.L.; Zhen, X.J.; Zhan, X.; Xiao, T.; Christophe, P.; Li, T.T.; Gu, S.X. Structural modifications of diarylpyrimidines (DAPYs) as HIV-1 NNRTIs: Synthesis, anti-HIV activities and SAR. Bioorg. Med. Chem. 2017, 25, 2491–2497. [Google Scholar] [CrossRef] [PubMed]
  9. Croxtall, J.D. Etravirine: A review of its use in the management of treatment-experienced patients with HIV-1 infection. Drugs 2012, 72, 847–869. [Google Scholar] [CrossRef] [PubMed]
  10. Schafer, J.J.; Short, W.R. Rilpivirine, a novel non-nucleoside reverse transcriptase inhibitor for the management of HIV-1 infection: A systematic review. Antivir. Ther. 2012, 17, 1495–1502. [Google Scholar] [CrossRef] [PubMed]
  11. Gu, S.X.; Yang, S.Q.; He, Q.Q.; Ma, X.D.; Chen, F.E.; Dai, H.F.; De Clercq, E.; Jan, B.; Christophe, P. Design, synthesis and biological evaluation of cycloalkyl arylpyrimidines (CAPYs) as HIV-1 NNRTIs. Bioorg. Med. Chem. 2011, 19, 7093–7099. [Google Scholar] [CrossRef] [PubMed]
  12. Tong, J.; Wu, Y.; Bai, M.; Zhan, P. 3D-QSAR and molecular docking studies on HIV protease inhibitors. J. Mol. Struct. 2016, 1129, 17–22. [Google Scholar] [CrossRef]
  13. Kumar, S.; Tiwari, M. Topomer-CoMFA-based predictive modelling on 2,3-diaryl-substituted-1,3-thiazolidin-4-ones as non-nucleoside reverse transcriptase inhibitors. Med. Chem. Res. 2014, 24, 245–257. [Google Scholar] [CrossRef]
  14. Maltarollo, V.G.; Silva, D.C.; Honório, K.M. Advanced QSAR studies on PPARδ ligands related to metabolic diseases. J. Braz. Chem. Soc. 2012, 23, 78–84. [Google Scholar] [CrossRef]
  15. Khan, K.M.; Wadood, A.; Ali, M.; Lodhi, M.A.; Khan, M.; Perveen, S.; Choudhary, M.I. Identification of potent urease inhibitors via ligand- and structure-based virtual screening and in vitro assays. J. Mol. Graph. Model. 2010, 28, 792–798. [Google Scholar] [CrossRef] [PubMed]
  16. Wang, J.; Zhan, P.; Li, Z.; Liu, H.; De Clercq, E.; Pannecouque, C.; Liu, X. Discovery of nitropyridine derivatives as potent HIV-1 non-nucleoside reverse transcriptase inhibitors via a structure-based core refining approach. Eur. J. Med. Chem. 2014, 76, 531–538. [Google Scholar] [CrossRef] [PubMed]
  17. Zhou, Z.; Madrid, M.; Madura, J.D. Docking of non-nucleoside inhibitors: Neotripterifordin and its derivatives to HIV-1 reverse transcriptase. Proteins 2002, 49, 529–542. [Google Scholar] [CrossRef] [PubMed]
  18. Barreiro, G.; Guimarães, C.R.; Tubert-Brohman, I.; Lyons, T.M.; Tirado-Rives, J.; Jorgensen, W.L. Search for non-nucleoside inhibitors of HIV-1 reverse transcriptase using chemical similarity, molecular docking, and MM-GB/SA scoring. J. Chem. Inf. Model. 2007, 47, 2416–2428. [Google Scholar] [CrossRef] [PubMed]
  19. Xue, P.; Lu, H.H.; Zhu, Y.Y.; Jiu, X.L.; Christophe, P.; Zheng, X.J.; Liu, G.Y.; Zhang, X.L.; Gu, S.X. Design and synthesis of hybrids of diarylpyrimidines and diketo acids as HIV-1 inhibitors. Bioorg. Med. Chem. Lett. 2017, 27, 1640–1643. [Google Scholar] [CrossRef] [PubMed]
  20. Ghaleb, A.; Aouidate, A.; Ghamali, M.; Sbai, A.; Bouachrine, M.; Lakhlifi, T. 3D-QSAR modeling and molecular docking studies on a series of 2,5 disubstituted 1,3,4-oxadiazoles. J. Mol. Struct. 2017, 1145, 278–284. [Google Scholar] [CrossRef]
  21. Fatemi, M.H.; Heidari, A.; Gharaghani, S. QSAR prediction of HIV-1 protease inhibitory activities using docking derived molecular descriptors. J. Theor. Biol. 2015, 369, 13–22. [Google Scholar] [CrossRef] [PubMed]
  22. Li, S.R.; Fan, J.L.; Peng, C.K.; Chang, Y.Q.; Guo, L.X.; Hou, J.S.; Huang, M.Q.; Wu, B.Y.; Zheng, J.X.; Lin, L.X.; et al. New molecular insights into the tyrosyl-tRNA synthase inhibitors: CoMFA, CoMSIA analyses and molecular docking studies. Sci. Rep. 2017, 7, 11525. [Google Scholar] [CrossRef] [PubMed]
  23. Ojha, P.K.; Mitra, I.; Das, R.N.; Roy, K. Further exploring r m 2 metrics for validation of QSPR models. Chemom. Intell. Lab. Syst. 2011, 107, 194–205. [Google Scholar] [CrossRef]
  24. Elidrissi, B.; Ousaa, A.; Aouidate, A.; Zaki, H.; Ajana, M.; Lakhlif, T.; Bouachrine, M. 3D-QSAR studies of isatin derivatives with anti-cancer in vitro: Advanced CoMFA, CoMSIA and docking methods. Chem. Sci. J. 2017, 8, 158. [Google Scholar] [CrossRef]
  25. Roy, K.; Das, R.N.; Ambure, P.; Aher, R.B. Be aware of error measures. Further studies on validation of predictive QSAR models. Chemom. Intell. Lab. Syst. 2016, 152, 18–33. [Google Scholar] [CrossRef]
  26. Golbraikh, A.; Tropsha, A. Beware of q2! J. Mol. Graph. Model. 2002, 20, 269–276. [Google Scholar] [CrossRef]
  27. Caballero, J. 3D-QSAR (CoMFA and CoMSIA) and pharmacophore (GALAHAD) studies on the differential inhibition of aldose reductase by flavonoid compounds. J. Mol. Graph. Model. 2010, 29, 363–371. [Google Scholar] [CrossRef] [PubMed]
  28. Ma, X.D.; Yang, S.Q.; Gu, S.X.; He, Q.Q.; Chen, F.E.; De Clercq, E.; Jan, B.; Christophe, P. Synthesis and anti-HIV activity of aryl-2-[(4-cyanophenyl)amino]-4-pyrimidinone hydrazones as potent non-nucleoside reverse transcriptase inhibitors. ChemMedChem 2011, 6, 2225–2232. [Google Scholar] [CrossRef] [PubMed]
  29. Joshi, S.D.; Dixit, S.R.; Kirankumar, M.N.; Aminabhavi, T.M.; Raju, K.V.; Narayan, R.; Lherbet, C.; Yang, K.S. Synthesis, antimycobacterial screening and ligand-based molecular docking studies on novel pyrrole derivatives bearing pyrazoline, isoxazole and phenyl thiourea moieties. Eur. J. Med. Chem. 2016, 107, 133–152. [Google Scholar] [CrossRef] [PubMed]
Figure 1. Structures of diarylpyrimidines (DAPYs) and cycloalkyl arylpyrimidines (CAPYs). The DAPYs scaffold includes a left wing (L), a right wing (R), a central pyrimidine ring (C), and the linkers.
Ijms 19 01436 g001
Figure 2. Scatter pot of actual against predicted pEC50 values. (a) CoMFA model; (b) CoMSIA model.
Ijms 19 01436 g002
Figure 3. The contour maps of the steric and electrostatic fields in combination with compound 43. Steric fields: favored (green) and disfavored (yellow). Electrostatic fields: electropositive (blue) and electronegative (red). (a,b) CoMFA model; (c,d) CoMSIA model.
Ijms 19 01436 g003
Figure 4. The CoMSIA contour maps in combination with compound 43. (a) Hydrophobic fields: hydrophobic (orange) and hydrophilic (white). (b) Hydrogen-bond donor fields: favored (cyan) and disfavored (purple, not present). (c) Hydrogen-bond acceptor fields: favored (green, not present) and disfavored (violet).
Ijms 19 01436 g004
Figure 5. The pharmacophore model with the alignment of nine training set compounds. The magenta, green, and cyan spheres represent hydrogen-bond donor atoms (DAs), hydrogen-bond acceptor atoms (AAs), and hydrophobes (HYs), respectively.
Ijms 19 01436 g005
Figure 6. The superimposition of docked compounds and binding pocket. (a) The superimposition of the cognate etravirine and the redocked etravirine. The magenta sticks represent the cognate etravirine, and the white sticks represent the redocked etravirine. (b) The green region represents the surface of the binding pocket. (c) Superimposition of compounds 43, 46, and redocked etravirine. The orange sticks represent the compound 43 with highest activity; the purple sticks represent the compound 46 with lowest activity; the white sticks represent redocked etravirine.
Ijms 19 01436 g006
Figure 7. Docking results of compounds 43 (a) and 46 (c) in the nonnucleoside binding site of human immunodeficiency virus type 1 (HIV-1) reverse transcriptase (RT). Hydrogen bonds are shown as yellow lines, and compounds 43 and 46 are represented as green sticks. The schematic diagram of the interacting modes for compound 43 (b) and 46 (d), respectively.
Ijms 19 01436 g007
Figure 8. Compound 43 was used for the alignment of all molecules. (a) The structure of compound 43 corresponding to the common scaffold is in red; (b) Alignment of the training set compounds.
Ijms 19 01436 g008
Table 1. Classical statistical parameters of the comparative molecular field analysis (CoMFA) and comparative molecular similarity indices analysis (CoMSIA) models.
Model q 2 ONC R 2 r pred 2 SEEFFiled Contribution (%)
EHSDA
CoMFAE + S0.67980.9830.8840.136229.75653.7046.30
CoMSIAE + H + S0.72190.9720.7340.180114.91252.4032.4015.20
E + S + D + A0.70590.9470.7430.24759.27858.8014.9014.0012.20
E + H + D + A0.695110.9870.8260.125198.21645.1034.0012.608.20
E + H + S + A0.7490.9840.8270.135206.77344.8029.7013.6011.90
E + H + S + D0.70390.9720.6980.178117.71348.7029.7014.307.30
E + H + S + D + A0.73490.9850.8910.132215.60941.4027.6012.3011.207.50
q 2 : cross-validated correlation coefficient; ONC: optimal number of components; R 2 : non-cross-validated correlation coefficient; r pred 2 : predictive correlation coefficient; SEE: standard error of estimate; F: F-statistic values; E: electrostatic fields; H: hydrophobic fields; S: steric fields; D: hydrogen-bond donor fields; A: hydrogen-bond acceptor fields.
Table 2. External validation parameters of the CoMFA and CoMSIA models.
StatisticsCoMFA (E + S)CoMSIA (E + H + S + D + A)
Training SetTest SetTraining SetTest Set
RMSE0.1600.155
MAE0.1240.108
r 2 0.98340.87640.98480.8657
r 0 2 0.98300.84540.98480.8613
r 0 2 0.98310.87500.98450.8144
k1.00030.84081.00001.0848
k’0.98310.99820.99970.9917
r m 2 0.96370.72210.98480.8083
r m / 2 0.96640.84360.96770.6696
Δ r m 2 0.00260.12150.01710.1387
r m 2 ¯ 0.96900.78290.97630.7389
RMSE: root mean square error; MAE: mean absolute error.
Table 3. Chemical structures of the selected DAPYs and CAPYs and their actual and predicted pEC50 values.
Ijms 19 01436 i001
No.TypeXR1R2CyActual pEC50CoMFACoMSIA
PredictedResidualsPredictedResiduals
1IO2-Cl7.4697.318−0.1517.355−0.114
2IO3-Cl7.3107.161−0.1497.3840.074
3IO4-Cl6.0766.1720.0965.769−0.307
4IO2-Br7.4447.283−0.1617.442−0.002
5 *IO3-Br7.3197.196−0.1237.277−0.042
6IO4-Br5.3285.7270.3995.7330.405
7 *IO2-F8.2378.4540.2177.750−0.487
8IO3-F7.8547.737−0.1177.848−0.006
9IO4-F6.0365.964−0.0725.927−0.109
10IO2-CH36.7966.9740.1786.8310.035
11 *IO3-CH38.0567.834−0.2228.1240.068
12IO4-CH36.7966.776−0.0206.8110.015
13IO2-OCH37.5697.551−0.0187.488−0.081
14IO3-OCH37.6027.6540.0527.587−0.015
15IO4-OCH36.0006.0800.0806.0610.061
16IO2-CF35.7705.8700.1005.644−0.126
17IO3-CF36.2156.197−0.0186.2810.066
18IO3,5-diMeO8.0518.0860.0358.0800.029
19IO5-F-2-Br7.4097.4110.0027.404−0.005
20 *IO2-F-4-Br6.6586.8410.1836.465−0.193
21IO2-CN7.8548.0000.1467.8720.018
22IO3-CN6.7456.8050.0606.700−0.045
23IO4-CN5.8545.691−0.1635.829−0.025
24 *IOH7.6587.8870.2297.485−0.173
25IO1-NaPh7.8247.9010.0777.804−0.020
26IO2-NaPh6.7706.726−0.0446.7720.002
27 *INHH8.2768.139−0.1378.036−0.240
28INH2-Cl7.8277.9560.1297.9730.146
29INH3-Cl7.9247.707−0.2177.9350.011
30INH4-Cl7.3227.106−0.2167.216−0.106
31 *INH2-Br7.3767.6940.3187.026−0.350
32INH3-Br7.6937.7570.0647.628−0.065
33INH4-Br7.4057.389−0.0167.223−0.182
34INH3-F8.3578.271−0.0868.3620.005
35INH4-F7.1437.099−0.0447.3630.220
36INH4-CH38.0868.047−0.0398.1460.060
37 *INH2-OCH37.0587.2700.2127.2300.172
38INH3-OCH38.3478.338−0.0098.3550.008
39 *INH4-OCH37.4067.6850.2797.363−0.043
40INH2-CF35.9765.771−0.2056.1010.125
41INH3-CF36.6876.7440.0576.615−0.072
42INH4-CF36.8956.9730.0786.9830.088
43INH3,4-diMe8.5238.6400.1178.408−0.115
44INH2,4-diF7.7727.8540.0827.7980.026
45 *IIOHHcyclohexyl5.9365.775−0.1616.1300.194
46IIOHHcyclopentyl5.1735.140−0.0335.2970.124
47IIOHCH3cyclohexyl5.1885.162−0.0265.178−0.010
48IINHHHcyclohexyl6.0186.0460.0285.903−0.115
49IINHHHcyclopentyl5.8015.8080.0075.746−0.055
50 *IISHHcyclohexyl7.2606.874−0.3867.3710.111
51IISHCH3cyclohexyl6.3676.3800.0136.4250.058
52 *IISCH3Hcyclohexyl7.0186.633−0.3857.3990.381
* represents test set molecules.
Table 4. Distances and angles of hydrogen bonds formed between 3MEC and the docked compounds (43 and 46).
ReceptorLigandHydrogen-Bond ReceptorHydrogen-Bond DonorDistance (Å)Angle (°)
3MEC43–O (Lys101 –C=O)–N (–NH)1.725151.02
–N (pyrimidine)–N (Lys101 –NH2)2.302168.45
46–O (Lys101 –C=O)–N (–NH)1.843157.47
–N (pyrimidine)–N (Lys101 –NH2)2.477163.30
Table 5. Chemical structure of newly designed DAPYs and their predicted pEC50 values based on the CoMFA and CoMSIA models.
Ijms 19 01436 i002
No.R1XPredicted pEC50
CoMFACoMSIA
534-CH2CH3NH8.6559.508
544-CH(CH3)2NH8.76510.212
554-C(CH3)3NH8.2768.959
564-NH2NH8.6959.050
573-CNNH8.3348.584
583-NO2NH8.3068.281
593-OOCCH3NH8.2278.873
603-OHNH9.0209.026
612-OHNH7.8458.690
622-F, 4-CH3NH8.6759.388

