Article

Quantitative Changes in the Transcription of Phytohormone-Related Genes: Some Transcription Factors Are Major Causes of the Wheat Mutant dmc Not Tillering

1
National Centre of Engineering and Technological Research for Wheat/Key Laboratory of Physiological Ecology and Genetic Improvement of Food Crops in Henan Province, Henan Agricultural University, Zhengzhou 450046, Henan, China
2
Shangqiu Academy of Agricultural and Forestry Sciences, Shangqiu 476000, Henan, China
*
Author to whom correspondence should be addressed.
Int. J. Mol. Sci. 2018, 19(5), 1324; https://doi.org/10.3390/ijms19051324
Submission received: 18 March 2018 / Revised: 26 April 2018 / Accepted: 26 April 2018 / Published: 29 April 2018

Abstract

:
Tiller number is an important agronomic trait for grain yield of wheat (Triticum aestivum L.). A dwarf-monoculm wheat mutant (dmc) was obtained from cultivar Guomai 301 (wild type, WT). Here, we explored the molecular basis for the restrained tiller development of the mutant dmc. Two bulked samples of the mutant dmc (T1, T2 and T3) and WT (T4, T5 and T6) with three biological replicates were comparatively analyzed at the transcriptional level by bulked RNA sequencing (RNA-Seq). In total, 68.8 Gb data and 463 million reads were generated, 80% of which were mapped to the wheat reference genome of Chinese Spring. A total of 4904 differentially expressed genes (DEGs) were identified between the mutant dmc and WT. DEGs and their related major biological functions were characterized based on GO (Gene Ontology) and KEGG (Kyoto Encyclopedia of Genes and Genomes) categories. These results were confirmed by quantitatively analyzing the expression profiles of twelve selected DEGs via real-time qRT-PCR. The down-regulated gene expressions related to phytohormone syntheses of auxin, zeatin, cytokinin and some transcription factor (TF) families of TALE, and WOX might be the major causes of the mutant dmc, not tillering. Our work provides a foundation for subsequent tiller development research in the future.

1. Introduction

Wheat (Triticum aestivum L.) is one of the most important food crops in the world. Since tiller number is an important agronomic trait for grain yield [1,2], it has always been one of the key traits to select in breeding programs. Generally, low and high tillering wheat mutants do not have very high grain yield. Moreover, tiller number as well as grain number and weight affect yield.
Mutants with various tillering abilities are ideal materials for the study of tiller developmental molecular mechanisms. Four tiller inhibition lines or mutants have been reported in wheat. Among the tiller inhibition genes, tin1, tin3 and ftin are recessive, and they have been mapped on chromosome (Chr.) 1AS [3], 3A [1] and 1AS [4], respectively; tin2 is a dominant gene mapped on Chr. 2A [5]. One wheat high tillering mutant harbors a major quantitative trait locus (QTL; QHt.nau-2D) on Chr. 2DS [6]. In barley (Hordeum vulgare), the tiller inhibition genes lnt1, als1, cul4, int-b and uzu have been reported, and they have been mapped on Chr. 3HL [7], 3HL [8], 3HL [9], 5HL [9] and 3 HL [9], respectively. Many tiller related mutants have also been reported in rice (Oryza sativa) [10,11,12].
Tillering is a very complex trait; in addition to genetic factors, it can also be significantly affected by soil fertility and other environmental factors. Many studies showed that tillering is controlled by QTLs in wheat [13,14,15,16], rice [17,18,19], barley [20,21] and rye (Secale cereale) [22]. However, it is clear that some tiller traits are controlled by qualitative genes as described above. In Arabidopsis, the MORE AXILLARY GROWTH 1 (MAX1) genes encoding cytochrome P450 and MAX2 control shoot lateral branching [23,24]. The MAX4 genes encoding CAROTENOID CLEAVAGE DIOXYGENASE 8 (CCD8) and MAX3 genes encoding CCD7 regulate shoot branching [25,26]; MAX1 acts downstream of MAX3 and MAX4. The MAX1 genes are related to the strigolactone (SL) signaling pathway [24]. In comparison to the model species Arabidopsis, only a few genes affecting tiller initiation and outgrowth have been cloned and described in crops. For example, the rice gene MONOCULM 1 (MOC1) encodes a GRAS (GIBBERELLIC-ACID INSENSITIVE (GAI), REPRESSOR of GAI (RGA) and SCARECROW (SCR)) domain-containing protein that affects the initiation and outgrowth of axillary meristems [27,28]. Mutant lines that do not have a functional moc1 gene exhibit a severe reduction in tiller number. The rice gene Tillering and Dwarf 1 (TAD1), which encodes a multi-subunit E3 ligase, regulates rice tillering by degenerating MOC1 [29]. The rice TEOSINTE BRANCHED 1 (OsTB1) gene encodes a TCP domain protein and negatively regulates lateral branching [30]. In barley, the INTERMEDIUM-C (INT-C) gene is an ortholog of maize and rice TB1 genes which has an effect on seedling tiller number [31]. The barley uzu gene encodes a putative brassinosteroid (BR) receptor HvBRI1 and regulates tiller number [32]. In bread wheat, overexpression of tae-miR156 significantly affects tillering, probably by regulating a group of SQUAMOSA PROMOTER BINDING PROTEIN-LIKE (SPL) genes; furthermore, miR156-TaSPLs and strigolactone signaling pathways might have a potential association with tillering [33]. Overexpression of the maize tb1 gene in wheat results in reduced tillering [34]. The molecular mechanism of wheat tillering remains largely unknown.
At present, the RNA-Sequencing technique has been widely used to identify differentially expressed genes (DEGs) among various biological samples, so as to explore the possible mechanisms leading to various morphologies [35,36]. Transcriptome analyses regarding tiller developments in switchgrass (Panicum virgatum L.) and sorghum (Sorghum bicolor L.) have been reported [37,38,39]. In this study, a wheat mutant that does not develop tillers was obtained from the ethyl methanesulfonate (EMS)-treated wheat cultivar Guomai 301 (WT), which was designated as dmc (dwarf-monoculm). We characterized the mutant dmc and WT at the transcriptome level by RNA-sequencing technology.

2. Results

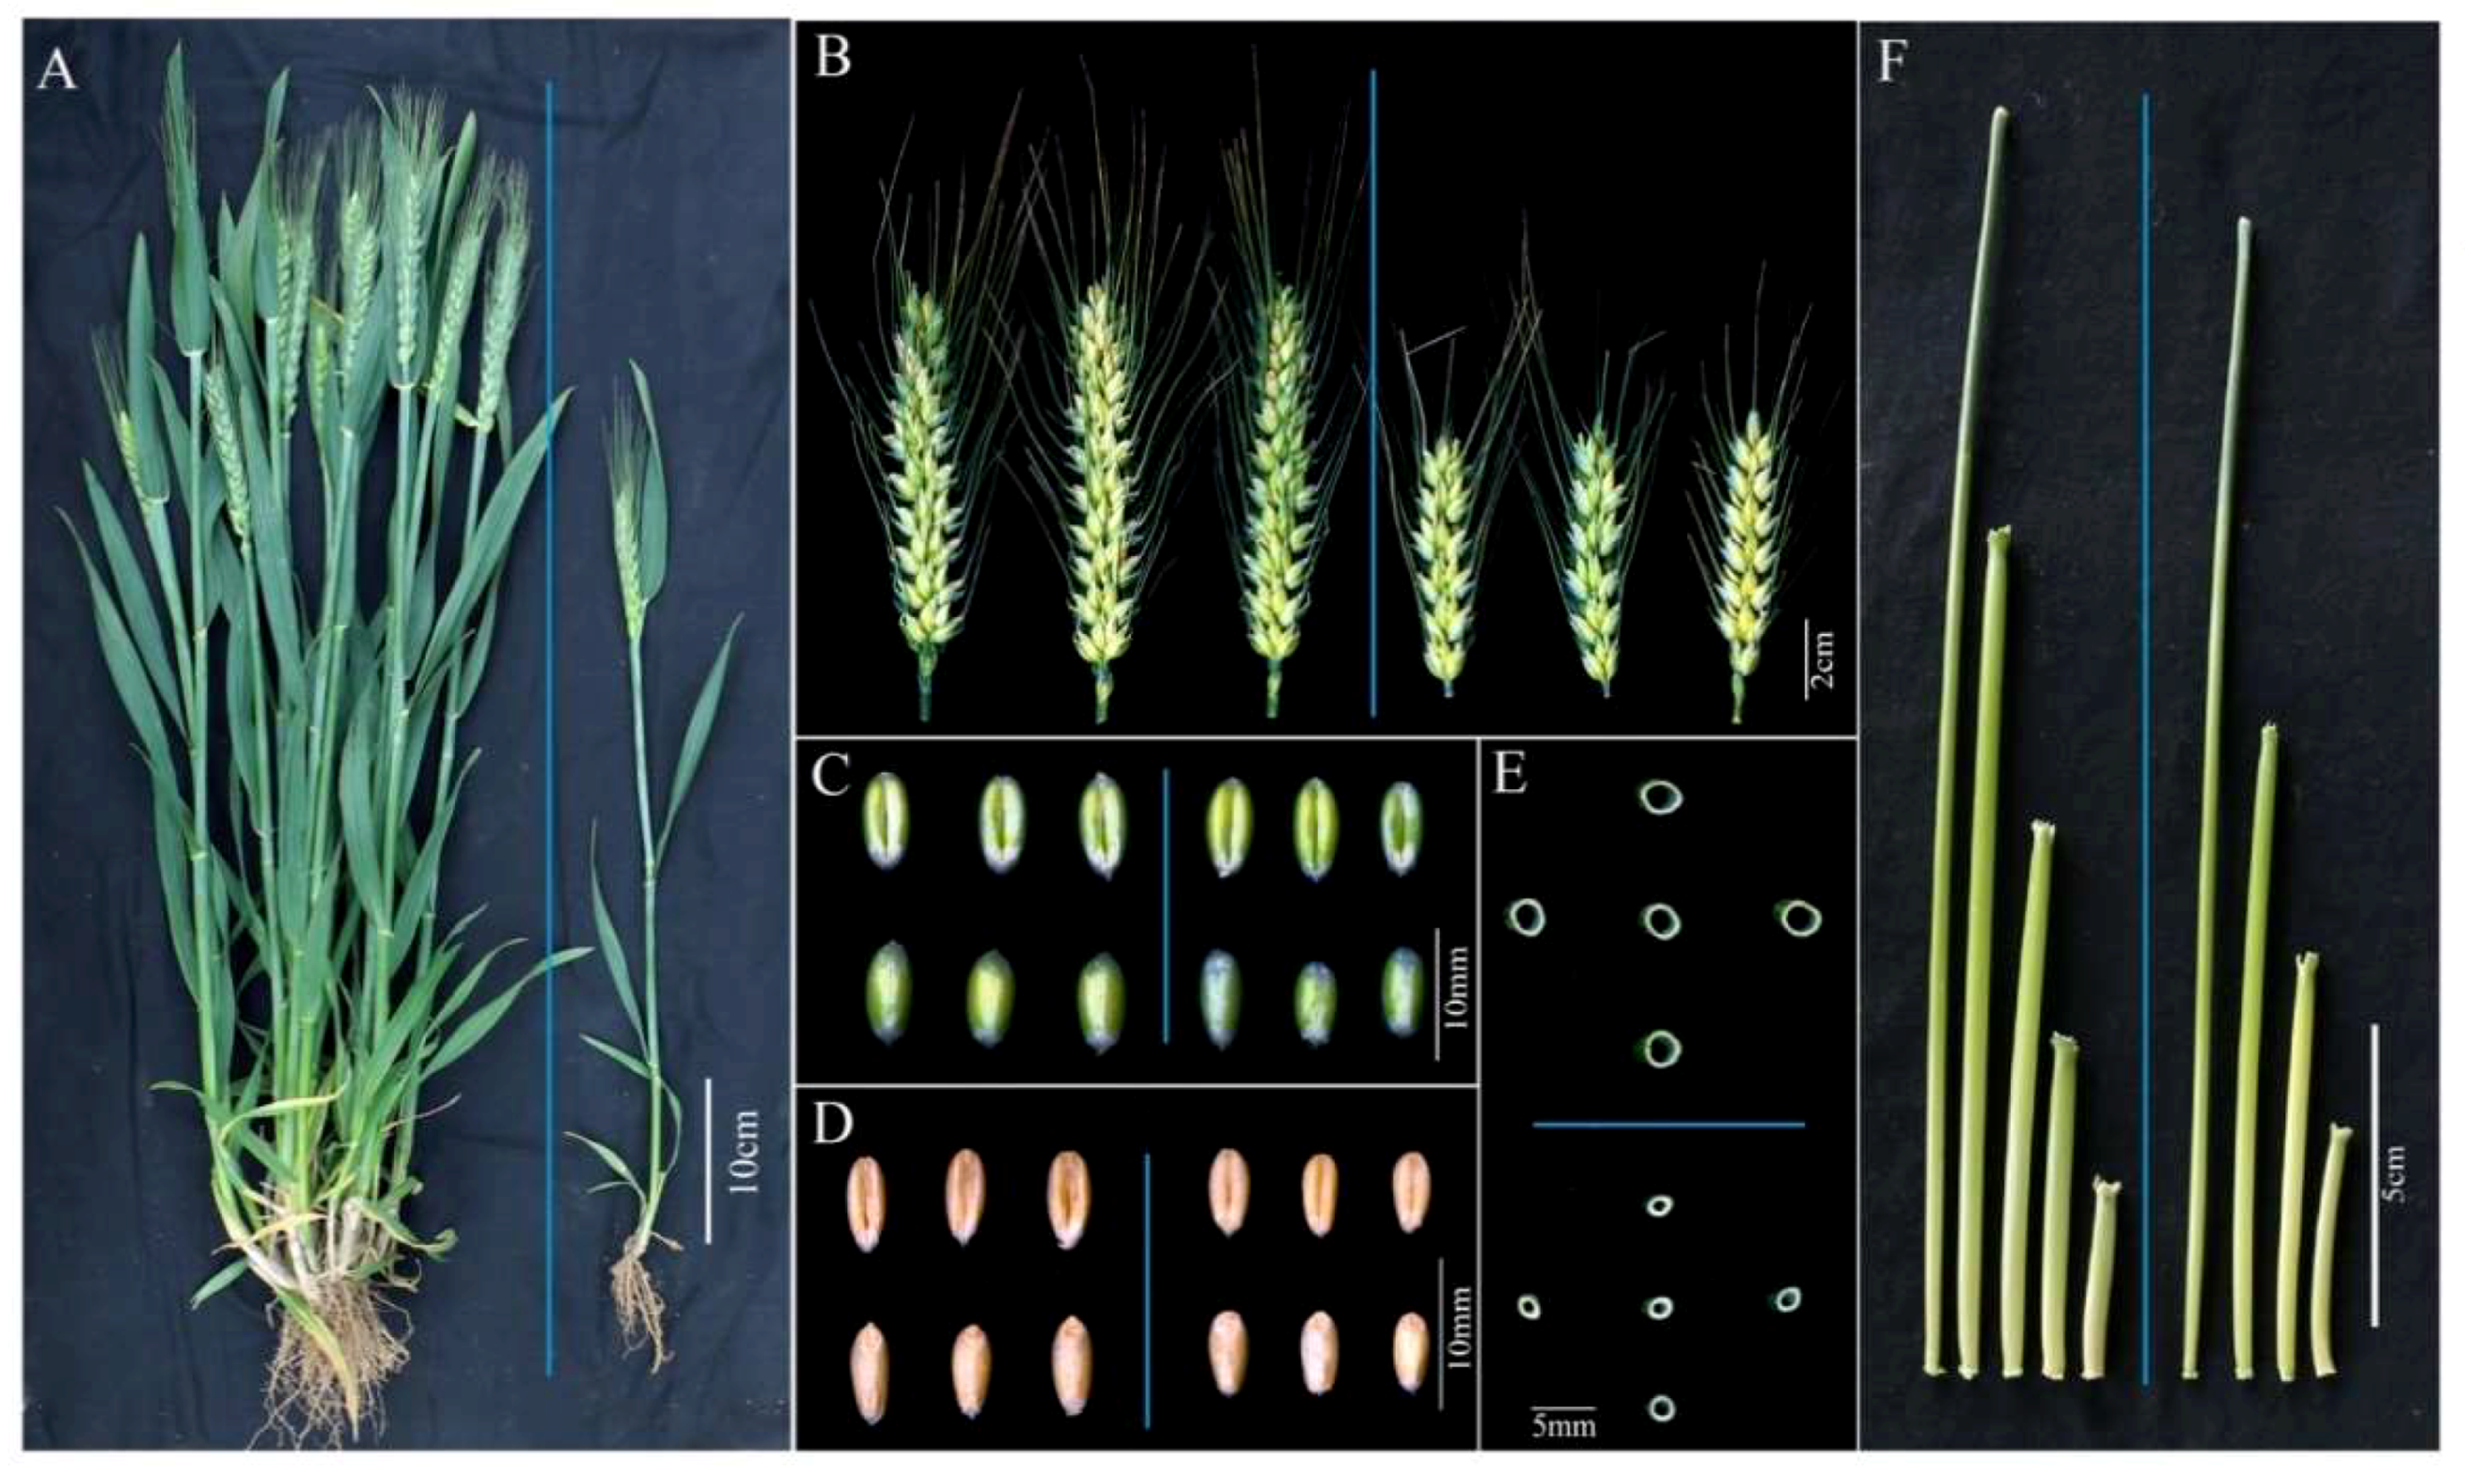
2.1. Morphology of the dmc Mutant

The mutant dmc was obtained from wheat cultivar “Guomai 301” treated with EMS. Mutant dmc basically does not tiller, and only has a main stem (Table 1, Figure 1A). Some individuals occasionally have a small tiller number. The plant height of the mutant dmc was significantly lower than that of the WT, i.e., 48.00 cm, which was 74.53% of the WT height (Table 1, Figure 1A). Both the spike length and the seed length of the mutant dmc were shorter than those of the WT (Table 1, Figure 1B–D). The diameters of the internodes of the mutant dmc were reduced (Figure 1E). The internode number of the mutant dmc was four; however, that of the WT was five (Table 1, Figure 1F). Additionally, we continuously observed and compared the tillers of the mutant dmc and WT from the early tillering stage. The mutant dmc had no or one tiller at the early tillering stage (Figure 2C), and it had no more tillers during the middle tillering period. Its tillering was significantly inhibited (Figure 2D). Generally, the mutant dmc had only one main stem at the jointing stage (Figure 2E). The tiller primordia (Figure S1) were used as samples for transcriptomic analysis in this study. Tiller primordium samples were dissected at the three-leaf stage to four-leaf stage. Two super bulk samples of the mutant dmc (T1, T2, and T3) and WT (T4, T5, and T6) with three biological replicates were prepared. Each bulk sample included more than ten independent individuals.

2.2. Genetic Diversity between the WT and Mutant dmc

To validate whether the dmc was derived from random open pollination in the field, Polymerase Chain Reaction (PCR) amplification of the WT and mutant dmc were carried out with 431 primer pairs of wheat Simple Sequence Repeats (SSR) markers evenly distributed on 21 wheat chromosomes. There was no polymorphic SSR locus between WT and mutant dmc (Figure S2), which demonstrated that their genetic backgrounds were highly consistent. This demonstrated that dmc was a real mutant derived from WT.

2.3. RNA Sequencing Data

Six libraries were analyzed using RNA sequencing (mutant dmc: T1, T2, T3; WT: T4, T5, T6). We obtained a total of 68.8 Gb clean bases and about 463 million reads (single-end reads) (Table S1). The GC contents of the six libraries were 55.84–56.85%, and the average Q30 percentage was 89.25% (Table S1). Most transcripts were 100 to 300 bp in length (Figure S3), and the biological replicates were highly consistent (Figure S4). The reads were compared with the T. aestivum reference genome. There were 374 million (80.74%) reads mapped to the reference genome (Table S2). The average percentage of unique mapped reads was more than 71% (Table S2). It was clear that a high-quality transcriptome data set was obtained.

2.4. Annotation and Functional Classification of the Unigenes

In total, 113,619 unique genes (unigenes) were obtained from the six libraries, and 109,685 unigenes were annotated by BLAST in several databases (Table S3). Furthermore, 10,080 new genes among the 113,619 unigenes were obtained, and 7075 new genes were annotated (Table S4). Functional classification in GO showed that the DEGs were classified into cellular component, molecular function, biological process, and many subcategories. Within the cellular component, molecular function and biological process categories, the most represented DEGs were classified as “cell”, “organelle” and “cell part”, “catalytic activity”, “binding”; “metabolic process”, “cellular process” and “single-organism process” (Figure S5).
According to homology unigene distribution of various species in the Nr database (Figure S6), the order from highest to lowest abundance was Aegilops tauschii, H. vulgare, Triticum urartu, T. aestivum, Brachypodium distachyon, O. sativa, Z. mays, Setaria italica and S. bicolor.

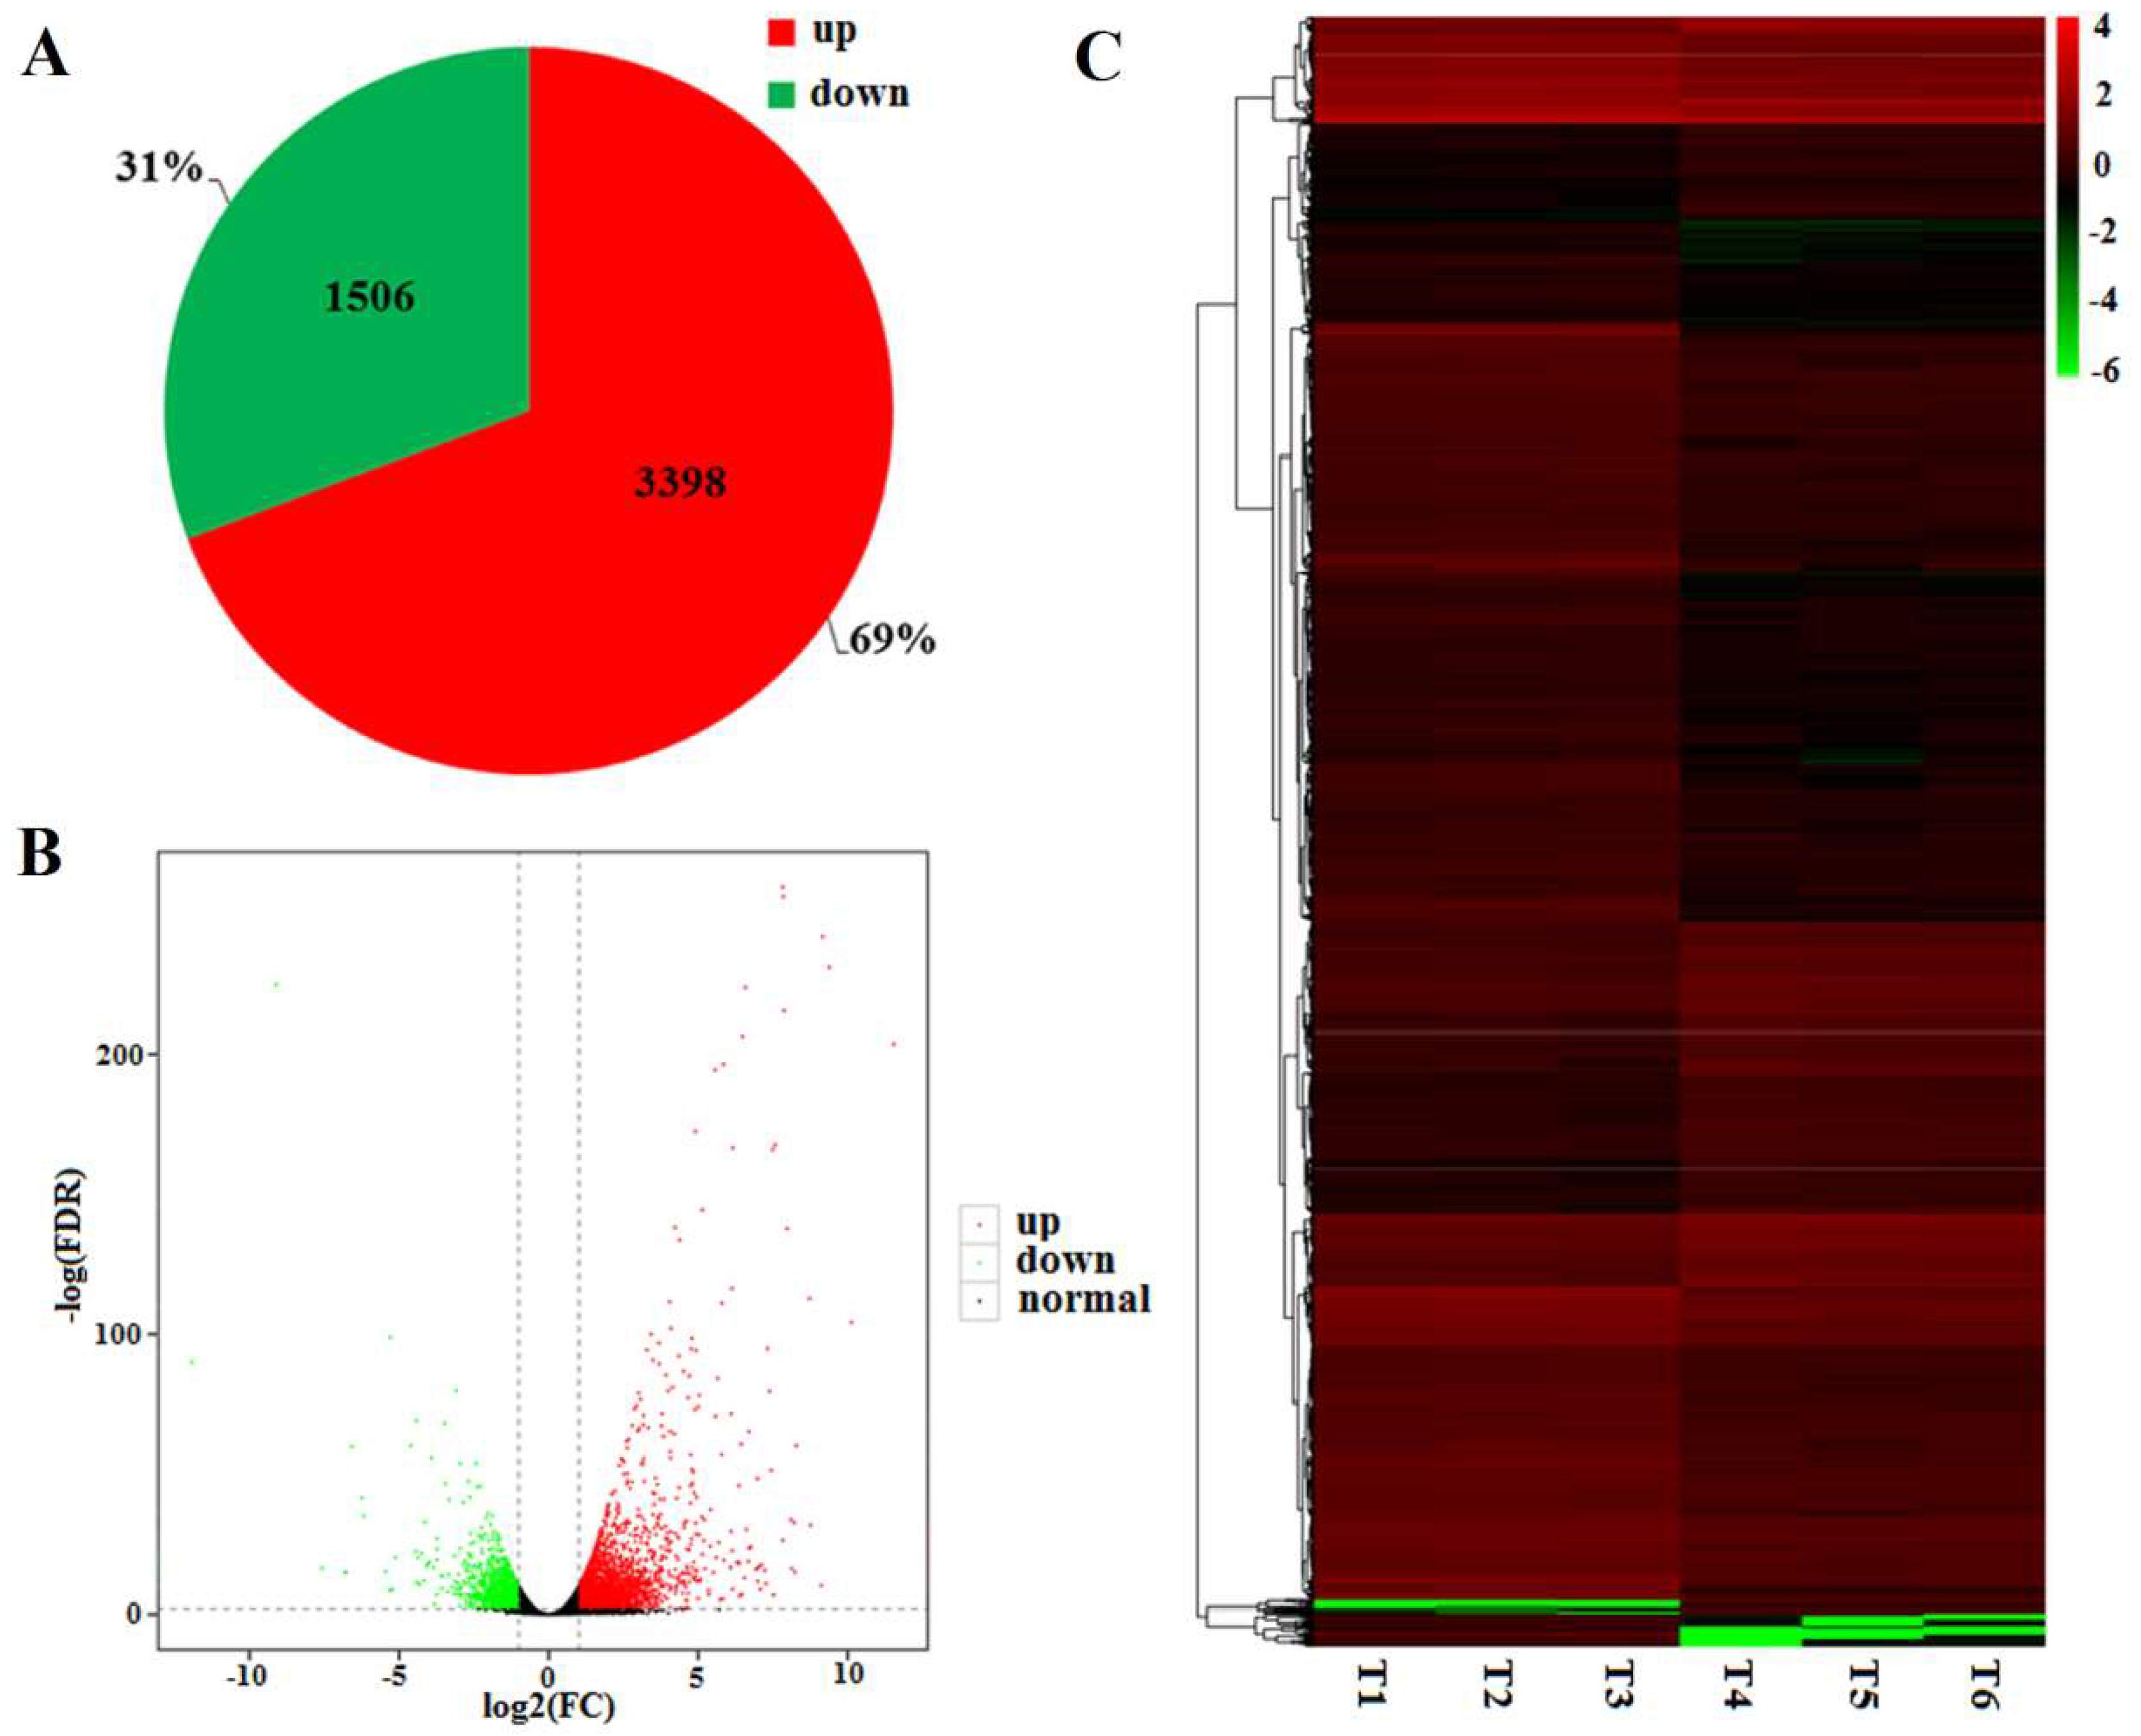
2.5. DEGs between the WT and Mutant dmc

To investigate the gene expression profile variation, a total of 4904 differentially expressed genes (DEGs) between the WT and mutant dmc were identified. Among them, 1506 were expressed at a low level, and 3398 were highly expressed in dmc compared to the WT (Figure 3A). The expression levels of DEGs in dmc and WT are shown as volcano plots (Figure 3B). The expression patterns of DEGs were hierarchically clustered (Figure 3C). The result showed there were significant DEGs, which may be the major genes related to wheat tillering.
In order to further explore the key genes, significant DEGs (Log2FC ≥3 or ≤−2) were screened between the mutant dmc and WT (Table S5, Table S6). These DEGs were classified into several groups, such as transcription factor, signal transduction mechanism, and carbohydrate metabolism, etc. Chloroplastic d-3-phosphoglycerate dehydrogenase 2 was the most significant highly expressed gene in the mutant dmc; its Log2FC value was 11.43. Histone H2B.1 was the gene that was most significantly expressed at a low level in the mutant dmc; its Log2FC value was 12.28.

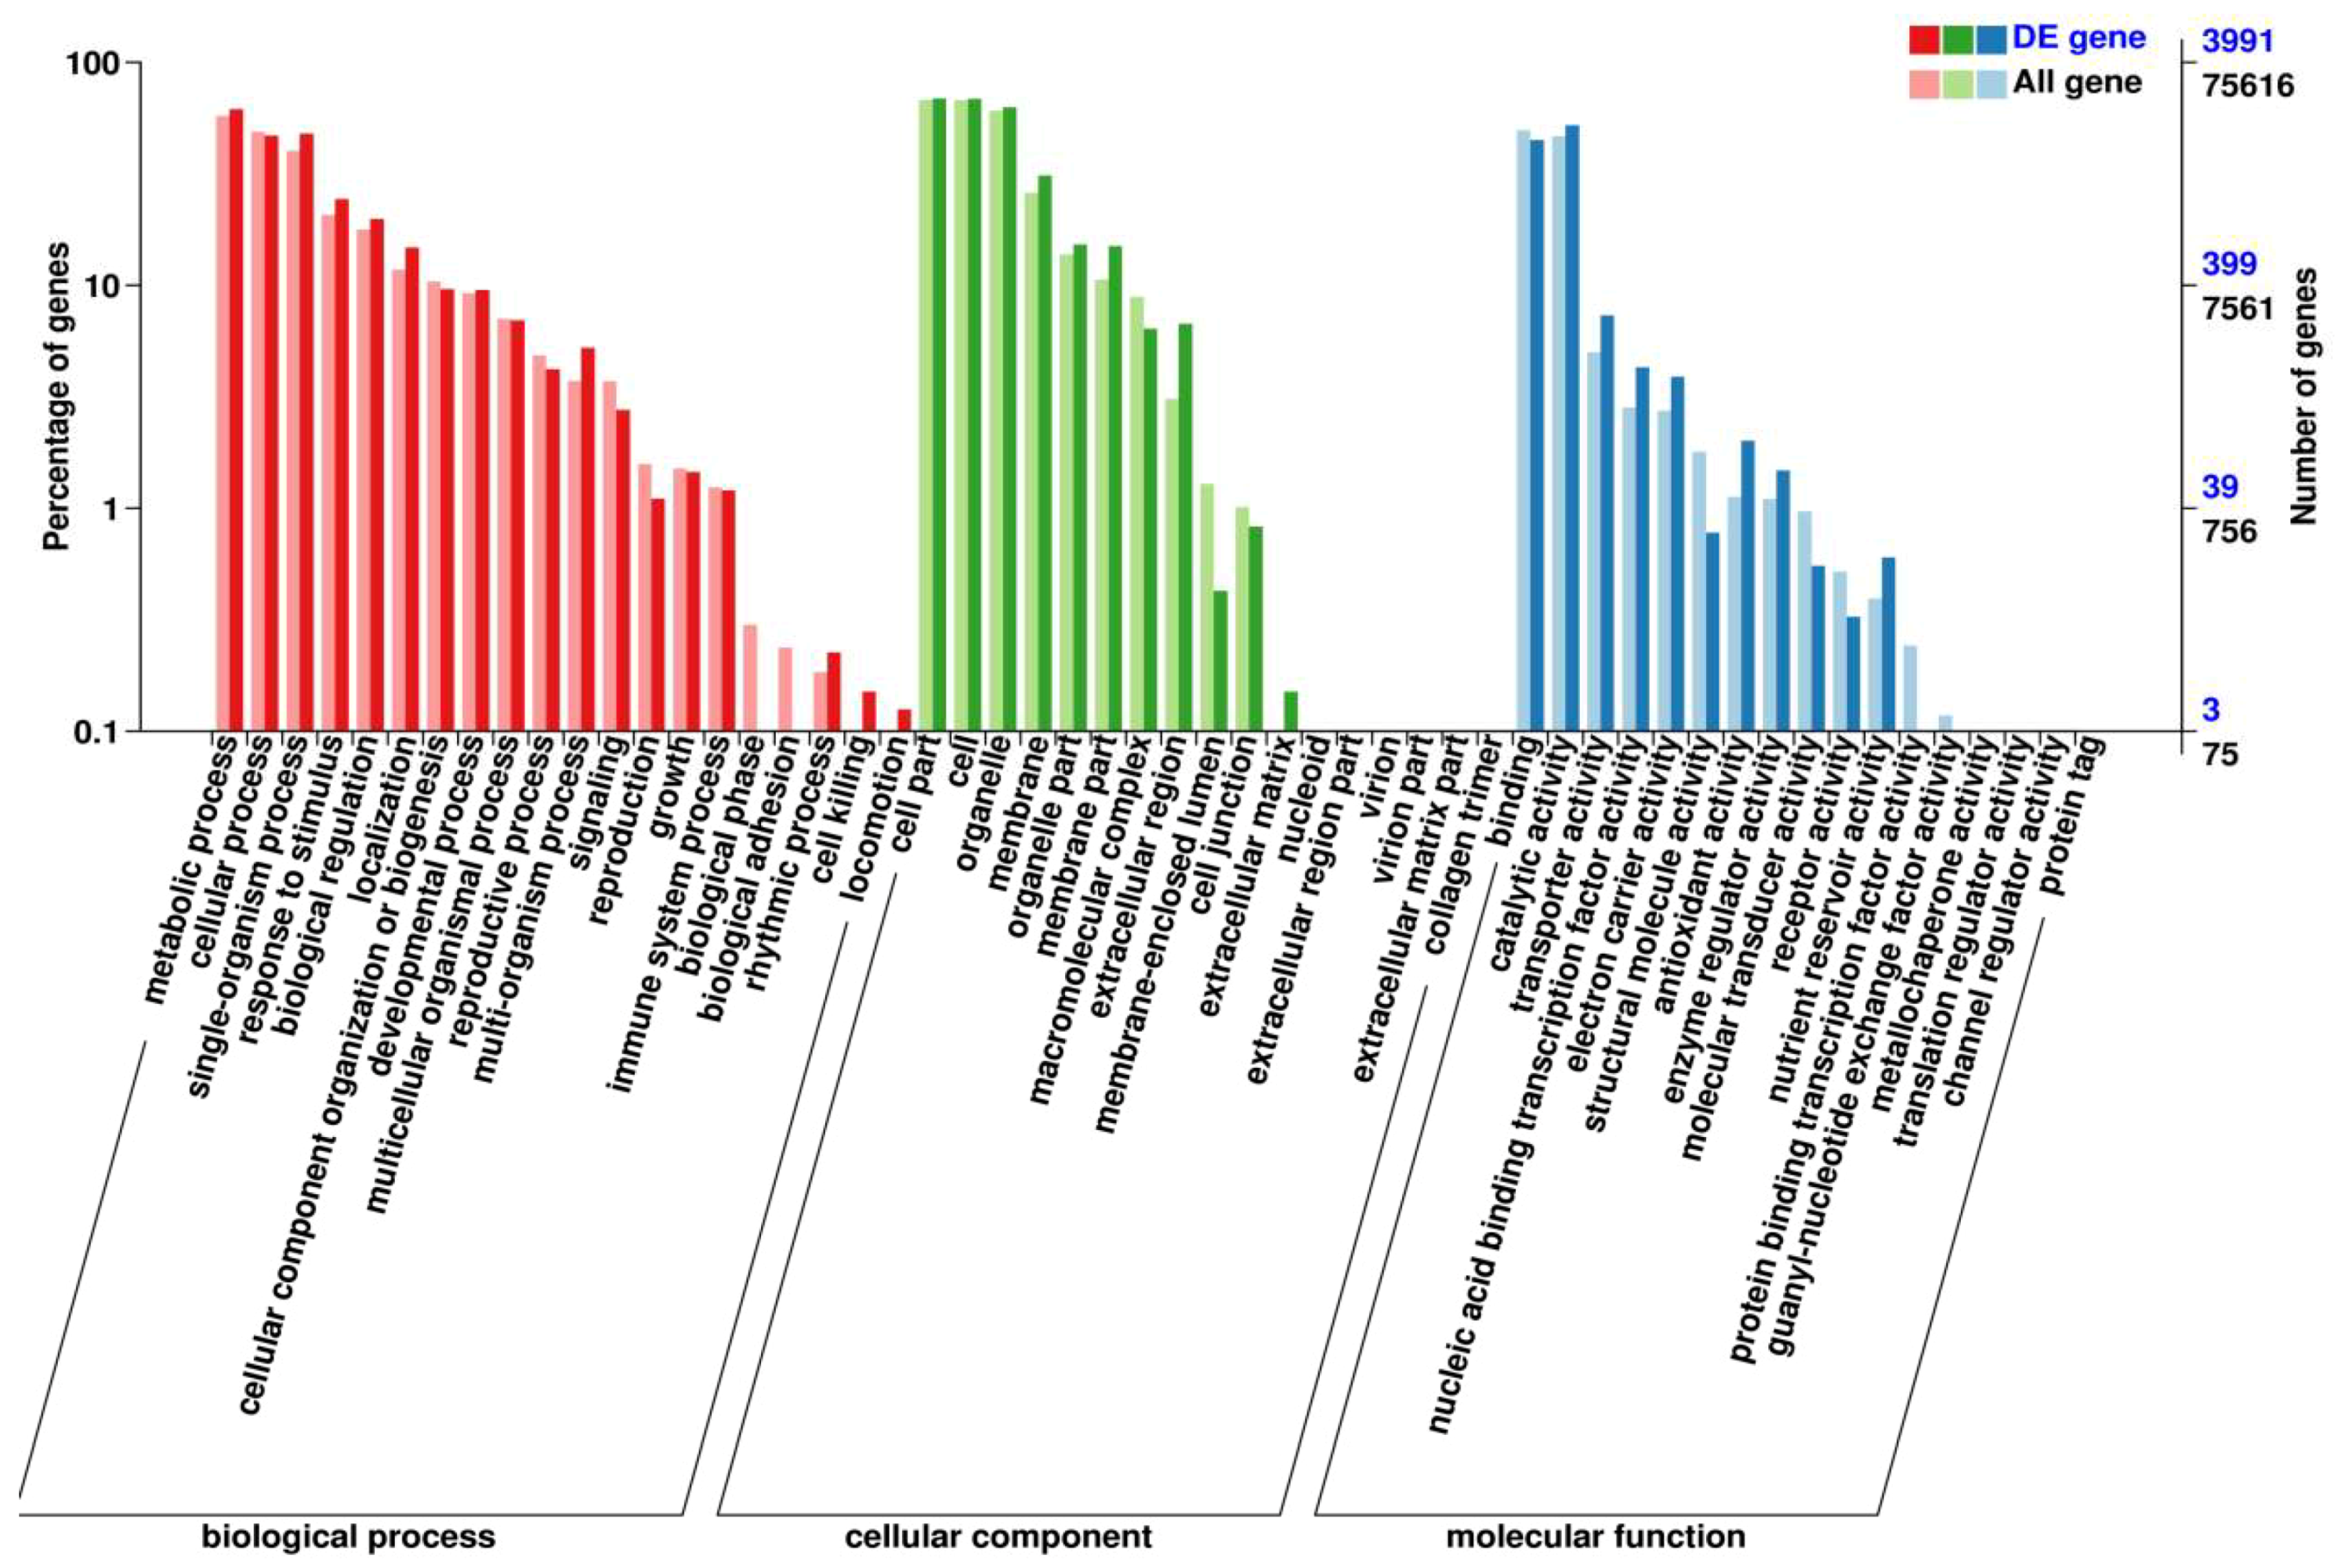
2.6. Functional Classification of the DEGs in GO

To further explore wheat tiller–related biological pathways or processes, 3991 DEGs were classified into 54 subcategories in the GO database (Figure 4). According to the percentage of DEGs in all genes, the significant subcategories were biological phase (two DEGs), biological adhesion (three DEGs) (belonging to biological process), the membrane part (599 DEGs), the extracellular region (268 DEGs) and membrane-enclosed lumen (17 DEGs) (belonging to the cellular component), structural molecule activity (31 DEGs), molecular transducer activity (24 DEGs), receptor (13 DEGs), and protein binding transcription factor (two DEGs) (belonging to molecular function).

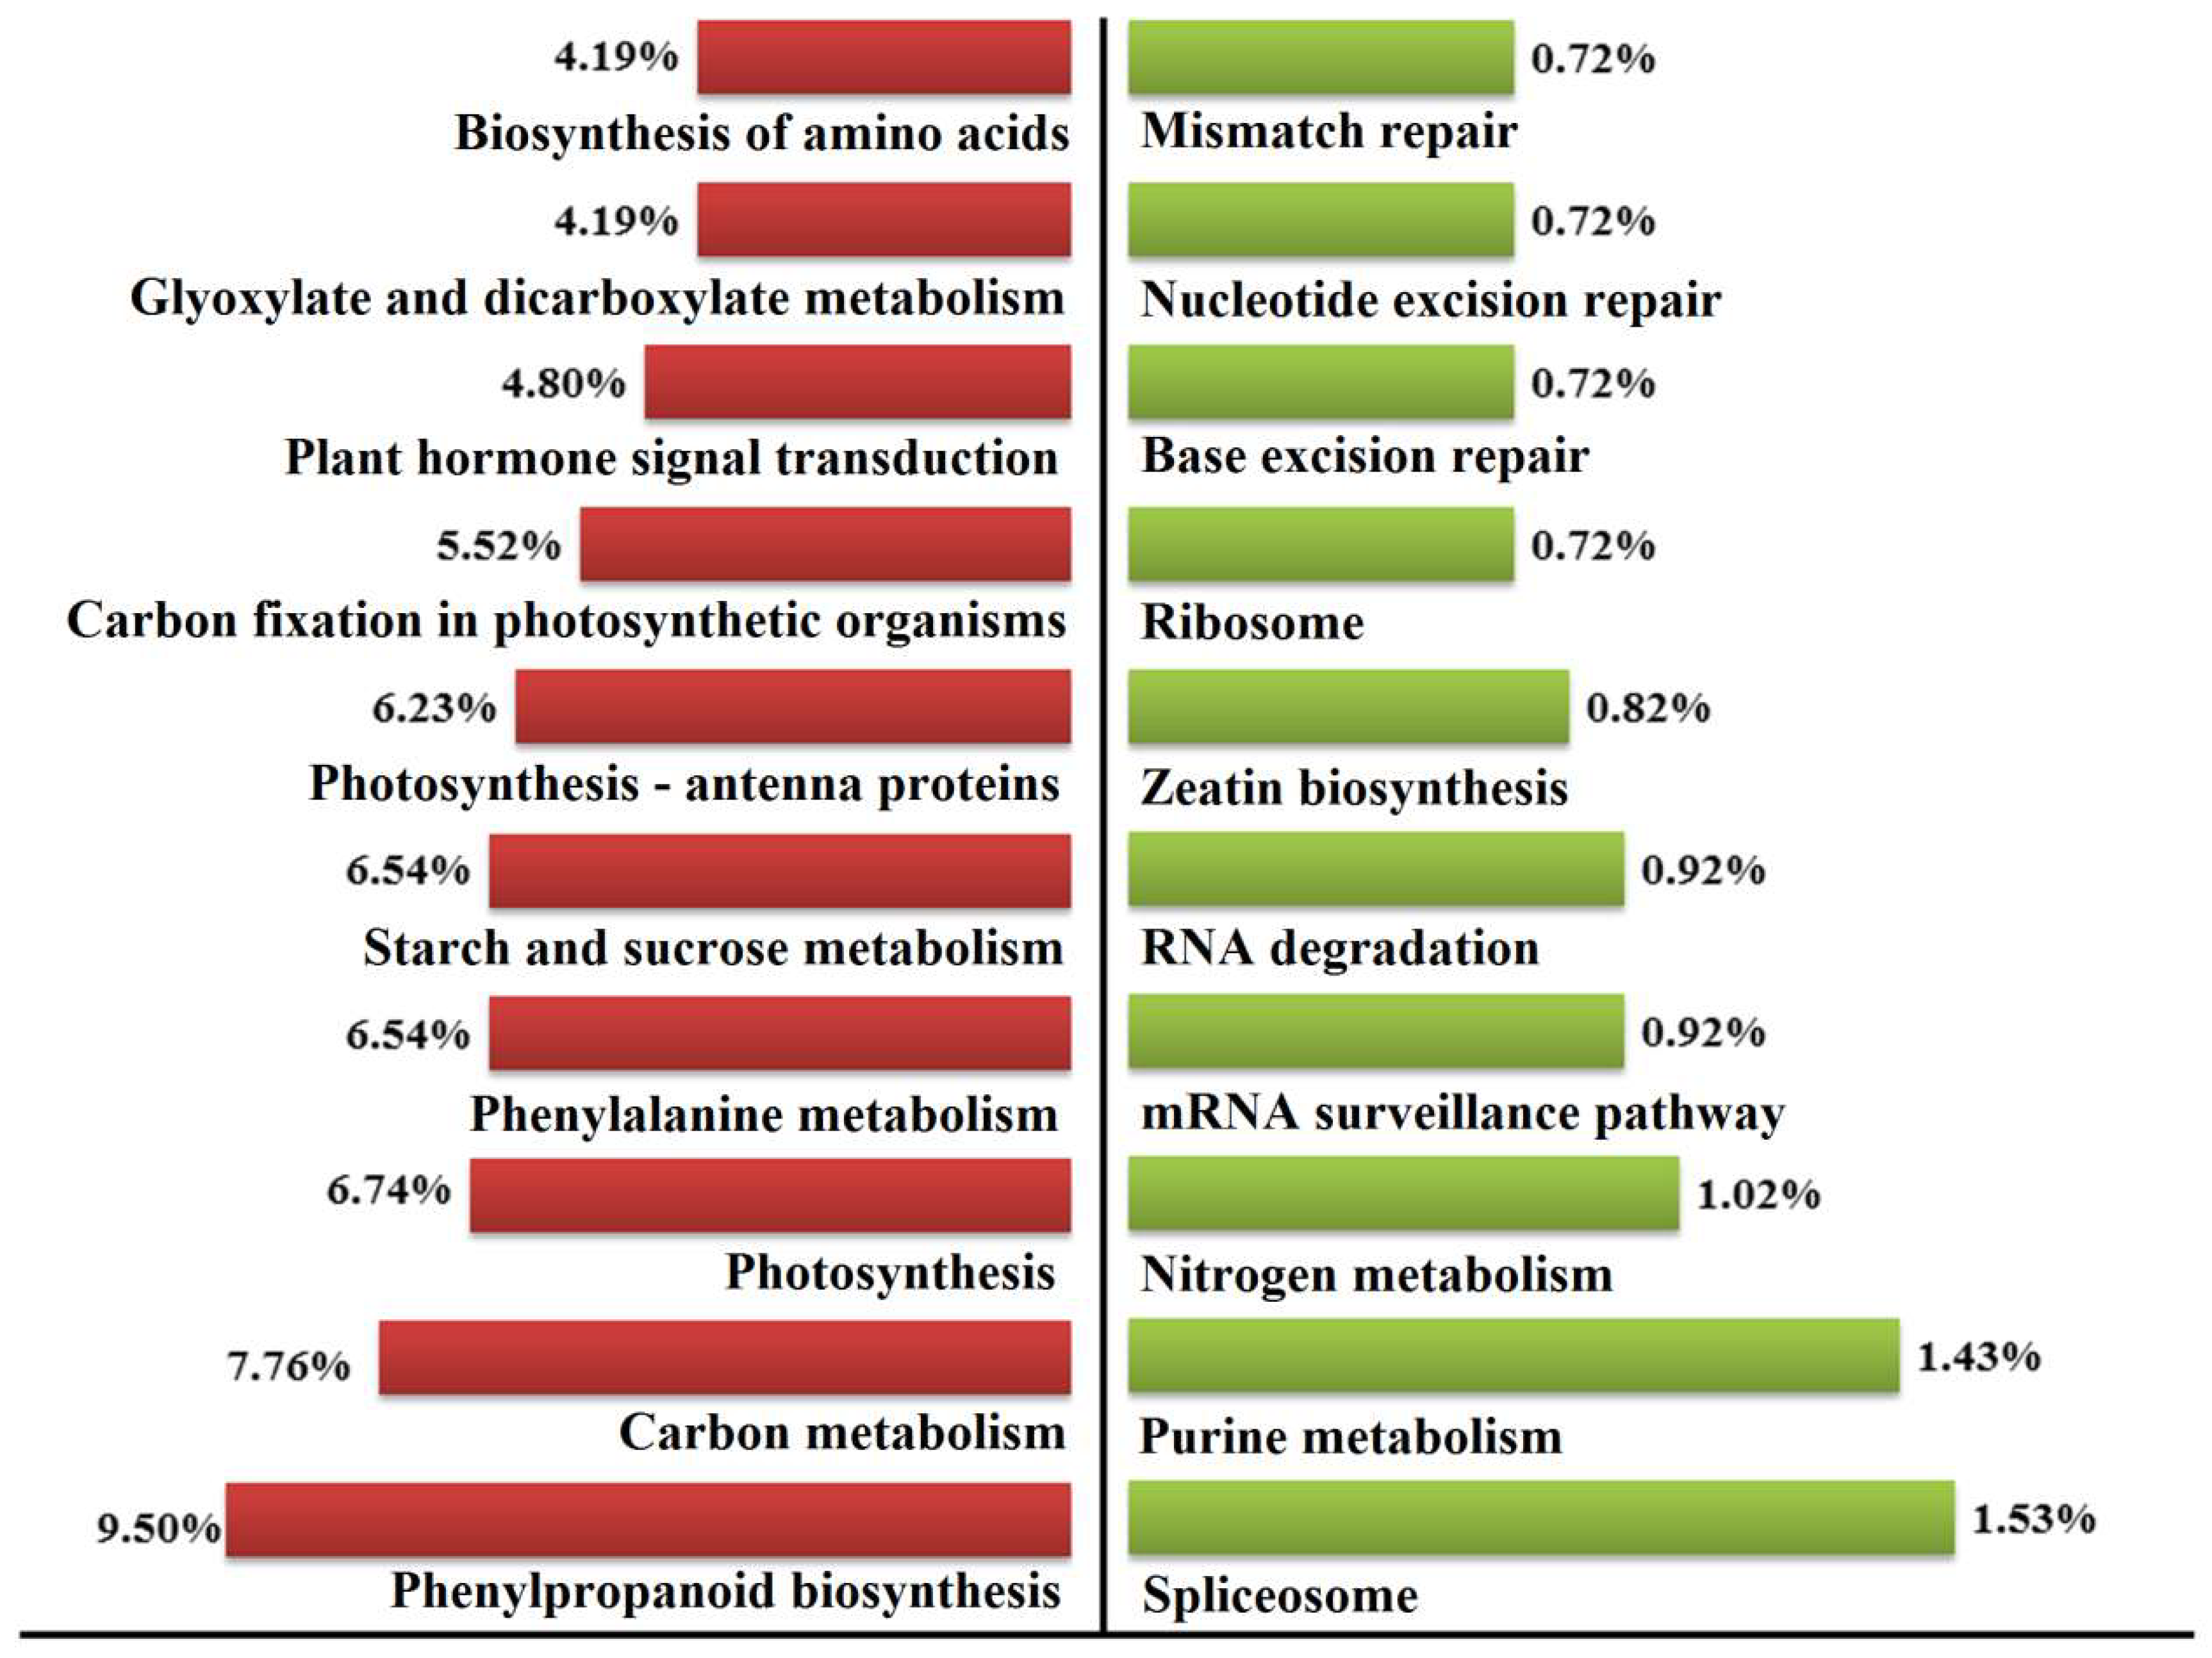
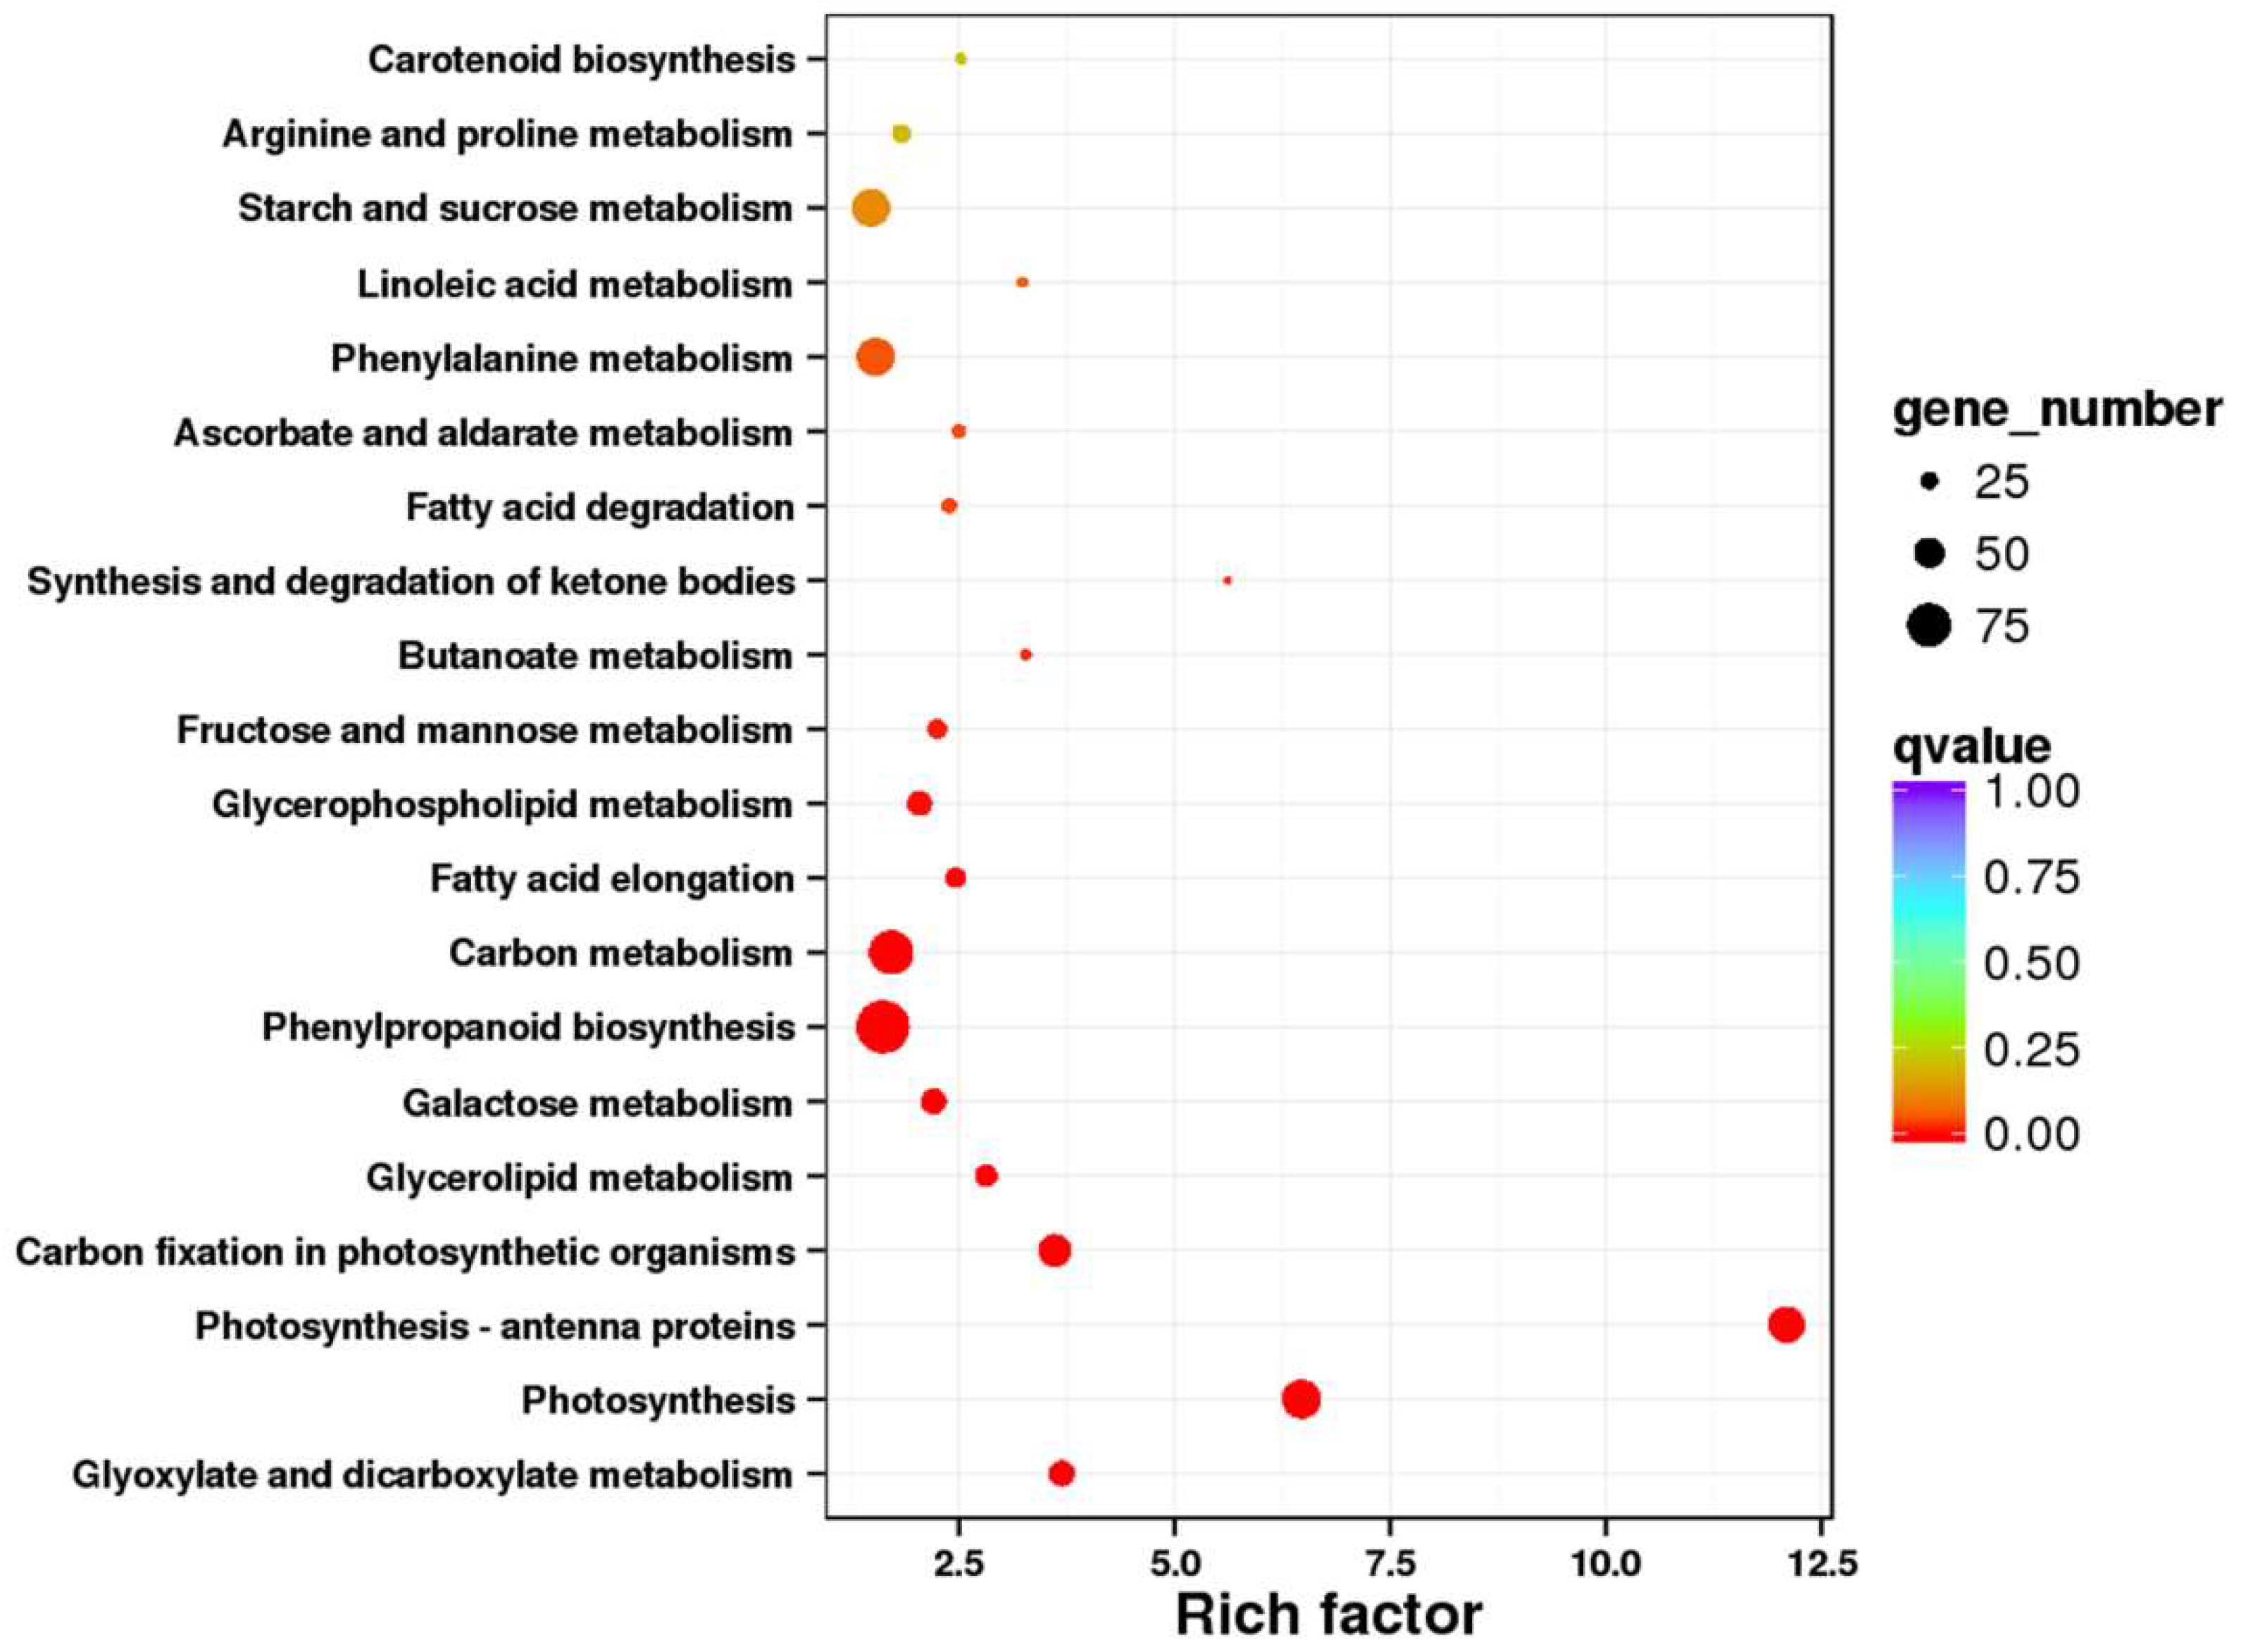
2.7. Pathway Mapping of the DEGs in KEGG

A total of 979 DEGs were assigned to 112 pathways in KEGG (Table S7). The top ten enriched pathways of enhanced and suppressed DEGs were obtained (Figure 5). The top ten enhanced pathways were phenylpropanoid biosynthesis (ko00940), carbon metabolism (ko01200), photosynthesis (ko00195), starch and sucrose metabolism (ko00500), phenylalanine metabolism (ko00360), photosynthesis-antenna proteins (ko00196), carbon fixation in photosynthetic organisms (ko00710), plant hormone signal transduction (ko04075), biosynthesis of amino acids (ko01230), and glyoxylate and dicarboxylate metabolism (ko000630). In contrast, the top ten suppressed pathways were spliceosome (ko03040), purine metabolism (ko00230), nitrogen metabolism (ko00910), mRNA surveillance pathway (ko03015), RNA degradation (ko03018), zeatin biosynthesis (ko00908), ribosome (ko03010), base excision repair (ko03420), mismatch repair (ko03430), and nucleotide excision repair (ko03420).
The enriched pathways were analyzed by a significance test, and twenty significantly enriched (Q value < 0.2) pathways were obtained in the mutant dmc (Figure 6, Table S8), such as photosynthesis-antenna proteins (ko00196), carbon metabolism (ko01200), carbon fixation in photosynthetic organisms (ko00710), fatty acid elongation (ko00062), butanoate metabolism (ko00650), and phenylpropanoid biosynthesis (ko00940).

2.8. The DEGs Involved in Phytohormone Metabolisms in dmc

The DEGs involved in plant hormone metabolisms were enriched in the mutant dmc, and a total of 83 DEGs were obtained (Figure 7, Table S9). Among them, 52 DEGs were expressed at a low level, and 31 DEGs were highly expressed in the mutant dmc compared to the WT. The DEGs of cytokinin hydroxylase, cytokinin dehydrogenase and cytokinin phosphoribohydrolase were all expressed at a low level (Figure 7C, Table S9); three DEGs of abscisic acid 8′-hydroxylase and abscisic stress-response protein were expressed at a high or low level (Figure 7B, Table S9). Two DEGs of gibberellin 20 oxidase and gibberellin 2-beta-dioxygenase were expressed at a low level (Figure 7D, Table S9); 19 DEGs involved in auxin metabolism were expressed at a low level (Figure 7A, Table S9), 17 DEGs involved in ethylene metabolism were expressed at a low level in the mutant dmc compared to the WT (Table S9). Abscisic stress-responding protein 3 (AA0320460) and auxin-induced protein X15 (AA1998680) were the DEGs that were most significantly expressed at high and low levels, respectively, in the mutant dmc compared to the WT (Table S9).

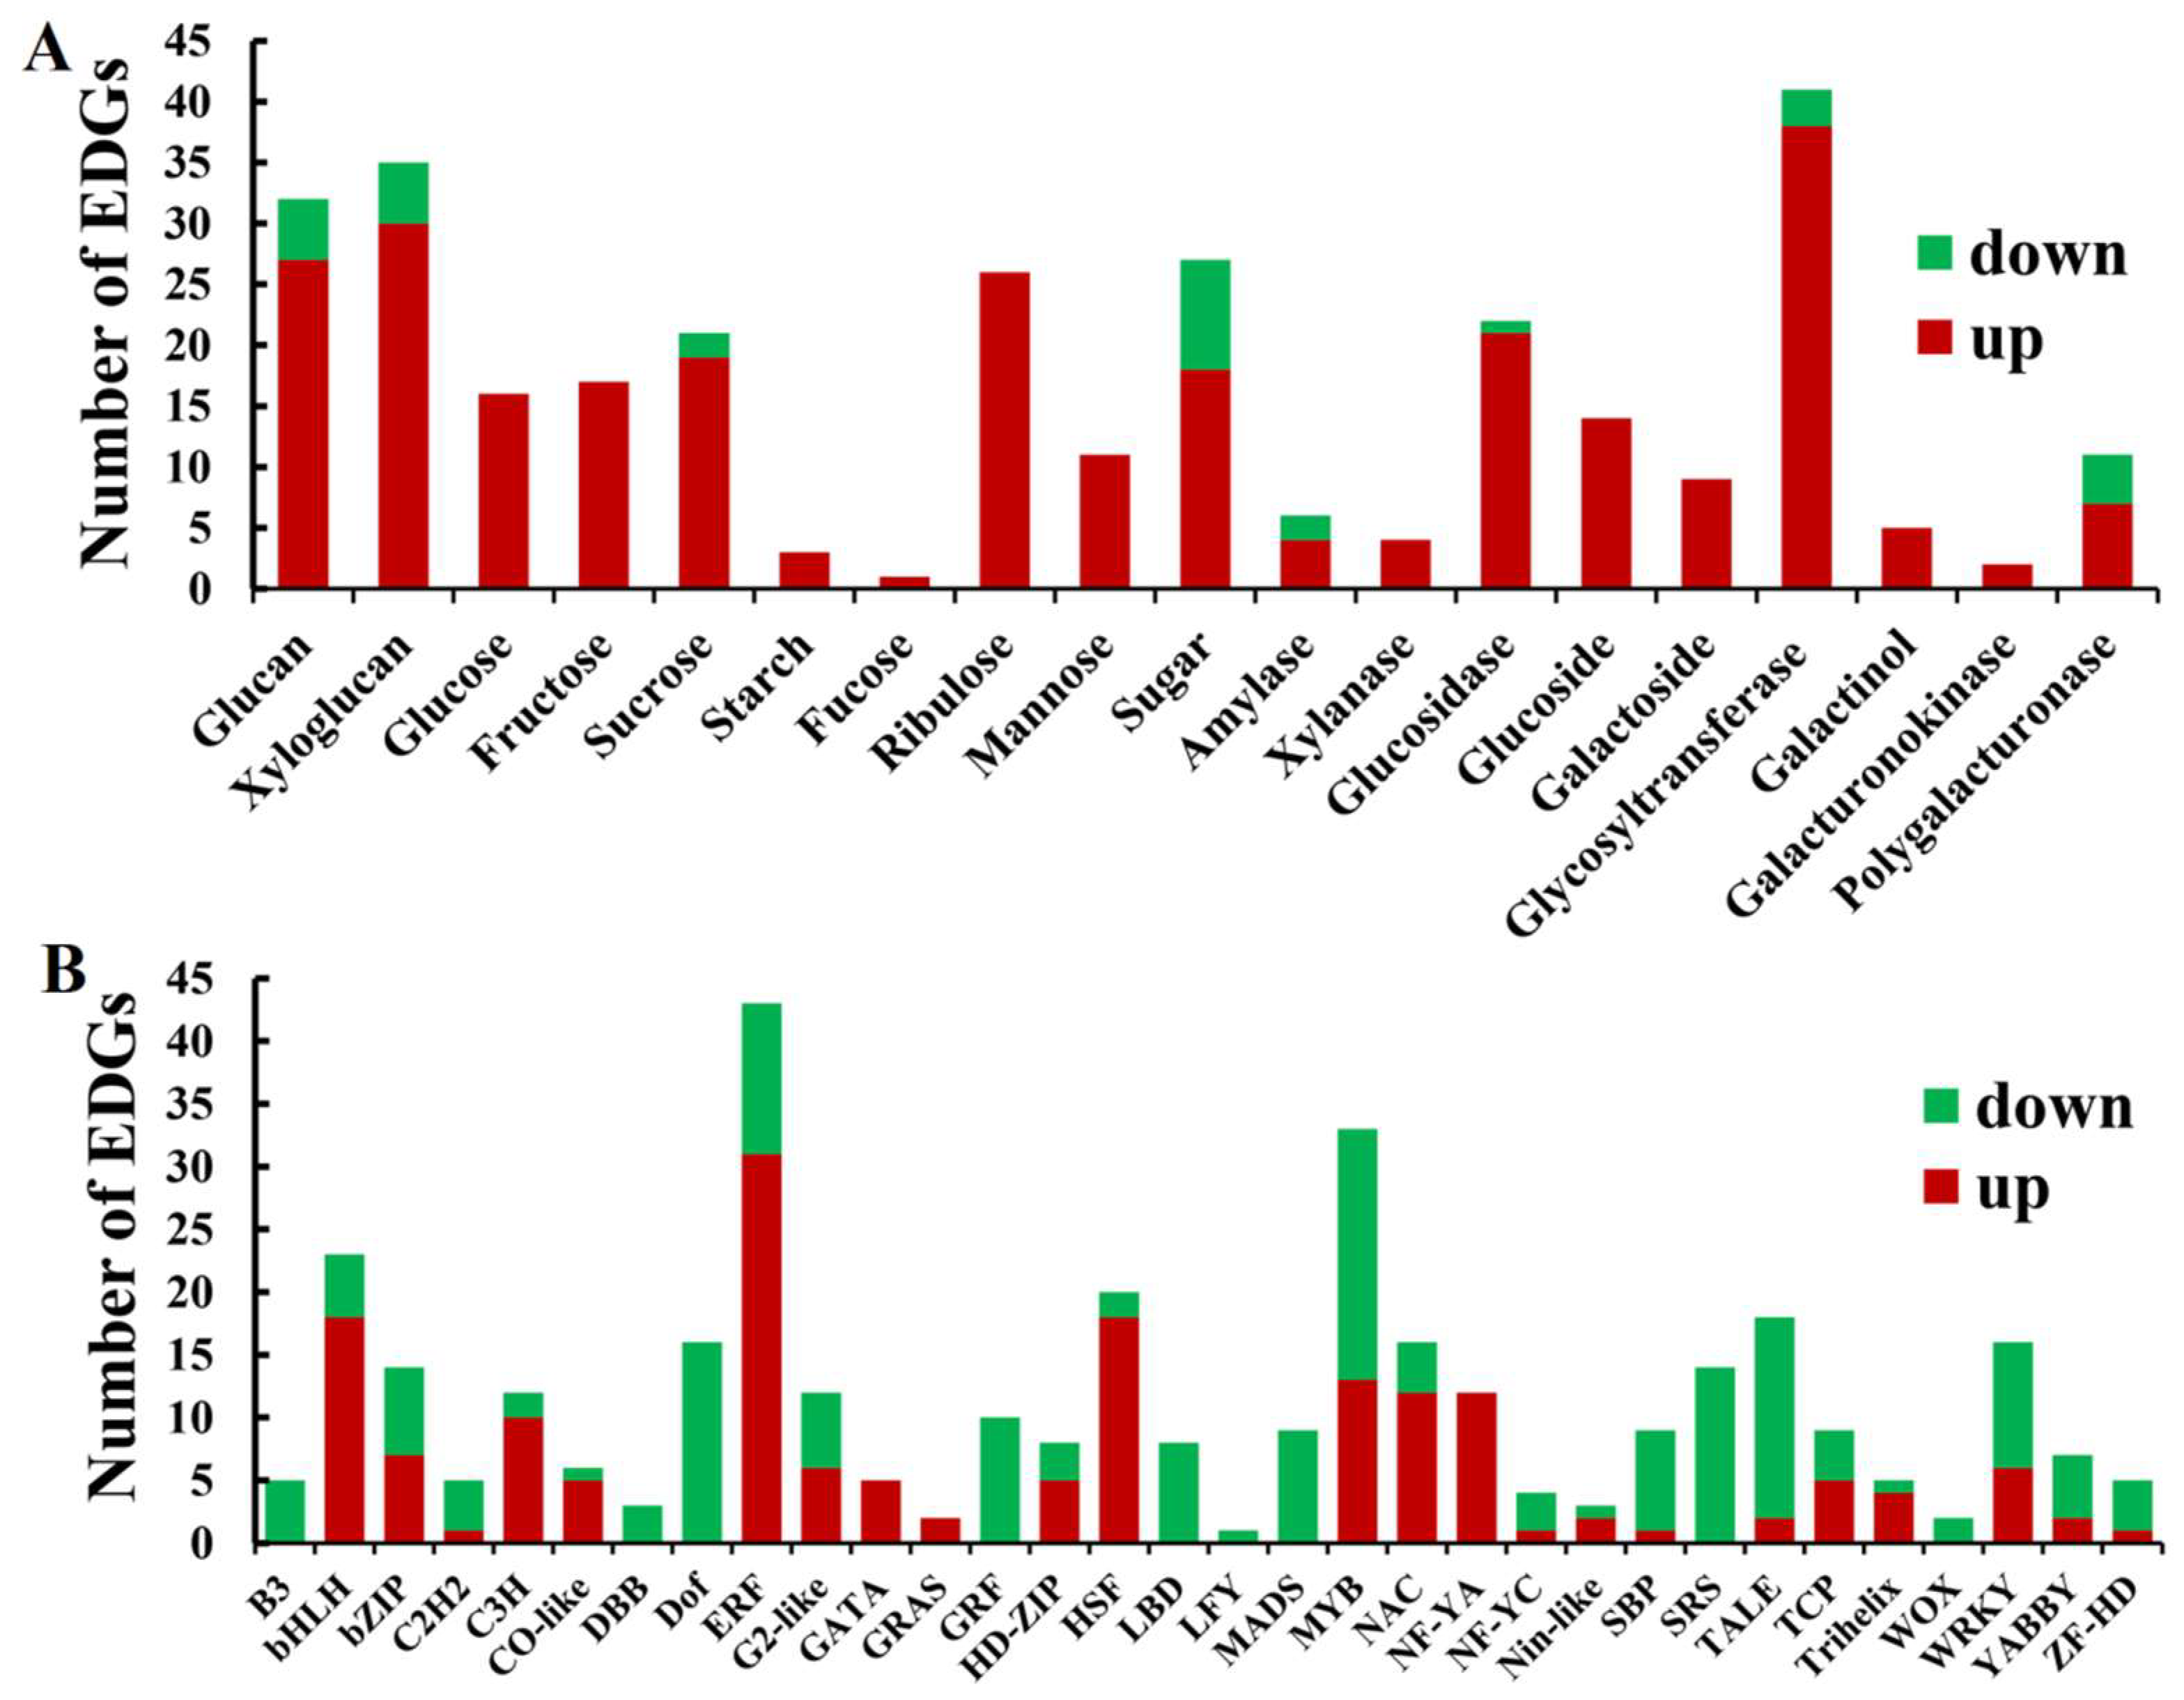
2.9. The DEGs Related to Carbohydrate Metabolism in the Mutant dmc

A total of 303 DEGs related to carbohydrate metabolism were obtained and they were divided into 19 groups (Figure 8A, Table S10). Among these, the DEGs related to the metabolism of glucose, fructose, starch, fucose, ribulose, mannose, xlanase, glucoside, galactoside, galactinol and galacturonokinase were all highly expressed in dmc (Figure 8A, Table S10). The DEGs related to metabolisms of glucan, xyloglucan, sucrose, sugar, amylase, glucosidase, glycosyltransferase, and polygalacturonase were simultaneously expressed at high or low levels in dmc. Furthermore, the percentages of DEGs expressed at low levels were lower than those of the highly-expressed DEGs in all carbohydrate metabolisms (Figure 8A, Table S10).

2.10. Transcription Factor Type DEGs in the Mutant dmc

A total of 35 significant DEGs of transcription factors (Log2FC ≥3 or ≤−2) were obtained in dmc (Figure 8B, Table S5, Table S6), and they belonged to zinc finger protein, heat stress transcription factor, NAC domain-containing protein, WRKY transcription factor, ethylene-responsive transcription factor and MADS-box protein families, etc. Among these DEGs regulated by transcription factors (Figure 8B, Table S11), an SPX domain-containing membrane protein Os02g45520 (AA1610920) was the most significantly highly expressed, and probable WRKY transcription factor 12 (AA0534130) was the DEG that was most significantly expressed at a low level in the mutant dmc compared to the WT. The DEGs belonging to families B3, DBB, Dof, GRF, LBD, LFY, MADS, SRS, and WOX were only expressed at low levels; the DEGs belonging to families GATA, GRA, and NF-YC were only expressed at high levels in the mutant dmc compared to the WT (Figure 8B, Table S11). The most enriched transcription factor family was ERF, followed by MYB, bHLH and HSF (Figure 8B, Table S11).

2.11. The DEGs Related to Signaling Processes

A total of 390 DEGs related to signal transduction were obtained (Table S12). Among these DEGs, signal transduction NRT1/PTR family protein genes occupied the largest percentage (8.72%), followed by F-box protein (5.13%), E3 ubiquitin-protein ligase (5.13%), pentatricopeptide repeat-containing protein (4.62%), CBL-interacting protein kinase (4.36%) and cysteine-rich receptor-like protein kinase (3.85%) (Table S12). The growth regulating factor, leucine-rich repeat extensin-like protein, phytosulfokine receptor, protein G1-like, protein reveille, protein short internodes and protein SHI related sequence genes were all expressed at low levels. Ankyrin repeat domain-containing protein, basic 7S globulin 2 low molecular weight subunit, CBL-interacting protein kinase 14, NAC domain-containing protein, and pectinesterase were almost always highly expressed (Table S12).

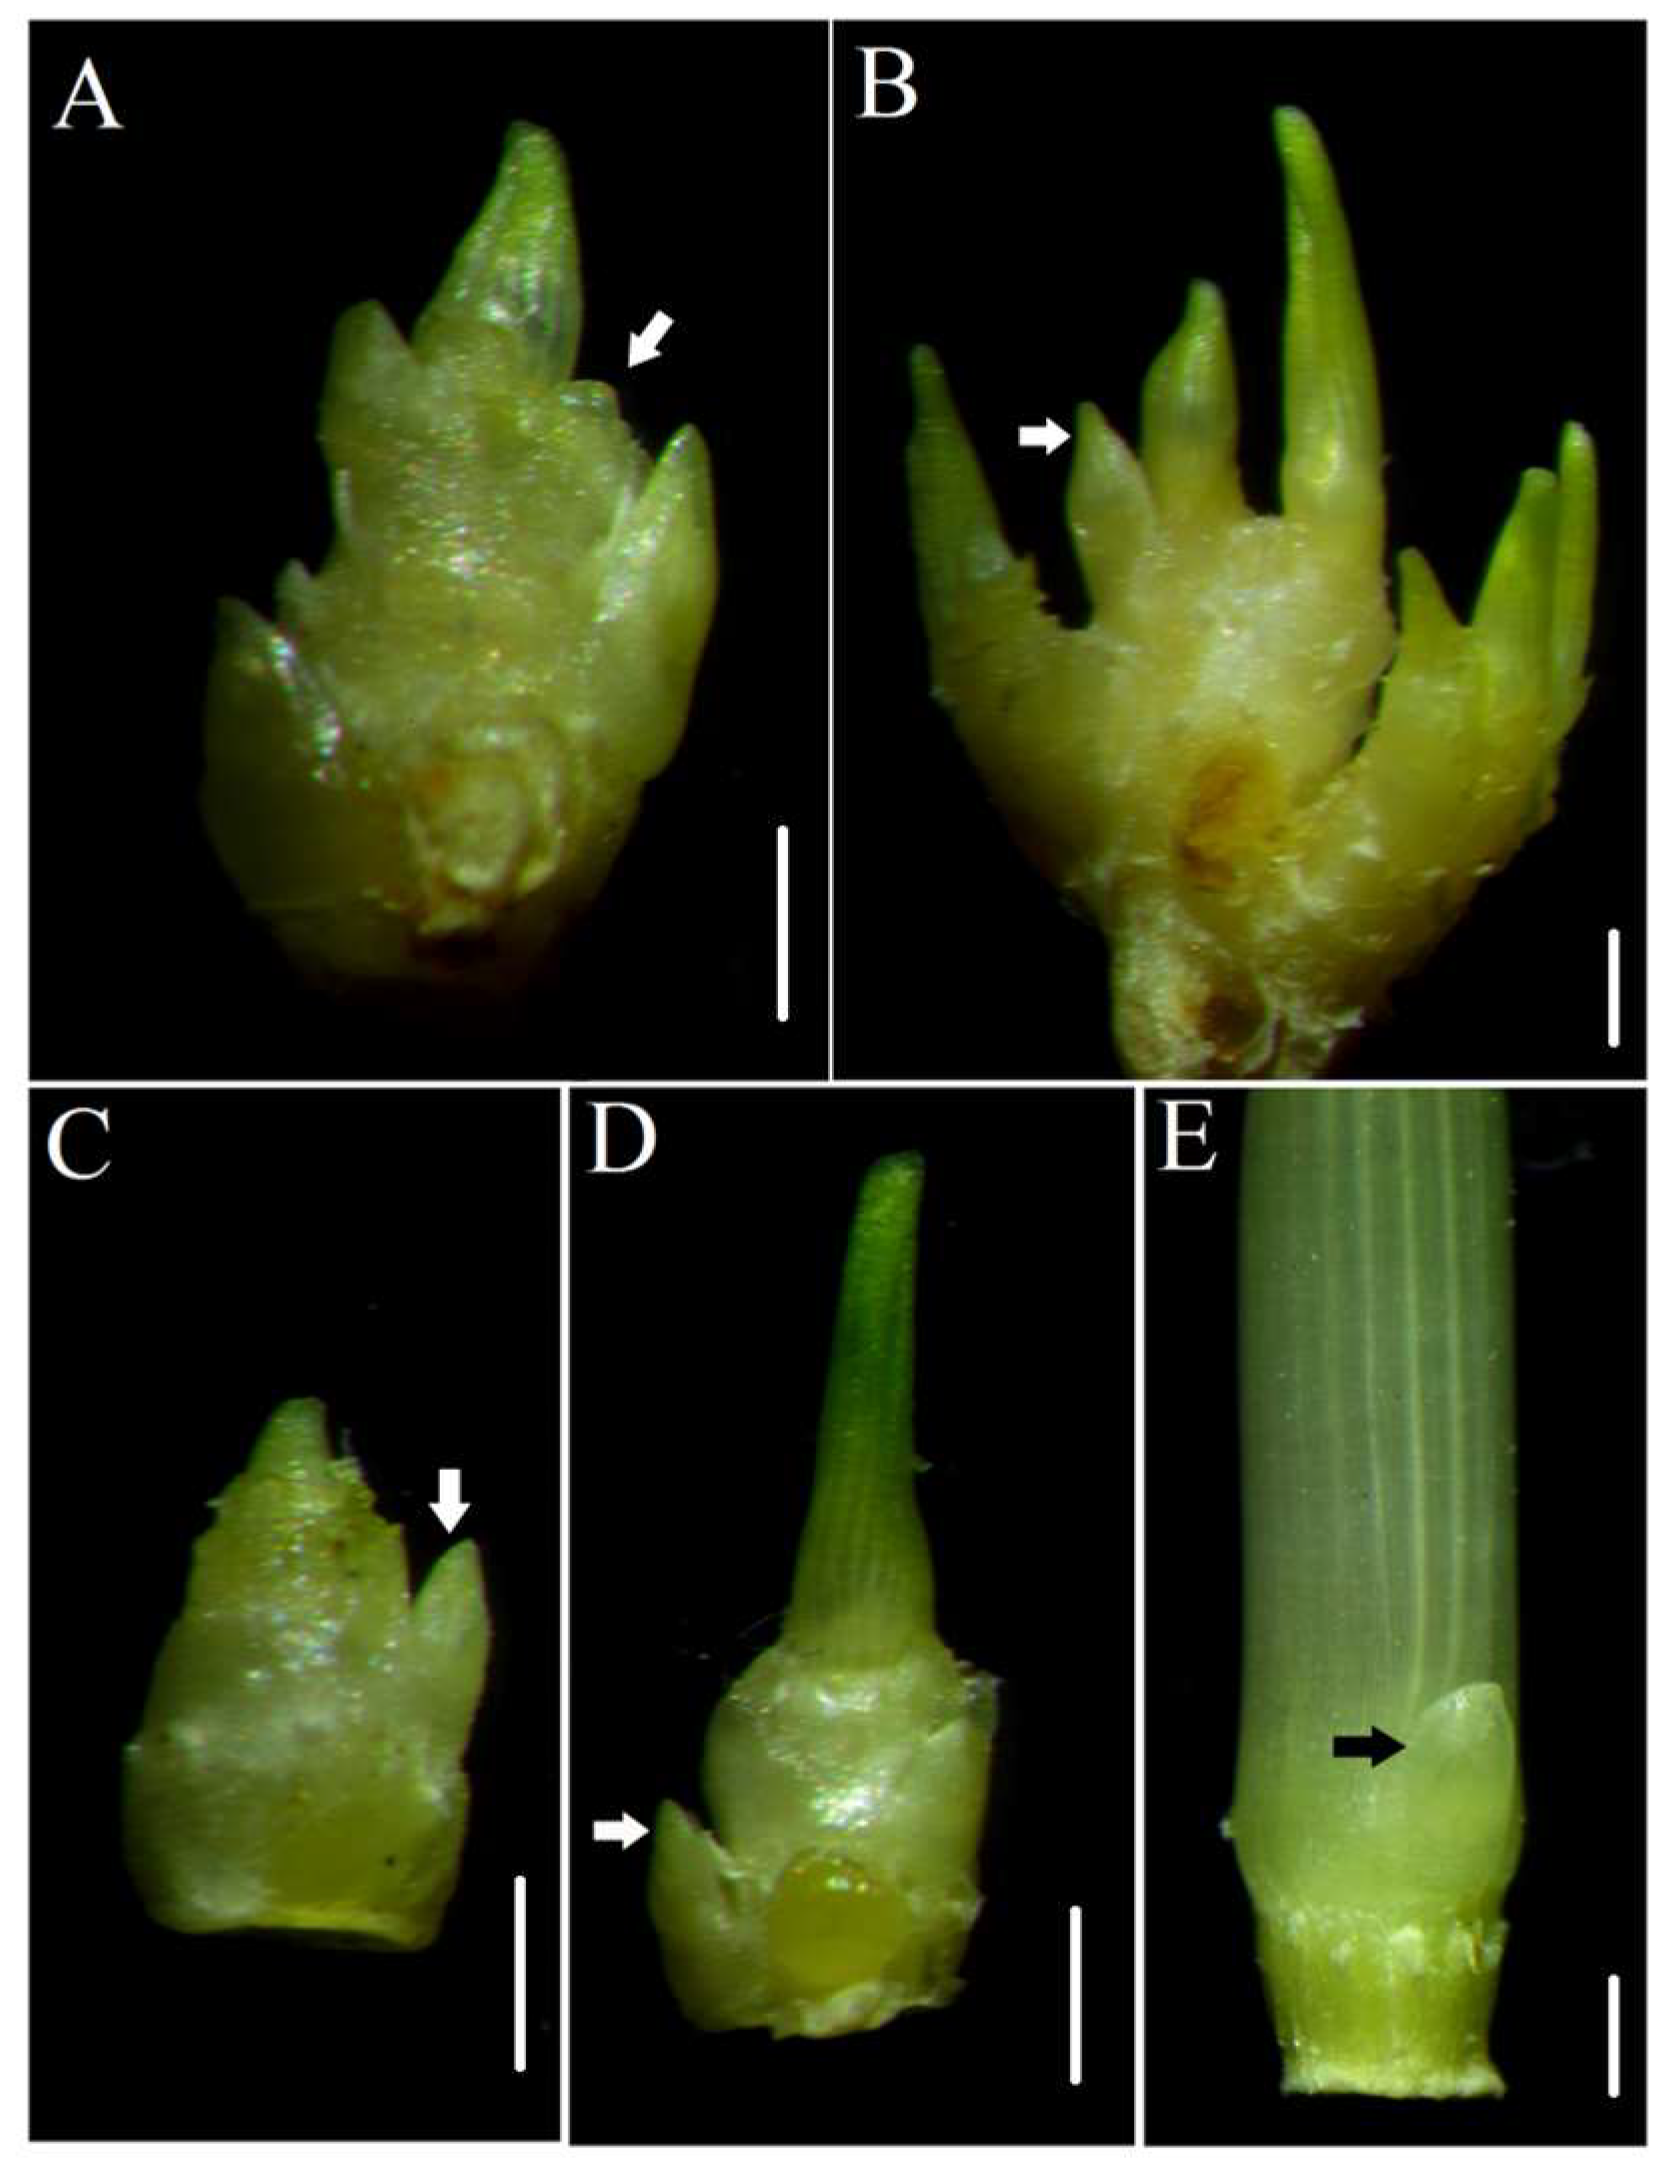
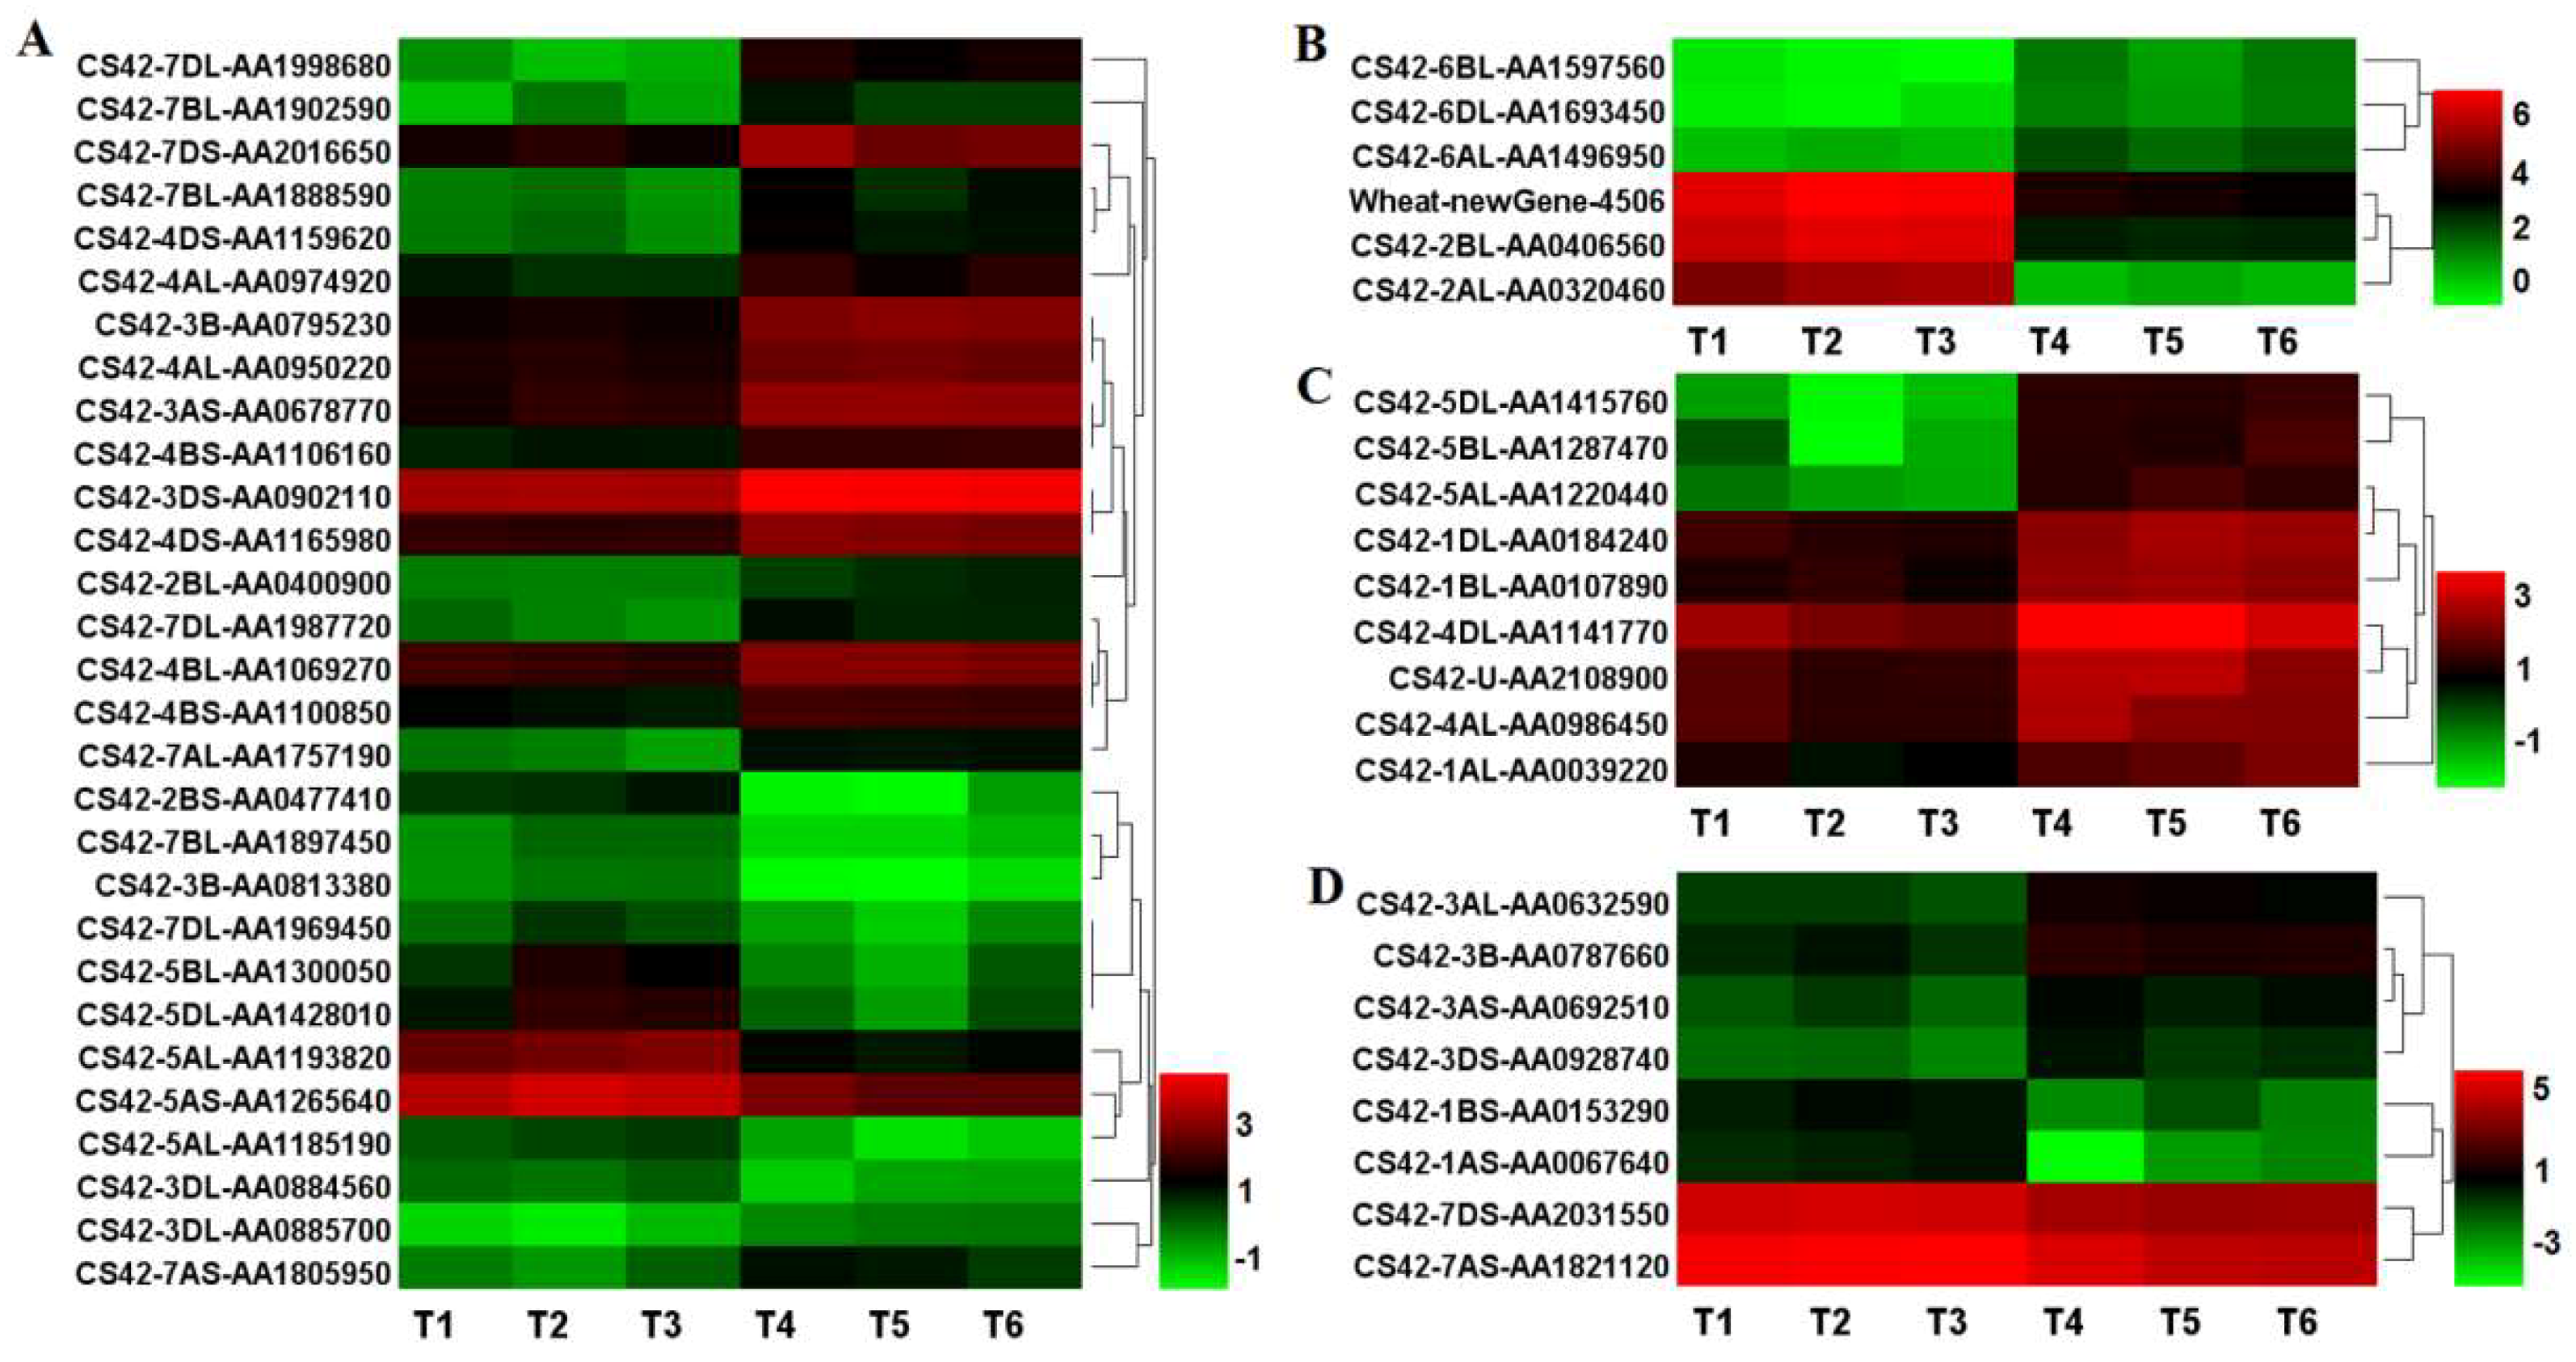
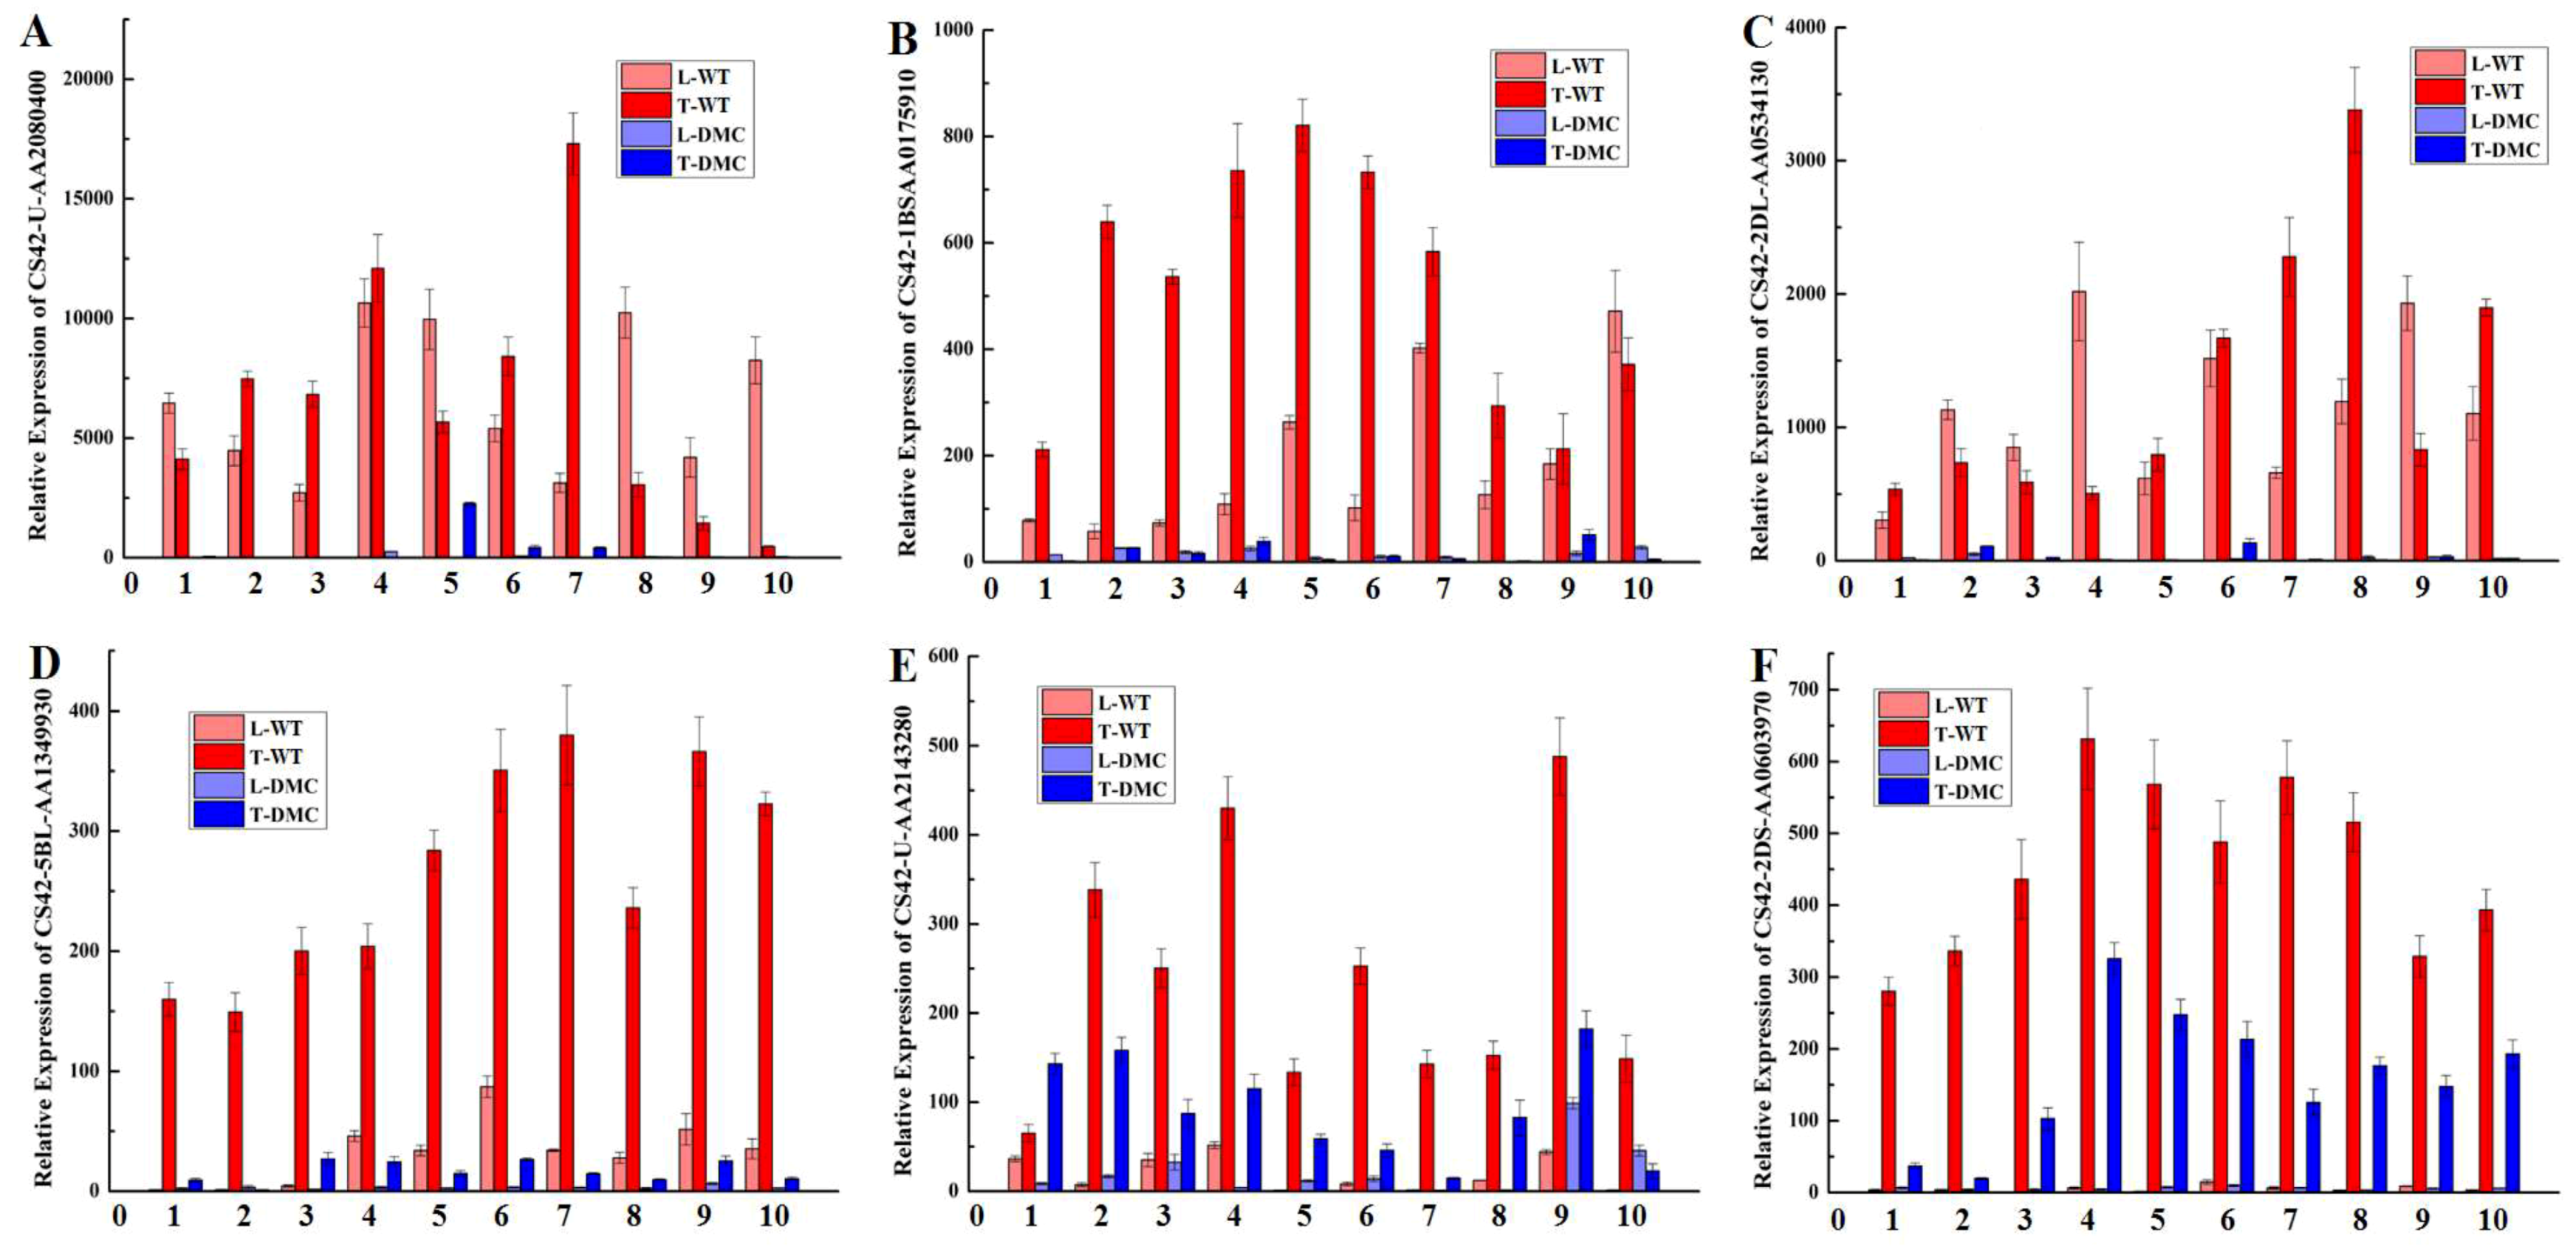
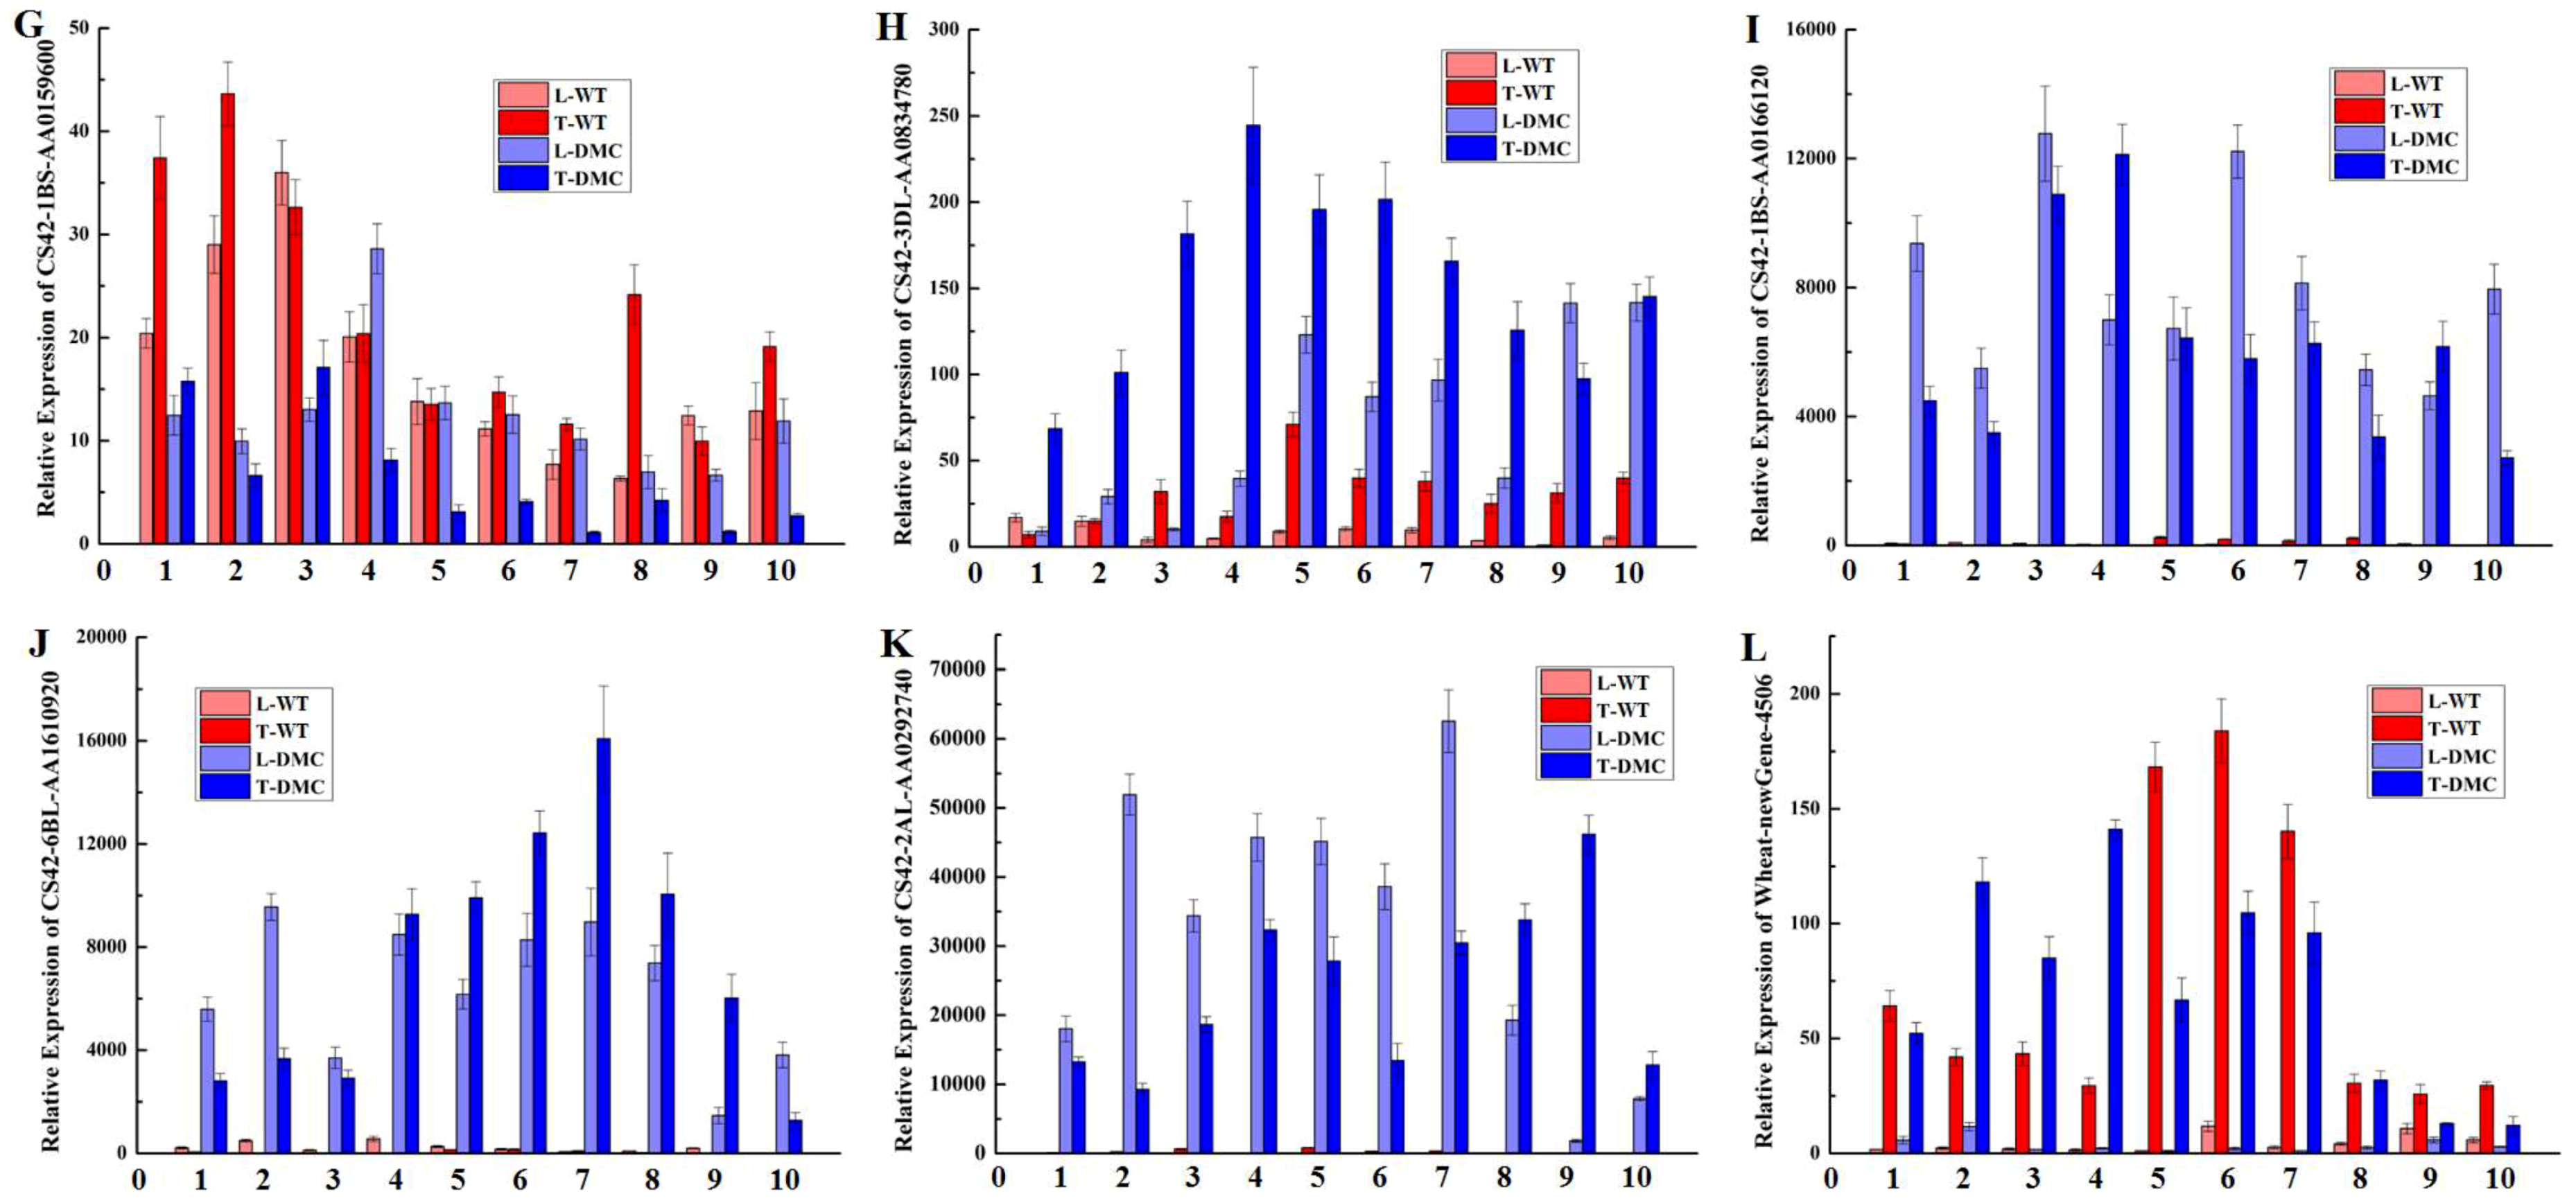
2.12. Expression Profiles of Twelve Genes in Wheat Tiller Primordia

To demonstrate the reliability of the sequencing results, we selected twelve of the significant DEGs to perform real-time qRT-PCR. Linear regression analysis showed that the results of the transcriptome analysis were reliable (Figure 9, Figure S7).
A histone H2B.1 gene (CS42-U-AA2080400, Figure 9A), a PGR5-like protein 1A gene (CS42-1BS-AA0175910, Figure 9B) and a WRKY transcription factor 12 gene (CS42-2DL-AA0534130, Figure 9C) were significantly suppressed in tiller primordia of dmc, and these three genes were also significantly suppressed in the leaves of dmc compared to the WT. Mutation significantly suppressed the expression of an ATP-dependent zinc metalloprotease FTSH 5 gene (CS42-5BL-AA1349930, Figure 9D), a BOI-related E3 ubiquitin-protein ligase 3 gene (CS42-U-AA2143280, Figure 9E), an acid phosphatase 1 gene (CS42-2DS-AA0603970, Figure 9F) and a bidirectional sugar transporter SWEET3a gene (CS42-1BS-AA0159600, Figure 9G) in tiller primordia of dmc; these four genes were specifically expressed in tiller primordia compared to leaves except the bidirectional sugar transporter SWEET3a gene (CS42-1BS-AA0159600, Figure 9G). The expression of an arginine decarboxylase gene (CS42-3DL-AA0834780, Figure 9H); a putative F-box/FBD/LRR-repeat protein At5g22670 gene (CS42-1BS-AA0166120, Figure 9I); a SPX domain-containing membrane protein Os02g45520 gene (CS42-6BL-AA1610920, Figure 9J); and a GDSL esterase/lipase At1g28600 gene (CS42-2AL-AA0292740, Figure 9K) were significantly activated in tiller primordia of dmc compared to WT, and their expression profiles in leaves of dmc were also similar. The expression of an abscisic stress-response protein 1 gene (Wheat-newGene-4506, Figure 9L) was irregular. The twelve genes were either only just expressed or completely suppressed in tiller primordia of dmc. The results suggested that these genes played important roles in the tiller development of wheat.

3. Discussion

3.1. Lack of Vitality in the Mutant dmc

The morphology of the mutant dmc was dwarfish, with yellowish cotyledons and almost no tillers, which demonstrated its lack of vitality. The phenotype of the mutant dmc was novel. In wheat, the leaves of the tiller inhibition mutants tin3 and ftin were much darker than the WT plants [1,4]; however, the leaves of the mutant dmc were yellowish. Both spikes and seed were much larger in the mutant tin3 [1] compared with the mutant dmc. Normally, there is a highly negative correlation between tiller number and plant height in rice and wheat [6]. In wheat, NAUH167, a high-tillering mutant was dwarfish compared to the WT [6], the plant height of the tiller inhibition mutant ftin was slightly higher than that of the WT [4], the phenotype of the mutant dmc was not the same as NAUH167 or ftin, and the mutant dmc was not only dwarfish but also had almost no tillers. The mutant dmc had fewer tiller primordia. Most of the primordia could not grow or stopped developing, which resulted in no tillers. Though most DEGs related to photosynthesis were highly expressed in dmc, this occurred in contrast to its lower vitality and biomass.

3.2. Auxin and Cytokinin Metabolisms Were Suppressed in dmc

Phytohormones play essential roles in plant growth and development throughout the vegetative to reproductive stages [40,41,42,43]. Tillering is a key developmental event in wheat, which needs a balanced phytohormone metabolism to maintain normal tillering [44,45,46].
In Arabidopsis, auxin can inhibit bud outgrowth in the highly branched shoot mutant axr1, and the effect of auxin on the wild type is more obvious [47]. In rice, a knock-down mutant of OsIAA6 produces more tillers due to the regulation of the auxin transporter OsPIN1 [48]. However, a further study found that auxin does not enter the lateral buds [49,50], and this phenomenon can be supported by cytokinin and strigolactone [50,51]. In Arabidopsis, cytokinin acts to overcome auxin-mediated apical dominance, allowing buds to evade apical dominance [52]. In this study, we obtained 29 DEGs related to auxin metabolism, and 19 DEGs were expressed at a low level (Figure 6, Table S9): the level of auxin in the mutant dmc might be low; however, this might not be consistent with the premise that auxin inhibits bud outgrowth. The KEGG pathway of zeatin biosynthesis (ko00908; Figure S8) was suppressed, and the suppressed differentially expressed zeatin biosynthesis genes were adenylate isopentenyltransferase 1 (chloroplastic), three cytokinin hydroxylases, and three cytokinin dehydrogenases (Figure S8, Table S9). Furthermore, the plant hormone signal transduction genes (ko04075; Figure S9) in KEGG showed that the expression of zeatin biosynthesis can affect cytokinin biosynthesis: the expression of downstream signal transduction components and the two-component response regulator (ARR) were down-regulated (Figure S9). This result is in agreement with a previous study on rice, which indicated that a high level of cytokinin can increase the tiller number [53].
Interestingly, overexpressing gibberellin 2-oxidases (GA2ox) can produce more tillers in rice [54]. Gibberellin localization in vascular tissue is required to control auxin-dependent bud outgrowth in hybrid aspen (Pterocarya stenoptera) [55]. Gibberellin is also required for cytokinin-mediated axillary bud outgrowth in Jatropha curcas [56]. In this study, two DEGs encoding gibberellin 20 oxidase 2, and DEGs encoding gibberellin 2-beta-dioxygenase 1 and gibberellin 3-beta-dioxygenase 2-1, which were expressed at low levels, were obtained (Figure 6, Table S9), and the possible high level of gibberellin could be consistent with the mutant dmc not tillering. The hormone regulation of wheat tillers is very complex, and further research is needed in the future.
The plant height of the mutant dmc was decreased significantly. It was about 74.53% of the WT height (Figure 1A). Many plant hormones can promote plant growth, like auxin [42], gibberellin [57,58], and cytokinin [59]. The suppressed expression of genes involved in auxin, zeatin and cytokinin metabolisms (Figure S9) may be the key causes accounting for dwarfism of the mutant dmc.

3.3. Carbohydrate Metabolism and Phenylpropanoid Biosynthesis Were Active in dmc

Many studies have demonstrated that sugar can regulate bud growth [60,61,62]. In wheat, the phenotype of the tiller inhibition mutant (tin) was associated with precocious internode elongation; further study showed that the mutant tin transferred sucrose away from buds to elongating internodes [61]. In pea (Pisum sativum), total sucrose levels were significantly increased in node 2 buds after decapitation; the axillary buds were rapidly released in intact plants supplemented with external sucrose [60]. Sugar also affects bud outgrowth in rose (Rosa sp.) [62,63]. In this study, the enriched pathways of starch and sucrose metabolism (ko00500) in KEGG were significantly activated (Figure 5, Figure 8A). Two DEGs related to sucrose synthase were expressed at a low level, and nine DEGs related to sucrose 1-fructosyltransferase, which were expressed at a high level, were obtained (Figure 7, Table S10). The potentially higher activities of the corresponding enzymes may decrease the content of small molecular carbohydrates, which may inhibit wheat tillering.
Interestingly, phenylpropanoid biosynthesis (ko00940; Figure S10) was the most enhanced pathway in KEGG, which regulates the biosyntheses of different lignins such as syringyl, guaiacyl, p-hydroxy-phenyl, and 5-hydroxy-guaiacyl lignins. A total of 93 annotated DEGs belonged to the phenylpropanoid biosynthesis (Figure S10), and among them 56 were various peroxidases (Table S10) which likely suppressed the biosyntheses of lignins, and the concentration of lignins in the mutant might be low. This result might be consistent with the dwarf phenotype of the mutant dmc. 1-aminocyclopropane-1-carboxylic acid oxidase (ACCO) catalyzes the final step of ethylene biosynthesis. In this study, seven DEGs of ACCO and seven DEGs of ACCO homologs were obtained, and they might affect the biosynthesis of ethylene in dmc.

3.4. Some Transcription Factors Are Suppressed in dmc

Transcription factors (TFs) play essential roles in plant leaf [64], flower [65], and branch [66] growth and development.
In maize (Zea mays), the Knotted1-like homeobox (KNOX) TFs up-regulates GA2ox1 [67]. In this study, four DEGs of knotted-1-like 1, three knotted-1-like 12 and three KNOX3 (TALE family) were obtained, and they were all expressed at a low level, and these might down-regulate the expression of GA2ox1 and inhibit tillering in the mutant dmc (Figure 8, Table S11). This observation is in agreement with the observation that overexpressing GA2ox produced more tillers in rice [54]. In rice, overexpression of growth-regulating factors OsGRF3 and OsGRF10 reduces tillers. The expression of Oskn2, one rice KNOX gene, was down-regulated by overexpression of OsGRF3 [68]. In this study, one DEG homologous to TFs GRF2, GRF10, and GRF12; two DEGs homologous to GRF1 and GRF5; three DEGs homologous to GRF9 were obtained (GRF family), however, they were all expressed at a low level in dmc (Figure 8, Table S11). The relationship between GRFs expressed at a low level and the phenotype of the mutant dmc needs further study.
DWARF TILLER1, a WUSCHEL-related homeobox (WOX) TFs, is a positive regulator of tiller growth in rice [66]. In rice, the completely sterile and reduced tillering 1 mutant (srt1) was caused by a mutation in WUSCHEL (OsWUS, one member of the WOX gene family). The homeobox domain of SRT1 is essential for tillering [69]. In this study, two DEGs homologous to TFs WOX 4 (WOX family) were expressed at a low level in dmc (Figure 8, Table S11), which might affect the tillering of dmc. Furthermore, The DEGs of TF families B3, DBB, Dof, GRF, LBD, LFY, MADS and SRS were only expressed at a low level (Figure 8, Table S11); they might affect the tillering of dmc.

3.5. Signal Transduction and Photosynthesis in dmc

Signal transduction is related to many pathways and metabolic processes. In Arabidopsis, short internodes (SHI) is a suppressor of GA responses [70]. In this study, six DEGs associated with short internodes, expressed at a low level, were obtained, and they might promote GA responses in the dmc mutant that does not produce tillers. The larger percentage of DEGs related to E3 ubiquitin-protein ligase, NRT1/PTR FAMILY, F-box protein, pentatricopeptide repeat-containing protein and E3 ubiquitin-protein ligase (Table S12) might also affect the tillering and plant growth of the mutant dmc.
Photosynthesis (ko00195; Figure S11) was the third most enhanced pathway in the mutant dmc (Figure 4), and photosystem I, photosystem II, cytochrome b6/f complex, photosynthethic electron transport and F-type ATPase related to photosynthesis were all highly expressed (Figure S11).
The enhanced expression of the photosynthetic components did not correspond with the phenotype of the mutant dmc, which requires further study.

4. Materials and Methods

4.1. Plant Materials and Growth Conditions

The wheat cultivar ‘Guomai 301’ was bred in our laboratory. Wheat cultivar “Guomai 301” has medium tillers, but a high percentage of earbearing tillers. The tillering ability of the WT conformed to the requirements of high-yield wheat breeding, which ensures a relatively dense population (600–700 spikes per hectare) and large spikes with more grains (36.1–37.4 grains per spike). In October 2012, the seeds of the WT were treated with EMS and planted at the Shangqiu Experimental Farm, Henan Province, China (34°25′ N, 115°39′ E, 49 m a.s.l.). The mutant dmc was obtained from the M2 generation in 2013. Thereafter, to eliminate the background mutations, dmc plants were individually selected generation by generation; normal plants in the segregating line were also selected as the control (CK in line; WT) simultaneously. In 2016, the WT and dmc were planted at the Experimental Farm of Henan Agricultural University, Zhengzhou, Henan Province, China (34°51′ N, 113°35′ E, 95 m a.s.l.). The lines were sown in plots of 3.0 m in length and 2.0 m in width; the distance between rows was 0.25 m, and 20 seeds were planted in each row [71]. The samples for transcriptome sequencing analysis were prepared in 2017.

4.2. Trait Measurements, Morphology Observations and SSR Analysis

The tiller number, spike number, plant height, and internode number of the main stem, among other traits (Table 1), of dmc and the WT were observed and measured. Each sample was prepared by random selection of more than 20 individuals of dmc and the WT. The statistical tests were performed using Student’s t-test, and the variation was expressed as the standard deviation (SD).
The tillers of the mutant dmc and WT were observed from the early tillering stage with an inverted microscope (Olympus 3111286), and the images were captured by a camera (Nikon Coolpix 4500). The outer leaves and sheaths were removed to show the tiller primordia and very small tillers at the seedling stage with an anatomical needle. The large tillers at the adult plant stage were observed by the naked eye.
A set of microsatellite assays was applied to evaluate the genetic diversity among the WT and mutant dmc. The SSR primers (Appendix) employed in this study included those of GDM [72], WMC [73], etc. Genomic DNAs of the WT and mutant dmc were extracted from leaves with the CTAB method [74]. The PCR reactions were performed in 10 µL volumes containing 5 µL EasyTaq® PCR SuperMix for PAGE (2×) (TransGen Biotech, Beijing, China), 1 µL primer mix (10 µM), 0.5 µL DNA (100 ng) and 3.5 µL ddH2O. The PCR parameters were: 94 °C for 5 min, then 33 cycles of 94 °C for 30 s, 50–60 °C (based on primer annealing temperature) for 30 s and 72 °C for 60 s, and a final elongation at 72 °C for 10 min. PCR products were separated in 8% non-denatured polyacrylamide gels (acrylamide:bisacrylamide = 19:1) at room temperature. Each sample (2 µL) was loaded and run in 1× TBE (90 mmol L–1 Tris-borate, 2 mmol L–1 of EDTA, pH 8.3) buffer at 90 W for 1 h, then visualized by silver staining [75].

4.3. RNA Extraction, Library Preparation and Sequencing

Tiller primordial samples (Figure S1) were dissected at the three-leaf stage to four-leaf stage. Two super bulk samples of the mutant dmc (T1, T2, and T3) and WT (T4, T5, and T6) with three biological replicates were prepared. Each bulk sample included more than ten independent individuals.
RNA was extracted using Trizol reagent (TransGen Biotech, Beijing, China) according to the manufacturer’s protocol. RNA concentration was measured using a NanoDrop 2000 (NanoDrop Technologies, Wilmington, DE, USA). RNA integrity was assessed using the RNA Nano 6000 Assay Kit on the Agilent Bioanalyzer 2100 system (Agilent Technologies, Santa Clara, CA, USA).
The RNA bulk samples were prepared with 1 μg RNA per individual. Sequencing libraries were constructed using NEBNext UltraTM RNA Library Prep Kit for Illumina (NEB, Ipswich, MA, USA) following the manufacturer’s recommendations. The preferential cDNA fragments were 240 bp in length. The correlation among biological replicates was analyzed using Pearson’s Correlation Coefficient (r) [76]. The six cDNA libraries were sequenced with Illumina HiSeq Xten from Biomarker Biotechnology Corporation (Beijing, China).

4.4. Transcriptome Analyses

The clean reads were compared with the T. aestivum reference genome [77] using TopHat2 [78]. The unigenes were annotated by BLAST [79] in Nr (NCBI non-redundant protein sequences), Nt (NCBI non-redundant nucleotide sequences), Pfam (protein family), KOG/COG (Clusters of Orthologous Groups of proteins), Swiss-Prot (a manually annotated and reviewed protein sequence database), KO (KEGG Ortholog database), and GO (Gene Ontology) databases. To explore new transcripts and genes in the mutant dmc, the reads were assembled using Cufflinks software [80] based on the reference genome sequence, and the transcriptional intervals that had not been annotated were searched for and compared with the original genome annotation information. The KEGG Orthology of the new genes was analyzed using KOBAS2.0 [81], and the amino acid sequences of the new genes were predicted; finally, the new genes were annotated using HMMER [82], referring to the numerous databases. The standard gene expression levels were expressed as fragments per kilobase of transcript per million fragments mapped (FPKM) [83]. Differentially-expressed genes (DEGs) were identified by DEseq [84] with a false discovery rate (FDR) <0.01 and a fold change value (FC) ≥2.

4.5. qRT-PCR

The tiller primordia and leaf samples of the mutant dmc and guomai 301 were prepared at 10 time points for real-time qRT-PCR; the intervals of the 10 time points were seven days from 23 December 2016 to 24 February 2017. Twelve DEGs were selected to test and verify the sequencing data by qRT-PCR. The primers were designed using Primer Premier 5.0 (Table S13). The wheat actin gene was used as an internal control gene. The qRT-PCR reactions were performed in 20 µL volumes containing 10 µL TransStart® Top Green Qpcr SuperMix (2×) (TransGen Biotech, Beijing, China), 2 µL primer mix (10 µM), 1 µL cDNA (50 ng) and 7 µL ddH2O. The PCR parameters were: 94 °C for 30 s, then 42 cycles of 94 °C for 5 s, 60 °C for 30 s. All qRT-PCR reactions were replicated three times. The gene expression levels were calculated according to the 2−ΔΔCt method [85].

4.6. Ethical Approval

This article does not contain any studies with human participants or animals performed by any of the authors.
Wheat (Triticum aestivum L.) plants were used in this study. The wheat cultivar ‘Guomai 301’ was bred in our laboratory.
The wheat mutant dmc was selected from EMS treated Guomai 301 in our laboratory.

5. Conclusions

Transcriptomes of the tiller primordia from the wheat non-tiller mutant dmc and WT Guomai 301 were integratively analyzed. We identified a set of genes related to wheat tiller differentiation. Sixty-nine percent of significant DEGs (FC ≥ 2) were highly expressed and 31% were expressed at a low level in dmc. Phenylpropanoid biosynthesis (ko00940; Figure S10) had the most highly expressed DEGs (9.50%). Carbohydrate-related metabolisms consisted of the largest highly-expressed DEG group, including photosynthesis (6.74%), starch and sucrose metabolism (6.54%), photosynthesis-antenna proteins (6.23%), carbon fixation in photosynthetic organisms (5.52%), carbon metabolism (7.76%), and galactose metabolism (4.09%). The majority of genes that were expressed at a low level belonged to the classes of DNA replication, transcription, and translation, as well as zeatin synthesis. Functional model analysis indicated that variations in carbohydrate metabolism, phytohormones and transcription factors were the major causes of non-tillering in dmc. Synthesis and lower expression of genes related to protein synthesis, auxin, zeatin and cytokinine; syntheses enhanced the expression of genes involved in the biosynthesis of abscisic acid, gibberellins, and ethylene syntheses, consistent with the phenotype of dmc. The expression profiles of TF homologs, knotted-1-like 1, homeobox protein knotted-1-like 12 and KNOX3, and WOX 4 were also consistent with the phenotype of dmc. Other issues need further study, such as the relationship between phenylpropanoid biosynthesis, photosynthesis, variations of different phytohormone concentrations and the phenotype of dmc.

Supplementary Materials

Supplementary materials can be found at https://www.mdpi.com/1422-0067/19/5/1324/s1.

Author Contributions

R.H. performed all the experiments pertaining to trait observation, photograph taking, sample preparation, and qRT-PCR and also analyzed the data and drafted the manuscript. Y.N. treated Guomai 301 with EMS and found the mutant. J.L. helped with sowing and sample preparation. Z.J. helped with sowing, trait observation and figure drawing. X.Z. contributed to sowing and data analysis. Y.J. contributed to the field experiments. Q.L. contributed to the field experiments and maintenance of the wheat accessions. J.N. designed the whole study and drafted the manuscript and gave the final approval to the version of the manuscript that is being sent for consideration for publication.

Acknowledgments

This study was supported by the National Natural Science foundation of China (NSFC, 31571646) and The Special Fund for Key Agricultural Projects in Henan Province, China, in 2016 (161100110400).

Conflicts of Interest

The authors declare that the research was conducted in the absence of any commercial or financial relationships that could be construed as a potential conflict of interest.

References

  1. Kuraparthy, V.; Sood, S.; Dhaliwal, H.S.; Chhuneja, P.; Gill, B.S. Identification and mapping of a tiller inhibition gene (tin3) in wheat. Theor. Appl. Genet. 2007, 114, 285–294. [Google Scholar] [CrossRef] [PubMed]
  2. Naruoka, Y.; Talbert, L.E.; Lanning, S.P.; Blake, N.K.; Martin, J.M.; Sherman, J.D. Identification of quantitative trait loci for productive tiller number and its relationship to agronomic traits in spring wheat. Theor. Appl. Genet. 2011, 123, 1043–1053. [Google Scholar] [CrossRef] [PubMed]
  3. Spielmeyer, W.; Richards, R.A. Comparative mapping of wheat chromosome 1AS which contains the tiller inhibition gene (tin) with rice chromosome 5S. Theor. Appl. Genet. 2004, 109, 1303–1310. [Google Scholar] [CrossRef] [PubMed]
  4. Zhang, J.; Wu, J.; Liu, W.; Lu, X.; Yang, X.; Gao, A.; Li, X.; Lu, Y.; Li, L. Genetic mapping of a fertile tiller inhibition gene, ftin, in wheat. Mol. Breed. 2013, 31, 441–449. [Google Scholar] [CrossRef]
  5. Peng, Z.S.; Yen, C.; Yang, J.L. Genetic control of oligo-culms character in common wheat. Wheat Inf. Serv. 1998, 86, 19–24. [Google Scholar]
  6. Xu, T.; Bian, N.; Wen, M.; Xiao, J.; Yuan, C.; Cao, A.; Zhang, S.; Wang, X.; Wang, H. Characterization of a common wheat (Triticum aestivum L.) high-tillering dwarf mutant. Theor. Appl. Genet. 2017, 130, 483–494. [Google Scholar] [CrossRef] [PubMed]
  7. Dabbert, T.; Okagaki, R.J.; Cho, S.; Heinen, S.; Boddu, J.; Muehlbauer, G.J. The genetics of barley low-tillering mutants: Low number of tillers-1 (lnt1). Theor. Appl. Genet. 2010, 121, 705–715. [Google Scholar] [CrossRef] [PubMed]
  8. Dabbert, T.; Okagaki, R.J.; Cho, S.; Boddu, J.; Muehlbauer, G.J. The genetics of barley low-tillering mutants: Absent lower laterals (als). Theor. Appl. Genet. 2009, 118, 1351–1360. [Google Scholar] [CrossRef] [PubMed]
  9. Babb, S.; Muehlbauer, G.J. Genetic and morphological characterization of the barley uniculm2 (cul2) mutant. Theor. Appl. Genet. 2003, 106, 846–857. [Google Scholar] [CrossRef] [PubMed]
  10. Jiang, H.; Guo, L.B.; Xue, D.W.; Zeng, D.L.; Zhang, G.H.; Dong, G.J.; Gu, M.H.; Qian, Q. Genetic analysis and gene-mapping of two reduced-culm-number mutants in rice. J. Integr. Plant Biol. 2006, 48, 341–347. [Google Scholar] [CrossRef]
  11. Fujita, D.; Ebron, L.A.; Araki, E.; Kato, H.; Khush, G.S.; Sheehy, J.E.; Lafarge, T.; Fukuta, Y.; Kobayashi, N. Fine mapping of a gene for low-tiller number, Ltn, in japonica rice (Oryza sativa L.) variety Aikawa 1. Theor. Appl. Genet. 2010, 120, 1233–1240. [Google Scholar] [CrossRef] [PubMed]
  12. Zhou, Y.; Zhu, J.; Li, Z.; Gu, F.; Zhang, H.; Tang, S.; Gu, M.; Liang, G. Fine mapping and cloning of MT1, a novel allele of D10. Prog. Nat. Sci. 2009, 19, 1683–1689. [Google Scholar] [CrossRef]
  13. Shah, M.M.; Gill, K.S.; Baenziger, P.S.; Yen, Y.; Kaeppler, S.M.; Ariyarathne, H.M. Molecular mapping of loci for agronomic traits on chromosome 3A of bread wheat. Crop Sci. 1999, 39, 1728–1732. [Google Scholar] [CrossRef]
  14. Kato, K.; Miura, H.; Sawada, S. Mapping QTLs controlling grain yield and its components on chromosome 5A of wheat. Theor. Appl. Genet. 2000, 101, 1114–1121. [Google Scholar] [CrossRef]
  15. Li, W.L.; Nelson, J.C.; Chu, C.Y.; Shi, L.H.; Huang, S.H.; Liu, D.J. Chromosomal locations and genetic relationships of tiller and spike characters in wheat. Euphytica 2002, 125, 357–366. [Google Scholar] [CrossRef]
  16. Wang, Z.; Liu, Y.; Shi, H.; Mo, H.; Wu, F.; Lin, Y.; Gao, S.; Wang, J.; Wei, Y.; Liu, C.; et al. Identification and validation of novel low-tiller number QTL in common wheat. Theor. Appl. Genet. 2016, 129, 603–612. [Google Scholar] [CrossRef] [PubMed]
  17. Chen, P.; Jiang, L.; Yu, C.; Zhang, W.; Wang, J.; Wan, J. The identification and mapping of a tiller angle QTL on rice chromosome 9. Crop Sci. 2008, 48, 1799–1806. [Google Scholar] [CrossRef]
  18. Yu, B.; Lin, Z.; Li, H.; Li, X.; Li, J.; Wang, Y.; Zhang, X.; Zhu, Z.; Zhai, W.; Wang, X.; et al. TAC1, a major quantitative trait locus controlling tiller angle in rice. Plant J. 2007, 52, 891–898. [Google Scholar] [CrossRef] [PubMed]
  19. Liu, G.; Zhu, H.; Liu, S.; Zeng, R.; Zhang, Z.; Li, W.; Ding, X.; Zhao, F.; Zhang, G. Unconditional and conditional QTL mapping for the developmental behavior of tiller number in rice (Oryza sativa L.). Genetica 2010, 138, 885–893. [Google Scholar] [CrossRef] [PubMed]
  20. Hoffmann, A.; Maurer, A.; Pillen, K. Detection of nitrogen deficiency QTL in juvenile wild barley introgression lines growing in a hydroponic system. BMC Genet. 2012, 13, 88. [Google Scholar] [CrossRef] [PubMed]
  21. Naz, A.A.; Arifuzzaman, M.; Muzammil, S.; Pillen, K.; Léon, J. Wild barley introgression lines revealed novel QTL alleles for root and related shoot traits in the cultivated barley (Hordeum vulgare L.). BMC Genet. 2014, 15, 107. [Google Scholar] [CrossRef] [PubMed]
  22. Malyshev, S.; Korzun, V.; Voylokov, A.; Smirnov, V.; Borner, A. Linkage mapping of the mutant loci in rye (Secale cereale L.). Theor. Appl. Genet. 2001, 103, 70–74. [Google Scholar] [CrossRef]
  23. Stirnberg, P.; Van, D.S.K.; Leyser, H.M. MAX1 and MAX2 control shoot lateral branching in Arabidopsis. Development 2002, 129, 1131–1141. [Google Scholar] [PubMed]
  24. Booker, J.; Sieberer, T.W.; Williamson, L.; Willett, B.; Stirnberg, P.; Turnbull, C.; Srinivasan, M.; Goddard, P.; Leyser, O. MAX1 encodes a cytochrome P450 family member that acts downstream of MAX3/4 to produce a carotenoid-derived branch-inhibiting hormone. Dev. Cell 2005, 8, 443–449. [Google Scholar] [CrossRef] [PubMed]
  25. Sorefan, K.; Booker, J.; Haurogné, K.; Goussot, M.; Bainbridge, B.; Foo, E.; Chatfield, S.; Ward, S.; Beveridge, Q.C.; Rameau, C.; et al. MAX4 and RMS1 are orthologous dioxygenase-like genes that regulate shoot branching in Arabidopsis and pea. Gene Dev. 2003, 17, 1469–1474. [Google Scholar] [CrossRef] [PubMed]
  26. Booker, J.; Auldridge, M.; Wills, S.; McCarty, D.; Klee, H.; Leyser, O. MAX3/CCD7 is a carotenoid cleavage dioxygenase required for the synthesis of a novel plant signaling molecule. Curr. Biol. 2004, 14, 1232–1238. [Google Scholar] [CrossRef] [PubMed]
  27. Li, X.; Qian, Q.; Fu, Z.; Wang, Y.; Xiong, G.; Zeng, D.; Wang, X.; Liu, X.; Teng, S.; Hiroshi, F.; et al. Control of tillering in rice. Nature 2003, 422, 618–621. [Google Scholar] [CrossRef] [PubMed]
  28. Sun, F.; Zhang, W.; Xiong, G.; Yan, M.; Qian, Q.; Li, J.; Wang, Y. Identification and functional analysis of the MOC1 interacting protein 1. J. Genet. Genom. 2010, 37, 69–77. [Google Scholar] [CrossRef]
  29. Xu, C.; Wang, Y.; Yu, Y.; Duan, J.; Liao, Z.; Xiong, G.; Meng, X.; Liu, G.; Qian, Q.; Li, J. Degradation of MONOCULM 1 by APC/C (TAD1) regulates rice tillering. Nat. Commun. 2012, 3, 750. [Google Scholar] [CrossRef] [PubMed]
  30. Takeda, T.; Suwa, Y.; Suzuki, M.; Kitano, H.; Ueguchi-Tanaka, M.; Ashikari, M.; Matsuoka, M.; Ueguchi, C. The OsTB1 gene negatively regulates lateral branching in rice. Plant J. 2003, 33, 513–520. [Google Scholar] [CrossRef] [PubMed]
  31. Ramsay, L.; Comadran, J.; Druka, A.; Marshall, D.F.; Thomas, W.T.; Macaulay, M.; MacKenzie, K.; Simpson, C.; Fuller, J.; Bonar, N.; et al. INTERMEDIUM-C, a modifier of lateral spikelet fertility in barley, is an ortholog of the maize domestication gene TEOSINTE BRANCHED 1. Nat. Genet. 2011, 43, 169–172. [Google Scholar] [CrossRef] [PubMed]
  32. Chono, M.; Honda, I.; Zeniya, H.; Yoneyama, K.; Saisho, D.; Takeda, K.; Takatsuto, S.; Hoshino, T.; Watanabe, Y. A semidwarf phenotype of barley uzu results from a nucleotide substitution in the gene encoding a putative brassinosteroid receptor. Plant Physiol. 2003, 133, 1209–1219. [Google Scholar] [CrossRef] [PubMed]
  33. Liu, J.; Cheng, X.; Liu, P.; Sun, J. miR156-Targeted SBP-Box transcription factors interact with DWARF53 to regulate TEOSINTE BRANCHED1 and BARREN STALK1 expression in bread wheat. Plant Physiol. 2017, 174, 1931–1948. [Google Scholar] [CrossRef] [PubMed]
  34. Lewis, J.M.; Mackintosh, C.A.; Shin, S.; Gilding, E.; Kravchenko, S.; Baldridge, G.; Zeyen, R.; Muehlbauer, G.J. Overexpression of the maize Teosinte Branched1 gene in wheat suppresses tiller development. Plant Cell Rep. 2008, 27, 1217–1225. [Google Scholar] [CrossRef] [PubMed]
  35. Zhu, X.X.; Li, Q.Y.; Shen, C.C.; Duan, Z.B.; Yu, D.Y.; Niu, J.S.; Ni, Y.J.; Jiang, Y.M. Transcriptome analysis for abnormal spike development of the wheat mutant dms. PLoS ONE 2016, 11, e0149287. [Google Scholar] [CrossRef] [PubMed]
  36. Wang, L.; Hua, Q.; Ma, Y.; Hu, G.; Qin, Y. Comparative transcriptome analyses of a late-maturing mandarin mutant and its original cultivar reveals gene expression profiling associated with citrus fruit maturation. PeerJ. 2017, 5, e3343. [Google Scholar] [CrossRef] [PubMed]
  37. Xu, K.; Sun, F.; Chai, G.; Wang, Y.; Shi, L.; Liu, S.; Xi, Y. De novo assembly and transcriptome analysis of two contrary tillering mutants to learn the mechanisms of tillers outgrowth in switchgrass (Panicum virgatum L.). Front. Plant Sci. 2015, 6, 749. [Google Scholar] [CrossRef] [PubMed]
  38. Wang, Y.; Zeng, X.; Peal, L.; Tang, Y.; Wu, Y.; Mahalingam, R. Transcriptome analysis of nodes and buds from high and low tillering switchgrass inbred lines. PLoS ONE 2013, 8, e83772. [Google Scholar] [CrossRef] [PubMed]
  39. Kebrom, T.H.; Mullet, J.E. Transcriptome profiling of tiller buds provides new insights into PhyB regulation of tillering and indeterminate growth in sorghum. Plant Physiol. 2016, 170, 2232–2250. [Google Scholar] [CrossRef] [PubMed]
  40. Shan, X.; Yan, J.; Xie, D. Comparison of phytohormone signaling mechanisms. Curr. Opin. Plant Biol. 2012, 15, 84–91. [Google Scholar] [CrossRef] [PubMed]
  41. Wang, Y.; Li, J. Molecular basis of plant architecture. Annu. Rev. Plant Biol. 2008, 59, 253–279. [Google Scholar] [CrossRef] [PubMed]
  42. Mcsteen, P. Auxin and monocot development. CSH. Perspect. Biol. 2010, 2, a001479. [Google Scholar] [CrossRef] [PubMed]
  43. Yamaguchi, S. Gibberellin metabolism and its regulation. Annu. Rev. Plant Biol. 2008, 59, 225–251. [Google Scholar] [CrossRef] [PubMed]
  44. Hussien, A.; Tavakol, E.; Horner, D.S.; Muñoz-Amatriaín, M.; Muehlbauer, G.J.; Rossini, L. Genetics of tillering in rice and barley. Plant Genome 2014, 7, 93–113. [Google Scholar] [CrossRef]
  45. Janssen, B.J.; Drummond, R.S.; Snowden, K.C. Regulation of axillary shoot development. Curr. Opin. Plant Biol. 2014, 17, 28–35. [Google Scholar] [CrossRef] [PubMed]
  46. Kebrom, T.H.; Spielmeyer, W.; Finnegan, E.J. Grasses provide new insights into regulation of shoot branching. Trends Plant Sci. 2013, 18, 41–48. [Google Scholar] [CrossRef] [PubMed]
  47. Stirnberg, P.; Chatfield, S.P.; Leyser, H.M.O. AXR1 acts after lateral bud formation to inhibit lateral bud growth in Arabidopsis. Plant Physiol. 1999, 121, 839–847. [Google Scholar] [CrossRef] [PubMed]
  48. Jung, H.; Lee, D.K.; Choi, Y.D.; Kim, J.K. OsIAA6, a member of the rice Aux/IAA gene family, is involved in drought tolerance and tiller outgrowth. Plant Sci. 2015, 236, 304–312. [Google Scholar] [CrossRef] [PubMed]
  49. Booker, J.; Chatfield, S.; Leyser, O. Auxin acts in xylem-associated or medullary cells to mediate apical dominance. Plant Cell 2003, 15, 495–507. [Google Scholar] [CrossRef] [PubMed]
  50. Ferguson, B.J.; Beveridge, C.A. Roles for auxin, cytokinin, and strigolactone in regulating shoot branching. Plant Physiol. 2009, 149, 1929–1944. [Google Scholar] [CrossRef] [PubMed]
  51. Crawford, S.; Shinohara, N.; Sieberer, T.; Williamson, L.; George, G.; Hepworth, J.; Müller, D.; Domagalska, M.A.; Leyser, O. Strigolactones enhance competition between shoot branches by dampening auxin transport. Development 2010, 137, 2905–2913. [Google Scholar] [CrossRef] [PubMed]
  52. Müller, D.; Waldie, T.; Miyawaki, K.; To, J.P.; Melnyk, C.W.; Kieber, J.J.; Kakimoto, T.; Leyser, Y. Cytokinin is required for escape but not release from auxin mediated apical dominance. Plant J. 2015, 82, 874–886. [Google Scholar] [CrossRef] [PubMed]
  53. Yeh, S.Y.; Chen, H.W.; Ng, C.Y.; Lin, C.Y.; Tseng, T.H.; Li, W.H.; Ku, M.S. Down-regulation of cytokinin oxidase 2 expression increases tiller number and improves rice yield. Rice 2015, 8, 36. [Google Scholar] [CrossRef] [PubMed]
  54. Lo, S.F.; Yang, S.Y.; Chen, K.T.; Hsing, Y.I.; Zeevaart, J.A.; Chen, L.J.; Yu, S.M. A novel class of gibberellin 2-oxidases control semidwarfism, tillering, and root development in rice. Plant Cell 2008, 20, 2603–2618. [Google Scholar] [CrossRef] [PubMed]
  55. Mauriat, M.; Sandberg, L.G.; Moritz, T. Proper gibberellin localization in vascular tissue is required to control auxin-dependent leaf development and bud outgrowth in hybrid aspen. Plant J. 2011, 67, 805–816. [Google Scholar] [CrossRef] [PubMed]
  56. Ni, J.; Gao, C.; Chen, M.S.; Pan, B.Z.; Ye, K.; Xu, Z.F. Gibberellin promotes shoot branching in the perennial woody plant Jatropha curcas. Plant Cell Physiol. 2015, 56, 1655–1666. [Google Scholar] [CrossRef] [PubMed]
  57. Sun, T. The molecular mechanism and evolution of the GA-GID1-DELLA signaling module in plants. Curr. Biol. 2011, 21, R338–R345. [Google Scholar] [CrossRef] [PubMed]
  58. Wang, Y.; Du, Y.; Yang, Z.; Chen, L.; Condon, A.G.; Hu, Y. Comparing the effects of GA-responsive dwarfing genes Rht13, and Rht8, on plant height and some agronomic traits in common wheat. Field Crop Res. 2015, 179, 35–43. [Google Scholar] [CrossRef]
  59. Perilli, S.; Moubayidin, L.; Sabatini, S. The molecular basis of cytokinin function. Curr. Opin. Plant Biol. 2010, 13, 21–26. [Google Scholar] [CrossRef] [PubMed]
  60. Mason, M.G.; Ross, J.J.; Babst, B.A.; Wienclaw, B.N.; Beveridge, C.A. Sugar demand, not auxin, is the initial regulator of apical dominance. Proc. Natl. Acad. Sci. USA 2014, 111, 6092–6097. [Google Scholar] [CrossRef] [PubMed]
  61. Kebrom, T.H.; Chandler, P.M.; Swain, S.M.; King, R.W.; Richards, R.A.; Spielmeyer, W. Inhibition of tiller bud outgrowth in the tin mutant of wheat is associated with precocious internode development. Plant Physiol. 2012, 160, 308–318. [Google Scholar] [CrossRef] [PubMed]
  62. Rabot, A.; Henry, C.; Baaziz, K.B.; Mortreau, E.; Azri, W.; Lothier, J.; Hamama, L.; Boummaza, R.; Leduc, N.; Pelleschi-Travier, S.; et al. Insight into the role of sugars in bud burst under light in the rose. Plant Cell Physiol. 2012, 53, 1068–1082. [Google Scholar] [CrossRef] [PubMed] [Green Version]
  63. Barbier, F.; Péron, T.; Lecerf, M.; Perez-Garcia, M.D.; Barrière, Q.; Rolčík, J.; Boutet-Mercey, S.; Citerne, S.; Lemoine, R.; Porcheron, B.; et al. Sucrose is an early modulator of the key hormonal mechanisms controlling bud outgrowth in Rosa hybrida. J. Exp. Bot. 2015, 66, 2569–2582. [Google Scholar] [CrossRef] [PubMed] [Green Version]
  64. Zhang, M.; Hu, X.; Zhu, M.; Xu, M.; Wang, L. Transcription factors NF-YA2 and NF-YA10 regulate leaf growth via auxin signaling in Arabidopsis. Sci. Rep. UK 2017, 7, 1395. [Google Scholar] [CrossRef] [PubMed]
  65. Theißen, G.; Melzer, R.; Rümpler, F. MADS-domain transcription factors and the floral quartet model of flower development: Linking plant development and evolution. Development 2016, 143, 3259–3271. [Google Scholar] [CrossRef] [PubMed]
  66. Wang, W.; Li, G.; Zhao, J.; Chu, H.; Lin, W.; Zhang, D.; Wang, Z.; Liang, W. Dwarf Tiller1, a Wuschel-related homeobox transcription factor, is required for tiller growth in rice. PLoS Genet. 2014, 10, e1004154. [Google Scholar] [CrossRef] [PubMed]
  67. Bolduc, N.; Hake, S. The maize transcription factor KNOTTED1 directly regulates the gibberellin catabolism gene ga2ox1. Plant Cell 2009, 21, 1647–1658. [Google Scholar] [CrossRef] [PubMed]
  68. Kuijt, S.J.; Greco, R.; Agalou, A.; Shao, J.; ‘t Hoen, C.C.J.; Overnas, E.; Osnato, M.; Curiale, S.; Meynard, D.; Gulik, R.V.; et al. Interaction between the GROWTH-REGULATING FACTOR and KNOTTED1-LIKE HOMEOBOX families of transcription factors. Plant Physiol. 2014, 164, 1952–1966. [Google Scholar] [CrossRef] [PubMed]
  69. Mjomba, F.M.; Zheng, Y.; Liu, H.; Tang, W.; Hong, Z.; Wang, F.; Wu, W. Homeobox is pivotal for OsWUS controlling tiller development and female fertility in rice. G3 Genes Genom. Genet. 2016, 6, 2013–2021. [Google Scholar] [CrossRef] [PubMed]
  70. Fridborg, I.; Kuusk, S.; Robertson, M.; Sundberg, E. The Arabidopsis protein SHI represses gibberellin responses in Arabidopsis and barley. Plant Physiol. 2001, 127, 937–948. [Google Scholar] [CrossRef] [PubMed]
  71. Duan, Z.B.; Shen, C.C.; Li, Q.Y.; Lü, G.Z.; Ni, Y.J.; Yu, D.Y.; Niu, J.S. Identification of a novel male sterile wheat mutant dms conferring dwarf status and multi-pistils. J. Integr. Agric. 2015, 14, 1706–1714. [Google Scholar] [CrossRef]
  72. Pestsova, E.; Ganal, M.W.; Röder, M.S. Isolation and mapping of microsatellite markers specific for the D genome of bread wheat. Genome 2000, 43, 689–697. [Google Scholar] [CrossRef] [PubMed]
  73. Somers, D.; Isaac, P.; Edwards, K. A high-density microsatellite consensus map for bread wheat (Triticum aestivum L.). Theor. Appl. Genet. 2004, 109, 1105–1114. [Google Scholar] [CrossRef] [PubMed]
  74. Cota-Sánchez, J.H.; Remarchuk, K.; Ubayasena, K. Ready-to-use DNA extracted with a CTAB method adapted for herbarium specimens and mucilaginous plant tissue. Plant Mol. Biol. Rep. 2006, 24, 161–167. [Google Scholar] [CrossRef]
  75. Bassam, B.J.; Caetanoanollés, G.; Gresshoff, P.M. Fast and sensitive silver staining of DNA in polyacrylamide gels. Anal. Biochem. 1991, 196, 80–83. [Google Scholar] [CrossRef]
  76. Schulze, S.K.; Kanwar, R.; Gölzenleuchter, M.; Therneau, T.M.; Beutler, A.S. SERE: Single-parameter quality control and sample comparison for RNA-Seq. BMC Genom. 2012, 13, 524. [Google Scholar] [CrossRef] [PubMed]
  77. The Triticum aestivum Genome Sequence. Available online: http://ftp.ensemblgenomes.org/pub/plants/release-32/fasta/triticum_aestivum/. (accessed on 2 October 2017).
  78. Kim, D.; Pertea, G.; Trapnell, C.; Pimentel, H.; Kelley, R.; Salzberg, S.L. TopHat2: Accurate alignment of transcriptomes in the presence of insertions, deletions and gene fusions. Genome Biol. 2013, 14, R36. [Google Scholar] [CrossRef] [PubMed] [Green Version]
  79. Altschul, S.F.; Madden, T.L.; Schäffer, A.A.; Zhang, J.; Zhang, Z.; Miller, W.; Lipman, D.J. Gapped BLAST and PSI BLAST: A new generation of protein database search programs. Nucleic Acids Res. 1997, 25, 3389–3402. [Google Scholar] [CrossRef] [PubMed]
  80. Trapnell, C.; Williams, B.A.; Pertea, G.; Mortazavi, A.; Kwan, G.; Baren, M.J.; Salzberg, S.L.; Wold, B.J.; Pachter, L. Transcript assembly and quantification by RNA Seq reveals unannotated transcripts and isoform switching during cell differentiation. Nat. Biotechnol. 2010, 28, 511–515. [Google Scholar] [CrossRef] [PubMed]
  81. Xie, C.; Mao, X.; Huang, J.; Ding, Y.; Wu, J.; Dong, S.; Kong, L.; Gao, G.; Li, C.Y.; Li, L. KOBAS 2.0: A web server for annotation and identification of enriched pathways and diseases. Nucleic Acids Res. 2011, 39, W316–W322. [Google Scholar] [CrossRef] [PubMed]
  82. Eddy, S.R. Profile hidden Markov models. Bioinformatics 1998, 14, 755–763. [Google Scholar] [CrossRef] [PubMed]
  83. Florea, L.; Song, L.; Salzberg, S.L. Thousands of exon skipping events differentiate among splicing patterns in sixteen human tissues. F1000Research 2013, 2, 188. [Google Scholar] [CrossRef] [PubMed]
  84. Wang, L.; Feng, Z.; Wang, X.; Wang, X.; Zhang, X. DEGseq: An R package for identifying differentially expressed genes from RNA-seq data. Bioinformatics 2010, 26, 136–138. [Google Scholar] [CrossRef] [PubMed]
  85. Livak, K.J.; Schmittgen, T.D. Analysis of relative gene expression data using real-time quantitative PCR and the 2−ΔΔCT method. Methods 2001, 25, 402–408. [Google Scholar] [CrossRef] [PubMed]
Figure 1. Comparison of agronomic traits between the WT and mutant dmc. (A) The plant phenotype of the WT (left) and mutant dmc (right); (B) the spikes of the WT (left) and mutant dmc (right); (C) the seeds of the WT (left) and mutant dmc (right) at the filling stage; (D) the seeds of the WT (left) and mutant dmc (right) at the mature stage; (E) the transverse sections of the top first internodes of the WT (up) and mutant dmc (down); and (F) the internodes of the WT (left) and mutant dmc individuals (right).
Ijms 19 01324 g001
Figure 2. The tiller differentiation of the mutant dmc and WT. The tiller primordia of the WT (A) and mutant dmc (C) at the early tillering stage; the small tillers of the WT (B) and mutant dmc (D) at the middle tillering stage; and only one very small tiller at the basal node of dmc at the elongation stage (E). Arrow heads indicate the tiller primordia or small tillers, scale bar: 2 mm.
Ijms 19 01324 g002
Figure 3. Expression level of DEGs in the mutant dmc compared to WT. (A) Pie chart of DEGs; (B) volcano plots of DEGs. The red and green dots represent genes expressed at high and low levels, respectively, in the mutant dmc; FC: Fold Change; FDR; false discovery rate; (C) Heatmap of DEGs. T1, T2, T3: mutant dmc; T4, T5, T6: WT. The color scale indicates the Log2 FPKM values.
Ijms 19 01324 g003
Figure 4. Functional classification of DEGs in the GO database.
Ijms 19 01324 g004
Figure 5. The top ten enhanced and suppressed pathways in the mutant dmc compared to the WT. (Left) The enhanced pathways; (Right) the suppressed pathways. Percentage: The ratio of the number of DEGs annotated to one pathway to the number of DEGs annotated to all pathways.
Ijms 19 01324 g005
Figure 6. Significance analysis of the enriched pathways. Rich factor: the percentage of A/B. A: The percentage of DEGs annotated to a pathway. B: The percentage of unigenes annotated to a pathway. Q value: corrective p value.
Ijms 19 01324 g006
Figure 7. Heatmap of the DEGs involved in plant hormone metabolisms. (A) The DEGs in auxin metabolism; (B) the DEGs in abscisic acid metabolism; (C) the DEGs in cytokinin metabolism; and (D) the DEGs in gibberellin metabolism. T1, T2, T3: mutant dmc; T4, T5, T6: WT The color scale indicates the Log2 FPKM values.
Ijms 19 01324 g007
Figure 8. A bar chart of the DEGs involved in carbohydrate metabolisms and the transcription factors. (A) Classification of the DEGs involved in carbohydrate metabolisms. x-axis: the subcategories of carbohydrate metabolisms, y-axis: the number of DEGs in each subcategory; (B) Classification of the differentially-expressed transcription factors. x-axis: The subfamilies of transcription factors, y-axis: the number of DEGs in each family of transcription factors. Red: highly-expressed DEGs; green: DEGs expressed at a low level.
Ijms 19 01324 g008
Figure 9. Temporal expression profiles of the twelve genes in wheat tiller primordia and leaves. (A) Histone H2B.1 gene (CS42-U-AA2080400); (B) PGR5-like protein 1A gene (CS42-1BS-AA0175910); (C) WRKY transcription factor 12 gene (CS42-2DL-AA0534130); (D) ATP-dependent zinc metalloprotease FTSH 5 gene (CS42-5BL-AA1349930); (E) BOI-related E3 ubiquitin-protein ligase 3 gene (CS42-U-AA2143280); (F) Acid phosphatase 1 gene (CS42-2DS-AA0603970); (G) Bidirectional sugar transporter SWEET3a gene (CS42-1BS-AA0159600); (H) Arginine decarboxylase gene (CS42-3DL-AA0834780); (I) F-box/FBD/LRR-repeat protein At5g22670 gene (CS42-1BS-AA0166120); (J) SPX domain-containing membrane protein Os02g45520 gene (CS42-6BL-AA1610920); (K) GDSL esterase/lipase At1g28600 gene (CS42-2AL-AA0292740); (L) Abscisic stress-ripening protein 1 gene (Wheat-newGene-4506). T: tiller primordia; L: leaves; WT: Guomai 301; DMC: mutant dmc; Error bars indicate the standard deviation. x-axis: 10 time points of the sample preparation; the intervals were seven days from 23 December 2016 to 24 February 2017. All qRT-PCR reactions were replicated three times.
Ijms 19 01324 g009aIjms 19 01324 g009b
Table 1. Comparison of agronomic traits between the WT and mutant dmc.
TraitsWTdmc
Plant height/cm64.45 ± 3.2848.00 ± 2.63 **
Spike length/cm10.47 ± 0.536.48 ± 0.90 **
Internode number of main stem5.00 ± 04.18 ± 0.51 **
The top first internode length of the main stem/cm21.74 ± 2.2819.46 ± 2.37
The top second internode length of the main stem/cm13.98 ± 0.2711.21 ± 1.55 *
The top third internode length of the main stem/cm9.42 ± 0.746.48 ± 0.34 **
The top fourth internode length of the main stem/cm5.78 ± 0.294.24 ± 0.22 **
The top fifth internode length of the main stem/cm3.19 ± 0.31-
Tiller number21.73 ± 2.201.11 ± 0.3 **
Spike number16.64 ± 0.921.06 ± 0.32 **
Spikelet number on the main stem21.73 ± 1.1914.85 ± 2.09 **
Seed number per spike64.10 ± 5.3634.16 ± 4.28 **
1000-grain weight/g44.17 ± 4.5935.41 ± 4.34 **
Heading stage/week2728
Anthesis stage/week2829
Maturity stage/week3233
* p < 0.05; ** p < 0.01.

