Article

Development and Characterization of Novel Genic-SSR Markers in Apple-Juniper Rust Pathogen Gymnosporangium yamadae (Pucciniales: Pucciniaceae) Using Next-Generation Sequencing

1
The Key Laboratory for Silviculture and Conservation of Ministry of Education, Beijing Forestry University, Beijing 100083, China
2
Museum of Beijing Forestry University, Beijing Forestry University, Beijing 100083, China
*
Author to whom correspondence should be addressed.
These authors contributed equally to this work.
Int. J. Mol. Sci. 2018, 19(4), 1178; https://doi.org/10.3390/ijms19041178
Submission received: 6 March 2018 / Revised: 3 April 2018 / Accepted: 8 April 2018 / Published: 12 April 2018
(This article belongs to the Special Issue Plant–Fungal Interactions)

Abstract

:
The Apple-Juniper rust, Gymnosporangium yamadae, is an economically important pathogen of apples and junipers in Asia. The absence of markers has hampered the study of the genetic diversity of this widespread pathogen. In our study, we developed twenty-two novel microsatellite markers for G. yamadae from randomly sequenced regions of the transcriptome, using next-generation sequencing methods. These polymorphic markers were also tested on 96 G. yamadae individuals from two geographical populations. The allele numbers ranged from 2 to 9 with an average value of 6 per locus. The polymorphism information content (PIC) values ranged from 0.099 to 0.782 with an average value of 0.48. Furthermore, the observed (HO) and expected (HE) heterozygosity ranged from 0.000 to 0.683 and 0.04 to 0.820, respectively. These novel developed microsatellites provide abundant molecular markers for investigating the genetic structure and genetic diversity of G. yamadae, which will help us to better understand disease epidemics and the origin and migration routes of the Apple-Juniper rust pathogen. Further studies will also be completed to dissect how human activities influence the formation of current population structures. Furthermore, these SSR (simple sequence repeat) markers can also be used as tools to identify virulence by mapping the whole genomes of different virulent populations. These markers will, thus, assist the development of effective risk-assessment models and management systems for the Apple-Juniper rust pathogen.

Graphical Abstract

1. Introduction

The domesticated apple (Malus × domestica Borkh., family Rosaceae, tribe Pyreae) is the main fruit crop of temperate regions of the world [1]. The production of apples in most areas of northern China accounts for more than half of the world’s output and, thus, plays an essential strategic role in export, agricultural structure adjustment, and farmer incomes [2,3]. However, hectares of apple production can be limited by a variety of diseases caused by fungi [4,5]. Gymnosporangium yamadae Miyabe, belonging to the Pucciniaceae family, is a serious rust pathogen of domestic apples as well as cultivated junipers, which causes much concern in Asia [6,7]. As one of the non-European Gymnosporangium species, it has been listed as an A1 quarantine organism by European and Mediterranean Plant Protection Organization (EPPO) [8]. In China, this species has a wide range of distribution throughout the country and reduces fruit yield by inhibiting photosynthesis and increasing respiration due to infection, which threatens the economic development of local orchards [9,10,11,12]. Under natural conditions, this pathogen is believed to be heteroecious (two taxonomically unrelated hosts are needed to complete its life cycle) and macrocyclic (0-spermatia, I-aeciospores, III-teliospores and IV-basidiospores) [6,7]. The telial host of G. yamadae, Juniperus chinensis L., exists commonly in parks, roadsides and graveyards, and the alternate aecial hosts, Malus baccata, M. domestica, M. prunifolia and M. toringo and other several species of Malus, are often planted in the same sites as J. chinensis. With the increased movement of junipers as nursery stock and cultivated apple as favored fruits for consumption, the risk of disease occurrence is rather high [13]. Although the primary method of rust control is the application of protective or systemic fungicides and blocking of the infection cycle, the most popular method for disease control is the use of resistant varieties, due to its efficiency, low cost and reduced impact on the environment [14].
Rust fungi are obligate parasites that only infect specific plant genera or species [7], it shows genetic diversity [15] and there are many studies focused on the ability of rust fungi to adapt. There has been a long history of breeders fighting against the appearance of new rust races that have overcome resistance genes in crops and trees [16,17,18,19]. Twenty Malus species have been tested by inoculation experiments in 1984 and the results indicated that only Malus halliana Koehne showed high resistance to infection by basidiospores of G. yamadae [20]. However, the genetic diversity, population structure and gene flow of the G. yamadae population remained unclear due to the lack of research on molecular markers, which hindered the effective prevention and control of this species based on genomic information.
For the wheat stem rust pathogen, Puccinia graminis f. sp. tritici, and wheat stripe rust pathogen, P. striiformis f. sp. tritici, the population structure has been studied using molecular markers since the 1980s [21,22,23]. These markers proved useful in studying genetic diversity; however, each has limitations in application, such as the issue of replicability, ambiguous fragment size, and homoplasy. Especially, in the case of certain dikaryotic organisms, codominant markers such as simple sequence repeats (SSRs-microsatellite) have been shown to be more informative in revealing genetic variation compared to dominant markers [24,25]. Microsatellites are regions of DNA consisting of short, tandemly repeated motifs (1–6 bp in length), which have a high level of polymorphism and are widely dispersed in the genomes of all prokaryotic and eukaryotic organisms [24,26]. Microsatellite analyses are relatively simple and easier to score than other genetic markers (e.g., restriction fragment length polymorphism (RFLP), random amplified polymorphic DNA (RAPD) and amplified fragment length polymorphism (AFLP) because their gel band patterns are easy to detect, producing unambiguous results.
Thus, microsatellites have recently been developed and validated in many rust fungi, such as P. striiformis f. sp. tritici, P. graminis f. sp. tritici, P. coronata, P. novopanici, P. triticina and coffee rust Hemileia vastatrix [22,27,28,29,30,31,32,33,34,35]. However, no microsatellite primers specific to G. yamadae have been developed to date, so microsatellites for the studies of G. yamadae are urgently required. The traditional approaches to microsatellite development, such as massive-scale cloning and sequencing of DNA or EST libraries, are labor intensive and time-consuming. With the rapid development of next-generation sequencing technology, an alternative approach to identify a great number of novel microsatellites based on large-scale RNA-seq became fast, cost-effective and reliable, especially for non-model species [36].
In our study, we used NGS (next generation sequencing) to sequence the G. yamadae transcriptome and screened transcript sequences obtained by de novo assembly to detect microsatellites. We then validated the SSR primer sets using G. yamadae samples from two geographical areas in China. This is the first time that novel microsatellites for G. yamadae have been identified. The developed markers will be important resources to further determine the genetic diversity and genetic structure of this severe pathogen.

2. Results

2.1. Pair-End Sequences Obtained with the Illumina de Novo Sequencing

In our study, we built the transcriptome of G. yamadae during the telial stage of its lifecycle. Three biological replicates were collected, and cDNA libraries were independently constructed and subsequently sequenced using an Illumina Hi-Seq 2000 platform. Approximately 150 million 100-bp paired end (PE) raw reads were generated from each G. yamadae cDNA library (Table 1). These data have been deposited in the NCBI Sequence Read Archive under accession numbers SRR5167035–SRR5167040. After removing the adapters and low Phred quality sequences, approximately 150 million high-quality sequence reads were obtained from the three G. yamadae libraries (Table 1).
The trimmed reads were then assembled into transcriptomes using the Trinity package [37]; 49,318 transcripts, with a mean length of 1006 bp and an N50 value of 1957, were obtained for G. yamadae. Using overlapping information from high-quality reads, we identified 35,102 unigenes for G. yamadae, with average lengths of 756 (Table 2).

2.2. Mining of Genic SSRs

A total of 35,102 unigenes covering 26,521,164 bp of the G. yamadae genome were identified in our data. Of these, 3942 sequences with SSR were detected, and 1136 sequences contained more than one SSR.

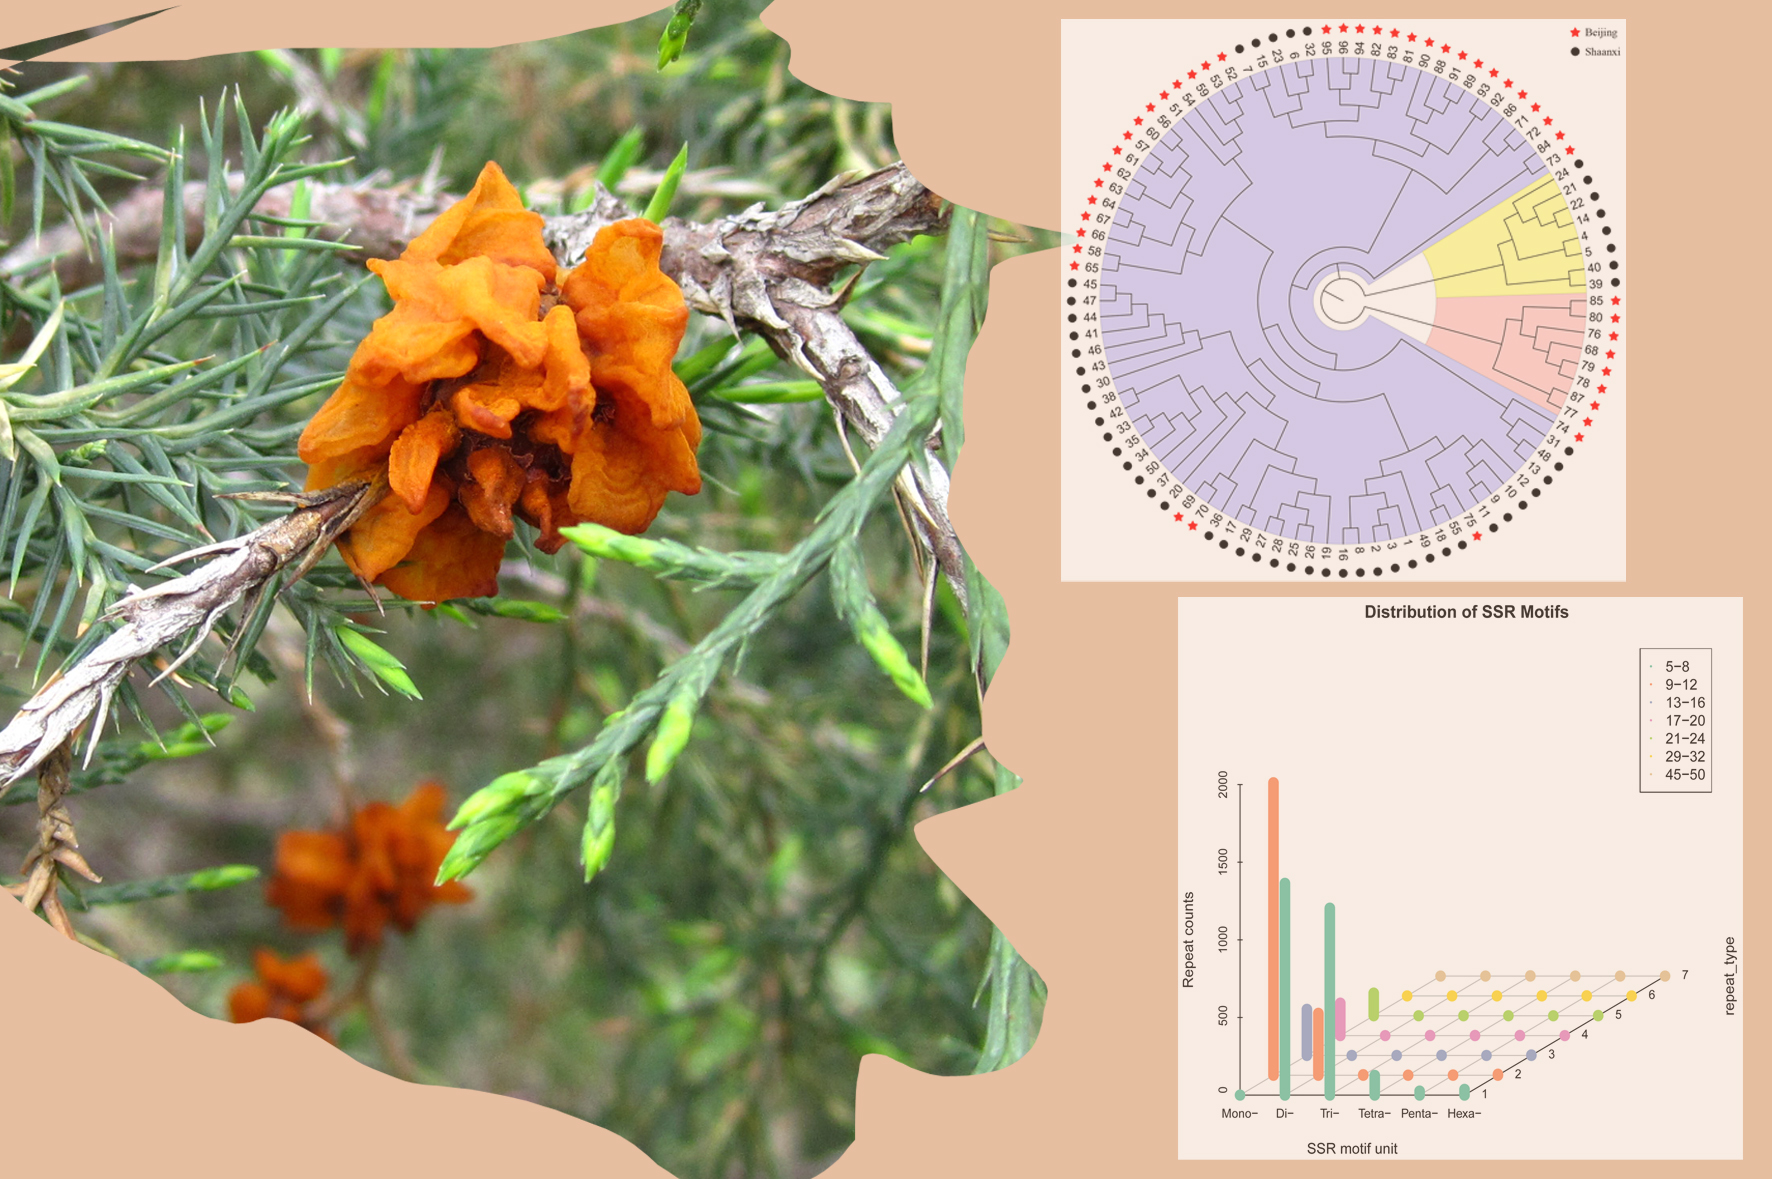
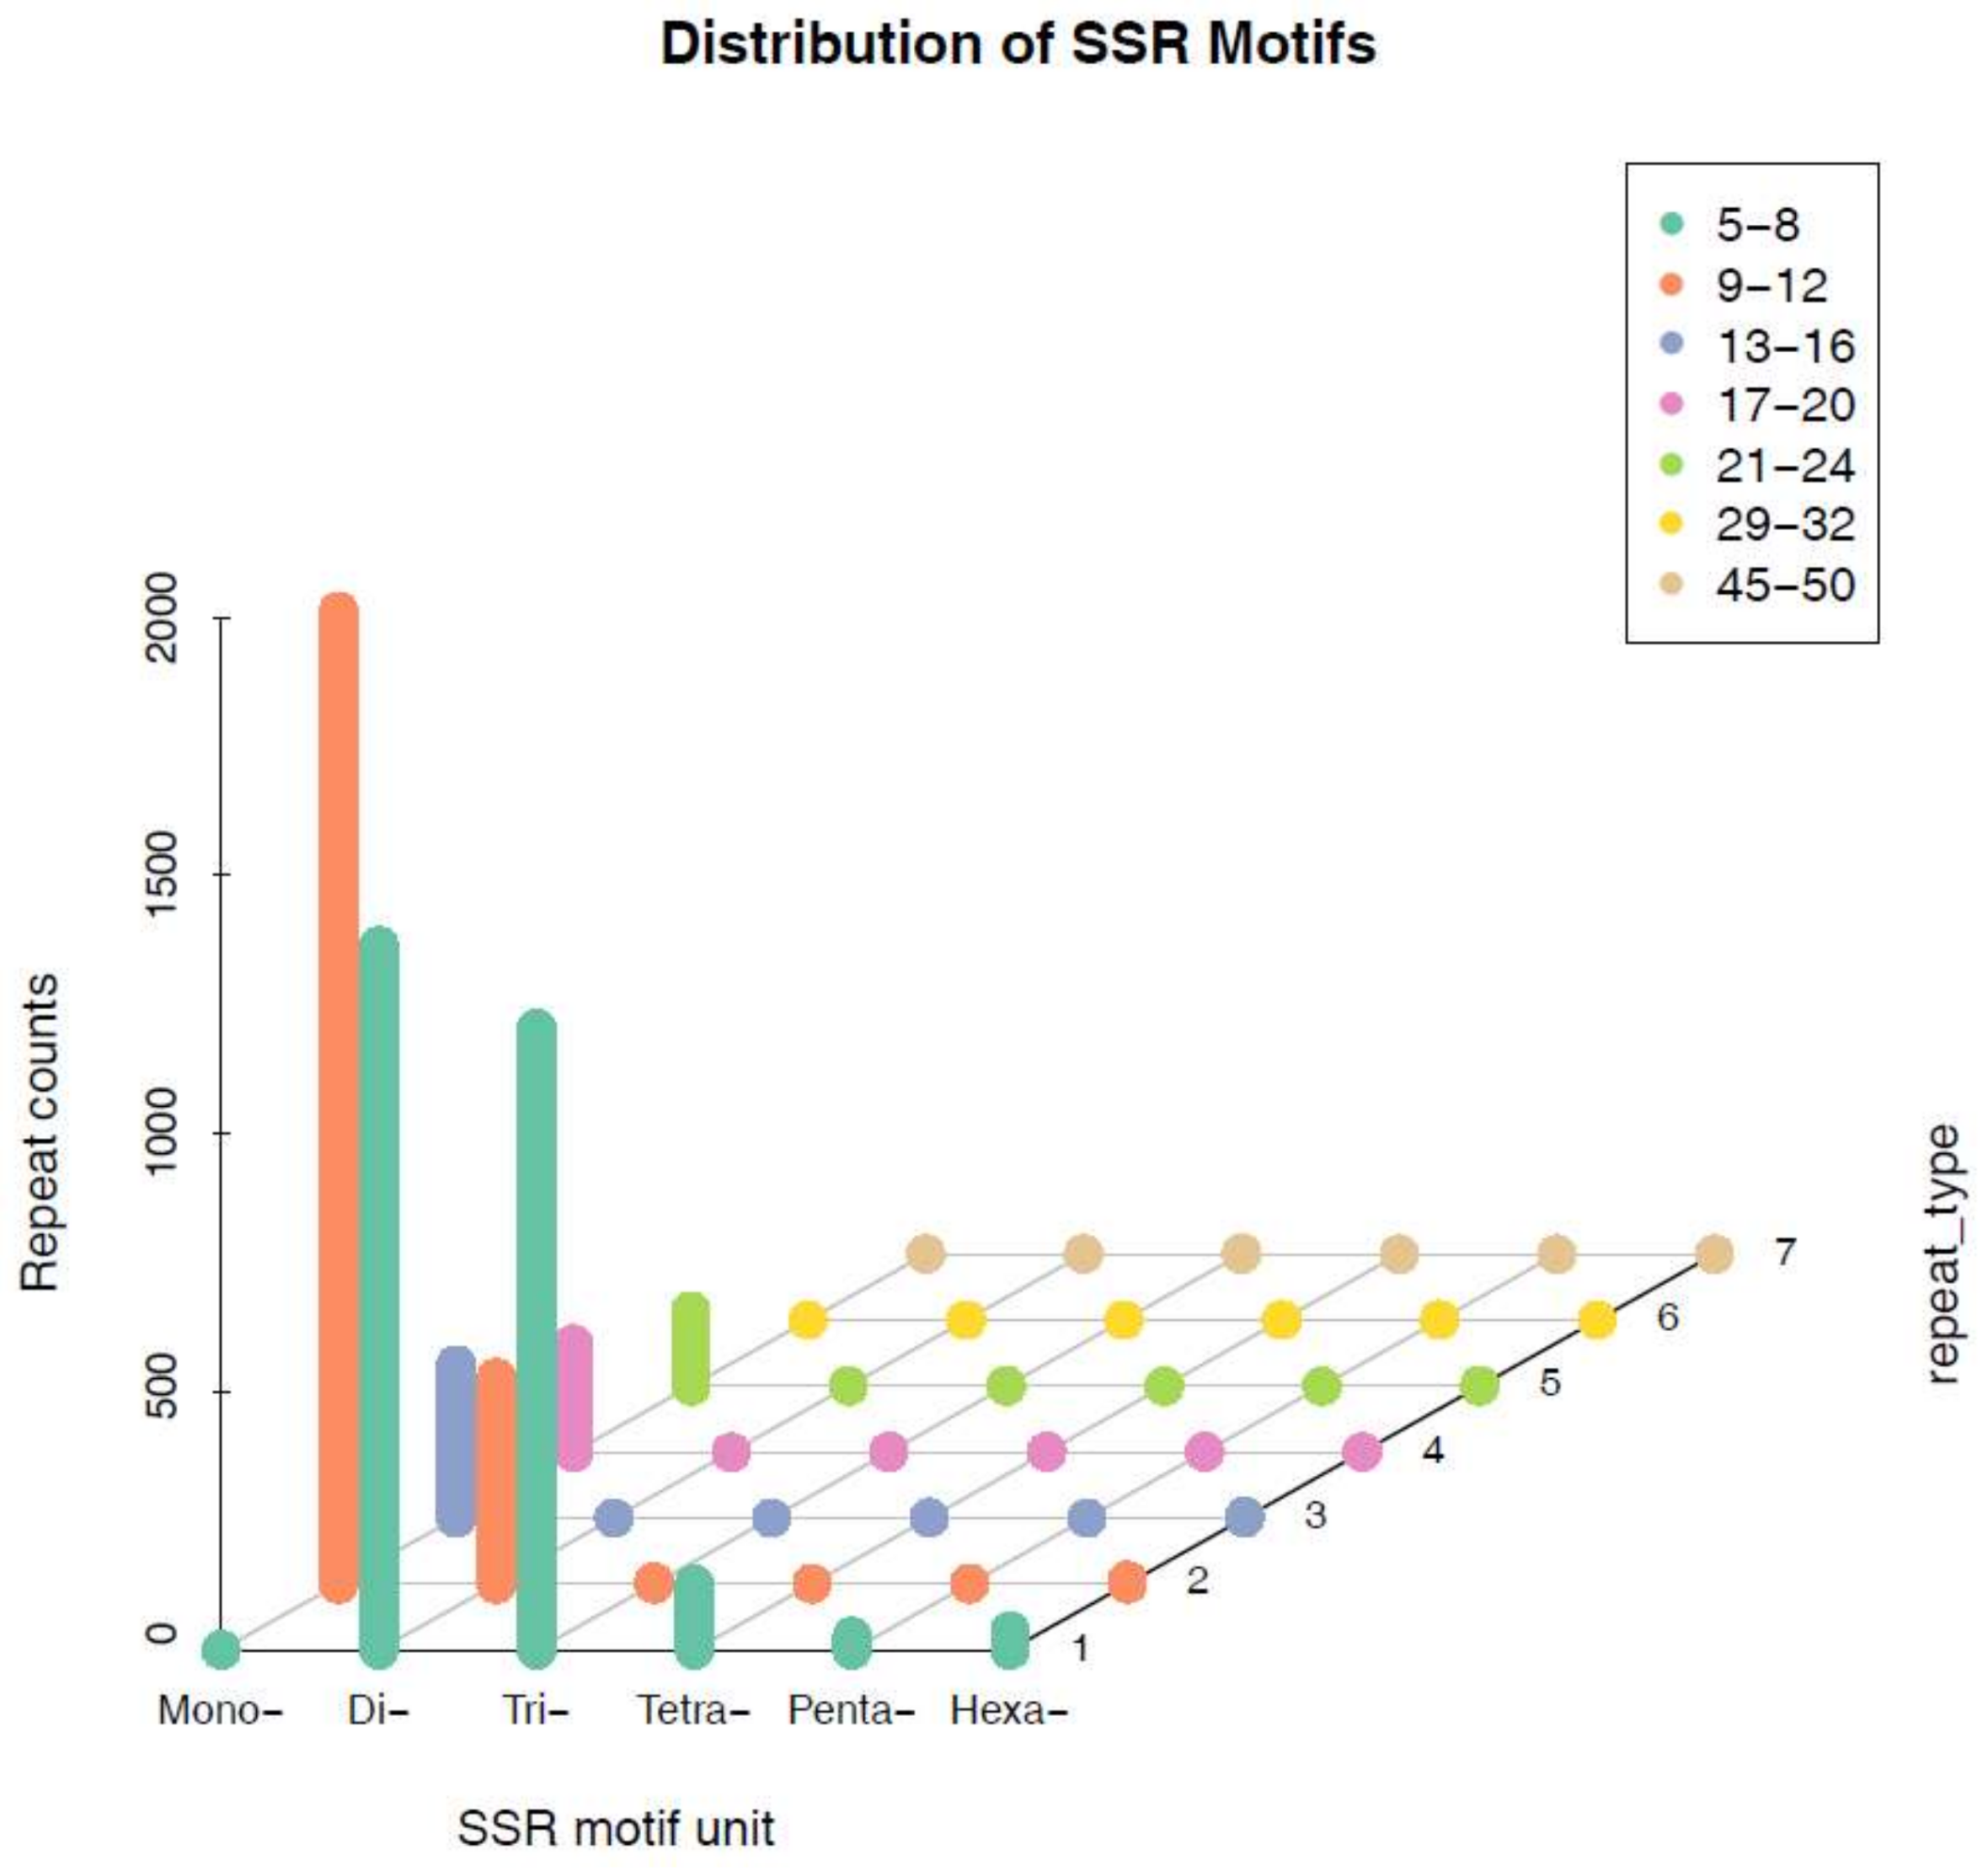
2.3. Distribution of SSR Motif

The proportions of six different SSR unit sizes were not evenly distributed among all SSRs. Different repeat units occurred at the following frequencies: 37.27% for mono-nucleotides, 34.88% for di-nucleotides, and 23.90% for tri-nucleotides; these accounted for the largest proportions. An additional 2.55%, 0.55%, and 0.87% of the repeats were tetra-nucleotides, penta-nucleotides and hexa-nucleotides, respectively (Table 3). We divided the motif repeat types into seven groups. A repeat number of 5–8 was abundant in the di- and tri-nucleotide motif types, and a repeat number of 9–12 was abundant in the mono-nucleotide motif type. Of the 1884 mono-nucleotide motifs, the (A/T)n mono-nucleotide repeat motif was the most abundant in the dataset. The three other main unit types were (AT/AT)n di-nucleotides, (ACC/GGT)n and (ATC/ATG)n in tri-nucleotides and (AAAT/ATTT)n in tetra-nucleotides, which occurred at frequencies of 15.43%, 4.23%, and 0.26%, respectively (Table 3).
Further analysis indicated that the copy numbers of different repeat motifs were distributed unevenly (Table 4). The copy numbers of different motif types ranged from 5 to 24, and the four most abundant copy numbers for SSRs were 10 (24.54%), 6 (18.31%), 5 (14.48%), and 7 (10.62%). According to the distribution of microsatellites (Figure 1, Table 4), it seems that the number of loci decrease with the increase in corresponding motif repeats.

2.4. PCR Amplification and Polymorphism of Genic-SSRs

Using the software Primer 3 [38], 2832 SSR primers were designed according to the flanking sequences of the 3942 SSR-containing sequences. Of these, 88 primers were randomly selected and synthesized for initial validation on eight individuals. The information about the selected primers is given in Table S1, and the information about the specimens used for amplification is given in Table S2. The PCR amplification results were evaluated by gel electrophoresis. Of the 88 primers, PCR amplicons were not obtained for 40 markers (45%) (Table S3), and the successfully amplified markers used are described in Supplementary Materials. The remaining primers (from previous steps) were tested on twenty individuals (Table S4) of G. yamadae using a capillary sequencer, whose forward primers were modified by the PC tail (Primer tail C) (5′ CAGGACCAGGCTACCGTG 3′) to test their genotyping efficiency and marker polymorphism in G. yamadae. Among the 48 primers that produced amplicons, 26 (54%) were not polymorphic (Table S5), including eighteen di-nucleotide, four tri-nucleotide, one penta-nucleotide and one hexa-nucleotide repeat markers. The remaining 22 loci have polymorphic amplification. These markers can serve as candidate markers for future research, such as genetic diversity and relatedness analysis of different populations (Table S6).

2.5. Characteristics of Validated Microsatellite Loci

The polymorphic markers obtained were further assessed using two natural G. yamadae populations, including 50 individuals from Shaanxi province and 46 individuals from Beijing, China (Table S7). The 22 microsatellite markers had allele numbers ranging from 2 to 9 with an average value of 6 per locus. The polymorphism information content (PIC) values ranged from 0.099 to 0.782 with an average value of 0.48. The observed (HO) and expected (HE) heterozygosity ranged from 0.000 to 0.683 and 0.04 to 0.820, respectively. The inbreeding coefficient (FIS) ranged from −0.118 to 1.000. Hardy–Weinberg equilibrium (HWE) was tested in two geographical populations; 17 loci in the Shaanxi population and 18 loci in Beijing province departed from HWE (p < 0.05) (Table 5). Among these loci, GY14, GY18, GY19, GY27, GY42, GY66, GY67, GY68, GY70, GY72 and GY79 showed significant departures from HWE in both populations (p < 0.001).
The Bayesian algorithm implemented in the program STRUCTURE indicated that the model K = 3 explained the data in a satisfactory manner, because this model resulted in the highest ΔK value (Figure 2). The population structure of G. yamadae was inferred with the dataset of 22 microsatellite markers, and the 96 individuals from two geographical populations were grouped into three clusters, as shown in Figure 3.
The topology of the unweighted pair-group method analysis (UPGMA) tree based on genetic distance shows the relationship between the two populations (Figure 4). Eight individuals from Shaanxi province and eight individuals from Beijing were grouped into independent clusters, which are highlighted in yellow and pink, respectively. These two clusters contributed 1/6 of the total tested individuals. The main cluster, marked in purple, is a mixed group that contains individuals from both geographical areas; however, sub-branches in this cluster were independent from each other and related to geographical distribution, with some exceptions, e.g., individuals 69, 70 and 75 from Beijing were clustered with the Shaanxi individuals (Figure 4).

3. Discussion

As one of the most ubiquitous pathogens of apples, G. yamadae has negative impacts on apple production as well as on cultivated junipers in China. However, the origin, introduction pathways and current population structure of G. yamadae remain unknown. The lack of a significant set of polymorphic microsatellite markers for G. yamadae and other Gymnosporangium species was one of the main justifications of the present study.
In this study, 22 polymorphic microsatellite markers were developed for G. yamadae based on transcriptome data sequenced by NGS. Microsatellites proved to be informative markers that can reveal heterozygotic or heterokaryotic genotypes in diploid or dikaryotic organisms [21,25,35]. Moreover, microsatellites are easy-to-use tools for population genetic and ecological studies as well as epidemiological and forensic research [27,29]. The characterization of SSRs requires the identification of genomic fragments containing repetitive sequence motifs [26]. Compared with the library-enriched method, recent advances in large-scale RNA-seq provide a fast, cost-effective and reliable approach for the generation of large expression datasets in non-model species [39,40,41]. We have described the efficient use of NGS to obtain a large amount of sequence data and applied bioinformatics tools to develop a novel sample of 3942 sequence-containing microsatellites for this species. The di-nucleotide types have generally been observed to have the highest frequency in many other rusts [30,31,32,33,34,35]. Compared with amplification in other fungi [22,27,28,29,30,31,32,33,34,35], the PCR amplification efficiency of the primers used here seems relatively low. Gymnosporangium species are demicyclic and we could not collect massive spores by inoculation experiments. Therefore, we extracted DNA directly from a sorus on infected host plants. Some specimens with few spores yielded relatively low-quality DNA and a low percentage of amplicons (48 out of 88).
The stabilization of genetic diversity is very important for the long-term interest of any species [42]. High level genetic diversity is related with a certain population size, for the loss of heterozygosity could have a negative effect on population fitness. However, the polymorphism information content (PIC) and alleles per locus were relatively low compared to those of other rusts [30,31,32,33,34,35], with average values of 0.48 and 6, respectively, which suggested that low genetic diversity was detected based on microsatellite markers. Furthermore, eleven microsatellite sites in both tested populations deviated significantly from Hardy–Weinberg equilibrium (p < 0.001), which may have resulted from heterozygote deficiency, because HO is much lower than HE in these loci (Table 5). Heterozygote deficiency can be caused by the presence of null alleles, small sample size, or the effects of population subdivision (Wahlund’s effect) [43].
The individuals from Beijing and Shaanxi were grouped into three main clusters. The largest cluster was a mixed group consisting of two geographical populations. One of the possible reasons for this observation is the frequent trans-provincial transportation of infected Juniperus seedlings all over the country. J. chinensis L. is one of the most popular landscaping plants in China and can be found in many areas, such as gardens, parks, roadsides, cemeteries and so on. However, during our collection in the field, we found that many seedlings with overwintering fungus galls had been recently planted locally, meaning that it is very likely that these seedlings were transported from another city or province. Usually, after a heavy spring rain, the telial horns extrude from the branch galls on the host juniper trees and become gelatinous; these structures can then produce basidiospores that are wind-blown to local Malus hosts. If the infection in Malus plants is successful, spermogonia develop in orange lesions on the upper surfaces of leaves. After a period of time, aecia also develop in the same orange lesions, but on the lower surfaces of the leaves. Mature aeciospores (spores produced in the aecia) are wind-blown to the juniper trees in the same year from early summer to fall. If infection is successful in the juniper host, a gall forms, and the telial horns grow from these symptomatic tissues the following spring or in subsequent years, concluding a complete life-cycle of G. yamadae. All this leads to a frequent regional gene exchange; thus, we could infer that some specimens collected in Beijing probably were from Shaanxi province or have an intimate relationship with those specimens.
Another likely reason for the observed clustering may be the limited number of specimens. The sample size should be large enough to make sure the results are an authentic reflection of the true ecological pattern rather than being an occasional phenomenon [44]. However, the sample size obtained in reality may be limited by many factors, such as budget, time and available samples. In a future study, we plan to collect many samples in each geographical area, and these samples would better cover enough regions where G. yamadae is potentially distributed to provide a more accurate conclusion about the genetic diversity of G. yamadae in China. Anyhow, microsatellites developed in this study are still effective molecular markers for detecting the polymorphism in G. yamadae populations.
Regardless of the above limitations, the microsatellites developed in this study will help researchers to better identify the main genetic groups in G. yamadae populations as well as the geographical relationships among geographically spaced populations. As a result, we will have novel insights into the importance of human activity in shaping the current structure of the G. yamadae population in China. Moreover, with the increasing genomic resources of G. yamadae, these informative SSR markers will help to identify virulence mechanisms associated with rust biology by mapping them onto the whole-genome sequences of populations segregated for virulence.
In summary, these highly informative SSR markers prove to be valuable molecular tools to study the aetiology of apple-juniper rust, which will help with the development of effective strategies for its management.

4. Materials and Methods

4.1. Rust Sample Collection

Samples of G. yamadae analysed in RNA-seq experiments were collected from an infected cypress tree (Juniperus chinensis.) prior to telial horn gelatinization at Northwest A & F University, Yangling, Shaanxi, China, in March 2016. Each sample was harvested in three biological replicates using liquid nitrogen and stored at −80 °C before RNA extraction. Each biological replicate was used for RNA extraction and RNA-Seq library construction.
The 96 samples prepared to be used to validate the polymorphism of G. yamadae microsatellites were collected in two geographic regions in China, of which 50 samples were from Shaanxi, and 46 samples came from Beijing. Likewise, all these samples were stored in absolute ethanol and frozen at −80 °C prior to use.

4.2. RNA Isolation and Library Preparation

An approximately 50 mg sample of teliospores from each replicate was used for total RNA extraction following a previously described protocol [45], and total mRNA was then purified using oligo (dT) magnetic beads. cDNA libraries were prepared according to Illumina sequencing sample preparation protocols. In total, 3 paired-end cDNA libraries were constructed, and sequenced with an Illumina HiSeq 2000 platform by Novogene Bioinformatics Technology Co., Ltd. (Beijing, China), and 100-bp paired-end reads were generated.

4.3. Reprocessing of Illumina Raw Data and de Novo Transcriptome Assembly

Using Trimmomatic software [46], clean data were obtained by removing reads containing adapter, reads containing ploy-A sequences (≥10%) and low quality reads (sQ ≤ 5) from raw data. Simultaneously, the Q20, Q30, GC content and sequence duplication level of the clean data were calculated. Transcriptome assembly was accomplished using Trinity software [37] with default parameters with min_kmer_cov set to 2 by default and all other parameters were set to the default values.

4.4. SSR Detection and Development of Primers

The microsatellite isolation from the genomic sequences was conducted by MISA software [47], and the primers for selected loci were designed with Primer 3 [38], based on the following core criteria: G/C content between 40% and 70%, annealing temperature between 57 °C and 61 °C, a product size ranging from 100 bp to 280 bp. The remaining parameters were at default settings. All candidate SSR primer pairs were synthesized by Ruibiotech Ltd. (Beijing, China).

4.5. DNA Extraction, Primer Testing and Polymorphism Detection

First, to validate the SSR markers, the genomic DNA of the 96 samples were extracted from single spores by proteinase K digestion followed by a standard phenol-chloroform method.
Second, we randomly selected 64 primers with the basic principle of having no mono-nucleotide motif repeats and a large repeat number and added a PC tail (Primer tail C) (5′ CAGGACCAGGCTACCGTG 3′) to the 5′ end of all candidate forward primers. Eight G. yamadae individuals were selected for the initial test. Amplification was performed in a final 10 μL reaction mixture containing 0.5 μL of template DNA, 5 μL of Master Mix (Promega, Madison, WT, USA), 0.25 μL of forward primer (modified by the PC tail) at a final concentration 0.25 μM, 0.25 μL (10 μM) of reverse primer at a final concentration 0.25 μM, and 4 μL of ddH2O. The amplification programme was as follows: 4 min at 94 °C; 35 cycles of 30 s at 94 °C, 30 s at 56 °C, and 45 s at 72 °C; and a final 10-min extension at 72 °C. The PCR products were visualized by agarose gel (3%) electrophoresis. This step was a preliminary validation of whether these primers could amplify a PCR fragment.
Third, the polymorphism of the primers validated in the previous step was further tested using a capillary sequencer. The PCR programme for amplification was the same as above. Amplification was performed in a final volume of 10 μL, containing 0.5 μL of template DNA, 5 μL of Master Mix (Promega, Madison, WT, USA), 0.08 μL of forward primer (modified by the PC tail) at a final concentration 0.08 μM, 0.16 μL(10 μM) of reverse primer at a final concentration 0.16 μM, 0.32 μL of fluorescently modified PC tail (FAM(blue), Hex(green), Rox(red)), including different colours at a final concentration of 0.32 μM, and 3.94 μL of ddH2O. The amplicons were visualized using a Gel Doc EZ system (Bio-rad, Berkeley, California, USA) and precise allele band sizing was conducted on the ABI 3830xl DNA analyser (Applied Biosystems, Froster, CA, USA) with the GeneScan 500LIZ size standard (Applied Biosystems, Froster, CA, USA).
Finally, 96 samples from the two regions were used to validate the effectiveness of the primers screened by the above steps. The amplification mixture, programme, and analysis of the PCR fragments were the same as in the second step.

4.6. Statistical Analysis

We used Popgene V1.32 [48] to calculate the number of alleles, observed heterozygosity (HO), expected heterozygosity (HE) and Shannon information index (I) and Powermarker V3.25 [49] to determine the inbreeding coefficient (Fis), polymorphism information content (PIC), deviations from the Hardy-Weinberg equilibrium (HWE), genetic distance and UPGMA tree based on the genetic distance. The possibility of the cryptic population structure of two geographical individuals were detected by STRUCTURE 2.2 [50]. Markov chain Monte Carlo (MCMC) consisted of a 100,000-iteration burn-in followed by 1,000,000 iterations. The simulated K values ranged from 2 to 7. Ten independent runs were implemented for each specific K value to verify the consistency of the results. The ad hoc estimated likelihood of K (ΔK) was used to determine the most likely number of populations (K) based on the rate of change in the log probability of the data (LnP(D)) [51].

5. Conclusions

In this study, we first characterized and developed several polymorphic microsatellite markers for G. yamadae from random regions of the transcriptome identified using next-generation sequencing. The new markers detected high levels of DNA polymorphism in G. yamadae and could be used to assess genetic diversity in apple-juniper rust. The loci assessed in our study revealed the genetic structure of two geographical populations. This approach provides a rapid method for high-throughput development of microsatellite markers from non-model species without reference genomes. These highly informative SSR markers will be potentially powerful tools to study genetic diversity and population structures of G. yamadae in China. In addition, they also facilitate a better understanding of the geographical origin and migration routes of G. yamadae, which will determine the influence human activity on the shaping of the population structures. Furthermore, comparative studies of markers mapped in populations of differentiating virulence can be used to identify virulence factors related to infection as well as develop apple resistance genotypes. Above all, these SSR markers will provide us with a relatively accurate understanding of the relationship within geographical populations and recent migration routes of G. yamadae in an upcoming study, which is crucial to understanding disease epidemics, developing risk-assessment models and slowing down the process of disease spread.

Supplementary Materials

Supplementary materials can be found at https://www.mdpi.com/1422-0067/19/4/1178/s1.

Acknowledgments

This work was financially supported by the National Natural Science Foundation of China (Grant No. 31470646).

Author Contributions

Cheng-Ming Tian and Ying-Mei Liang conceived and designed the project. Si-Qi Tao performed the experiments and drafted the manuscript. Bin Cao and Si-Qi Tao collected the samples. Ying-Mei Liang revised the manuscript.

Conflicts of Interest

The authors declare no conflict of interest.

References

  1. Velasco, R.; Zharkikh, A.J.; Dhingra, A.; Cestaro, A.; Kalyanaraman, A.; Fontana, P.; Bhatnagar, S.K.; Troggio, M.; Pruss, D.; Salvi, S.; et al. The genome of the domesticated apple (Malus x domestica Borkh.). Nat. Genet. 2010, 42, 833. [Google Scholar] [CrossRef] [PubMed] [Green Version]
  2. Northland Agriculture. Available online: http://lnny.lnd.com.cn/htm/2013-07/01/content_3049863.htm (accessed on 1 July 2013).
  3. China Yield Information. Available online: http://www.chyxx.com/industry/201602/387126.html (accessed on 19 February 2016).
  4. Li, B.; Xu, X. Infection and Development of Apple Scab (Venturia inaequalis) on old leaves. J. Phytopathol. 2002, 150, 687–691. [Google Scholar] [CrossRef]
  5. Wang, X.; Kang, Z. Re-evaluation of pathogens causing Valsa canker on apple in China. Mycologia 2011, 103, 317. [Google Scholar] [CrossRef] [PubMed]
  6. Kern, F.D. A Revised Taxonomic Account of Gymnosporangium, 3rd ed.; Pennsylvania State University Press: University Park, PA, USA, 1973; ISBN 0-271-01105-X. [Google Scholar]
  7. Cummins, G.B.; Hiratsuka, Y. Illustrated Genera of Rust Fungi, 3rd ed.; Burgess Pub: Minneapolis, MN, USA, 1959; ISBN 0-89054-304-6. [Google Scholar]
  8. European and Mediterranean Plant Protection Organization (EPPO). Available online: http://www.eppo.int/ (accessed on 19 November 2017).
  9. Cao, Z.M.; Li, Z.Q.; Zhuang, J.Y. Uredinales from the Qinling Mountains. Mycosystema 2000, 19, 13–23. (In Chinese) [Google Scholar]
  10. Guo, Y.N. The integrated management of the rust of apple (Gymnosporangium yamadae Miyabe). Bull. Agric. Sci. Technol. 1994, 19, 28–29. (In Chinese) [Google Scholar]
  11. Wang, S.Q.; Yang, Z.P.; Yu, J. The reasons that Apple rust happens seriously and comprehensive prevention and control measures. China Gard. Abstr. 2010, 26, 145–146. (In Chinese) [Google Scholar]
  12. Li, B.H.; Wang, C.X.; Dong, X.L. Research progress in apple diseases and problems in the disease management in China. Plant Prot. 2013, 39, 46–64. (In Chinese) [Google Scholar]
  13. Harada, Y.; Sawamura, K. Basitac (Mepronil), a promising agent for preventing basidiospore production by galls of Japanese apple rust (Gymnosporangium yamadae) on junipers. Annu. Rep. Soc. Plant Prot. N. Jpn. 1980, 31, 84. [Google Scholar] [CrossRef]
  14. Zambolim, L.; Vale, F.X.R.; Pereira, A.A.; Chaves, G.M. Manejo integrado das doenc_as do cafeeiro. In SIMPOSIO Internacional Sobre Café Adensado; Universidade Federal de Viçosa: Viçosa, Brazil, 1994; pp. 134–215. [Google Scholar]
  15. Thrall, P.H.; Laine, A.L.; Ravensdale, M.; Nemri, A.; Dodds, P.N.; Barrett, L.G.; Burdon, J.J. Rapid genetic change underpins antagonistic coevolution in a natural host-pathogen metapopulation. Ecol. Lett. 2012, 15, 425–435. [Google Scholar] [CrossRef] [PubMed]
  16. Kinloch, B.B. White pine blister rust in North America: Past and prognosis. Phytopathology 2003, 93, 1044–1047. [Google Scholar] [CrossRef] [PubMed]
  17. Kinloch, B.B.; Sniezko, R.A.; Dupper, G.E. Origin and distribution of cr2, a gene for resistance to white pine blister rust in natural populations of western white pine. Phytopathology 2003, 93, 691–694. [Google Scholar] [CrossRef] [PubMed]
  18. Oelke, L.M.; Kolmer, J.A. Genetics of leaf rust resistance in spring wheat cultivars alsen and norm. Phytopathology 2005, 95, 773–778. [Google Scholar] [CrossRef] [PubMed]
  19. Pinon, J.; Frey, P.; Pei, M.H.; Mccracken, A.R. Interactions between poplar clones and Melampsora populations and their implications for breeding for durable resistance. Die Keure 2005, 23, 139–154. [Google Scholar] [CrossRef]
  20. Harada, Y. Pear and Apple Rusts in Japan, with Special Reference to Their Life Cycles and Host Ranges; Reports; Tottori Mycological Institute: Tottori Prefecture, Japan, 1984. [Google Scholar]
  21. McCallum, B.D.; Roelfs, A.P.; Szabo, L.J.; Groth, J.V. Comparison of Puccinia graminis, f.sp. tritici, from South America and Europe. Plant Pathol. 2010, 48, 574–581. [Google Scholar] [CrossRef]
  22. Zhong, S.; Leng, Y.; Friesen, T.; Faris, J.; Szabo, L. Development and characterization of expressed sequence tag-derived microsatellite markers for the wheat stem rust fungus Puccinia graminis f. sp. tritici. Phytopathology 2009, 99, 282–289. [Google Scholar] [CrossRef] [PubMed]
  23. Chen, X.; Line, R.F.; Leung, H. Relationship between virulence variation and DNA polymorphism in Puccinia striiformis. Phytopathology 1993, 83, 1489–1497. [Google Scholar] [CrossRef]
  24. Selkoe, K.A.; Toonen, R.J. Microsatellites for ecologists: A practical guide to using and evaluating microsatellite markers. Ecol. Lett. 2006, 9, 615–629. [Google Scholar] [CrossRef] [PubMed]
  25. Wadl, P.A.; Dean, D.; Li, Y.; Vito, L.M.; Scheffler, B.E.; Hadziabdic, D.; Windham, M.T.; Trigiano, R.N. Development and characterization of microsatellites for switchgrass rust fungus (Puccinia emaculata). Conserv. Genet. Resour. 2011, 3, 185–188. [Google Scholar] [CrossRef]
  26. Queller, D.C.; Strassmann, J.E.; Hughes, C.R. Microsatellites and kinship. Ecol. Evol. 1993, 8, 285–288. [Google Scholar] [CrossRef]
  27. Ali, S.; Gladieux, P.; Leconte, M.; Gautier, A.; Justesen, A.F.; Hovmøller, M.S.; Enjalbert, J.; de Vallavieille-Pope, C. Origin, Migration Routes and Worldwide Population Genetic Structure of the Wheat Yellow Rust Pathogen Puccinia striiformis f.sp. tritici. PLoS Pathog. 2014, 10, e1003903. [Google Scholar] [CrossRef] [PubMed] [Green Version]
  28. Cabral, P.G.C.; Maciel-Zambolim, E.; Oliveira, S.A.S.; Caixeta, E.T.; Zambolim, L. Genetic diversity and structure of Hemileia vastatrix populations on Coffea spp. Plant Pathol. 2016, 65, 196–204. [Google Scholar] [CrossRef]
  29. Orquera-Tornakian, G.K.; Garrido, P.; Kronmiller, B.; Hunger, R.; Tyler, B.M.; Garzon, C.D.; Marek, S.M. Identification and characterization of simple sequence repeats (SSRs) for population studies of Puccinia novopanici. J. Microbiol. Methods 2017, 139, 113–122. [Google Scholar] [CrossRef] [PubMed]
  30. Bahri, B.; Leconte, M.; de Vallavieille-Pope, C.; Enjalbert, J. Isolation of ten microsatellite loci in an EST library of the phytopathogenic fungus Puccinia striiformis f. sp. tritici. Conserv. Genet. 2009, 10, 1425. [Google Scholar] [CrossRef]
  31. Dambroski, H.R.; Carson, M.L. Development and characterization of novel, polymorphic microsatellite markers for oat crown rust, Puccinia coronata. Mol. Ecol. Resour. 2008, 8, 1395–1398. [Google Scholar] [CrossRef] [PubMed]
  32. Dracatos, P.M.; Dumsday, J.L.; Olle, R.S.; Cogan, N.O.; Dobrowolski, M.P.; Fujimori, M.; Roderick, H.; Stewart, A.V.; Smith, K.F.; Forster, J.W. Development and characterization of EST-SSR markers for the oat crown rust pathogen of ryegrass (Puccinia coronata f. sp. lolii). Genome 2006, 49, 572–583. [Google Scholar] [CrossRef] [PubMed]
  33. Duan, X.; Enjalbert, J.; Vautrin, D.; Solignac, M.; Giraud, T. Isolation of 12 microsatellite loci, using an enrichment protocol, in the phytopathogenic fungus Puccinia triticina. Mol. Ecol. Notes 2003, 3, 65–67. [Google Scholar] [CrossRef]
  34. Enjalbert, J.; Duan, X.; Giraud, T.; Vautrin, D.; Vallavieille-Pope, D.; Solignac, M. Isolation of twelve microsatellite loci, using an enrichment protocol, in the phytopathogenic fungus Puccinia striiformis f. sp. tritici. Mol. Ecol. Notes 2002, 2, 563–565. [Google Scholar] [CrossRef]
  35. Szabo, L.J. Development of simple sequence repeat markers for the plant pathogenic rust fungus, Puccinia graminis. Mol. Ecol. 2007, 7, 92–94. [Google Scholar] [CrossRef]
  36. Marioni, J.C.; Mason, C.E.; Mane, S.M.; Stephens, M.; Gilad, Y. RNA-seq: An assessment of technical reproducibility and comparison with gene expression arrays. Genome Res. 2008, 18, 1509. [Google Scholar] [CrossRef] [PubMed]
  37. Grabherr, M.G.; Haas, B.J.; Yassour, M.; Levin, J.Z.; Thompson, D.A.; Amit, I.; Adiconis, X.; Fan, L.; Raychowdhury, R.; Zeng, Q.; et al. Full-length transcriptome assembly from RNA-Seq data without a reference genome. Nat. Biotechnol. 2011, 29, 644–652. [Google Scholar] [CrossRef] [PubMed]
  38. Untergasser, A.; Cutcutache, I.; Koressaar, T.; Ye, J.; Faircloth, B.C.; Remm, M.; Rozen, S.G. Primer3—New capabilities and interfaces. Nucleic Acids Res. 2012, 40, e115. [Google Scholar] [CrossRef] [PubMed]
  39. Ellis, J.; Burke, J. EST-SSRs as a resource for population genetic analysis. Heredity 2007, 99, 125–132. [Google Scholar] [CrossRef] [PubMed]
  40. Nagalakshmi, U.; Wang, Z.; Waern, K.; Shou, C.; Raha, D.; Gerstein, M.; Snyder, M. The Transcriptional Landscape of the Yeast Genome Defined by RNA Sequencing. Science 2008, 320, 1344. [Google Scholar] [CrossRef] [PubMed]
  41. Mortazavi, A.; Williams, B.A.; Mccue, K.; Schaeffer, L.; Wold, B. Mapping and quantifying mammalian transcriptomes by RNA-Seq. Nat. Methods 2008, 5, 621. [Google Scholar] [CrossRef] [PubMed]
  42. Falk, D.A.; Holsinger, K.E. Genetics and Conservation of Rare Plants; Oxford University Press: New York, NY, USA, 1991. [Google Scholar]
  43. Dharmarajan, G.; Beatty, W.S.; Rhodes, O.E. Heterozygote deficiencies caused by a Wahlund effect: Dispelling unfounded expectations. J. Wildl. Manag. 2013, 77, 26–234. [Google Scholar] [CrossRef]
  44. Wang, J.L.; Whitlock, M.C. Estimating effective population size and migration rates from genetic samples over space and time. Genetics 2003, 163, 429–446. [Google Scholar] [PubMed]
  45. Liu, J.J.; Sturrock, R.N.; Sniezko, R.A.; Williams, H.; Benton, R.; Zamany, A. Transcriptome analysis of the white pine blister rust pathogen Cronartium ribicola: De novo assembly, expression profiling, and identification of candidate effectors. BMC Genom. 2015, 16, 678. [Google Scholar] [CrossRef] [PubMed]
  46. Bolger, A.M.; Lohse, M.; Usadel, B. Trimmomatic: A flexible trimmer for Illumina sequence data. Bioinformatics 2014, 30, 2114–2120. [Google Scholar] [CrossRef] [PubMed]
  47. MISA—MIcroSAtellite Identification Tool. Available online: http://pgrc.ipk-gatersleben.de/misa (accessed on 9 April 2018).
  48. Yeh, F.C.; Yang, R.C.; Boyle, T.B.J.; Ye, Z.H.; Mao, J.X. POPGENE, the User-Friendly Shareware for Population Genetic Analysis; Molecular Biology and Biotechnology Centre, University of Alberta: Edmonton, AB, Canada, 1997. [Google Scholar]
  49. Liu, K.; Muse, S.V. Powermarker: An integrated analysis environment for genetic marker analysis. Bioinformatics 2005, 21, 2128–2129. [Google Scholar] [CrossRef] [PubMed]
  50. Pritchard, J.K.; Stephen, M.; Rosenberg, N.A.; Donnelly, P. Association mapping in structured populations. Am. J. Hum. Genet. 2000, 67, 170–181. [Google Scholar] [CrossRef] [PubMed]
  51. Evanno, G.; Regnaut, S.; Goudet, J. Detecting the number of clusters of individuals using the software STRUCTURE: A simulation study. Mol. Ecol. 2005, 14, 2611–2620. [Google Scholar] [CrossRef] [PubMed]
Figure 1. The distribution of SSR motif and repeat numbers.
Ijms 19 01178 g001
Figure 2. The model choice for each K value and graphical results of the SRUCTURE analysis.
Ijms 19 01178 g002
Figure 3. Population structure of K = 3 inferred by Bayesian clustering approaches based on 22 microsatellites markers.
Ijms 19 01178 g003
Figure 4. The unweighted pair-group method analysis (UPGMA) tree based on the genetic distance of two G. yamadae populations. Black circle represents individuals in Shaanxi province; red star represents Beijing individuals.
Ijms 19 01178 g004
Table 1. RNA-seq data statistics.
DSXGY_1DSXGY_2DSXGY_3
Raw reads47,629,87459,428,16449,485,212
Clean reads46,917,62458,748,38848,752,948
Q20 (%)97.1896.5297.34
Q30 (%)93.8291.4793.42
Mapped reads38,545,026 (82.29%)50,102,470 (85.29%)41,058,330 (84.35%)
DSXGY_1, DSXGY_2, DSXGY_3: three biological replicates of G. yamadae.
Table 2. Transcripts and Unigene length distribution statistics.
TranscriptsUnigenes
200~300 bp16,81015,907
301~400 bp56344855
401~500 bp31242471
501~600 bp21031471
601~700 bp16921064
701~800 bp1354781
801~900 bp1192601
901~1000 bp1100551
1001~2000 bp86013893
2001~3000 bp45162069
3001~10 kbp31801430
>10 kbp139
total number49,31935,102
Max length19,12619,126
Average length1006756
N5019571654
Total residues49,601,91226,521,164
Table 3. Statistics of microsatellites of different motif types and repeat numbers in G. yamadae.
Repeat MotifNumber of RepeatTotal Frequency (%)
56789101112
A/T 112134215131.93%
C/G 13192475.34%
AC/GT 1911237338512719.97%
AG/CT 198926443333839.32%
AT/AT 333173109816419115.43%
CG/CG 8 0.16%
AAC/GTT8752382 3.54%
AAG/CTT8631163 1 2.71%
AAT/ATT582891 1 1.92%
ACC/GGT13646302 4.23%
ACG/CGT141372 10.73%
ACT/AGT3715213 1.50%
AGC/CTG6630202 2.33%
AGG/CCT6716142 1.96%
ATC/ATG12145444 4.23%
CCG/CGG2637 1 0.73%
AAAC/GTTT173 0.40%
AAAG/CTTT42 0.12%
AAAT/ATTT121 0.26%
AACC/GGTT52 0.14%
AACG/CGTT 1 0.02%
AAGG/CCTT11 0.04%
AAGT/ACTT 0.00%
AATC/ATTG3 0.06%
AATG/ATTC61 0.14%
ACAG/CTGT4 0.08%
ACAT/ATGT275 0.63%
ACCC/GGGT 2 0.04%
ACCG/CGGT1 0.02%
ACCT/AGGT 0.00%
ACGC/CGTG1 0.02%
ACTC/AGTG11 0.04%
ACTG/AGTC311 0.10%
AGAT/ATCT2 0.04%
AGCC/CTGG221 0.10%
AGCT/AGCT1 1 0.04%
AGGC/CCTG11 1 0.06%
AGGG/CCCT31 0.08%
ATCC/ATGG411 0.12%
OTHERS321310851211.42%
MNR 125243419837.27%
DNR 73038824616214884534.88%
TNR69827920621 21123.90%
TTNR9825311 2.53%
PNR1745 2 0.55%
HNR1595831210.87%
DNR: di-nucleotide repeats; TNR: tri-nucleotide repeats; TTNR: tetra-nucleotide repeats; PNR: penta-nucleotide repeats; HNR: hexa-nucleotide repeats.
Table 4. Frequency of different repeat motif in SSRs.
Number of Motif CopiesMono-Di-Tri-Tetra-Penta-Hexa-TotalFrequency (%)
00000000.00%
50069898171582814.48%
607302792549104718.31%
7038820635560710.62%
80246211082764.83%
9016201231682.94%
1012521482001140324.54%
114348410025219.11%
12198510012053.59%
13119000001192.08%
148100001821.43%
156800001691.21%
162900101310.54%
174101100430.75%
183500000350.61%
195600010571.00%
207700000771.35%
217400001751.31%
224601000470.82%
232300000230.40%
2430000140.07%
Total25361763121013029495717100.00%
Frequency (%)44.36%30.84%21.16%2.27%0.51%0.86%100.00%
Table 5. Characteristics of 22 microsatellite loci validated on 96 individuals of G. yamadae from two geographical locations in China.
MarkerPrimer Sequences 5′-3′Repeat MotifAllele No.Size Range (bp)HWEHOHEFISPICI
ShaanxiBeijingShaanxiBeijingShaanxiBeijingShaanxiBeijing
GY8F: AAAAAGCATCAGGGGGAGGG(CT)65261–2690.2720.0860.4890.3950.5550.5090.1200.2250.4540.931
R: GGTTGTGTGTGGCTAAGGCT
GY14F: ACAATCAACTAGAAATTGACCTTTGT(AT)68154–1800.0000.0000.1630.2050.2580.7720.3700.7370.6601.521
R: TGGATGCAATATTTGAACTGTCAGA
GY18F: TCCAATCACCCCTCCCATCT(TGT)77219–2370.0010.0000.2500.0480.3910.2030.3630.7670.2900.688
R: TCGAAAGTCGCAATACCAGCT
GY19F: TTCTTGAACGCAGACAGTGT(GA)98207–2230.0000.0000.2860.3180.5030.5620.4350.4370.5041.169
R: TTCGCTCTCCCTCCCTCTTT
GY20F: ACGAGAGTGTCAGACGAAGC(GCAAGA)76195–2250.2130.2940.6330.6830.7020.6980.1000.0220.6501.358
R: CTGACTTGTCGAGACCGAGG
GY21F: TCGTACAGCCACACACAGAC(AC)92120–1220.7520.0180.5110.2930.4700.470−0.0890.3800.3750.693
R: AGAAGCACCATCGGTCAAGG
GY25F: GGCATGGAGAAAGCAGCAAG(AG)83141–1450.0000.0170.3000.2780.4960.4820.4320.4270.3760.718
R: GCACCTCCAGGAAATCCCAA
GY27F: ACGTCCCTCAAATCTCATCCT(TC)99170–1900.0000.0000.3720.4050.7470.7220.5050.4420.7031.563
R: CCGCCACGCTCAAAGAAAAT
GY30F: GATCAGGATGAGAGGCGGTG(TC)104214–2300.0171.0000.1020.2310.1180.2070.137−0.1180.1480.333
R: TTGGTATGCATGCCAGGGAG
GY42F: TGTGGTTGTGGGGTTTTGGA(AT)99145–1630.0000.0000.1430.1250.8200.6090.8270.7970.7821.830
R: ACCACACCACATCACATCATGT
GY43F: AGTGAAAGAGAGTGGATGTGC(GT)94154–1620.0100.0360.0610.0650.0990.1050.3850.3840.0990.256
R: TGCGTCCCATGTATGTCTGT
GY66F: CCAGCATGCCTACCTAGCTG(TGTGAT)54181–1990.0000.0000.0000.0000.5470.6491.0001.0000.5981.198
R: CAAGGAACAACAGCAGTGGC
GY67F: CGCGGTTCCGGATTGATAGA(CGGAGT)84190–2080.0000.0000.0000.0000.6820.6111.0001.0000.6121.218
R: GGAATTCAGTCAAGGCCCCA
GY68F: TTCTTCTCTCCCAGCTCCCA(CACTGC)57129–1770.0000.0000.3330.0750.6200.6430.4650.8850.6211.345
R: CAGTCAGCCTGTGTCCAGAG
GY69F: CTGGAGTCCGCCAATCAACT(CCGCAT)65203–2270.7790.1220.3960.3660.3550.523−0.1180.3030.3930.823
R: ATTTTGGGACGAGCAGCTGA
GY70F: TGACCCCAATAAGACAAAAGTTGA(ACAGCT)99238–2920.0000.0000.5100.2940.7380.6510.3110.5520.6551.475
R: GTTCAACTCCAGTCGGCTGA
GY72F: TACCACGAGTCCAGCTCTCA(TGATCC)57193–2230.0000.0000.0220.0000.6710.8170.9681.0000.7181.596
R: AAAAGGAGTTGAGCGCGAGA
GY75F: CTCTGGCTCTGGCTTCAGTC(CCTTAG)65236–2600.0270.0860.4800.3860.5970.5150.1970.2530.4560.930
R: AAGCCAAGCCAAGCAACTTG
GY79F: CGACAACTTTGCGCACTTGT(TC)108225–2750.0000.0000.0250.1560.3340.5670.9260.7280.4311.037
R: ACTCCATTTTCTTGCATTTTGGGA
GY81F: ACCTCCCTGAAACACAAGCA(CAC)75245–2630.0040.0000.2650.3780.3720.4490.2890.1590.3520.740
R: GCGTCTGAGTGGTGGAATCA
GY86F: TGTCGATTGGGATGGTTGGG(GAAG)57172–1960.0430.0000.6400.3410.5890.674−0.0870.4970.5681.250
R: GTCCTCTCTGACTCGGGTCT
GY87F: ATCAGTGGCTCCCTCTCCAT(CAT)76233–2631.0000.0010.0410.0730.0400.207−0.0110.6500.1160.316
R: GGGTAAGTGTTGGCGGAAGA
F: forward primer; R: reverse primer; HO: observed heterozygosity; HE: expected heterozygosity; PIC: polymorphism information content; FIS: inbreeding coefficient; HWE: exact p-value of Hardy–Weinberg Equilibrium.

