Article

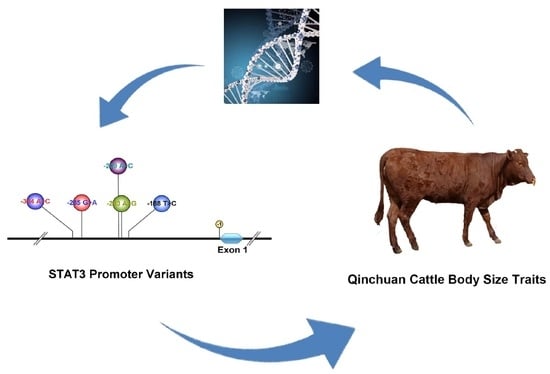
Genetic Variants in STAT3 Promoter Regions and Their Application in Molecular Breeding for Body Size Traits in Qinchuan Cattle

1
College of Animal Science and Technology, Northwest A & F University, Yangling 712100, China
2
National Beef Cattle Improvement Center of Northwest A & F University, Yangling 712100, China
*
Author to whom correspondence should be addressed.
These authors contributed equally to this study.
Int. J. Mol. Sci. 2018, 19(4), 1035; https://doi.org/10.3390/ijms19041035
Submission received: 25 January 2018 / Revised: 22 March 2018 / Accepted: 26 March 2018 / Published: 29 March 2018
(This article belongs to the Special Issue Advances in Biological Functions of STAT3)

Abstract

:
Signal transducer and activator of transcription 3 (STAT3) plays a critical role in leptin-mediated regulation of energy metabolism. This study investigated genetic variation in STAT3 promoter regions and verified their contribution to bovine body size traits. We first estimated the degree of conservation in STAT3, followed by measurements of its mRNA expression during fetal and adult stages of Qinchuan cattle. We then sequenced the STAT3 promoter region to determine genetic variants and evaluate their association with body size traits. From fetus to adult, STAT3 expression increased significantly in muscle, fat, heart, liver, and spleen tissues (p < 0.01), but decreased in the intestine, lung, and rumen (p < 0.01). We identified and named five single nucleotide polymorphisms (SNPs): SNP1-304A>C, SNP2-285G>A, SNP3-209A>C, SNP4-203A>G, and SNP5-188T>C. These five mutations fell significantly outside the Hardy–Weinberg equilibrium (HWE) (Chi-squared test, p < 0.05) and significantly associated with body size traits (p < 0.05). Individuals with haplotype H3H3 (CC-GG-CC-GG-CC) were larger in body size than other haplotypes. Therefore, variations in the STAT3 gene promoter regions, most notably haplotype H3H3, may benefit marker-assisted breeding of Qinchuan cattle.

Graphical Abstract

1. Introduction

Body size is a pleiotropic suite of traits essential to livestock genetic breeding programs. Successfully applying marker-assisted selection (MAS) in livestock depends on the identification of relevant genes or tightly linked markers [1]. Growth rate is one aspect of body size that can be selected for based on candidate gene associations. This method is more straightforward than other genomic approaches, suggesting it can be implemented efficiently and accurately in breeding programs. Candidate genes or QTL (quantitative trait loci) are identified via testing for relationships between physiological or biochemical characteristics linked to body size traits [2]. Thus far, promising candidate genes for improving body size traits include SIRT2, MTNR1A, SIX4, MC4R and FTO, identified in cattle, pigs, and other livestock [3,4,5,6].
Signal transducer and activator of transcription 3 (STAT3) is a ubiquitous cytoplasmic protein expressed in multiple metabolic tissues. It is a member of the STAT protein family, characterized by the presence of Src homology domain 2 (SH2), Src homology domain 3 (SH3), and a tyrosine phosphorylation site at the carboxyl-terminal region. Various cytokines and growth factors phosphorylate STAT3 and translocate the activated protein to the cell nucleus, where it functions as a transcription factor [7,8]. Acetylation, deacetylation, and dephosphorylation of STAT3 results in metabolism disturbance and occasionally disease [9,10,11,12]. In the hypothalamus, STAT3 is critical to leptin-mediated regulation of energy metabolism [13], as evidenced by the fact that its deletion interferes with normal body weight homeostasis and glucose metabolism [14]. Moreover, knockout mouse studies have shown that disrupting neural STAT3 causes leptin-resistant conditions such as obesity, diabetes, and thermal dysregulation [15]. Mice with pancreatic beta-cell-specific disruption of the STAT3 gene exhibited increased appetites, obesity, partial leptin resistance, and glucose intolerance [16]. Interestingly, a recent mouse study showed that STAT3 regulates differentiation of brown adipose tissues (BAT), involved primarily in burning energy [17]. Genetic variants of STAT3 in cattle directly influence body size and carcass quality traits [18].
Qinchuan cattle have been popular farming and meat breeds in China for thousands of years [19], due to its tall body, genetic stability, and adaptability. However, when faced with competition from foreign commercial beef cattle, Qinchuan’s economic benefits are severely curtailed by shortcomings such as underdeveloped hindquarters and slow growth rate. Cattle body-size traits are difficult to improve using traditional breeding methods. However, the candidate gene approach may be useful for uncovering associations between gene polymorphisms and economically valuable traits in farm animals [20]. Previous research has identified many genes related to growth [21], production [22], and meat quality [23].
Because STAT3 is important to almost every aspect of energy metabolism, its variants should predispose carriers to specific body-size traits. To the best of our knowledge, few studies have investigated this possibility in cattle, with most research focusing on humans and laboratory animals [24,25,26,27]. Genetic variations in promoter regions are also extremely relevant to economically valuable traits in livestock, due to their quantitative impact on gene expression [28,29]. For example, SNPs in the SIRT3 promoter region influences intramuscular fat deposition in beef cattle [30], while SNPs in the GPAT3 promoter region are associated with pig body-size traits and promoter activity [31], and so on. Therefore, variation in bovine STAT3 promoter regions should be investigated and their contribution to Qinchuan body size verified.
In the present study, we used bioinformatics techniques to predict STAT3 gene function. We then detected STAT3 mRNA expression at the fetal and adult stages of Qinchuan cattle. Next, we sequenced the STAT3 promoter region in 420 Qinchuan cattle to analyzed genetic variation. Finally, we tested for associations between SNPs and haplotype combinations with body size traits of Qinchuan cattle. Our results should greatly benefit MAS breeding programs.

2. Results

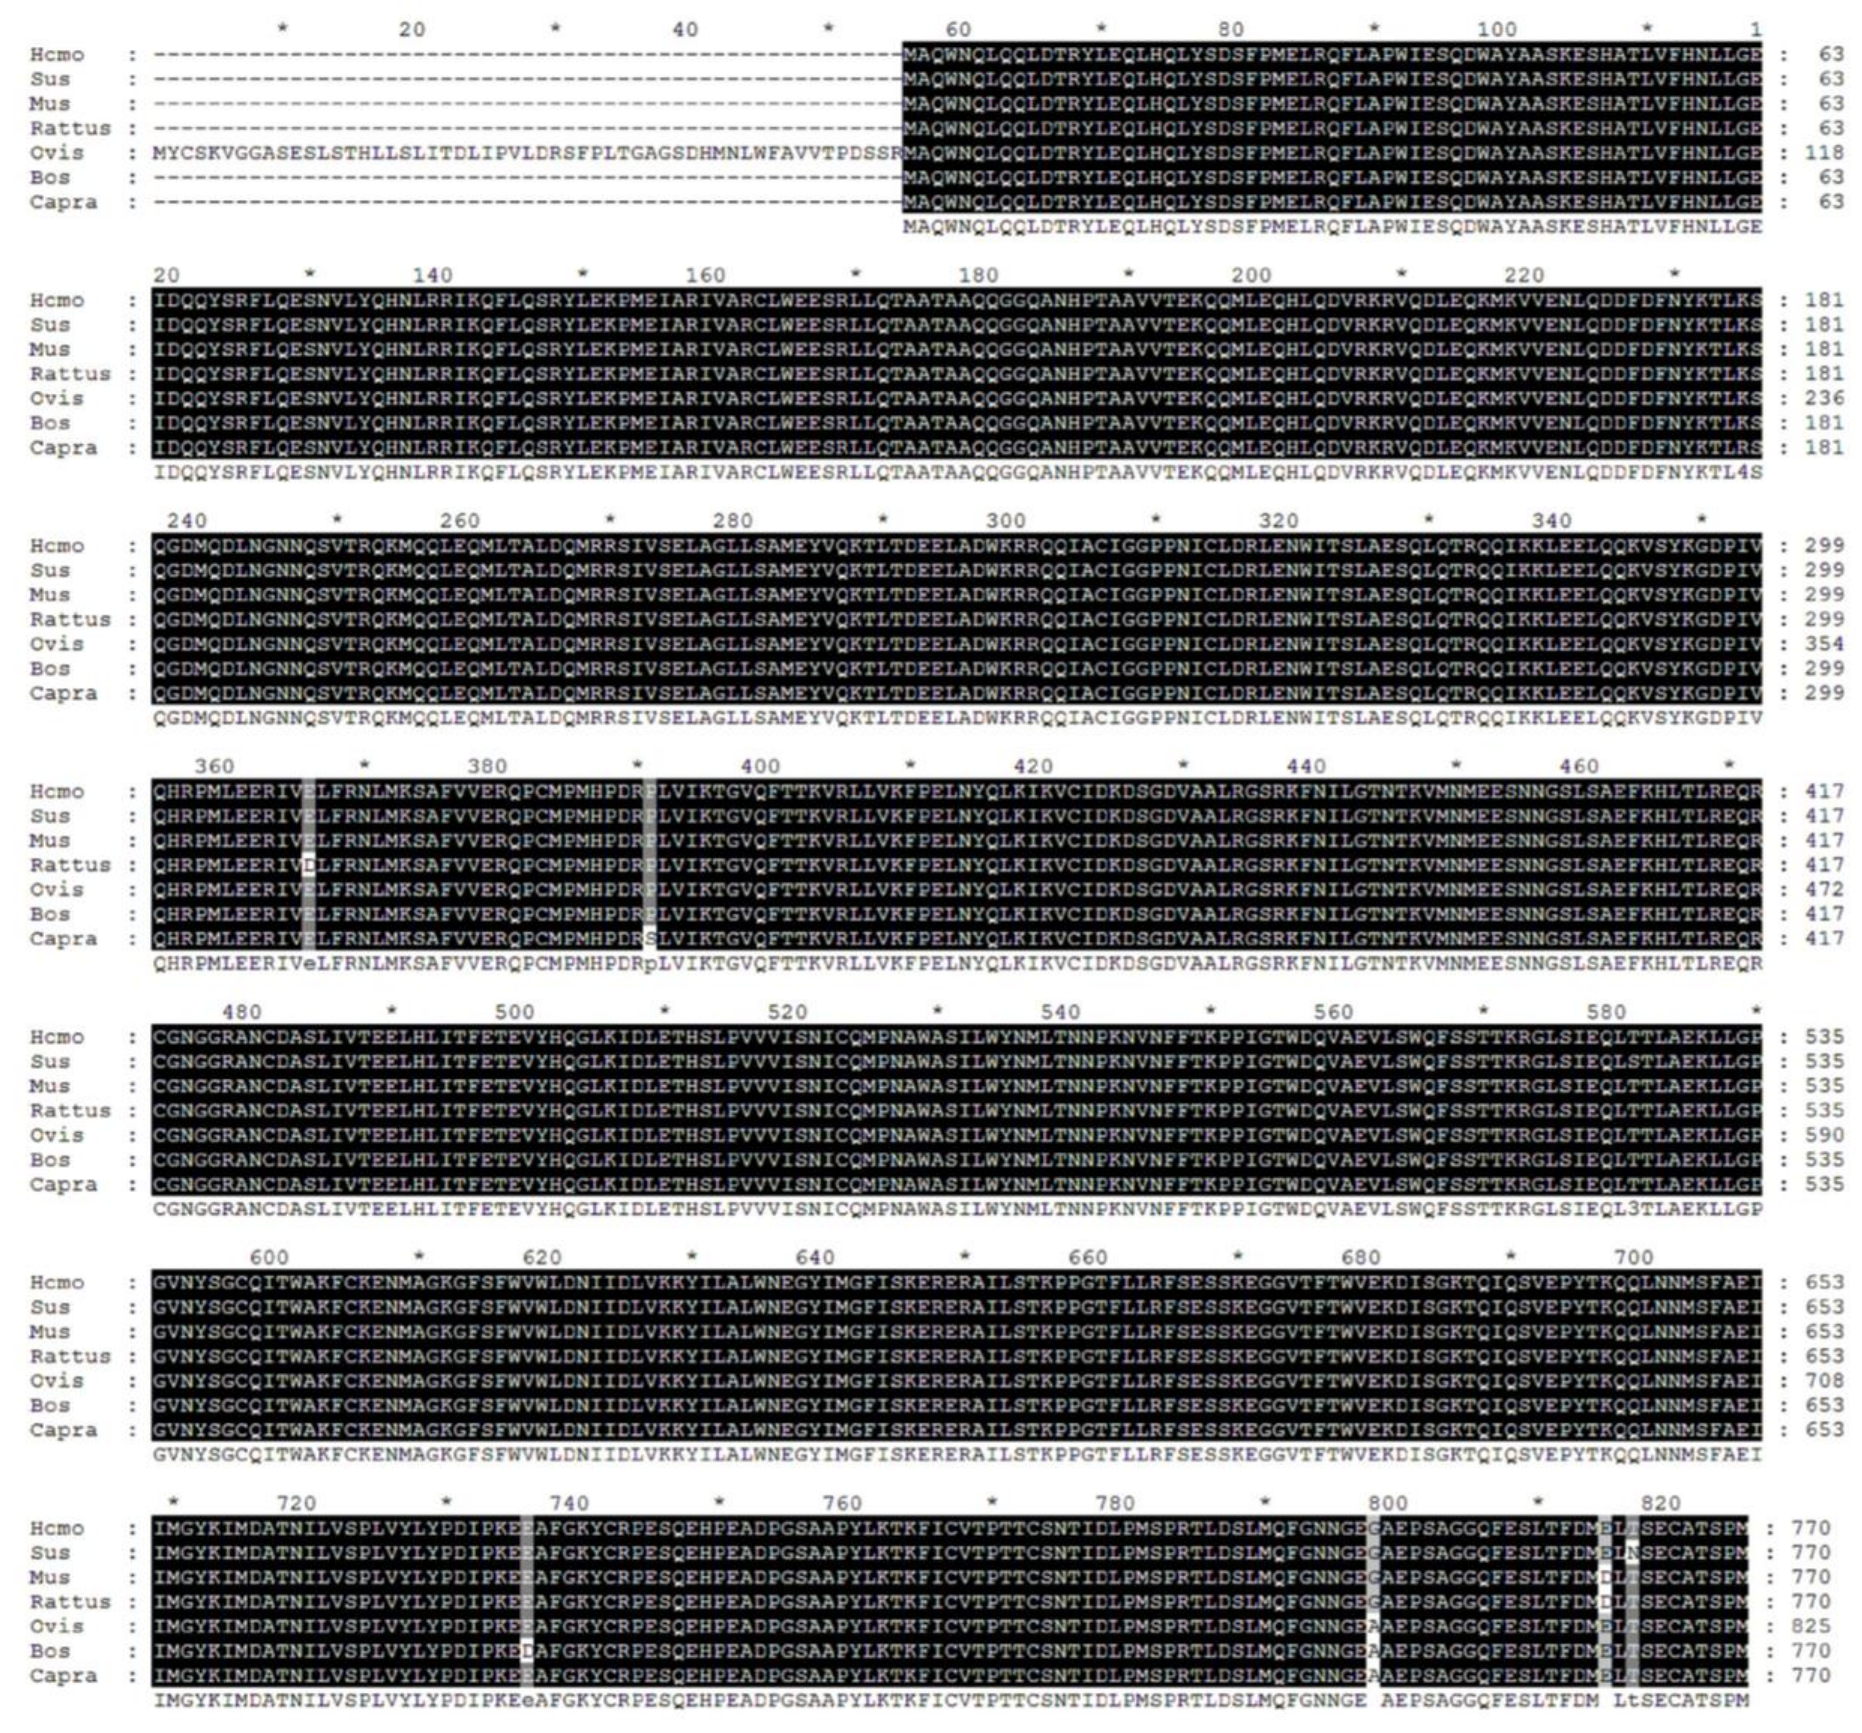
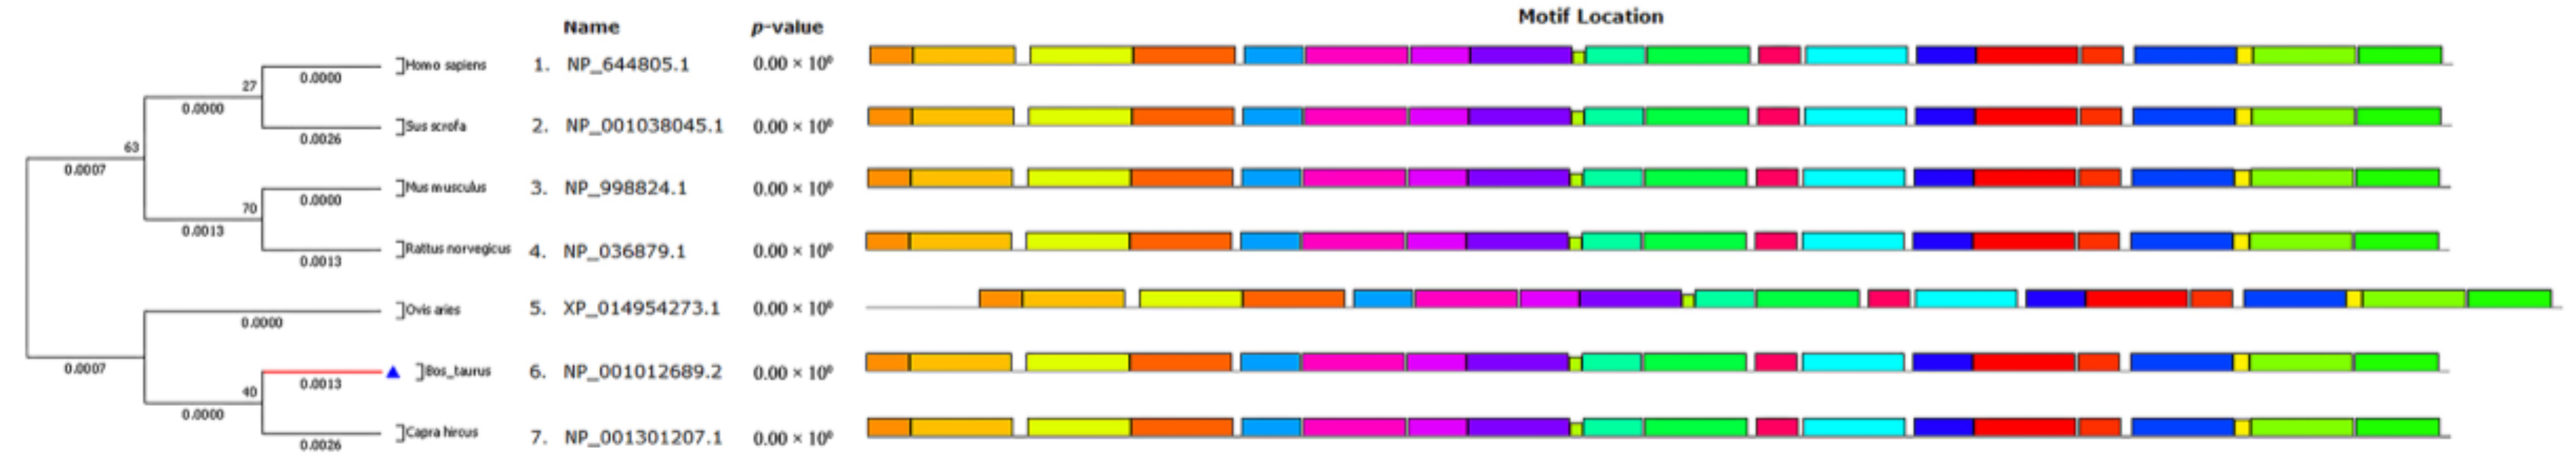
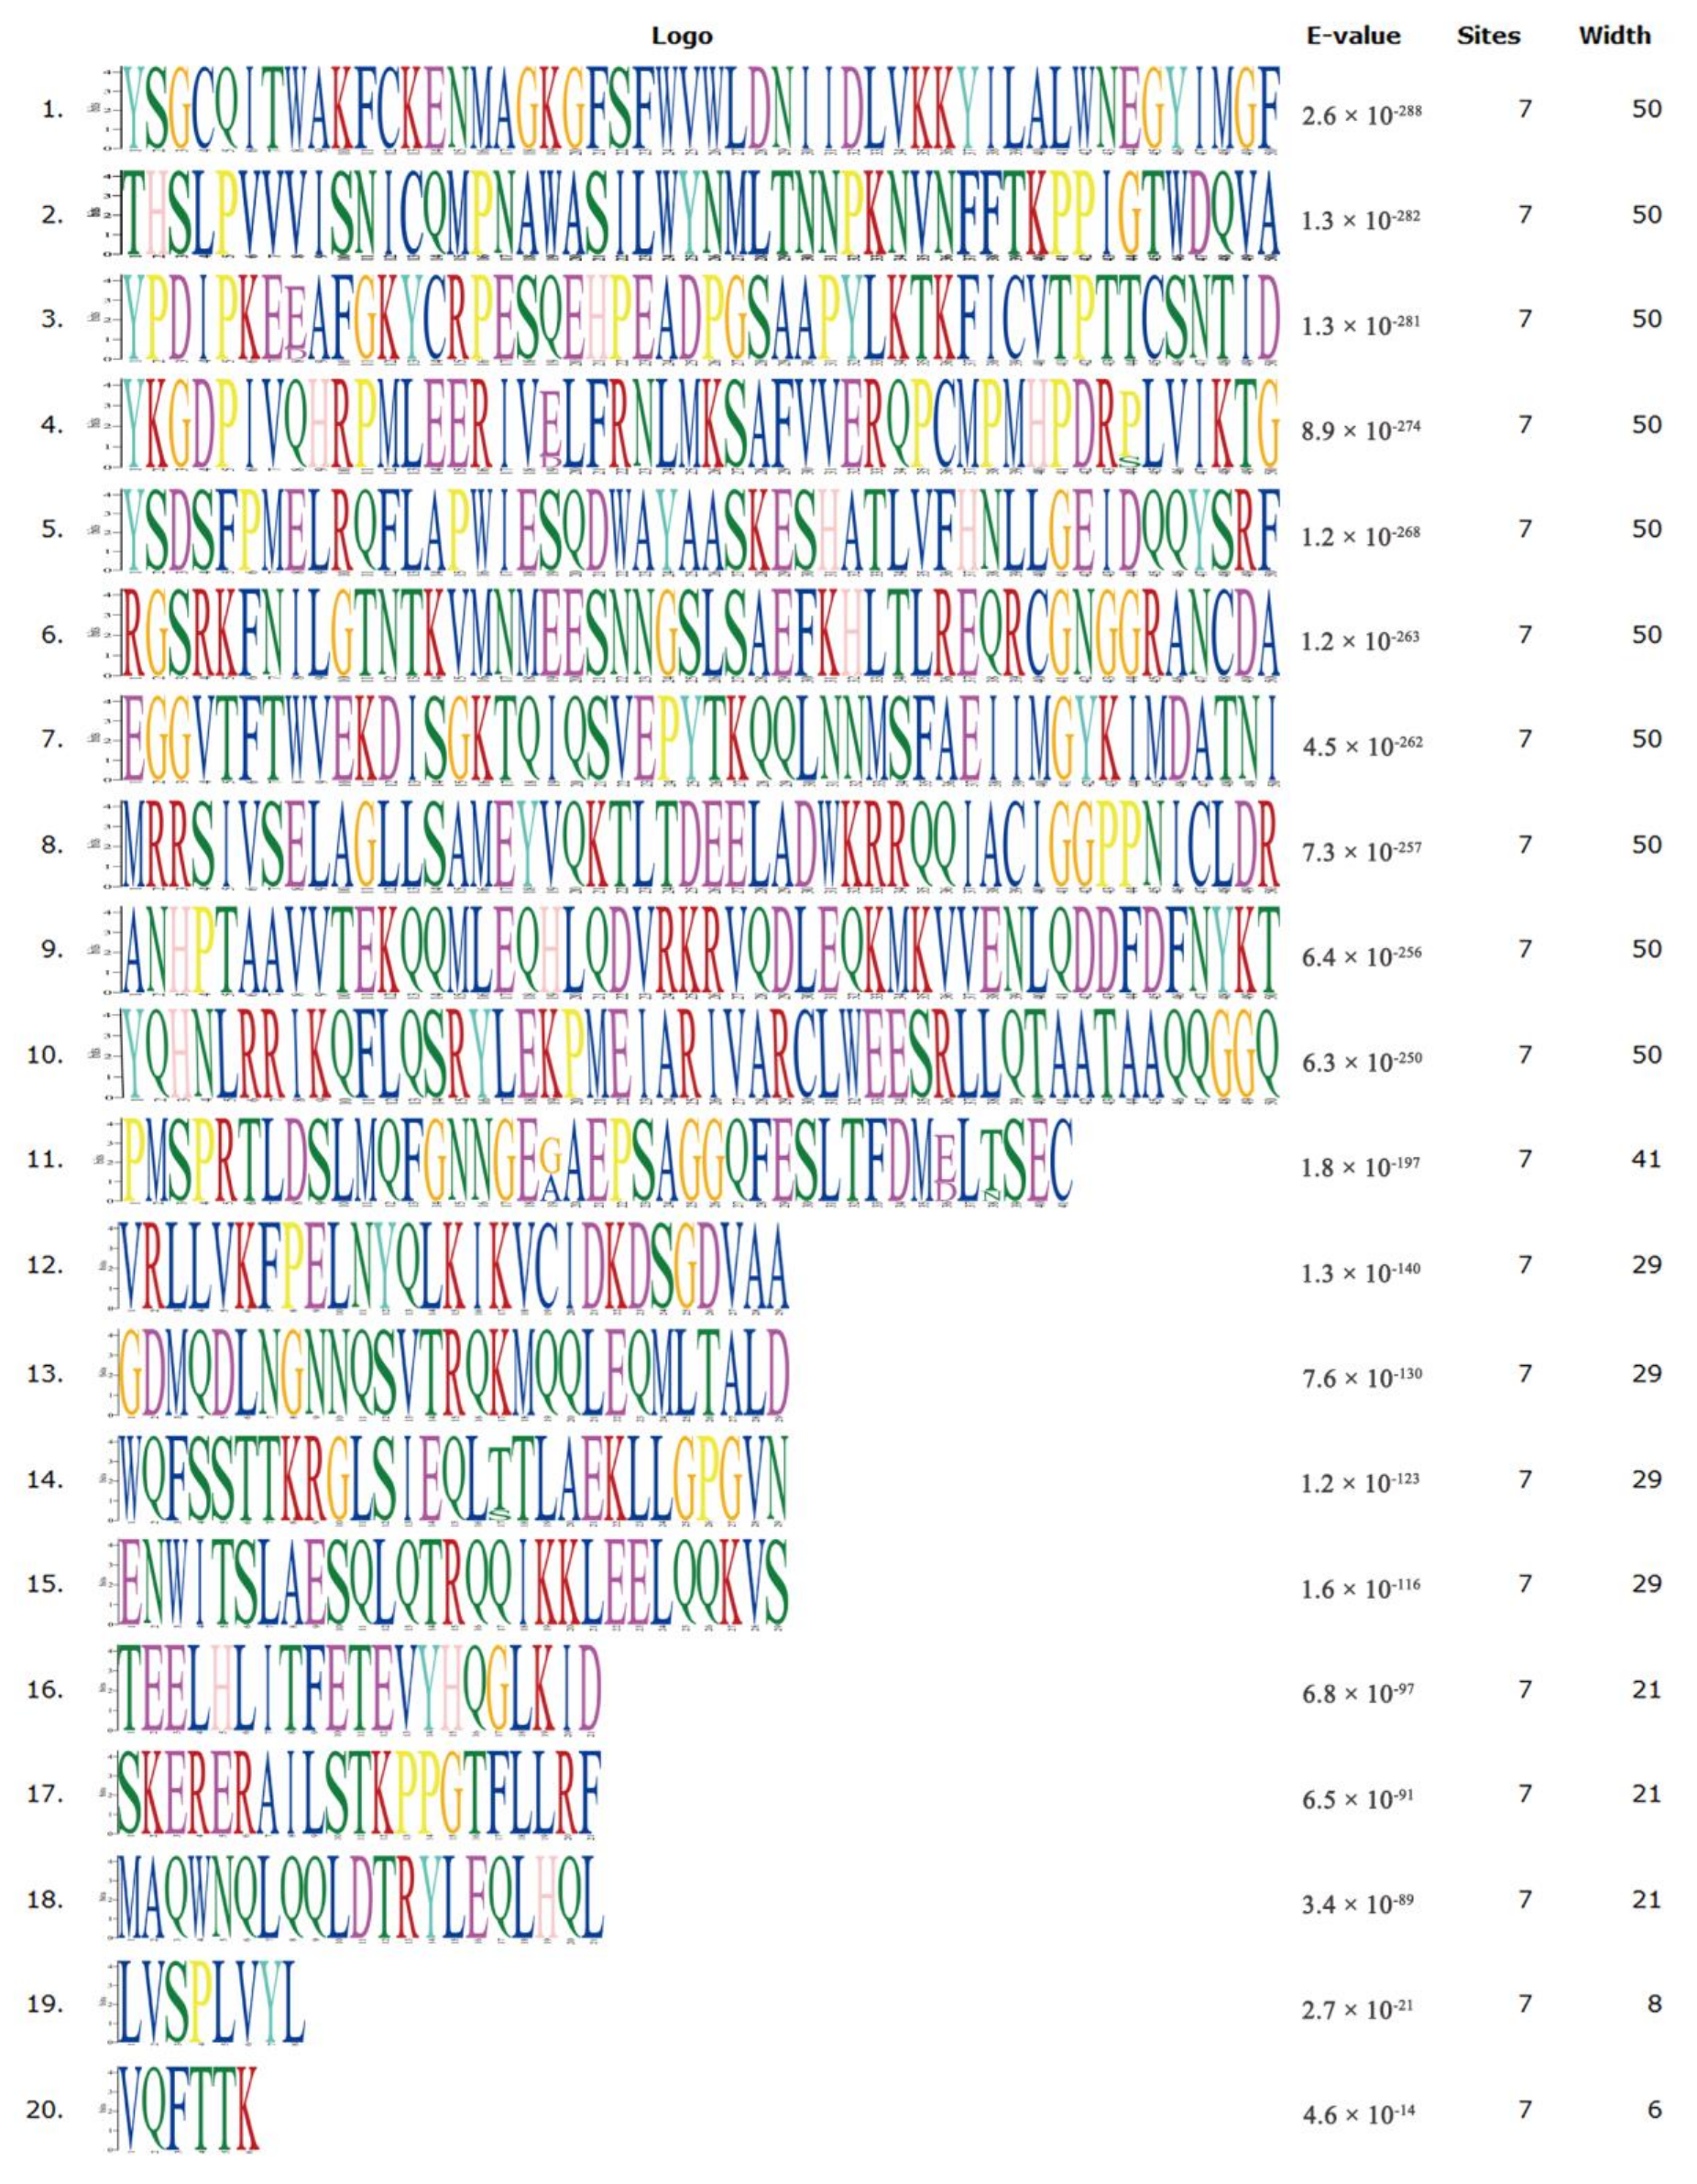
2.1. Biological Evolution and Estimates of Conservation

We performed multiple sequence alignment on STAT3 from seven species, including common ruminants (bovine, goat, and sheep), monogastric animals (rat, mouse, pig), and humans (Figure 1). As the primary structure was highly similar among species, we hypothesized that function was also similar across tested species. We then investigated STAT3 sequence phylogenetic tree construction (Figure 2) and used the MEME suite tool to look for common motifs in supersecondary structures (Figure 2 and Figure 3). Bovine, goat, and sheep STAT3 were the most closely related, while human, pig, rat, and mouse branches were far from the bovine sequence. We found 20 significant motifs among the seven species (Figure 2 and Figure 3), indicating functional similarity at the supersecondary structure level. We searched NCBI CDD for protein tertiary structures and found the same four specific hits per species, representing four domain superfamilies (Figure 4). Thus, each species possesses a STAT3 protein with four similar domain structures (SH2_STAT3, STAT_bind, STAT_alpha, and STAT_int superfamily), at the tertiary level, providing further evidence of functional similarity.

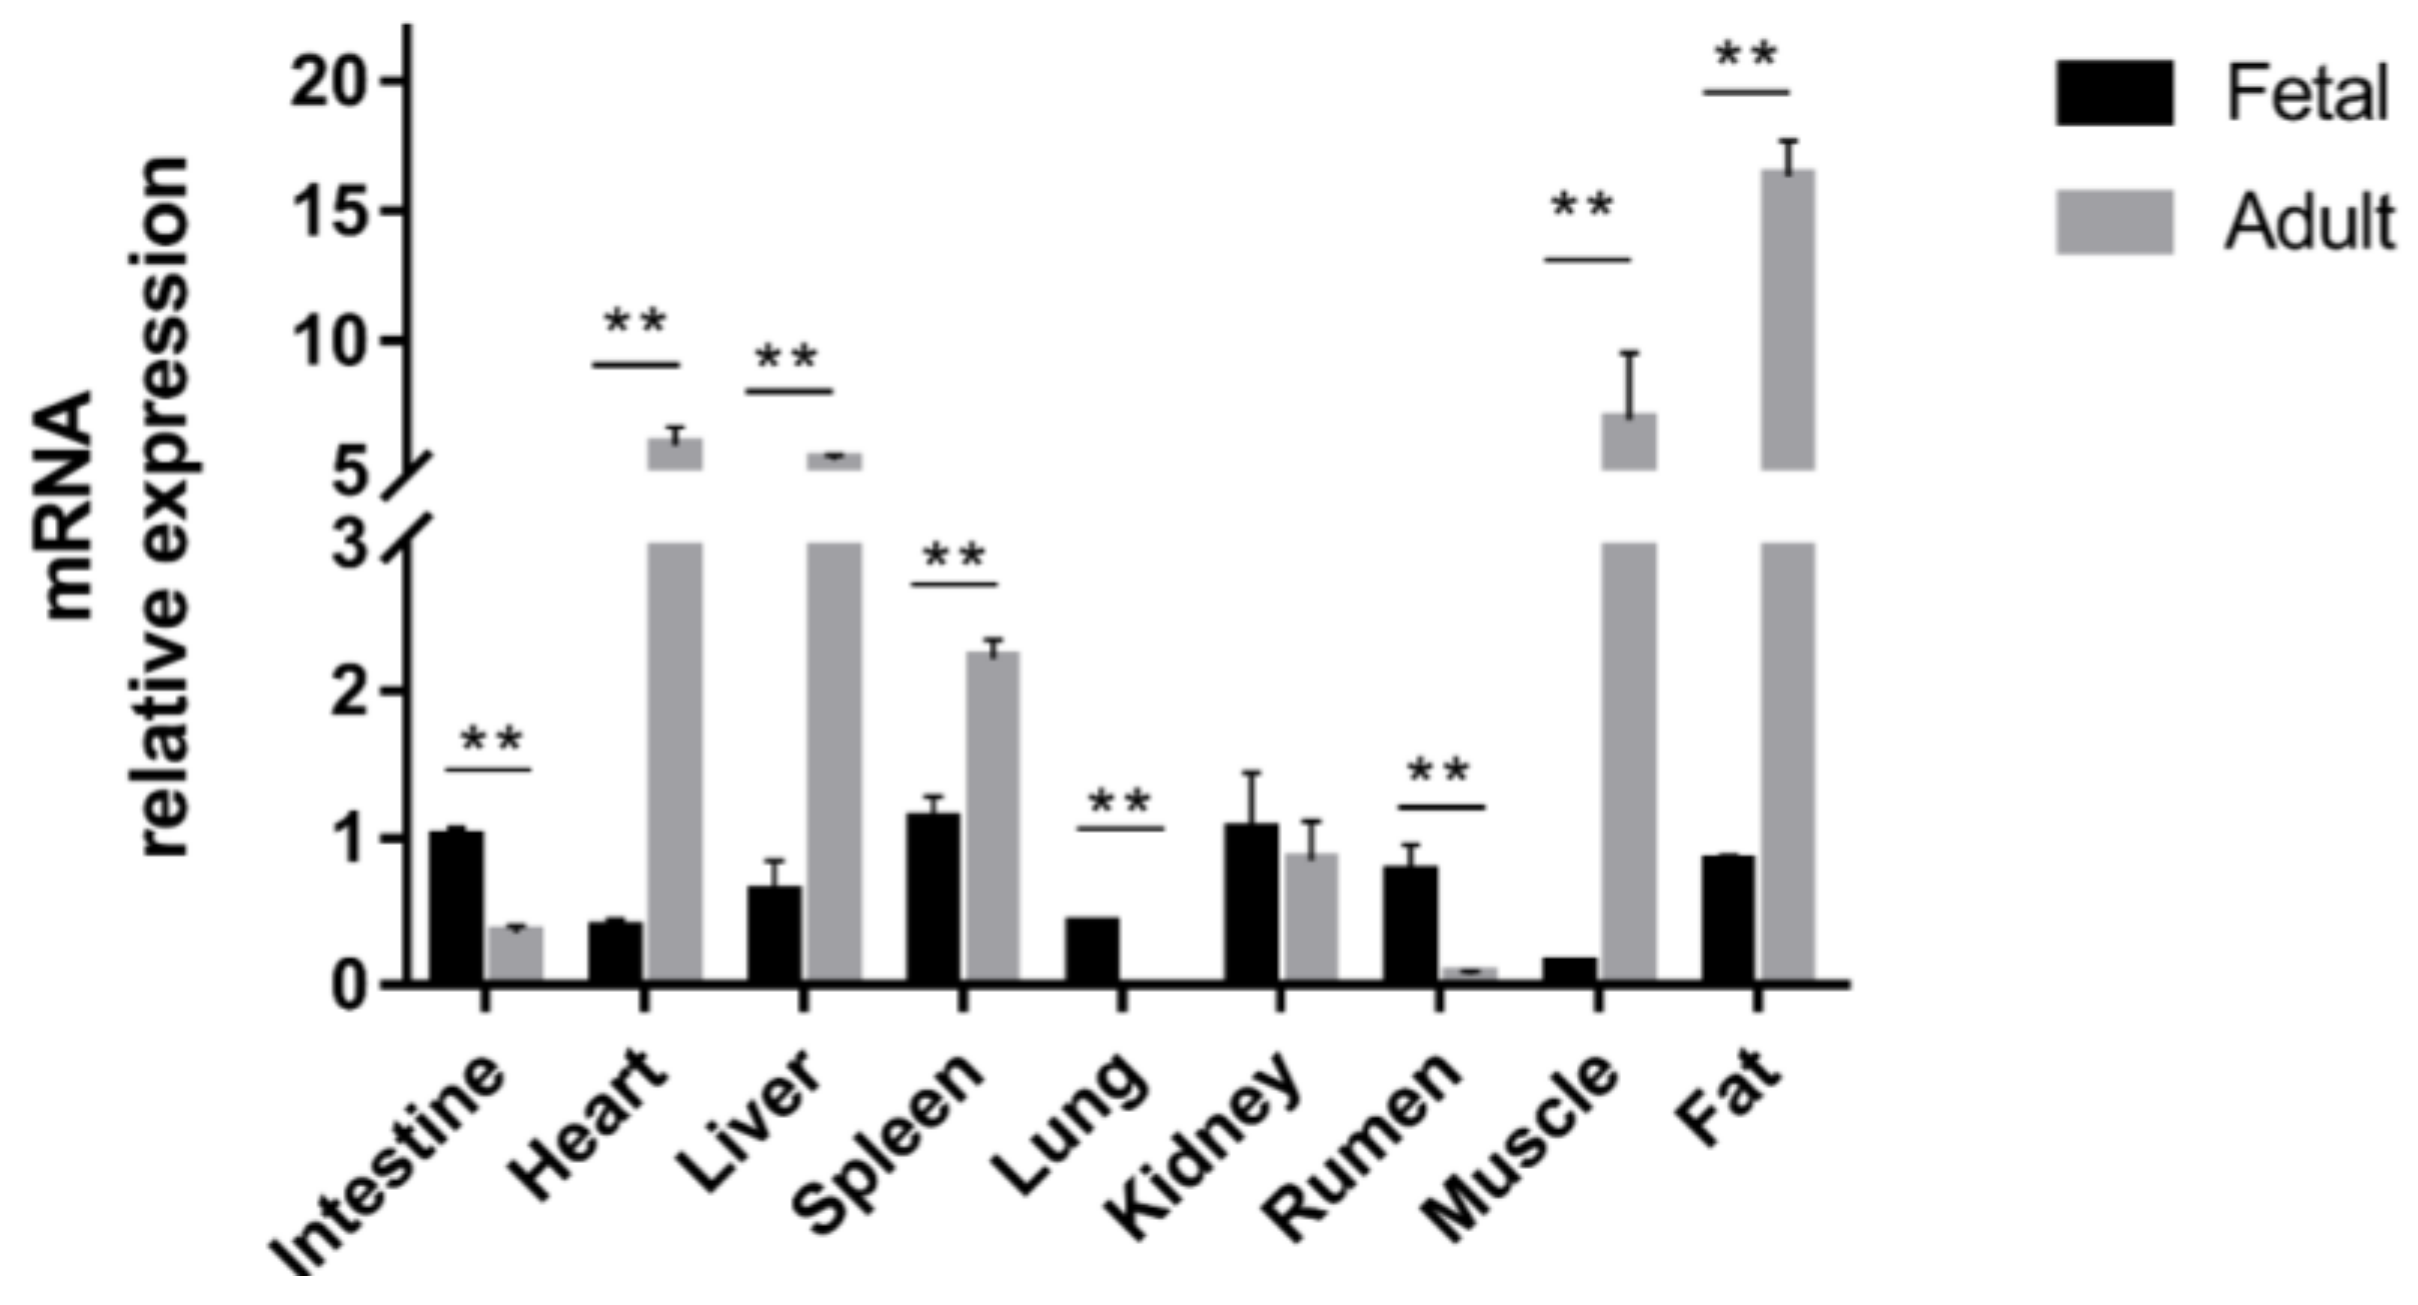
2.2. Differential Expression of STAT3 across Development

We determined STAT3 mRNA expression in nine different tissues from fetal (FQC) and adult (AQC) Qinchuan cattle. Relative expression varied in all examined tissues (Figure 5). Among FQC, STAT3 expression was highest in fat, rumen, kidney, spleen, and intestine; moderate in lung, liver, and heart; and lowest in muscle. However, among AQC, STAT3 expression was highest in fat, muscle, heart, and liver; moderate in spleen; and lowest in intestine, lung, kidney, and rumen.
We observed a significant increase in STAT3 expression of heart, liver, spleen, muscle, and fat from the fetal to adult stage (p < 0.01). In contrast, intestinal, lung, and ruminal STAT3 expression decreased dramatically among AQC (p < 0.01). Finally, renal STAT3 expression did not differ between FQC and AQC.
These results suggest either a direct or indirect connection between bovine body size traits and STAT3 action, considering that the protein’s biological processes are highly conserved across mammals. Overall, STAT3 regulatory function warrants further research.

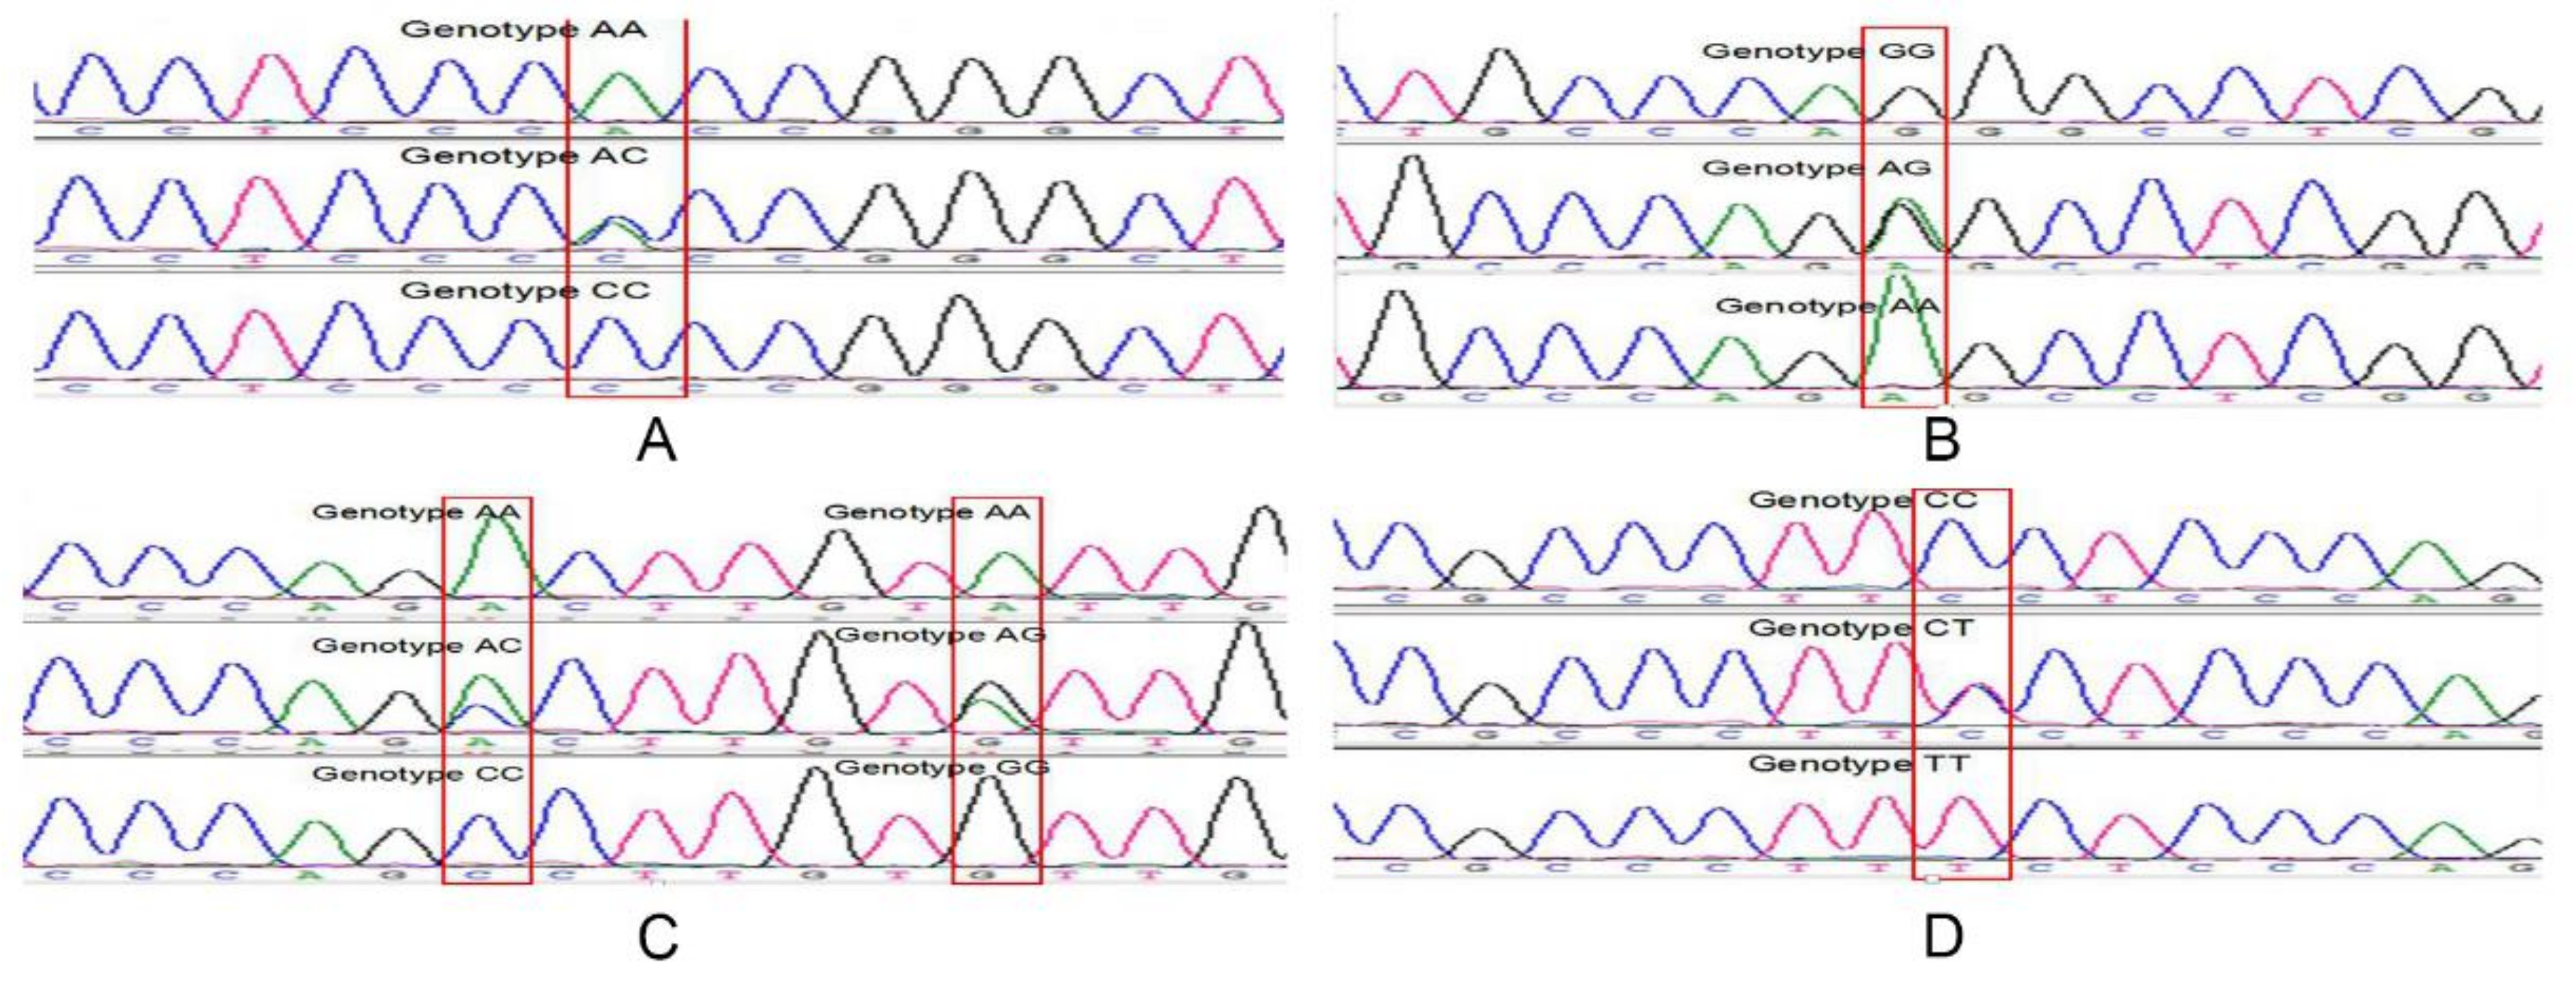
2.3. Identification of Sequence Variants and Prediction of Transcription Factors in Qinchuan Cattle

We identified five SNPs in STAT3 promoter regions: SNP1-304A>C, SNP2-285G>A, SNP3-209A>C, SNP4-203A>G, and SNP5-188T>C. Sequencing each SNP respectively yielded genotypes AA, AC, CC; GG, AG, AA; AA, AC, CC; GG, AG, AA; and TT, CT, CC (Figure 6). Genotypes and allele frequencies were analyzed for the five mutations (Table 1), which were found to be significantly outside HWE (Chi-squared test, p < 0.05). Additionally, PIC classification indicated that the five SNPs were moderately polymorphic (0.25 < PIC < 0.50).
In silico analysis indicated that alternative alleles may generate gains or losses of transcription factor binding sites. The substitution of A with C in SNP1 and SNP3, as well as the substitution of T with C in SNP 5 produced a putative gain of binding sites Sp1, MyoD, and SRF, respectively (Table 2). Substituting G with A in SNP2 and A with G in SNP4 produced a putative loss of binding sites AP-2 and CP1, respectively.

2.4. Linkage Disequilibrum (LD) and Haplotype Analysis

The most commonly used predictors of LD are D′ and r2. The latter index is a pairwise measure of LD and less sensitive to allele frequencies than D’ [32,33]. We found that D′ ranged from 0.235 to 1.000 among the five SNPs, while r2 range was 0.052–0.452 (Table 3). When r2 > 0.33, LD is considered to be sufficiently strong for use in mapping [34]. Based on both predictors, LD was strongest between SNP3 and SNP4.
Haplotype analyses were performed using the online tool SHEsis. Because we were interested in common genetic polymorphisms (frequency ≥0.05) [35], all haplotypes with frequencies <0.05 were excluded, leaving Hap1 (AAAAT), Hap2 (CGAAC), and Hap3 (CGCGC) (Table 4). The third haplotype was the most frequently occurring High-frequency haplotypes are probably ancient and better adapted to the current environment [36]. Most new mutants were derived from common haplotypes, implying that rare variants represented recent mutations and were likely related to common haplotypes [37].

2.5. Effects of SNPs and Haplotype Combinations on Body Size Traits

We examined relationships between the five SNPs and body size traits in 420 Qinchuan cattle (Table 5). At the SNP1 locus, genotype-AA individuals had greater chest depth than AC and CC individuals (p < 0.05). However, body length, wither height, hip height, hip width, and chest circumference did not differ between genotypes (p > 0.05). At the SNP2 locus, AG and AA individuals had greater wither height than GG individuals (p < 0.01). At the SNP3/4 locus, genotypes AA/AA and AC/AG were significantly related to wither height and chest depth (p < 0.01). Additionally, chest depth differed significantly between these two genotypes (p < 0.05), whereas they were not associated with other body-size parameters (p > 0.05). At the SNP5 locus, TT individuals had greater hip width, hip height (p < 0.01) and chest depth (p < 0.05) than CC individuals. Table 6 lists the associations of haplotype combinations with body size traits. Combinations of frequencies <5.0% were excluded from further analysis. The haplotype combination H3H3 (CC-GG-CC-AA-CC) yielded significantly enhanced body size traits than other combinations (p < 0.01).

3. Discussion

The bovine STAT3 gene (24 exons) is located on chromosome 19 and is involved in leptin-mediated regulation of energy metabolism [13,14,15,16,17]. The leptin receptor–STAT3 signaling pathway is central to leptin regulation of food intake and energy expenditure [38]. In vitro studies reported that STAT3 deletion interferes with normal body weight homeostasis and glucose metabolism, leading to obesity, diabetes, and thermal dysregulation [14,15]. Furthermore, STAT3 loss in mature adipocytes of mice increased adiposity and adipocyte hypertrophy [39]. Among livestock, STAT3 polymorphisms significantly affected body size traits in Xinong Saanen dairy goats and Hainan black goats [40]. Identification of candidate genes and QTLs is useful for marker-assisted breeding to improve economically important traits in cattle. Numerous findings [14,15,38,39] suggest that STAT3 influences muscle and adipose tissue growth. Unfortunately, few studies have examined how bovine STAT3 promoter regions are associated with body size traits in Qinchuan cattle. Thus, here we successfully identified five SNPs in bovine STAT3 promoter regions. Chi-squared tests revealed that the five SNPs were not in HWE, possibly due to artificial selection from draft cattle to beef production, or small sample size [41].
Promoters can alter QTL expression through regulating mRNA isoforms [42]. In the present study, tissue-preferential STAT3 expression differed significantly across fetal and adult stages. Moreover, we found significant relationships between SNPs and body size traits in our cattle population. Specifically, SNP1 genotype AA influenced chest depth (p < 0.05), while SNP2 genotypes AG and AA were associated with improved wither height (p < 0.01). The SNP3/4 genotypes AA/GG and AC/AG also affected wither height and chest depth (p < 0.05), while genotype CC/AA resulted in the widest hips (p < 0.01). At SNP5, genotype TT increased hip height, hip width, wither height, and chest depth over genotype CC (p < 0.05). Our investigation of associations between haplotype combinations and body size traits revealed that H3H3 individuals differed significantly from other haplotypes (p < 0.01). These results suggested that H3H3 could see potential use as a molecular marker in future breeding programs to increase Qinchuan cattle growth rates. In our future studies, we aim to investigate how SNPs alter STAT3 promoter activity to influence body size traits.
In complex signaling cascades, transcription factors activate the target gene via directly binding to DNA, or else control gene expression through altering chromatin configuration [43]. Thus, we used allelic presence to predict potential transcription factor binding sites. Mutations in SNP1, SNP3, and SNP5 produced a putative gain of Sp1, MyoD, and SRF binding sites, respectively, whereas mutations in SNP2 and SNP4 produced a putative loss of AP-2 and CP1 binding sites. This outcome suggests that the identified SNPs would affect transcription-factor binding affinity in surrounding sequences. However, gene expression studies should be performed to confirm exact SNP function.
Methylation of STAT3 can influence relevant traits through altering gene activity, leading to consequences such as increasing the risk of gastric cancer [44]. In turn, variants of a given promoter region may alter methylation. Previous studies have shown that STAT3 activation causes changes to colorectal cancer [45], glioma cells [46], and dendritic cells [47]. In this study, we found clear associations between STAT3 promoter SNPs and body size traits of Qinchuan cattle. The underlying mechanism of this link may be related to methylation-induced promoter activation. However, further research is necessary before we can fully understand how promoter methylation influences the association between STAT3 and traits of interest.

4. Materials and Methods

4.1. Bioinformatics Analyses

Amino acid sequences of STAT3 were acquired from NCBI for seven species (Bos taurus NP_001012689.2, Homo sapiens NP_644805.1, Rattus norvegicus NP_036879.1, Mus musculus NP_998824.1, Capra hircus NP_001301207.1, Ovis aries XP_014954273.1, and Sus scrofa NP_001038045.1). Multiple sequence alignment was performed in MUSCLE (MUltiple Sequence Comparison by Log-Expectation), while a neighbor-joining phylogenetic tree was constructed in MEGA version 7.0.26 (Philadelphia, PA, USA) [48]. To analyze protein-structure function, we searched motifs and conserved domains using the MEME suite [49] and NCBI CDD [50,51].

4.2. Subject Animals

The Experiment Farm of the National Beef Cattle Improvement Center (Yangling, China) supplied Qinchuan cattle for this study. The experiment used 420 adult females (aged 24–30 months, unrelated for at least three generations, not pregnant). All procedures were performed in accordance with the guidelines of the China Council on Animal Care. Protocols were also approved by the Experimental Animal Management Committee (EAMC) of Northwest A & F University (EAMC.N0.2013-23, 20 April 2013). The same care protocol and the same environment were employed for cattle rearing. Subjects were fed a diet of 25% concentrate and 75% roughage (corn silage and dry straw) on a total mixed ration (TMR) basis and provided water ad libitum, following based on the Nutrient Requirement of Beef Cattle (Eighth Revised Edition, NRC, 2016).

4.3. RNA Preparation and Real-Time PCR

Three fetal Qinchuan cattle (FQC, 90-day-old) and three adult Qinchuan cattle (AQC, 24-month-old) were randomly selected (three biological replicates per age). The adults and fetuses were unrelated within the last three generations. The FQC embryos (cattle gestation: 280 days) were placed in sterile physiological saline immediately after removal from the reproductive tract of slaughtered cattle at a local abattoir. In addition, FQC age was estimated following published research [52].
To detect transcriptome-level STAT3 expression, we collected nine tissues (intestine, heart, liver, spleen, lung, kidney, rumen, muscle, and fat) at both FQC and AQC. Samples were immediately frozen in liquid nitrogen upon collection from the carcasses before being transferred to the laboratory for RNA extraction.
The RNAprep Pure Tissue kit (Tiangen, Beijing, China) and reverse transcription kit (Thermo Fisher Scientific, Waltham, MA, USA) were used for RNA extraction and cDNA synthesis, respectively. Real-time quantitative PCR (RT-qPCR) was performed in an Applied Biosystems thermocycler (ABI7500, Thermo Fisher Scientific, Waltham, MA, USA), using the SYBR Premix Ex Taq kit (Takara, Dalian, China). Bovine β-actin and GAPDH were used as internal controls. Table 7 provides all primers used. Analyses were performed in triplicate. Relative expression of mRNA was calculated using the 2−ΔΔCt method [53].

4.4. DNA Isolation, and Phenotypic Data

Blood samples for DNA extraction were collected from 420 Qinchuan cattle, aged 24–30 months, following published protocols [54]. Body size traits (body length, withers height, hip height, rump length, hip width, chest depth, and chest circumference) were measured in accordance with previous methods [55].

4.5. PCR Amplification and Genotyping

Promoter regions were PCR-amplified (primers: F-GGAACGAAGGGCAGGGTTAAA; R-GCTGGGGTGCTCGTCAGGGAT) sequenced. The reaction mixture (20 μL) contained 50 ng DNA, 10 pM of each primer, 0.20 mM dNTP, 2.5 mM MgCl2, and 0.5 U Taq DNA polymerase (Takara, Dalian, China). Amplicons were sequenced in Sangon (Shanghai, China) to screen for variants. Thermocycling conditions were as follows: 95 °C for 5 min; 94 °C for 30 s, 63.1 °C for 35 s, and 72 °C for 40 s; 35 cycles from 94 °C to 72 °C; followed by a final extension at 72 °C for 10 min. Sequences were identified in SeqMan (DNASTAR, Inc., Madison, WI, USA). Promoter positions were numbered by designating the first nucleotide of the first exon as +1 and the nucleotide immediately upstream as −1.

4.6. Data Analyses

Genotypic and allelic frequencies were directly calculated for all five SNPs. The Hardy-Weinberg equilibrium (HWE) was estimated with a Chi-squared test in PopGene version 3.2 (University of Alberta, Edmonton, AB, Canada) [56]. Population genetic indices, including gene heterozygosity (He) and polymorphism information content (PIC), were statistically analyzed following published methods [57]. General linear models were used to analyze trait means. The relationship between different genotypes and body size traits of Qinchuan cattle was analyzed in SPSS 24.0 (SPSS, Inc., Chicago, IL, USA). The statistical linear model for this analysis was the same as previous reports [58,59]: Yijk = u + Gi + Ai + Sk + Eijk, with Yijk = trait value per individual, μ = overall population mean per trait, Gi = fixed effect associated with genotype, Ai = fixed effect of age, and Eijk = standard error. Putative binding sites for transcription factors were searched using TESS (available online: http://gene-regulation.com/pub/databases.html).
Linkage disequilibrium (LD) and haplotypes were analyzed using SHEsis [60]. The Bonferroni correction was used to adjust p values.

5. Conclusions

In this study, we determined that the combined genotype H3H3 (CC-GG-CC-AA-CC) had the strongest effect on body size traits among all identified SNP variants of STAT3 promoter regions. We conclude that this genotype could be used as a molecular marker in future breeding programs that aim to select for body size traits in Qinchuan cattle.

Acknowledgments

This study was supported by The National Key Technology Support Program (#2015BAD03B04) and the National Beef and Yak Industrial Technology System (#CARS-38).

Author Contributions

Lin-Sen Zan, Gong Cheng, and Hongbao Wang conceived and designed the experiments; Sen Wu and Yaning Wang performed the experiments; Yue Ning and Hongfang Guo performed data analysis; Le Zhang and Xiaoyu Wang contributed to sample collection; Sen Wu wrote the paper; Rajwali Khan assisted with writing and proofreading.

Conflicts of Interest

The authors declare no conflict of interest.

Abbreviations

CDDConserved Domains Database
FQCfetal Qinchuan cattle
AQCadult Qinchuan cattle
LDlinkage disequilibrium
MASmarker-assisted selection
QTLquantitative trait locus
HWEHardy-Weinberg equilibrium

References

  1. Zuo, B.; Yang, H.; Lei, M.; Li, F.; Deng, C.; Jiang, S.; Xiong, Y. Association of the polymorphism in GYS1 and ACOX1 genes with meat quality traits in pigs. Animal 2007. [Google Scholar] [CrossRef] [PubMed]
  2. Brito, L.F.; Clarke, S.M.; McEwan, J.C.; Miller, S.P.; Pickering, N.K.; Bain, W.E.; Dodds, K.G.; Sargolzaei, M.; Schenkel, F.S. Prediction of genomic breeding values for growth, carcass and meat quality traits in a multi-breed sheep population using a HD SNP chip. BMC Genet. 2017, 18. [Google Scholar] [CrossRef] [PubMed]
  3. Gui, L.S.; Hao, R.J.; Zhang, Y.R.; Zhao, X.L.; Zan, L.S. Haplotype distribution in the class I sirtuin genes and their associations with ultrasound carcass traits in Qinchuan cattle (Bos taurus). Mol. Cell. Probes 2015, 29, 167–171. [Google Scholar] [CrossRef] [PubMed]
  4. Yang, W.C.; Wang, Y.N.; Fu, C.Z.; Zan, L.S. Association study and expression analysis of MTNR1A as a candidate gene for body measurement and meat quality traits in Qinchuan cattle. Gene 2015, 570, 199–204. [Google Scholar] [CrossRef] [PubMed]
  5. Wang, G.; Zhang, S.; Wei, S.; Zhang, Y.; Li, Y.; Fu, C.; Zhao, C.; Zan, L. Novel polymorphisms of SIX4 gene and their association with body measurement traits in Qinchuan cattle. Gene 2014, 539, 107–110. [Google Scholar] [CrossRef] [PubMed]
  6. Fontanesi, L.; Scotti, E.; Buttazzoni, L.; Dall’Olio, S.; Bagnato, A.; Fiego, D.P.L.; Davoli, R.; Russo, V. Confirmed association between a single nucleotide polymorphism in the FTO gene and obesity-related traits in heavy pigs. Mol. Biol. Rep. 2010, 37, 461–466. [Google Scholar] [CrossRef] [PubMed]
  7. Alvarado, J.J.; Betts, L.; Moroco, J.A.; Smithgall, T.E.; Yeh, J.I. Crystal Structure of the Src Family Kinase Hck SH3-SH2 Linker Regulatory Region Supports an SH3-dominant Activation Mechanism. J. Biol. Chem. 2010, 285, 35455–35461. [Google Scholar] [CrossRef] [PubMed]
  8. Kamran, M.Z.; Patil, P.; Gude, R.P. Role of STAT3 in Cancer Metastasis and Translational Advances. BioMed Res. Int. 2013, 2013. [Google Scholar] [CrossRef] [PubMed]
  9. Li, J.; Cui, G.; Sun, L.; Wang, S.J.; Li, Y.L.; Meng, Y.G.; Guan, Z.; Fan, W.S.; Li, L.A.; Yang, Y.Z.; et al. STAT3 acetylation-induced promoter methylation is associated with downregulation of the ARHI tumor-suppressor gene in ovarian cancer. Oncol. Rep. 2013, 30, 165–170. [Google Scholar] [CrossRef] [PubMed]
  10. Pfeffer, S.R.; Fan, M.Y.; Du, Z.Y.; Yang, C.H.; Pfeffer, L.M. Unphosphorylated STAT3 regulates the antiproliferative, antiviral, and gene-inducing actions of type I interferons. Biochem. Biophys. Res. Commun. 2017, 490, 739–745. [Google Scholar] [CrossRef] [PubMed]
  11. Limagne, E.; Thibaudin, M.; Euvrard, R.; Berger, H.; Chalons, P.; Vegan, F.; Humblin, E.; Boidot, R.; Rebe, C.; Derangere, V.; et al. Sirtuin-1 Activation Controls Tumor Growth by Impeding Th17 Differentiation via STAT3 Deacetylation. Cell Rep. 2017, 19, 746–759. [Google Scholar] [CrossRef] [PubMed]
  12. Song, Q.; Xie, Y.X.; Gou, Q.H.; Guo, X.Q.; Yao, Q.; Gou, X.J. JAK/STAT3 and Smad3 activities are required for the wound healing properties of Periplaneta americana extracts. Int. J. Mol. Med. 2017, 40, 465–473. [Google Scholar] [CrossRef] [PubMed]
  13. Vaisse, C.; Halaas, J.L.; Horvath, C.M.; Darnell, J.E.; Stoffel, M.; Friedman, J.M. Leptin activation of Stat3 in the hypothalamus of wild–type and ob/ob mice but not db/db mice. Nat. Genet. 1996, 14, 95–97. [Google Scholar] [CrossRef] [PubMed]
  14. Cui, Y.X.; Huang, L.; Elefteriou, F.; Yang, G.Q.; Shelton, J.M.; Giles, J.E.; Oz, O.K.; Pourbahrami, T.; Lu, C.Y.H.; Richardson, J.A.; et al. Essential role of STAT3 in body weight and glucose homeostasis. Mol. Cell. Biol. 2004, 24, 258–269. [Google Scholar] [CrossRef] [PubMed]
  15. Gao, Q.; Wolfgang, M.J.; Neschen, S.; Morino, K.; Horvath, T.L.; Shulman, G.I.; Fu, X.Y. Disruption of neural signal transducer and activator of transcription 3 causes obesity, diabetes, infertility, and thermal dysregulation. Proc. Natl. Acad. Sci. USA 2004, 101, 4661–4666. [Google Scholar] [CrossRef] [PubMed]
  16. Gorogawa, S.; Fujitani, Y.; Kaneto, H.; Hazama, Y.; Watada, H.; Miyamoto, Y.; Takeda, K.; Akira, S.; Magnuson, M.A.; Yamasaki, Y.; et al. Insulin secretory defects and impaired islet architecture in pancreatic beta-cell-specific STAT3 knockout mice. Biochem. Biophys. Res. Commun. 2004, 319, 1159–1170. [Google Scholar] [CrossRef] [PubMed]
  17. Derecka, M.; Gornicka, A.; Koralov, S.B.; Szczepanek, K.; Morgan, M.; Raje, V.; Sisler, J.; Zhang, Q.F.; Otero, D.; Cichy, J.; et al. Tyk2 and Stat3 Regulate Brown Adipose Tissue Differentiation and Obesity. Cell Metab. 2012, 16, 814–824. [Google Scholar] [CrossRef] [PubMed]
  18. Song, N.; Gui, L.S.; Xu, H.C.; Wu, S.; Zan, L.S. Identification of single nucleotide polymorphisms of the signal transducer and activator of transcription 3 gene (STAT3) associated with body measurement and carcass quality traits in beef cattle. Genet. Mol. Res. GMR 2015, 14, 11242–11249. [Google Scholar] [CrossRef] [PubMed]
  19. Pang, Y.H.; Wang, J.Q.; Zhang, C.L.; Lei, C.Z.; Lan, X.Y.; Yue, W.P.; Gu, C.W.; Chen, D.X.; Chen, H. The polymorphisms of bovine VEGF gene and their associations with growth traits in Chinese cattle. Mol. Biol. Rep. 2011, 38, 755–759. [Google Scholar] [CrossRef] [PubMed]
  20. Liu, Y.; Zan, L.; Zhao, S.; Xin, Y.; Li, L.; Cui, W.; Tang, Z.; Li, K. Molecular characterization, polymorphism of bovine ZBTB38 gene and association with body measurement traits in native Chinese cattle breeds. Mol. Biol. Rep. 2010, 37, 4041–4049. [Google Scholar] [CrossRef] [PubMed]
  21. Dekkers, J.C. Commercial application of marker-and gene-assisted selection in livestock: Strategies and lessons. J. Anim. Sci. 2004, 82 (Suppl. 13), E313–E328. [Google Scholar] [PubMed]
  22. de Camargo, G.M.F.; Cardoso, D.F.; Gil, F.M.M.; Fonseca, P.D.D.; Zetouni, L.; Braz, C.U.; de Freitas, A.C.; de Souza, F.R.P.; Aspilcueta-Borquis, R.R.; Baldi, F.; et al. First polymorphisms in JY-1 gene in cattle (Bos taurus indicus) and their association with sexual precocity and growth traits. Mol. Biol. Rep. 2012, 39, 10105–10109. [Google Scholar] [CrossRef] [PubMed]
  23. Alim, M.A.; Fan, Y.P.; Wu, X.P.; Xie, Y.; Zhang, Y.; Zhang, S.L.; Sun, D.X.; Zhang, Y.; Zhang, Q.; Liu, L.; et al. Genetic effects of stearoyl-coenzyme A desaturase (SCD) polymorphism on milk production traits in the Chinese dairy population. Mol. Biol. Rep. 2012, 39, 8733–8740. [Google Scholar] [CrossRef] [PubMed]
  24. Jamshidi, Y.; Kyriakou, T.; Gooljar, S.B.; Collins, L.J.; Lane, C.A.; Snieder, H.; Wang, X.L.; Spector, T.D.; O’Dell, S.D. Common STAT3 variants are not associated with obesity or insulin resistance in female twins. Obesity 2007, 15, 1634–1639. [Google Scholar] [CrossRef] [PubMed]
  25. Gianotti, T.F.; Sookoian, S.; Gemma, C.; Burgueno, A.L.; Gonzalez, C.D.; Pirola, C.J. Study of genetic variation in the STAT3 on obesity and insulin resistance in male adults. Obesity 2008, 16, 1702–1707. [Google Scholar] [CrossRef] [PubMed]
  26. Phillips, C.M.; Goumidi, L.; Bertrais, S.; Field, M.R.; Peloso, G.M.; Shen, J.; McManus, R.; Hercberg, S.; Lairon, D.; Planells, R.; et al. Dietary Saturated Fat Modulates the Association between STAT3 Polymorphisms and Abdominal Obesity in Adults. J. Nutr. 2009, 139, 2011–2017. [Google Scholar] [CrossRef] [PubMed]
  27. Li, P.; Tiwari, H.K.; Lin, W.Y.; Allison, D.B.; Chung, W.K.; Leibel, R.L.; Yi, N.; Liu, N. Genetic association analysis of 30 genes related to obesity in a European American population. Int. J. Obes. 2014, 38, 724–729. [Google Scholar] [CrossRef] [PubMed]
  28. Yang, J.; Liu, X.; Wang, D.; Ning, C.; Wang, H.F.; Zhang, Q.; Jiang, L. Functional validation of GPIHBP1 and identification of a functional mutation in GPIHBP1 for milk fat traits in dairy cattle. Sci. Rep. 2017, 7, 10. [Google Scholar] [CrossRef] [PubMed]
  29. Liu, S.L.; Yin, H.W.; Li, C.; Qin, C.H.; Cai, W.T.; Cao, M.Y.; Zhang, S.L. Genetic effects of PDGFRB and MARCH1 identified in GWAS revealing strong associations with semen production traits in Chinese Holstein bulls. BMC Genet. 2017, 18, 10. [Google Scholar] [CrossRef] [PubMed]
  30. Gui, L.S.; Hong, J.Y.; Raza, S.H.A.; Zan, L.S. Genetic variants in SIRT3 transcriptional regulatory region affect promoter activity and fat deposition in three cattle breeds. Mol. Cell. Probes 2017, 32, 40–45. [Google Scholar] [CrossRef] [PubMed]
  31. Wang, K.J.; Liu, Y.F.; Xu, Q.; Liu, C.K.; Wang, J.; Ding, C.; Fang, M.Y. A post-GWAS confirming GPAT3 gene associated with pig growth and a significant SNP influencing its promoter activity. Anim. Genet. 2017, 48, 478–482. [Google Scholar] [CrossRef] [PubMed]
  32. Marty, A.; Amigues, Y.; Servin, B.; Renand, G.; Leveziel, H.; Rocha, D. Genetic Variability and Linkage Disequilibrium Patterns in the Bovine DNAJA1 Gene. Mol. Biotechnol. 2010, 44, 190–197. [Google Scholar] [CrossRef] [PubMed]
  33. Zhao, H.; Nettleton, D.; Dekkers, J.C.M. Evaluation of linkage disequilibrium measures between multi-allelic markers as predictors of linkage disequilibrium between single nucleotide polymorphisms. Genet. Res. 2007, 89, 1–6. [Google Scholar] [CrossRef] [PubMed]
  34. Sun, P.; Zhang, R.J.; Jiang, Y.S.; Wang, X.; Li, J.; Lv, H.C.; Tang, G.P.; Guo, X.D.; Meng, X.W.; Zhang, H.K.; et al. Assessing the patterns of linkage disequilibrium in genic regions of the human genome. FEBS J. 2011, 278, 3748–3755. [Google Scholar] [CrossRef] [PubMed]
  35. Kim, I.C.; Cha, M.H.; Kim, D.M.; Lee, H.; Moon, J.S.; Choi, S.M.; Kim, K.S.; Yoon, Y. A functional promoter polymorphism−607 G > C of WNT10B is associated with abdominal fat in Korean female subjects. J. Nutr. Biochem. 2011, 22, 252–258. [Google Scholar] [CrossRef] [PubMed]
  36. Huang, Y.Z.; He, H.; Sun, J.J.; Wang, J.; Li, Z.J.; Lan, X.Y.; Lei, C.Z.; Zhang, C.L.; Zhang, E.P.; Wang, J.Q.; et al. Haplotype combination of SREBP-1c gene sequence variants is associated with growth traits in cattle. Genome Natl. Res. Counc. Can. 2011, 54, 507–516. [Google Scholar] [CrossRef] [PubMed]
  37. Posada, D.; Crandall, K.A. Intraspecific gene genealogies: Trees grafting into networks. Trends Ecol. Evol. 2001, 16, 37–45. [Google Scholar] [CrossRef]
  38. Bates, S.H.; Stearns, W.H.; Dundon, T.A.; Schubert, M.; Tso, A.W.; Wang, Y.; Banks, A.S.; Lavery, H.J.; Haq, A.K.; Maratos-Flier, E. STAT3 signalling is required for leptin regulation of energy balance but not reproduction. Nature 2003, 421, 856–859. [Google Scholar] [CrossRef] [PubMed]
  39. Cernkovich, E.R.; Deng, J.; Bond, M.C.; Combs, T.P.; Harp, J.B. Adipose-specific disruption of signal transducer and activator of transcription 3 increases body weight and adiposity. Endocrinology 2008, 149, 1581–1590. [Google Scholar] [CrossRef] [PubMed]
  40. Jia, W.C.; Wu, X.F.; Li, X.C.; Xia, T.; Lei, C.Z.; Chen, H.; Pan, C.Y.; Lan, X.Y. Novel genetic variants associated with mRNA expression of signal transducer and activator of transcription 3(STAT3) gene significantly affected goat growth traits. Small Rumin. Res. 2015, 129, 25–36. [Google Scholar] [CrossRef]
  41. Pan, C.; Wu, C.; Jia, W.; Xu, Y.; Lei, C.; Hu, S.; Lan, X.; Chen, H. A critical functional missense mutation (H173R) in the bovine PROP1 gene significantly affects growth traits in cattle. Gene 2013, 531, 398–402. [Google Scholar] [CrossRef] [PubMed]
  42. Garieri, M.; Delaneau, O.; Santoni, F.; Fish, R.J.; Mull, D.; Carninci, P.; Dermitzakis, E.T.; Antonarakis, S.E.; Fort, A. The effect of genetic variation on promoter usage and enhancer activity. Nat. Commun. 2017, 8. [Google Scholar] [CrossRef] [PubMed]
  43. Dall’Olio, S.; Wang, Y.; Sartori, C.; Fontanesi, L.; Mantovani, R. Association of myostatin (MSTN) gene polymorphisms with morphological traits in the Italian Heavy Draft Horse breed. Livest. Sci. 2014, 160, 29–36. [Google Scholar] [CrossRef]
  44. Chou, J.L.; Wei, K.L.; Shie, C.C.; Wu, C.S.; Chan, M.W.Y. Infection of H. pylori is associated with promoter methylation of a putative STAT3-targeted microRNA, miR-193a, in gastric cancer. J. Gastroenterol. Hepatol. 2015, 30, 86. [Google Scholar]
  45. Ahluwalia, A.; Busse, B.A.; Thiruvengadam, S.S.; Tarnawski, A.S. Importins Are Critical for Colorectal Cancer (CRC) Growth and Are Novel Biomarkers of CRC. Underlying Mechanisms Include: Increased Nuclear Transport of P-CREB and P-STAT3, VEGF Gene Promoter Activation and Aberrant VEGF Expression. Gastroenterology 2011, 140, S184. [Google Scholar]
  46. Lindemann, C.; Hackmann, O.; Delic, S.; Schmidt, N.; Reifenberger, G.; Riemenschneider, M.J. SOCS3 promoter methylation is mutually exclusive to EGFR amplification in gliomas and promotes glioma cell invasion through STAT3 and FAK activation. Acta Neuropathol. 2011, 122, 241–251. [Google Scholar] [CrossRef] [PubMed]
  47. Farren, M.R.; Spangler, H.; Carlson, L.M.; Lee, K.P. STAT3 Activity Negatively Regulates PKC beta Promoter Activity, Impairing Dendritic Cell Differentiation. Blood 2011, 118, 89. [Google Scholar]
  48. Kumar, S.; Stecher, G.; Tamura, K. MEGA7: Molecular Evolutionary Genetics Analysis Version 7.0 for Bigger Datasets. Mol. Biol. Evol. 2016, 33, 1870–1874. [Google Scholar] [CrossRef] [PubMed]
  49. Bailey, T.L.; Boden, M.; Buske, F.A.; Frith, M.; Grant, C.E.; Clementi, L.; Ren, J.; Li, W.W.; Noble, W.S. MEME SUITE: Tools for motif discovery and searching. Nucleic Acids Res. 2009, 37, W202–W208. [Google Scholar] [CrossRef] [PubMed]
  50. Marchlerbauer, A.; Bo, Y.; Han, L.; He, J.; Lanczycki, C.J.; Lu, S.; Chitsaz, F.; Derbyshire, M.K.; Geer, R.C.; Gonzales, N.R. CDD/SPARCLE: Functional classification of proteins via subfamily domain architectures. Nucleic Acids Res. 2017, 45, D200. [Google Scholar] [CrossRef] [PubMed]
  51. Marchlerbauer, A.; Derbyshire, M.K.; Gonzales, N.R.; Lu, S.; Chitsaz, F.; Geer, L.Y.; Geer, R.C.; He, J.; Gwadz, M.; Hurwitz, D.I. CDD: NCBI’s conserved domain database. Nucleic Acids Res. 2015, 43, D222. [Google Scholar] [CrossRef] [PubMed]
  52. Richardson, C.; Jones, P.C.; Barnard, V.; Hebert, C.N.; Terlecki, S.; Wijeratne, W.V. Estimation of the developmental age of the bovine fetus and newborn calf. Vet. Rec. 1990, 126, 279–284. [Google Scholar] [PubMed]
  53. Livak, K.J.; Schmittgen, T.D. Analysis of relative gene expression data using real-time quantitative PCR and the 2(-Delta Delta C(T)) Method. Methods 2001, 25, 402–408. [Google Scholar] [CrossRef] [PubMed]
  54. Denman, A. Molecular cloning: A laboratory manual. Immunology 1983, 49, 411. [Google Scholar]
  55. Gilbert, R.; Bailey, D.; Shannon, N. Linear body measurements of cattle before and after 20 years of selection for postweaning gain when fed two different diets. J. Anim. Sci. 1993, 71, 1712–1720. [Google Scholar] [CrossRef] [PubMed]
  56. Yeh, F.; Yang, R.-C.; Boyle, T. POPGENE Version1. 32, Microsoft Window-Base Software for Population Genetic Analysis: A Quick User’s Guide; University of Alberta, Center for International Forestry Research: Edmonton, AB, Canada, 1999. [Google Scholar]
  57. Nei, M.; Roychoudhury, A. Sampling variances of heterozygosity and genetic distance. Genetics 1974, 76, 379–390. [Google Scholar] [PubMed]
  58. Gui, L.S.; Zhang, Y.R.; Liu, G.Y.; Zan, L.S. Expression of the SIRT2 Gene and Its Relationship with Body Size Traits in Qinchuan Cattle (Bos taurus). Int. J. Mol. Sci. 2015, 16, 2458–2471. [Google Scholar] [CrossRef] [PubMed]
  59. Zhang, Y.R.; Gui, L.S.; Li, Y.K.; Jiang, B.J.; Wang, H.C.; Zhang, Y.Y.; Zan, L.S. Molecular Characterization of Bovine SMO Gene and Effects of Its Genetic Variations on Body Size Traits in Qinchuan Cattle (Bos taurus). Int. J. Mol. Sci. 2015, 16, 16966–16980. [Google Scholar] [CrossRef] [PubMed]
  60. Shi, Y.; He, L. SHEsis, a powerful software platform for analyses of linkage disequilibrium, haplotype construction, and genetic association at polymorphism loci. Am. J. Med. Genet. B 2005, 138b, 143. [Google Scholar] [CrossRef]
Figure 1. Multiple sequence alignment of STAT3 protein across seven species. The degree of similarity is delineated using different background shading, with black being 100%; grey with black text, 80%; grey with white text, 60%; and white, not conserved.
Ijms 19 01035 g001
Figure 2. Phylogenetic tree (Left) and Motif structural analysis (Right) for seven species. Twenty significant motifs were identified. The length of the color block shows the position, strength and significance of a particular motif site. The length of the motif is proportional to the negative logarithm of the p-value of the motif site, truncated at the height for a p-value of 1 × 10⁻¹⁰. These colors are given through motif analysis performed through MEME suit system. The “red line” and “blue triangle” are specifically conserved motif sites for Bos Taurus species.
Ijms 19 01035 g002
Figure 3. Significant STAT3 motifs across the seven tested species, detected using the MEME suite. The different color letters show abbreviation of different amino acids. These colors are given through motif analysis performed through MEME suit system.
Ijms 19 01035 g003
Figure 4. Structure of STAT3 protein domain families in seven species. Each color block is a specific hit representing a different domain superfamily.
Ijms 19 01035 g004
Figure 5. Differential STAT3 mRNA expression across tissues of Qinchuan cattle (n = 3). Double asterisks (**) indicate significant differences between fetal and adult stages (p < 0.01).
Ijms 19 01035 g005
Figure 6. Sequence variants of the STAT3 promoter. Annotations A, B, C, and D represent the five SNP sites and the resultant genotypes.
Ijms 19 01035 g006
Table 1. Genotypes, Minor Allele Frequency, Hardy-Weinberg equilibrium (HWE), He, Ne, and PIC for the five SNPs.
LociGenotype FrequencyAllele FrequencyHWEPICHeNe
SNP1AAACCCAC
0.24050.18330.57620.33210.6679144.60040.34520.44361.7974
SNP2AAAGGGAG
0.28570.14290.57140.35710.6429199.31850.35380.45921.8491
SNP3/4AA/GGAC/AGCC/AAA/GC/A
0.21430.59520.19050.51190.488115.34630.37490.49971.9989
SNP5CCCTTTCT
0.52380.30950.16670.67860.321435.43130.34110.43621.7738
Note: SNP1: −304A>C, SNP2: −285G>A, SNP3: −209A>C, SNP4: −203A>G, SNP5: −188T>C; χ0.052 = 5.991, χ0.012 = 9.21; He: gene heterozygosity; Ne: effective allele numbers; PIC: polymorphism information content.
Table 2. In silico alteration of nucleotides to generate alternative SNP alleles, resulting in putative gain or loss of transcription factor binding sites.
SNPsVariationPredicted Transcription Factor Binding Site
Gain aLoss bTranscription Factor Binding Sequence cScore
SNP1−304A>C-Sp1CCCCC100
SNP2−285G>AAP-2-CCCAGGG100
SNP3−209A>C-MyoDCAGCC100
SNP4−203A>GCP1-ATTGC100
SNP5−188T>C-SRFTTCCTC100
Note: a,b Generated after substitution of allele 1 (wild type) with allele 2 (mutant); c Based on TFSEARCH analysis.
Table 3. Estimated values of linkage equilibrium between five SNPs in Qinchuan cattle.
SNPQC
r2D′
SNP1-SNP20.2110.486
SNP1-SNP30.0720.391
SNP1-SNP40.0600.340
SNP1-SNP50.0520.235
SNP2-SNP30.1490.530
SNP2-SNP40.0910.369
SNP2-SNP40.2760.569
SNP3-SNP40.4521.000
SNP4-SNP50.3320.817
Table 4. Haplotypes and their frequencies in Qinchuan cattle (frequency >0.05 are shown).
HaplotypesSNP1SNP2SNP3SNP4SNP5Frequencies
Hap1AAAAT0.151
Hap2CGAAC0.112
Hap3CGCGC0.332
Table 5. Association of different SNP genotypes with body size traits in Qinchuan cattle.
LociGenotypesBody Size Traits (Mean ± SD)
Body Length (cm)Wither Height (cm)Hip Height (cm)Hip Width (cm)Chest Depth (cm)Chest Circumference (cm)
SNP1AA127.683 ± 1.051117.990 ± 0.623119.119 ± 0.43434.297 ± 0.61759.446 ± 0.729 a155.574 ± 1.775
AC127.753 ± 1.203117.325 ± 0.714119.636 ± 0.49734.260 ± 0.70757.961 ± 0.835152.740 ± 2.033
CC127.839 ± .679116.855 ± 0.403119.326 ± 0.28034.083 ± 0.39957.430 ± 0.471 b154.694 ± 1.147
SNP2AA127.875 ± 0.969118.567 ± 0.564 A119.667 ± 0.41934.833 ± 0.56658.167 ± 0.672155.750 ± 1.641
AG128.667 ± 1.370118.683 ± 0.798 A119.583 ± 0.59333.333 ± 0.80159.333 ± 0.951154.833 ± 2.321
GG127.146 ± 0.685115.833 ± 0.399 B118.500 ± 0.29733.917 ± 0.40057.479 ± 0.475153.583 ± 1.161
SNP3/4AA/AA129.056 ± 1.100119.278 ± 0.656 A,a120.000 ± 0.48234.778 ± 0.64560.222 ± 0.765 A157.556 ± 1.876 a
AC/AG125.984 ± 0.661116.279 ± 0.394 B118.681 ± 0.29033.209 ± 0.388 B56.787 ± 0.460 B152.185 ± 1.128 b
CC/GG130.938 ± 1.167116.938 ± 0.696 b118.938 ± 0.51136.125 ± 0.684 A59.000 ± 0.811157.875 ± 1.990 a
SNP5TT128.143 ± 1.269118.071 ± 0.748 a119.962 ± 0.400 A35.273 ± 0.411 A59.714 ± 0.873 a156.000 ± 1.575
TC127.885 ± 0.931118.038 ± 0.549119.500 ± 0.54533.429 ± 0.72858.692 ± 0.641155.143 ± 2.147
CC127.205 ± 0.716116.114 ± 0.422 b118.250 ± 0.307 B32.462 ± 0.534 B56.932 ± 0.493 b153.182 ± 1.211
Note: Means with different superscripts (A,B and a,b ) are significantly different (p < 0.01 and p < 0.05). All p-values were modified by Bonferroni correction.
Table 6. Associations of haplotype combination with body size traits in Qinchuan cattle.
Haplotype CombinationBody Size Traits (Mean ± SD)
FrequencyBody LengthWither HeightHip Height (cm)Hip Width (cm)Chest Circumference (cm)Chest Depth (cm)
H1H1
(AA-AA-AA-AA-TT)
12% (50)125.600 ± 1.128 B116.700 ± 0.711 A118.500 ± 0.596 a32.600 ± 0.778 B59.200 ± 0.998 A,b152.600 ± 2.243 B
H2H3
(CC-GG-AC-GA-CC)
19% (80)124.125 ± 0.892 B113.750 ± 0.562 B116.563 ± 0.471 B,b33.625 ± 0.615 B55.688 ± 0.789 B146.750 ± 1.773 B
H3H3
(CC-GG-CC-GG-CC)
9% (40)137.625 ± 1.262 A118.625 ± 0.795 A120.125 ± 0.667 A38.250 ± 0.870 A63.250 ± 1.115 A,a167.500 ± 2.507 A
Note: Means with different superscripts (A,B and a,b ) are significantly different (p < 0.01 and p < 0.05). All p-values were modified by Bonferroni correction.
Table 7. Sequences of primer pairs and amplification conditions for RT-qPCR.
ItemFunctionPrimer SequencesTm (C)Production Size
STAT3RT-PCRF: 5-CACTTCTGCCAAGGGAGACT-359.5261 bp
R: 5-CGCGTATGCCCAATCTTGAC-3
β-actinInternal controlF: 5-CACCAACTGGGACGACAT-361202 bp
R: 5-ATACAGGGACAGCACAGC-3
GAPDHInternal controlF: 5-CCAACGTGTCTGTTGTGGAT-36180 bp
R: 5-CTGCTTCACCACCTTCTTGA-3

