Article

Deficiency of Invariant Natural Killer T Cells Does Not Protect Against Obesity but Exacerbates Atherosclerosis in Ldlr−/− Mice

1
Diabetes Obesity Center for Excellence, Division of Metabolism, Endocrinology and Nutrition, University of Washington, 850 Republican Street Box 35805, Seattle, WA 98109, USA
2
Division of Cardiology, University of Washington, Seattle, WA 98195, USA
3
Department of Pathology, University of Chicago, Chicago, IL 60637, USA
*
Author to whom correspondence should be addressed.
Int. J. Mol. Sci. 2018, 19(2), 510; https://doi.org/10.3390/ijms19020510
Submission received: 28 December 2017 / Revised: 27 January 2018 / Accepted: 29 January 2018 / Published: 8 February 2018
(This article belongs to the Special Issue Natural Killer T (NKT) Cells)

Abstract

:
Obesity is a chronic inflammatory state characterized by altered levels of adipose tissue immune cell populations. Natural killer T (NKT) cells are CD1d restricted lymphocyte subsets that recognize lipid antigens whose level decreases in obese adipose tissue. However, studies in mice with deficiency or increased levels of NKT cells have yielded contradictory results, so the exact role of these cells in obesity and adipose tissue inflammation is not yet established. We previously showed that Ldlr−/− mice with excess invariant NKT (iNKT) cells demonstrate significant weight gain, adiposity, metabolic abnormalities, and atherosclerosis. The current study evaluates the effects of NKT cell deficiency on obesity, associated metabolic changes, and atherosclerosis in Jα18−/−Ldlr−/− (lacking iNKT cells) and Cd1d−/−Ldlr−/− (lacking invariant and type II NKT cells) mice, and control mice were fed an obesogenic diet (high fat, sucrose, cholesterol) for 16 weeks. Contrary to expectations, Ja18−/−Ldlr−/− mice gained significantly more weight than Ldlr−/− or Cd1d−/−Ldlr−/− mice, developed hypertriglyceridemia, and had worsened adipose tissue inflammation. All the mice developed insulin resistance and hepatic triglyceride accumulation. Ja18−/−Ldlr−/− mice also had increased atherosclerotic lesion area. Our findings suggest that iNKT cells exacerbates the metabolic, inflammatory, and atherosclerotic features of diet-induced obesity. Further work is required to unravel the paradox of an apparently similar effect of iNKT cell surplus and depletion on obesity.

Graphical Abstract

1. Introduction

Obesity is now well characterized as a chronic inflammatory state with a variety of cellular changes occurring at the level of adipose tissue [1,2,3,4]. Adipose tissue is a dynamic endocrine organ with a distinct collection of immune cells in its stroma that play an important role in maintaining homeostasis. As obesity develops, the levels and function of immune cell types in adipose tissue is altered. This includes increased levels of M1 macrophages, Th1 cells, CD8+ T cells, natural killer cells, and neutrophils, and decreased levels of natural killer T (NKT) cells, M2 macrophages, T and B regulatory cells, and type 2 innate lymphoid (ILC2)cells. The resultant differential cellular activation and milieu of cytokines and other factors are thought to propagate the metabolic dysregulation [5,6].
NKT cells are a specialized subset of T lymphocytes that recognize glycolipid antigens presented by the major histocompatibility complex (MHC) class I-like molecule CD1d [7,8,9,10]. The most abundant NKT cells are designated type I or invariant NKT cells (iNKT). They express semi-invariant T cell receptor α-(TCRα) chains coupled with a limited repertoire of TCRβ chains. In mice, the TCRα on iNKT cells is Vα14-Jα18. A less abundant population of NKT cells are designed type II NKT cells. They express more diverse TCRs, and hence no specific surface marker for these cells currently exists; these cells are designated type II NKT cells. Both cell types are CD1d restricted, and recognize lipid antigens loaded onto CD1d on the surface of antigen presenting cells (macrophages and dendritic cells). CD1d is also expressed on the surface of epithelial cells, such as adipocytes, which are also thought to activate iNKT cells [11,12]. The differences in surface T cell receptors can be employed to distinguish effects of iNKT cells from type II NKT cells. Thus, while mice lacking the CD1d molecule are deficient in both types of NKT cells, mice lacking the Jα18 chain of the T cell receptor are selectively deficient in iNKT cells.
The precise nature of lipid antigens recognized by NKT cells remains unclear, and is an area of intense investigation [13,14]. The first lipid identified as an antigen for iNKT cells was α-galactosylceramide (αGalCer), which remains the most potent activator of iNKT cells. Several microbial lipid ligands have been recently identified; however, the search for physiologically relevant lipids from pathogens or endogenous sources recognized by iNKT cells continues. The ligands for type II NKT cells are thus far even less well understood [15].
In both mice and humans, visceral adipose tissue is enriched in iNKT cells where they represent about 20% of total T cells [16]. Several groups, including ours, have demonstrated that iNKT cell numbers decrease in adipose tissue as obesity develops in mice fed a high fat diet [11,16,17,18,19]. Similar changes are also observed in adipose tissue from obese subjects [11,16,18]. iNKT cells are found in many tissues, and are heterogeneous in their phenotypes. Adipose tissue iNKT cells are distinguished from those in other tissues, such as the liver and spleen, in that they do not express the transcription factor promyelocytic leukemia zinc finger (PLZF) [20]. By contrast, they express the transcription factor E4BP4, which drives the expression of IL-10. The iNKT cells of the adipose tissue (NKT10) have some of the characteristics of regulatory cells, though they do not express Foxp3 [21].
To study the contribution of NKT cells to obesity, several groups have utilized the available models of NKT cell deficiency, namely Ja18−/− and Cd1d−/− mice [11,16,19,22,23,24,25,26,27]. These deficient models, when fed a high fat diet generally, though not in all reports, develop more profound obesity and associated metabolic changes than their wild type controls [28]. The rescue of the obesity and metabolic phenotype by the adoptive transfer of purified hepatic iNKT cells into obese mice supports the importance of iNKT cells in protecting against the obesity induced metabolic phenotype [16]. Discrepancies in results that have been observed among various research groups are likely attributable to differences in the age of animals, diets utilized, and environmental factors. Differences in the phenotype of Ja18−/− and Cd1d−/− mice could represent a measure of the effects of type II NKT cells.
In most studies, obesity is induced with a high fat diet without supplementary dietary cholesterol, and in animals expressing the low density lipoprotein receptor (LDLR), a cell surface protein responsible for the high affinity uptake of plasma LDL. The feeding of an obesogenic diet (high fat, high sucrose) supplemented with additional cholesterol (HFHSC) to mice in the LDLR deficient (Ldlr−/−) background results in much more profound hyperlipidemia than in wild type mice, and enables the simultaneous evaluation of obesity and atherosclerosis [29]. We recently reported that the presence of an increased complement of iNKT cells in Vα14 transgenic mice on an Ldlr−/− background (Vα14tg Ldlr−/−) that were fed the HFHSC diet did not protect against diet-induced obesity, and in fact resulted in increased weight gain, insulin resistance, and aortic atherosclerosis [17]. In the current study, we fed this diet to Ldlr−/− mice lacking only iNKT cells (Ja18−/−Ldlr−/−) or lacking both NKT cells subsets (Cd1d−/−Ldlr−/−), and show that both, but especially the former, are more obese than the control Ldlr−/−mice. The Ja18−/−Ldlr−/− mice also exhibit more atherosclerosis than control mice. Thus, iNKT cell deficient mice are also not protected against diet-induced obesity or atherosclerosis.

2. Results

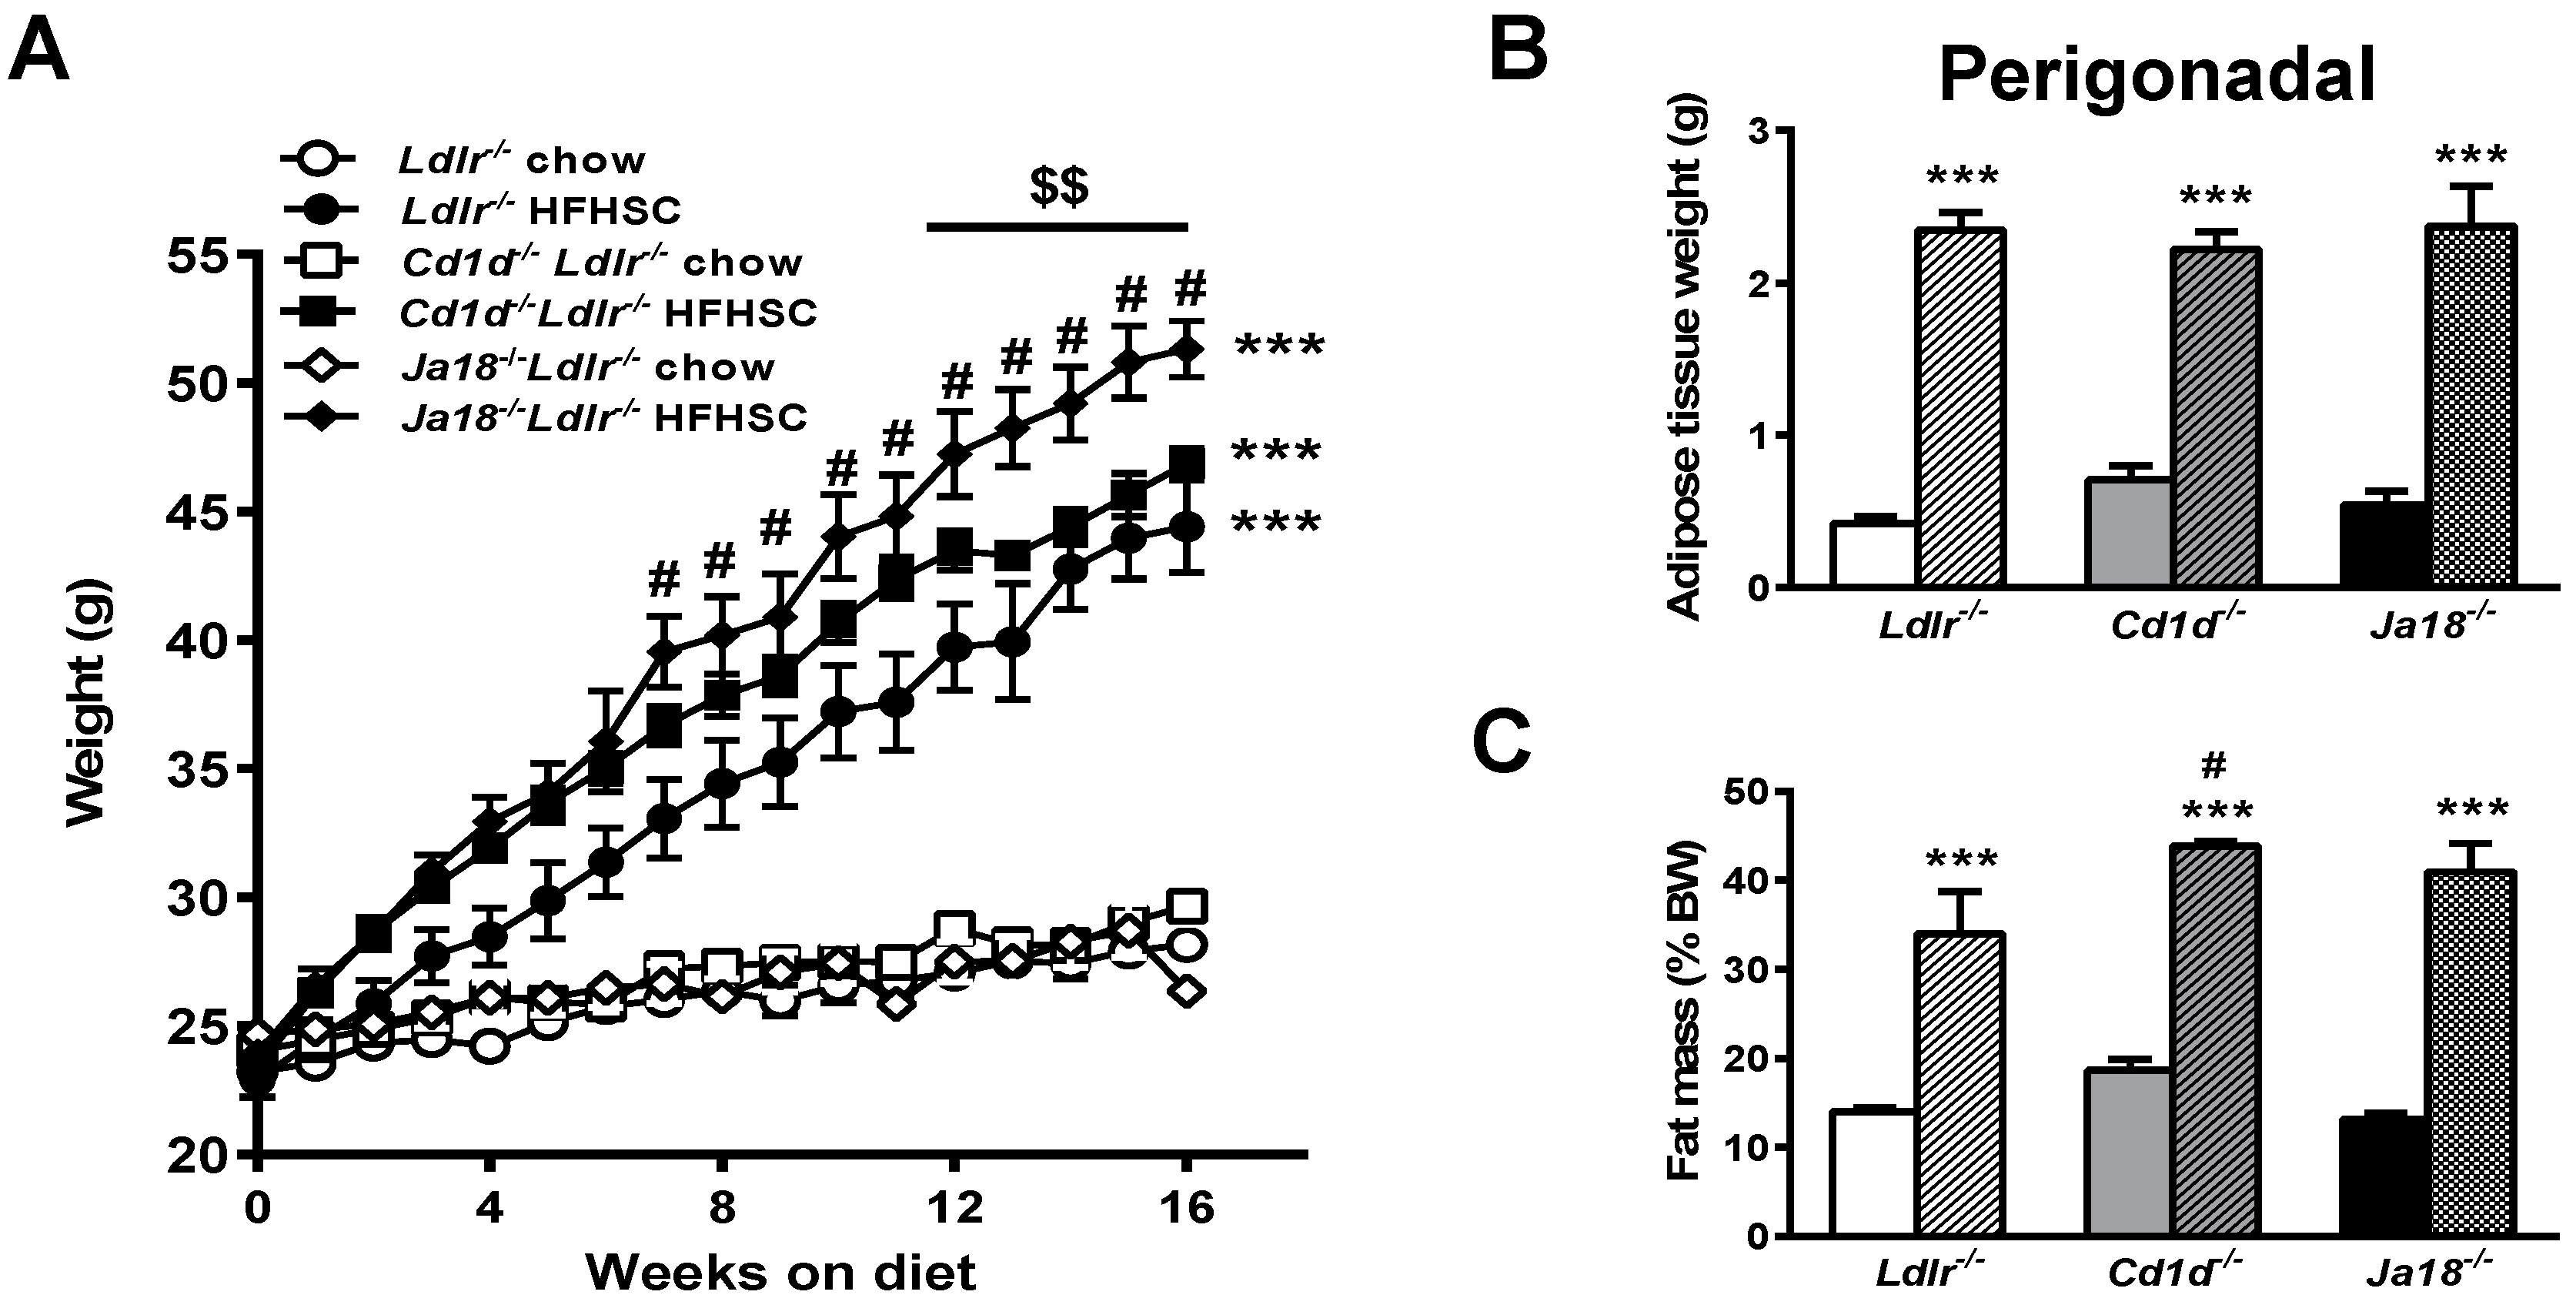
2.1. Natural Killer T (NKT) Cell Deficiency Is Associated with Weight Gain in Ldlr−/− Mice on a High Fat, High Sucrose Cholesterol Enriched (HFHSC) Diet

We have previously shown that iNKT cell numbers are reduced in Ldlr−/− mice fed a high fat, high sucrose cholesterol enriched (HFHSC) diet [17]. To evaluate the effects of NKT cell deficiency in obesity associated metabolic derangements, we utilized a loss of function approach using iNKT cell deficient Ja18−/−Ldlr−/− and both iNKT cell and type II NKT cell deficient Cd1d−/−Ldlr−/− mice. The mice were placed on standard chow or HFHSC diet for 16 weeks. Ldlr−/− mice fed a HFHSC diet develop obesity, hyperinsulinemia, hyperlipidemia, and significant atherosclerosis [29]. No differences in body weight or adiposity were observed among chow-fed animals of any group (Figure 1A); however, when challenged with the HFHSC diet, weight gain was significantly higher in Ja18−/−Ldlr−/− mice compared to Cd1d−/−Ldlr−/− as well as control Ldlr−/− mice (p < 0.001, Figure 1A). Food intake was equivalent between the HFHSC diet groups. There were no significant differences in the perigonadal (intra-abdominal) fat pad weights between the obese NKT cell deficient mice and Ldlr−/− control mice (Figure 1B), suggesting an increase in other fat depots. While body composition analysis revealed increased generalized body fat distribution in all groups fed the HFHSC diet (Figure 1C), the Cd1d−/−Ldlr−/− mice had relatively more body fat than did the Ldlr−/− mice and the proportion of fat mass in the Ja18−/−Ldlr−/− mice trended in the same direction (p = 0.1). No differences in lean body mass were observed between the obese groups (S. Subramanian, University of Washington, Seattle, WA, USA, 2015) (not shown). Thus, the absence of NKT cells does not prevent weight gain in Ldlr−/− mice fed the HFHSC diet.

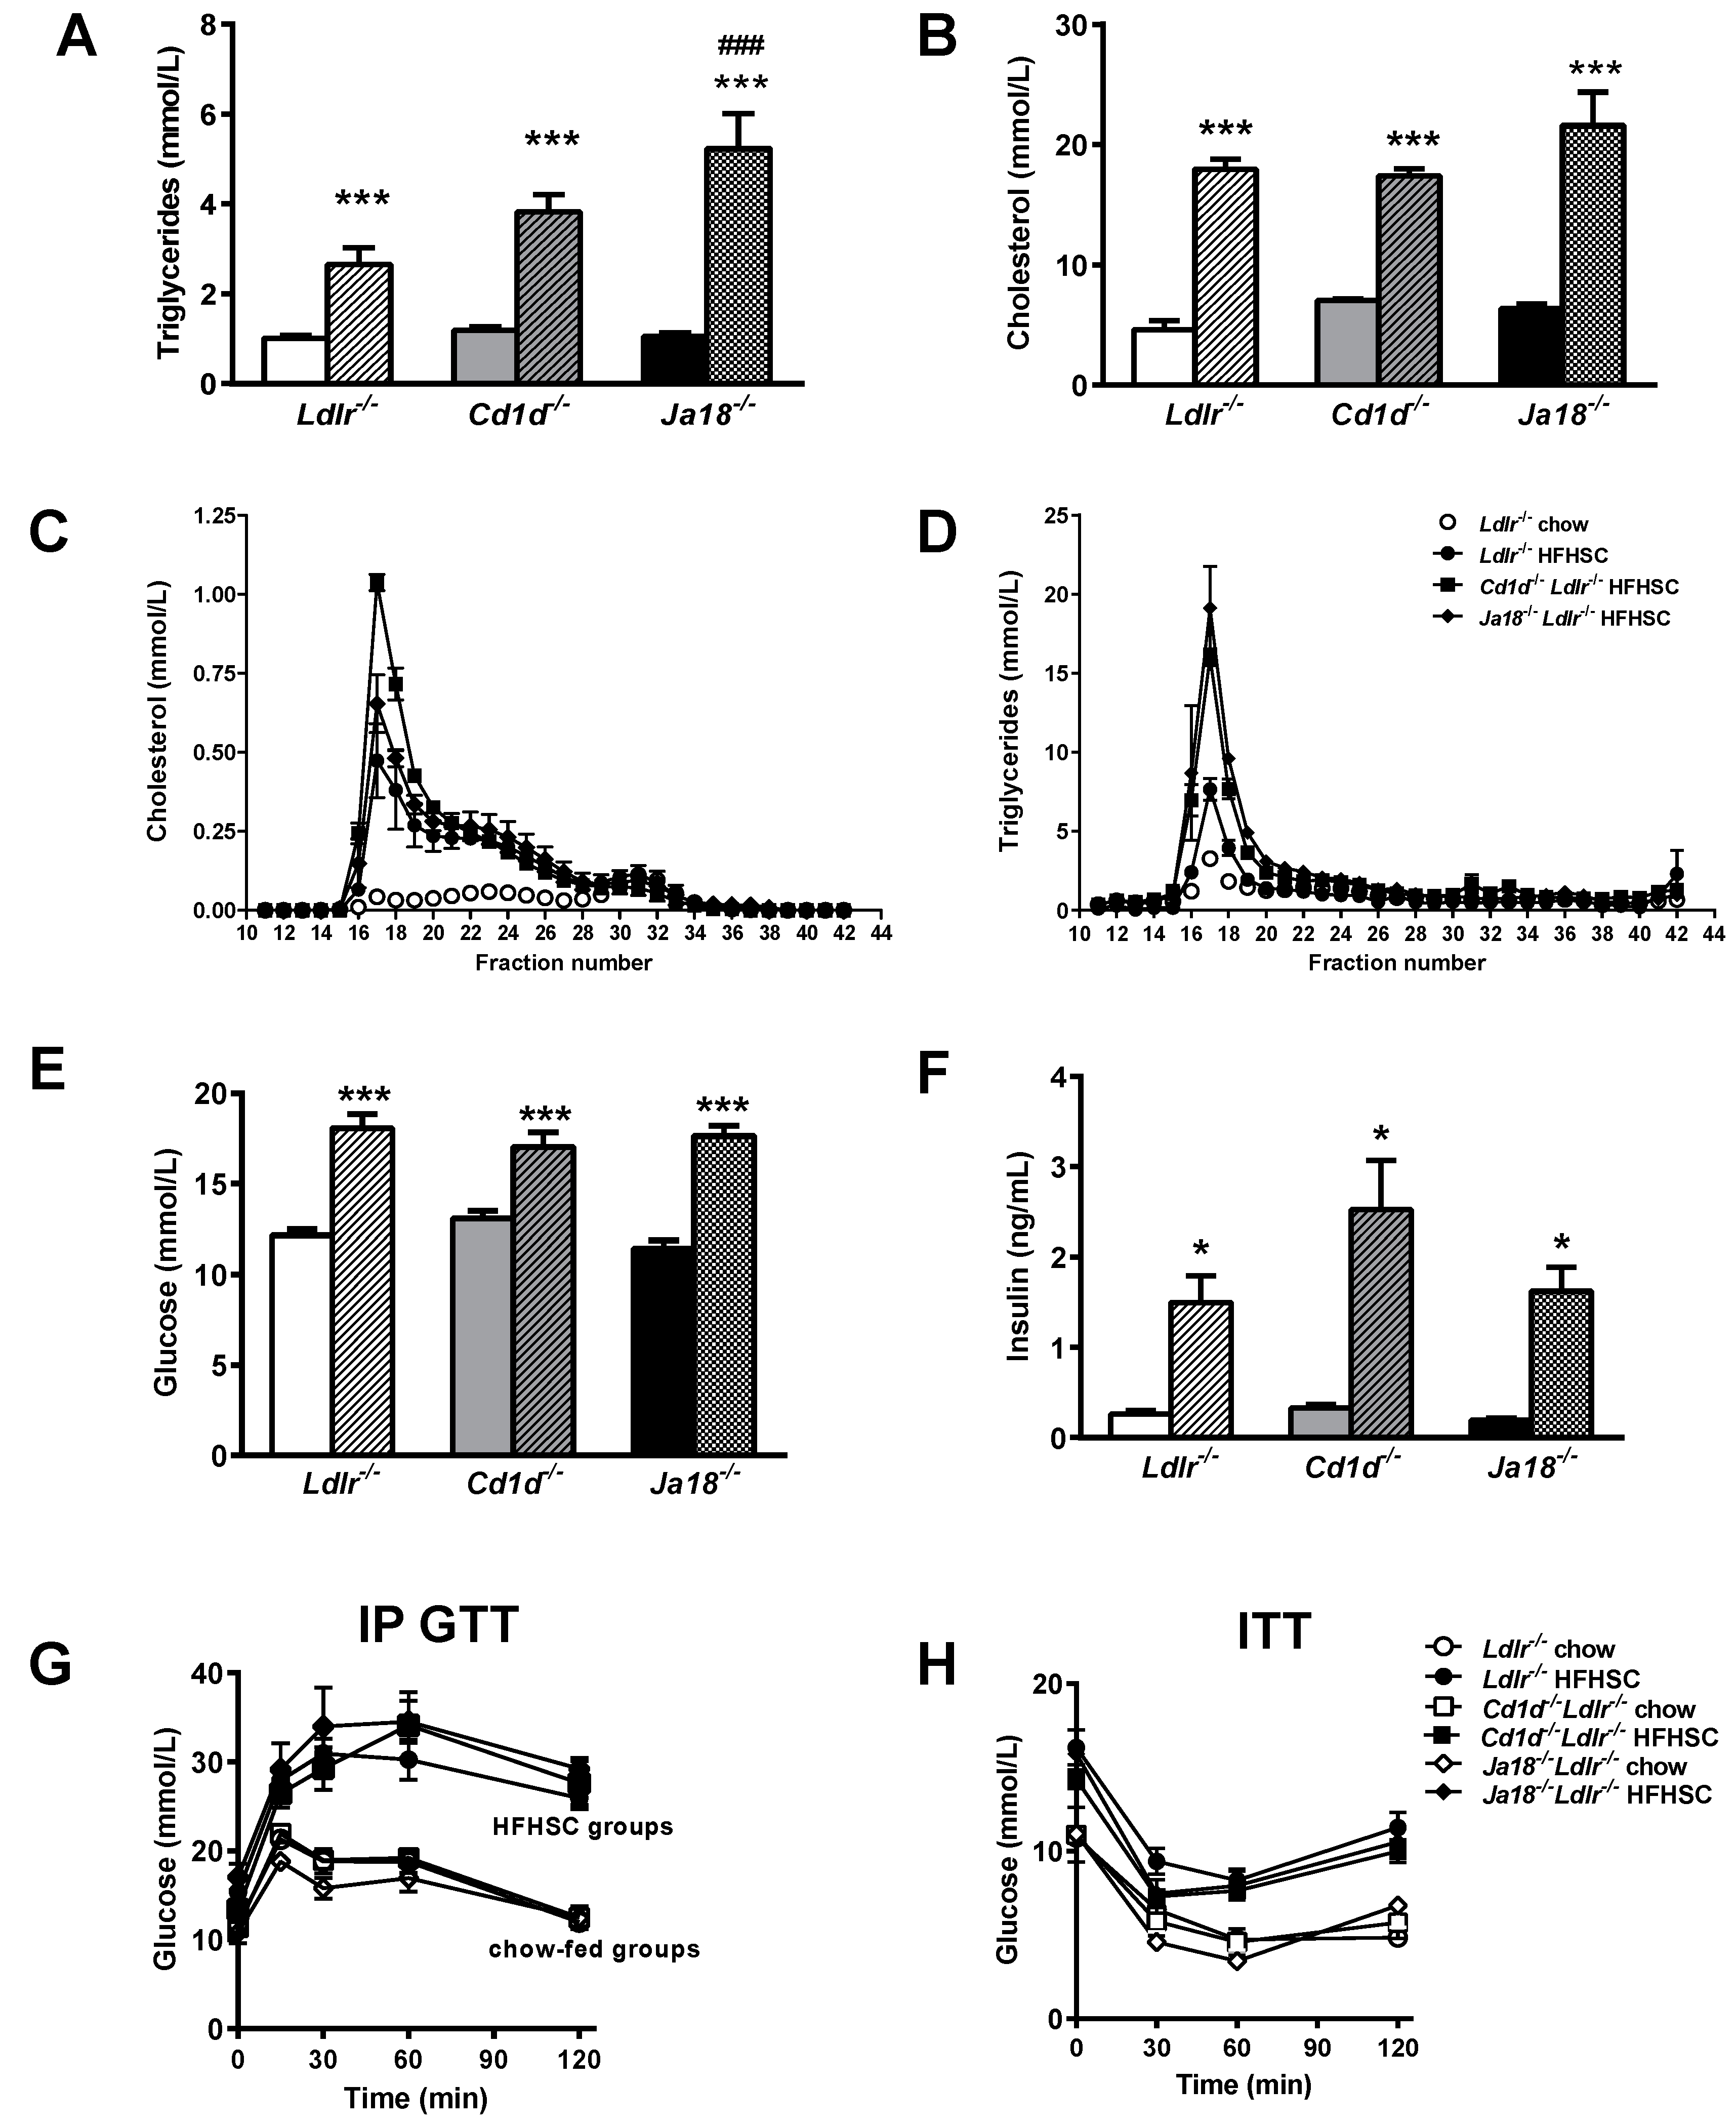
2.2. Obesity-Induced Metabolic Abnormalities Are Observed in the Presence and Absence of NKT Cells

Hypercholesterolemia and hypertriglyceridemia developed in all groups of mice on the HFHSC diet. However, hypertriglyceridemia was amplified in Ja18−/−Ldlr−/− mice, while plasma cholesterol levels were equivalently elevated in all three groups of obese mice (Figure 2A,B). Lipoprotein profiles showed increased VLDL/IDL particles in the HFHSC-fed Ja18−/−Ldlr−/− and Cd1d−/−Ldlr−/− mice (Figure 2C,D). Fasting hyperglycemia and hyperinsulinemia was observed in all three groups of mice on HFHSC feeding (Figure 2E,F). No differences were observed on glucose or insulin tolerance testing (Figure 2G,H). No differences in lipids or insulin sensitivity were observed in the lean chow-fed animals across the three groups. Thus, the metabolic abnormalities associated with obesity are not improved by the absence of NKT cells.

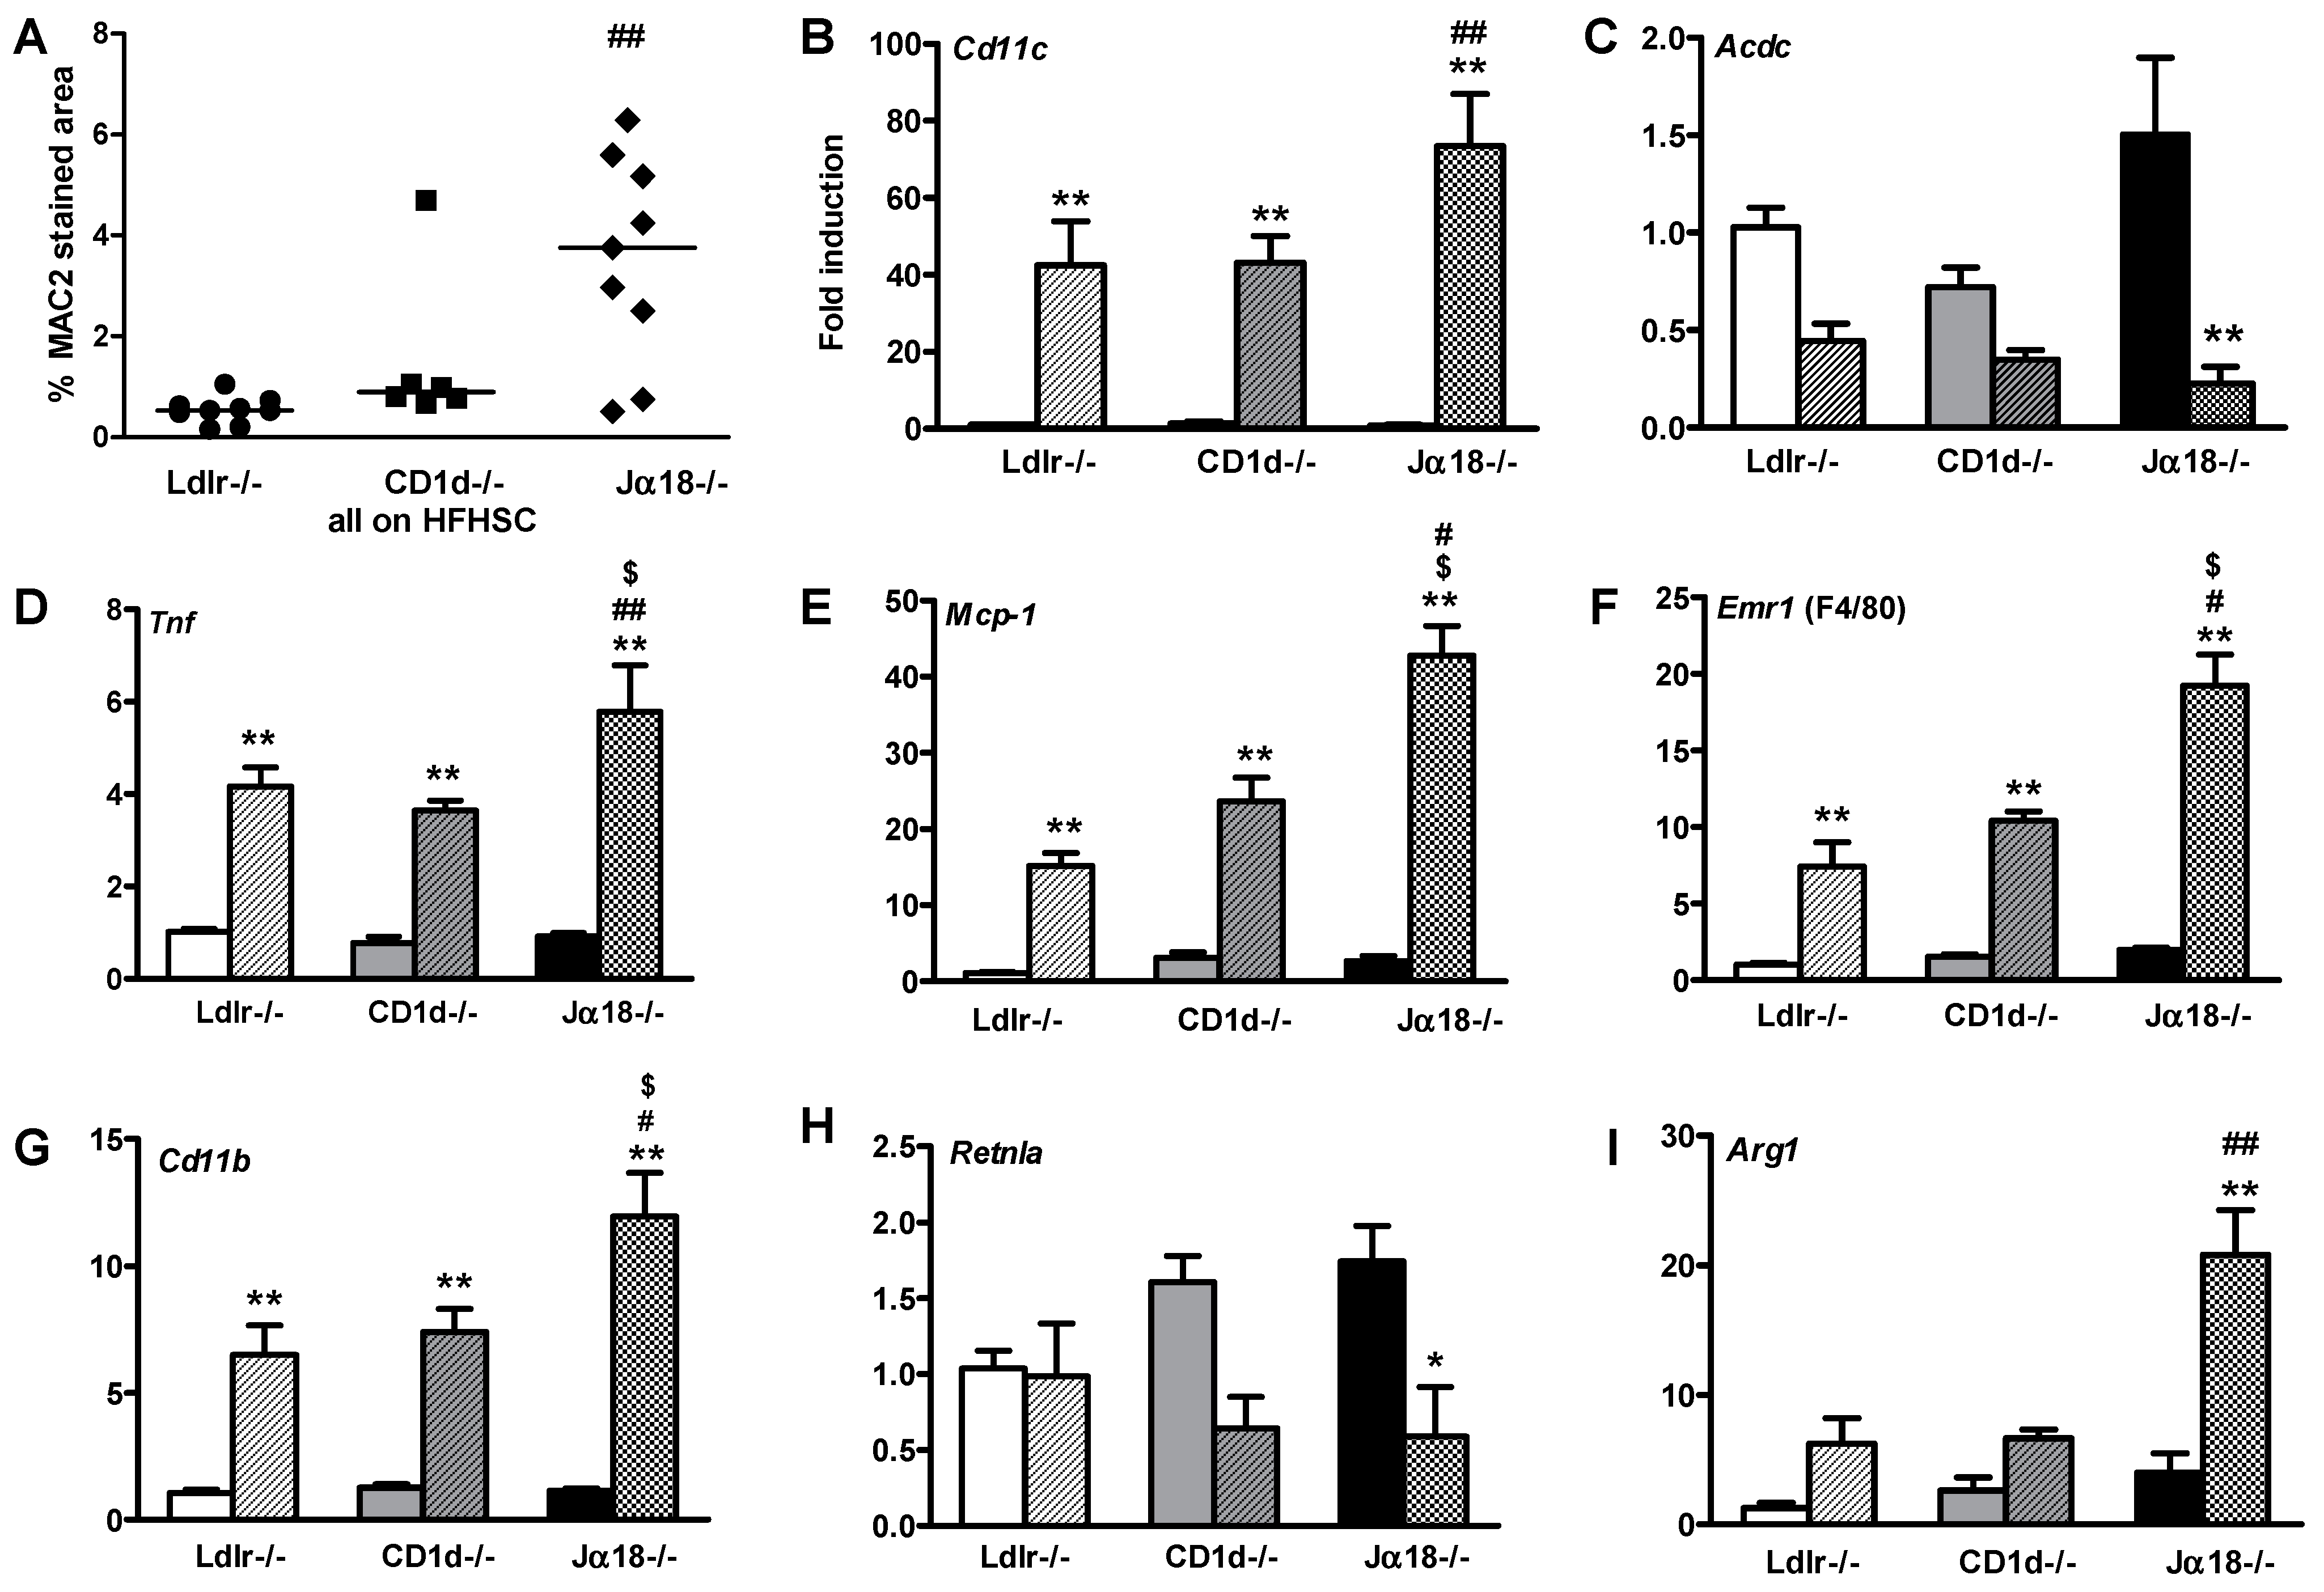
2.3. Adipose Tissue Inflammation Is Worsened in Obese Ja18−/−Ldlr−/− Mice Devoid of iNKT Cells

Since activated iNKT cells interact with tissue macrophages [28], we examined whether the absence of iNKT cells influences the macrophage content and inflammatory state of adipose tissue. Obese Ja18−/−Ldlr−/− mice accumulated more macrophages in perigonadal (intra-abdominal) adipose tissue compared to controls, as demonstrated by increased immunostaining for the macrophage specific protein Mac2 (p < 0.01, Figure 3A). In addition, the expression of Cd11c, which is found on macrophages and other immune cells, such as dendritic cells and natural killer cells, is also increased (Figure 3B). Analysis of gene expression in whole adipose tissue revealed that obese Ja18−/−Ldlr−/− mice had significantly reduced expression of adiponectin and increased Tnfa, compared to their lean counterparts (Figure 3C,D). The obese Ja18−/−Ldlr−/− mice also showed increased expression of the monocyte chemotactic factor 1 (Mcp1) gene (Figure 3E) and macrophage specific genes, such as Emr1 (F4/80) and Cd11b (Figure 3F,G), when compared to control Ldlr−/− and Cd1d−/−Ldlr−/− mice. Overall, the accumulated macrophages showed a phenotype of pro-inflammatory M1 activation, as evidenced by increased Tnfα expression with decreased expression of Retnla (Figure 3H), an anti-inflammatory activation M2 marker. However, Arg1, a M2 activation marker, is increased in the adipose tissue from the obese Ja18−/−Ldlr−/− mice (Figure 3I). Taken together, these findings indicate an increase in adipose inflammatory changes in obese Ja18−/−Ldlr−/− mice lacking iNKT cells.

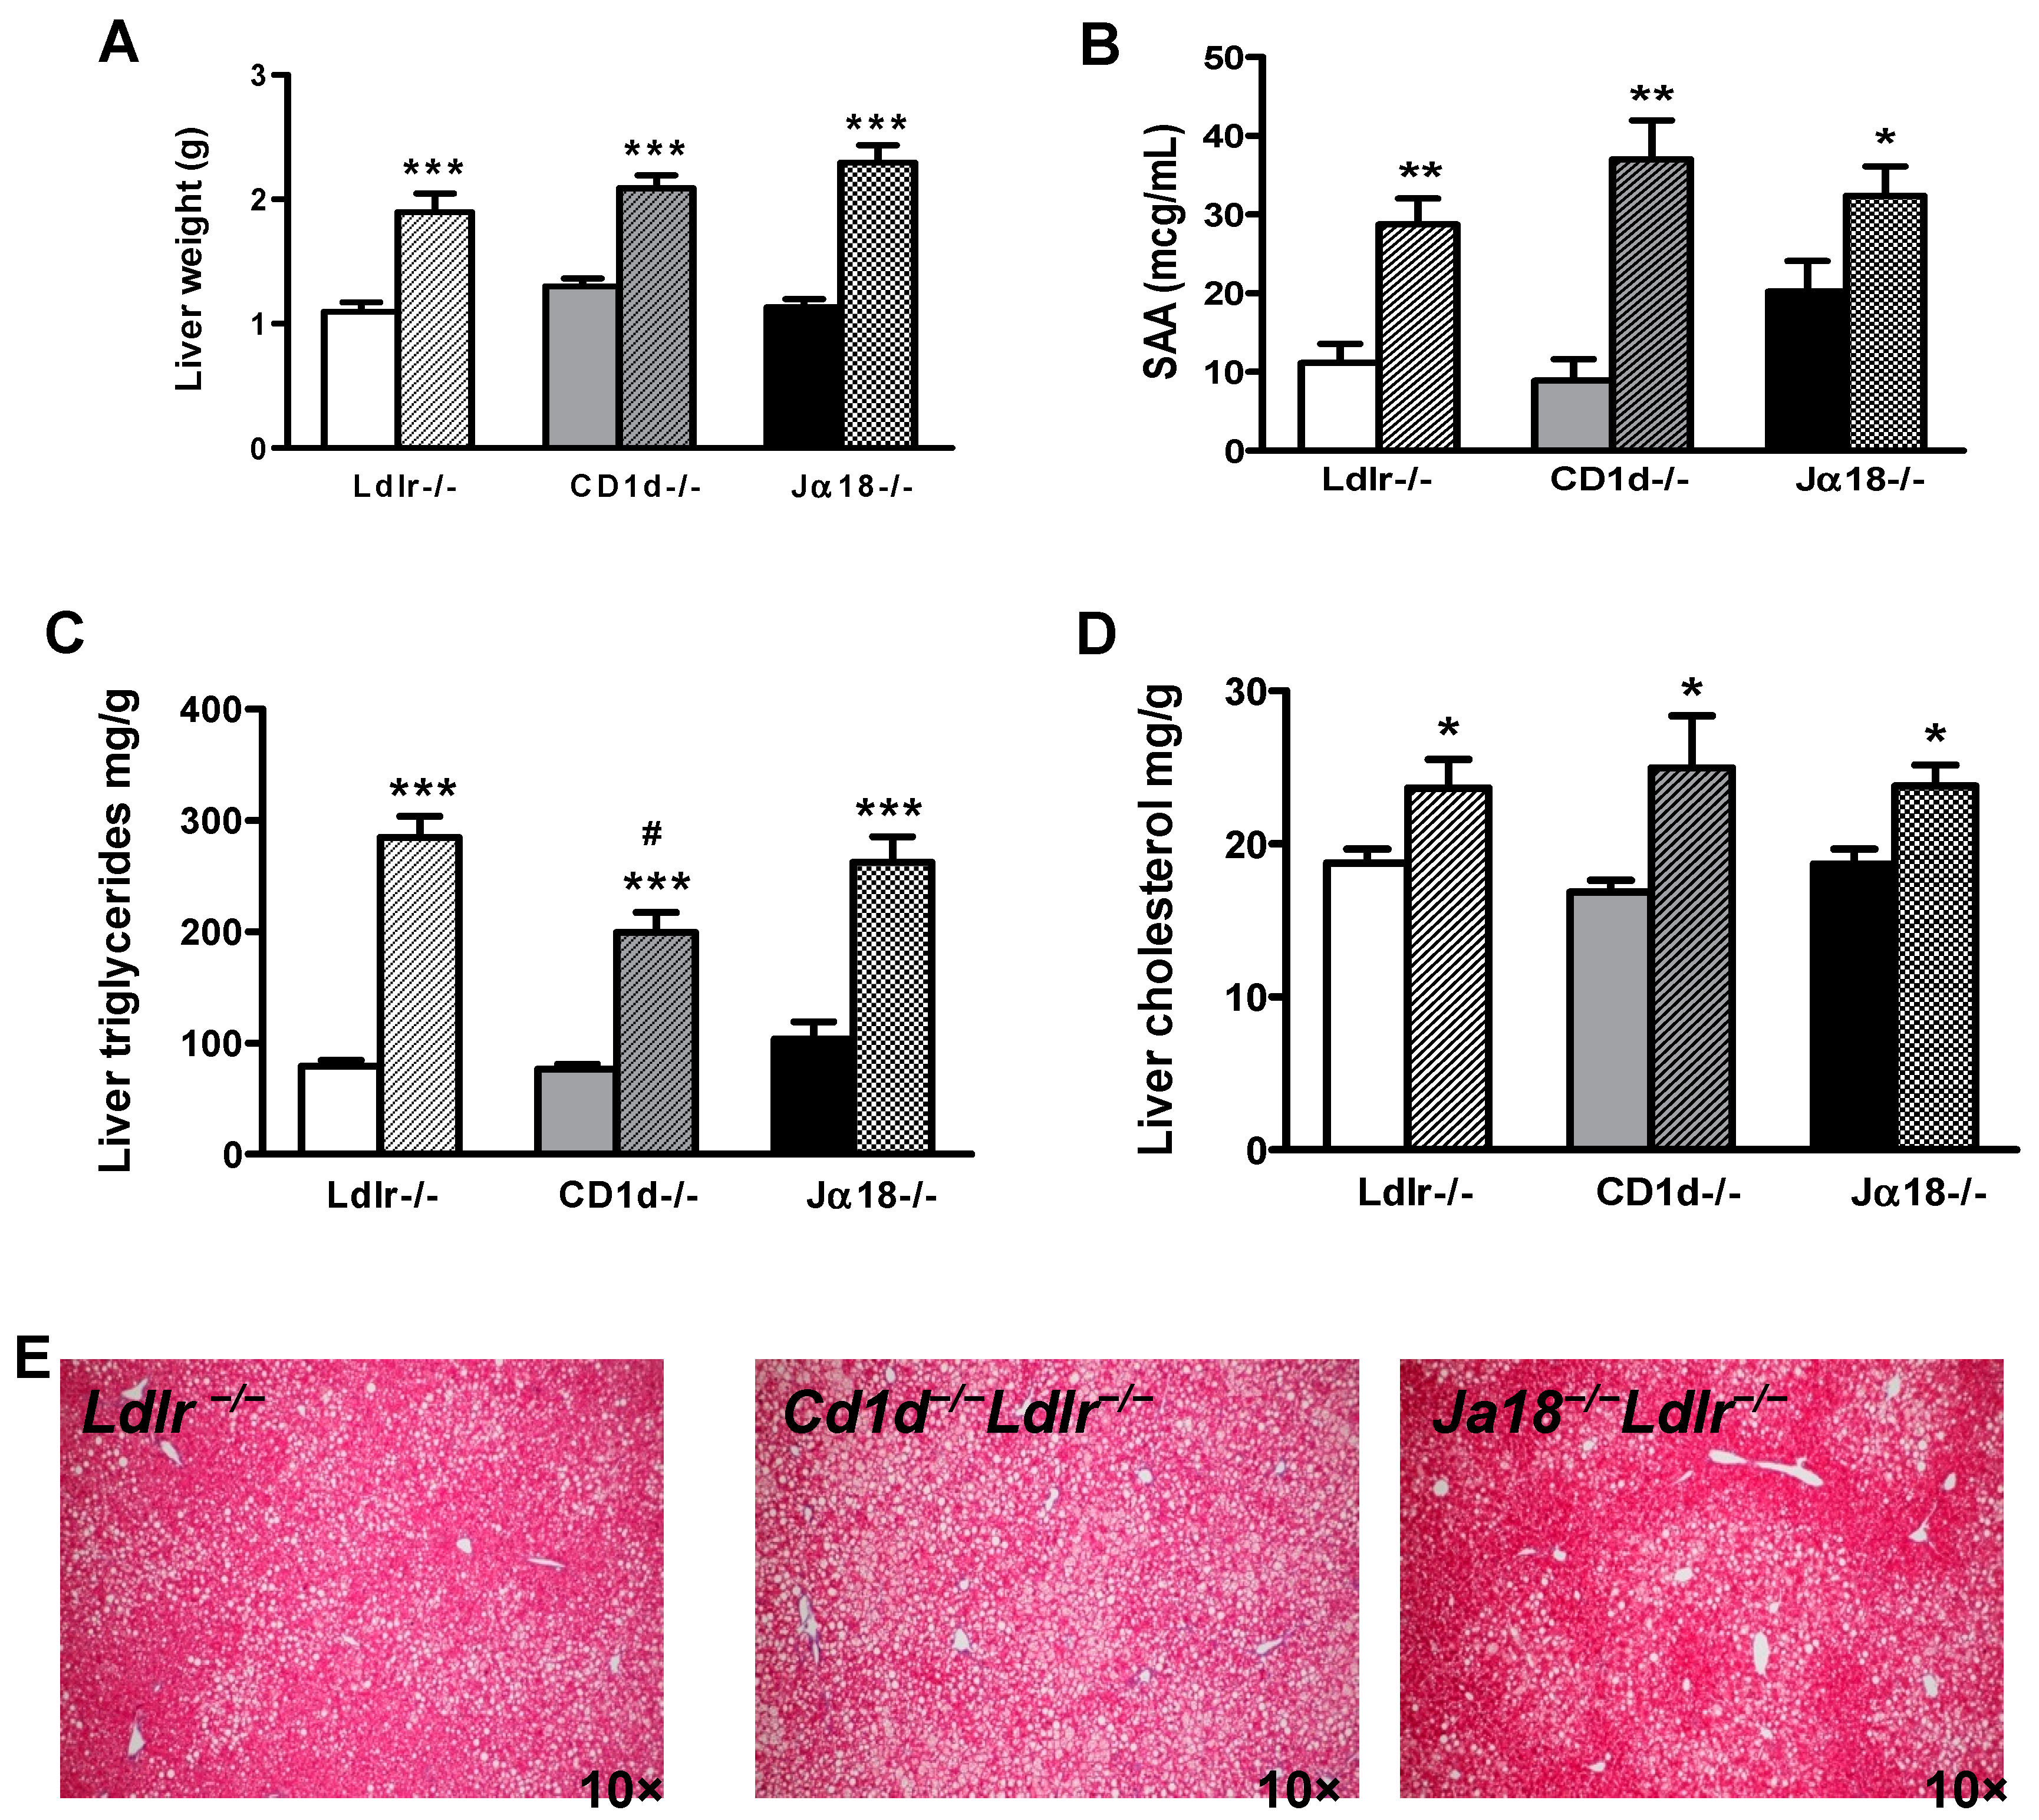
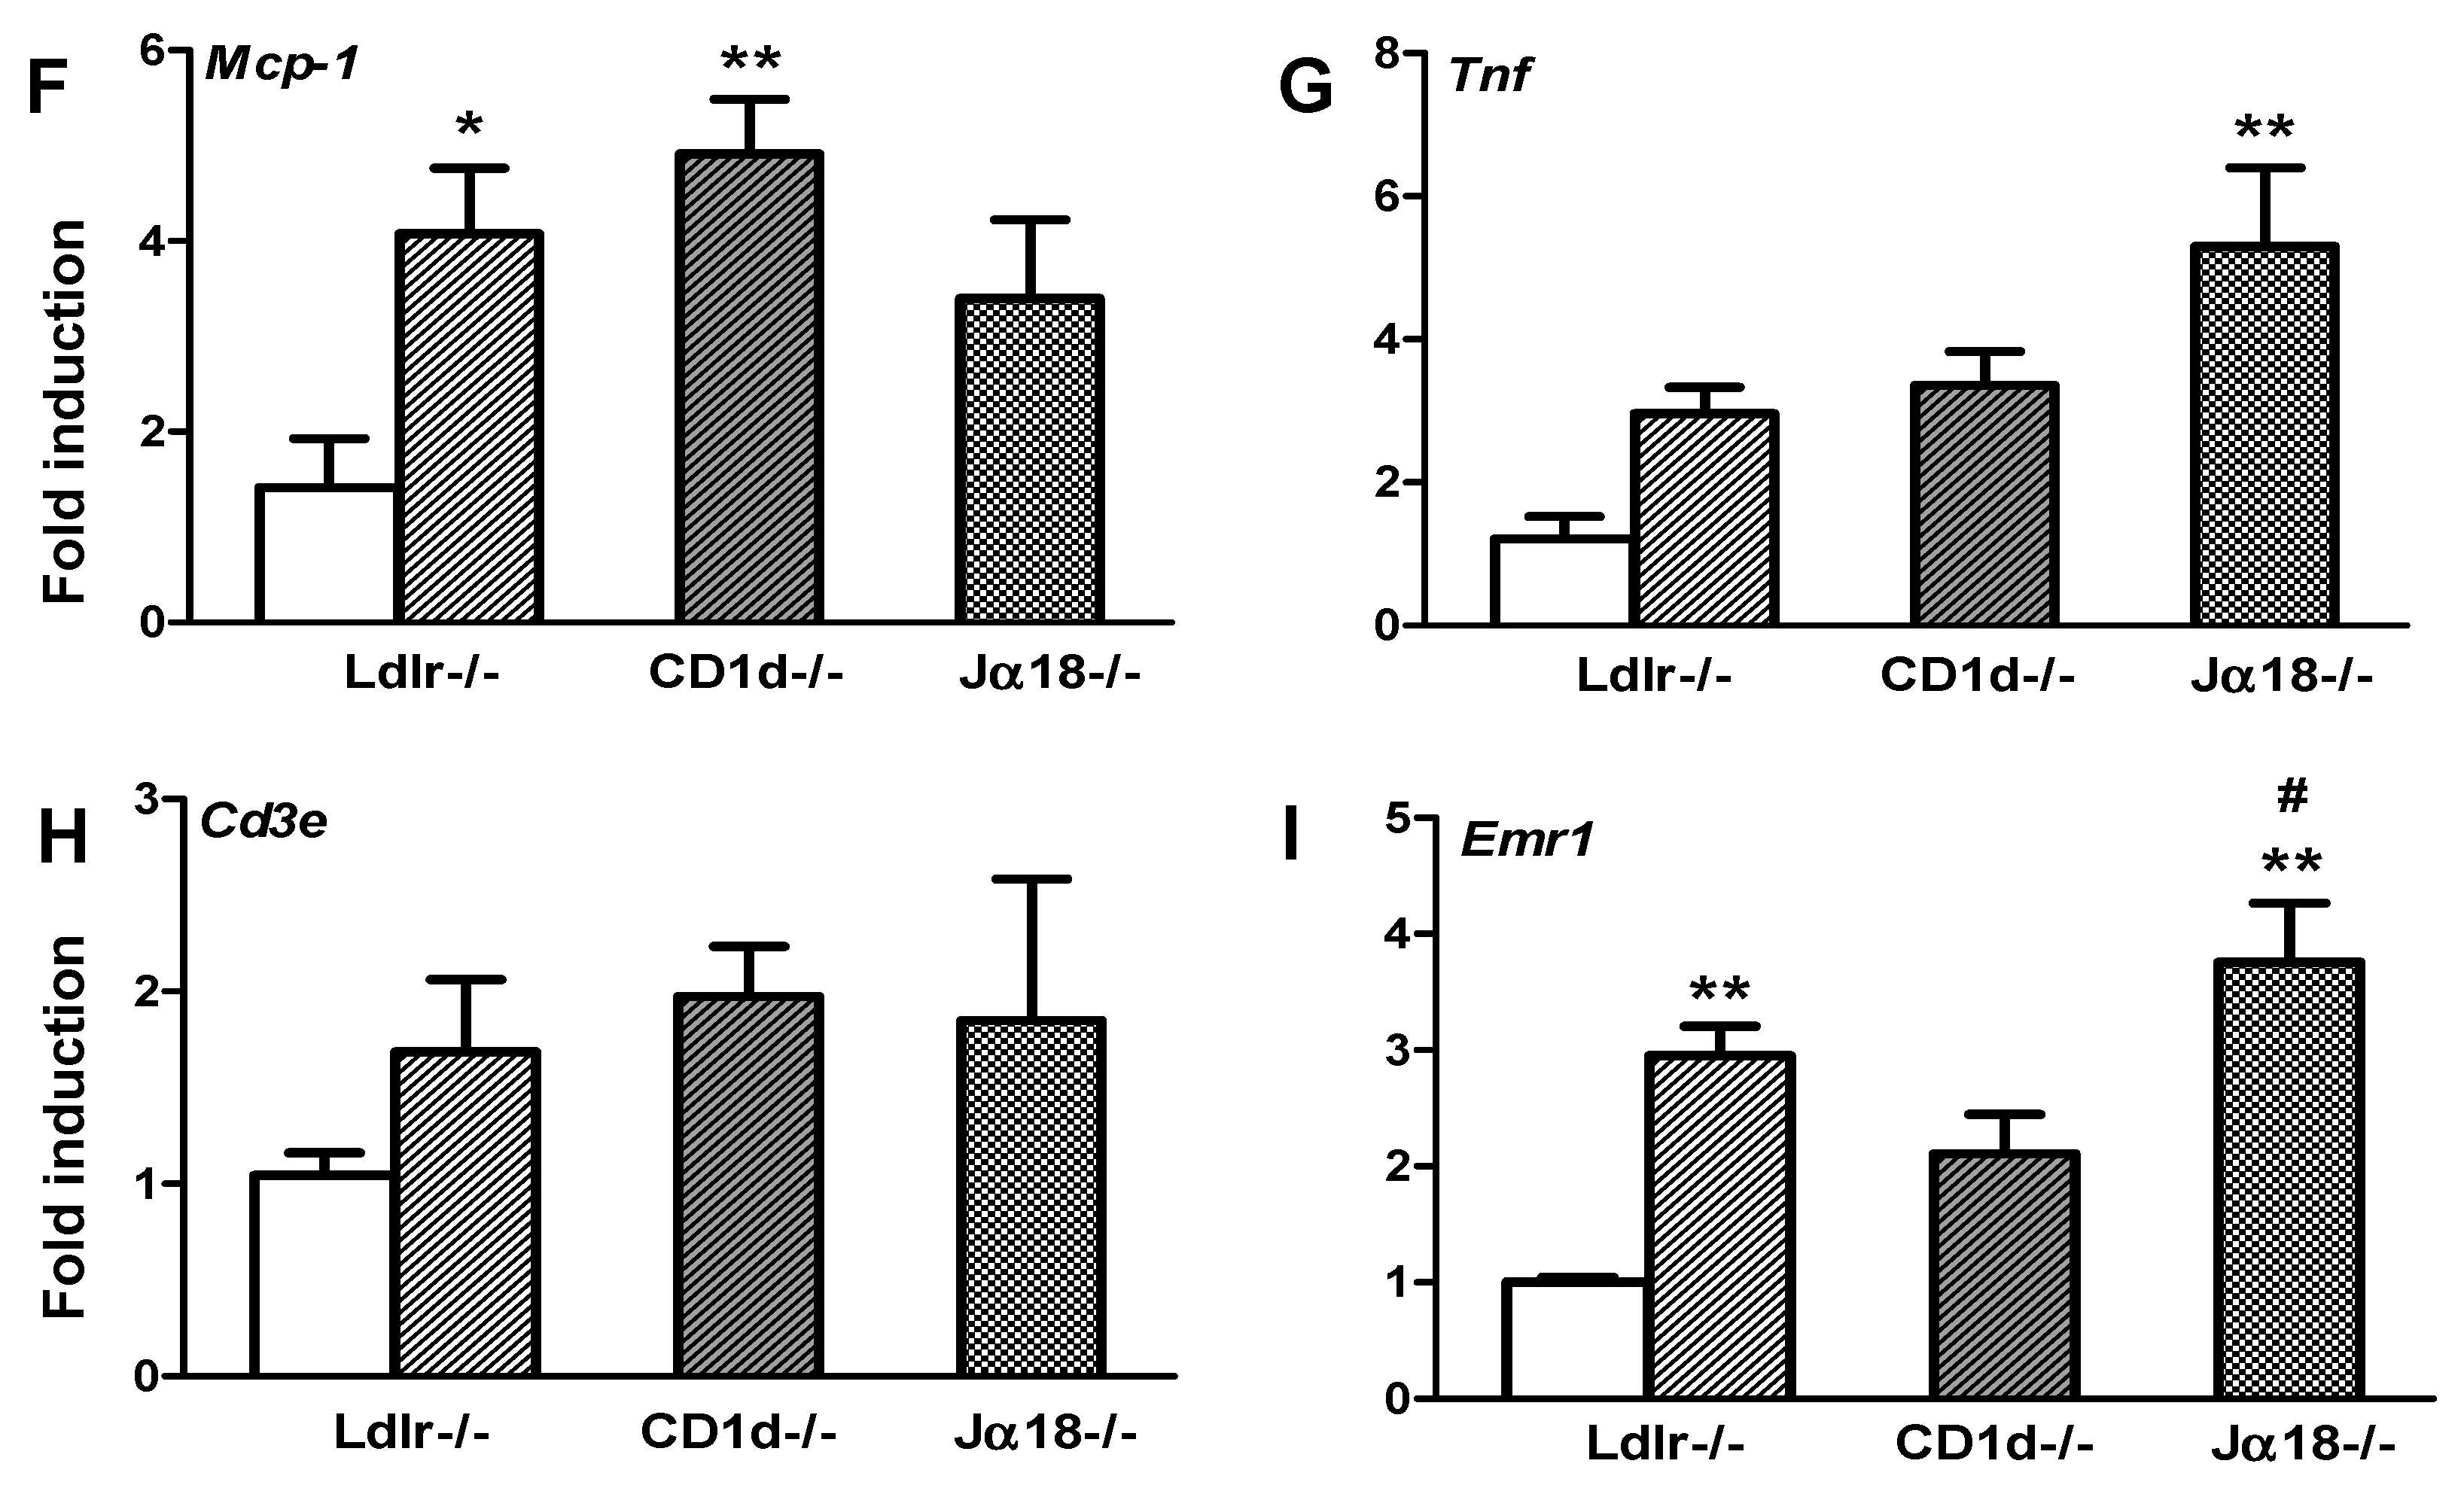
2.4. Hepatic Steatosis Is Observed in Obese Mice in the Presence and Absence of iNKT Cells

Changes in the liver lipid homeostasis are frequently seen with the feeding of a high fat diet. Since lipid sensing iNKT cells are highly enriched in the hepatic lymphocyte pool, we evaluated whether lack of iNKT cells can improve hepatic steatosis and inflammation. As with the adipose tissue, liver weights were higher in obese than in lean animals, but were not different between the three groups of mice (Figure 4A). Plasma circulating SAA levels, an inflammatory marker derived from the liver, were increased in all groups of obese mice (Figure 4B), with the levels being highest in the Cd1d−/−Ldlr−/− mice. Hepatic triglyceride content was increased in all mice on HFHSC diet relative to chow-fed animals, but was lower in the obese Cd1d−/−Ldlr−/− mice than the obese Ldlr−/− mice (Figure 4C). Hepatic cholesterol levels were higher in the HFHSC diets in each group compared to chow-fed controls (p < 0.05, Figure 4D). Evidence of hepatic steatosis was observed in all obese groups of mice (Figure 4E). Increased expression of the macrophage specific gene Emr1 (encoding F4/80) with evidence of pro-inflammatory activation (Tnfα) was primarily observed in the obese Ja18−/−Ldlr−/− mice (p < 0.01, Figure 4F–I).

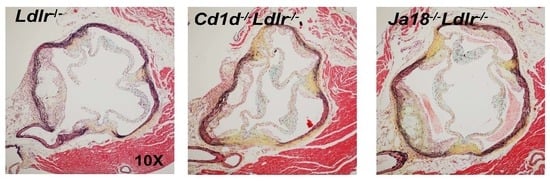
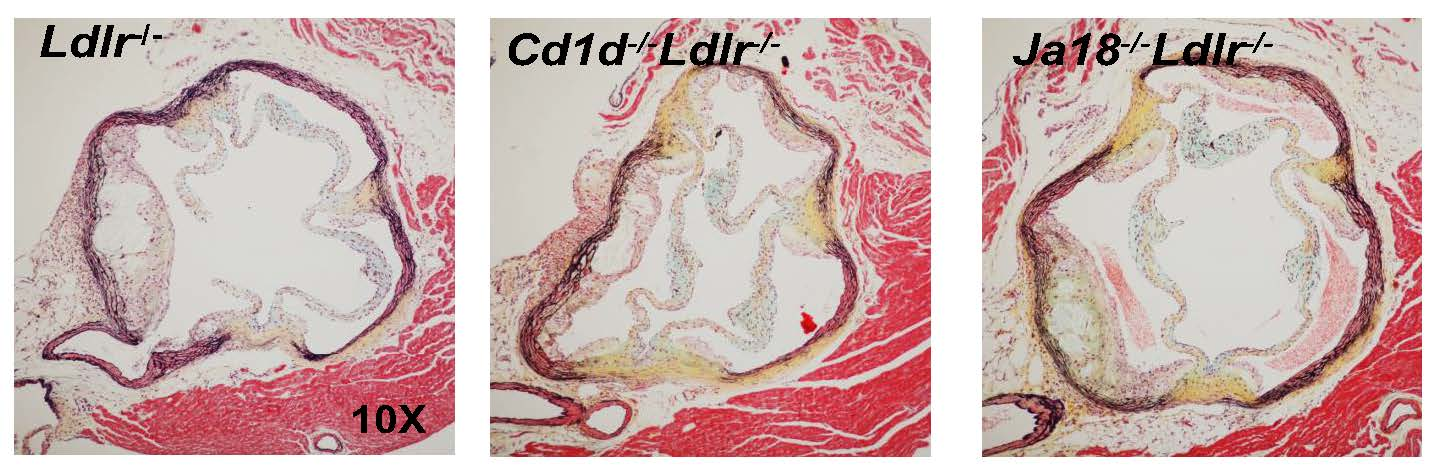
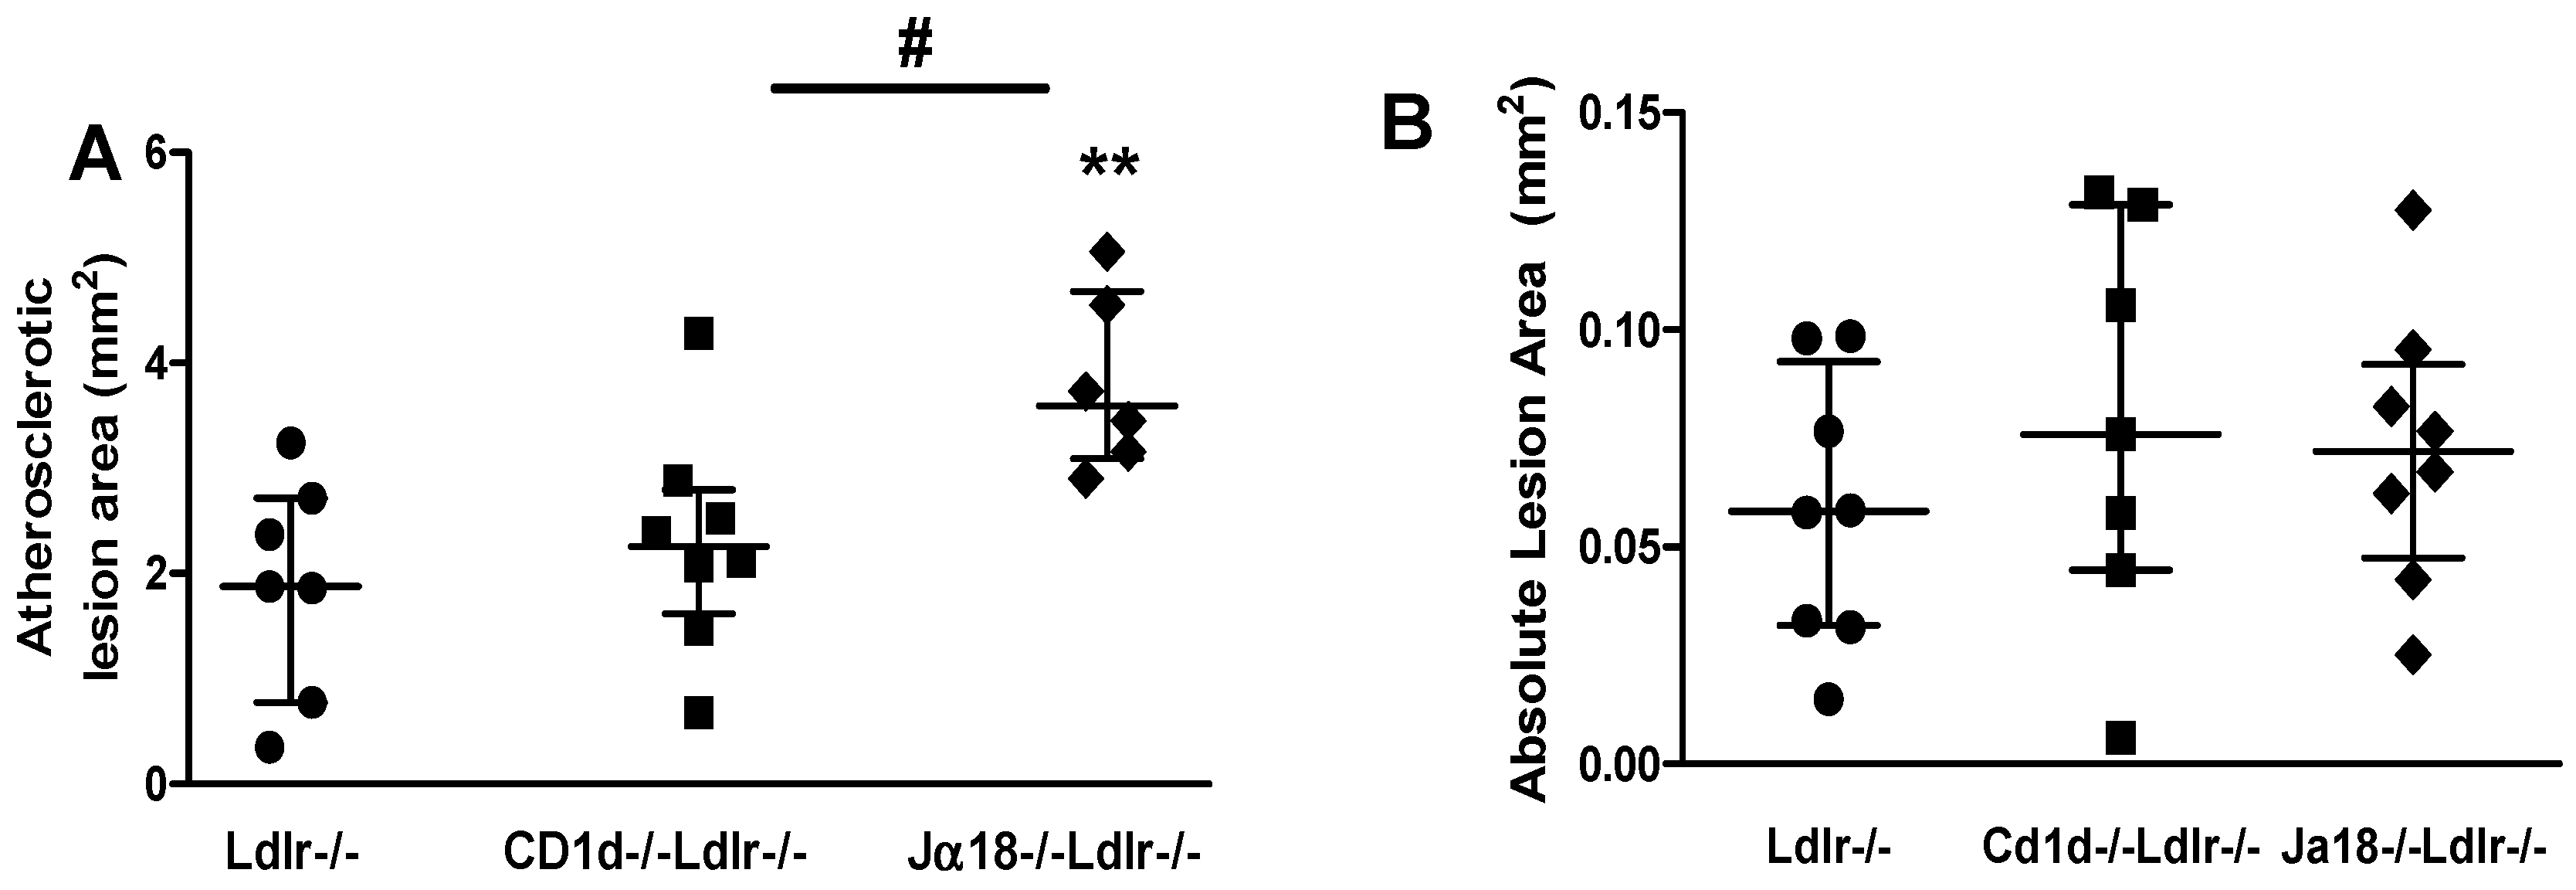
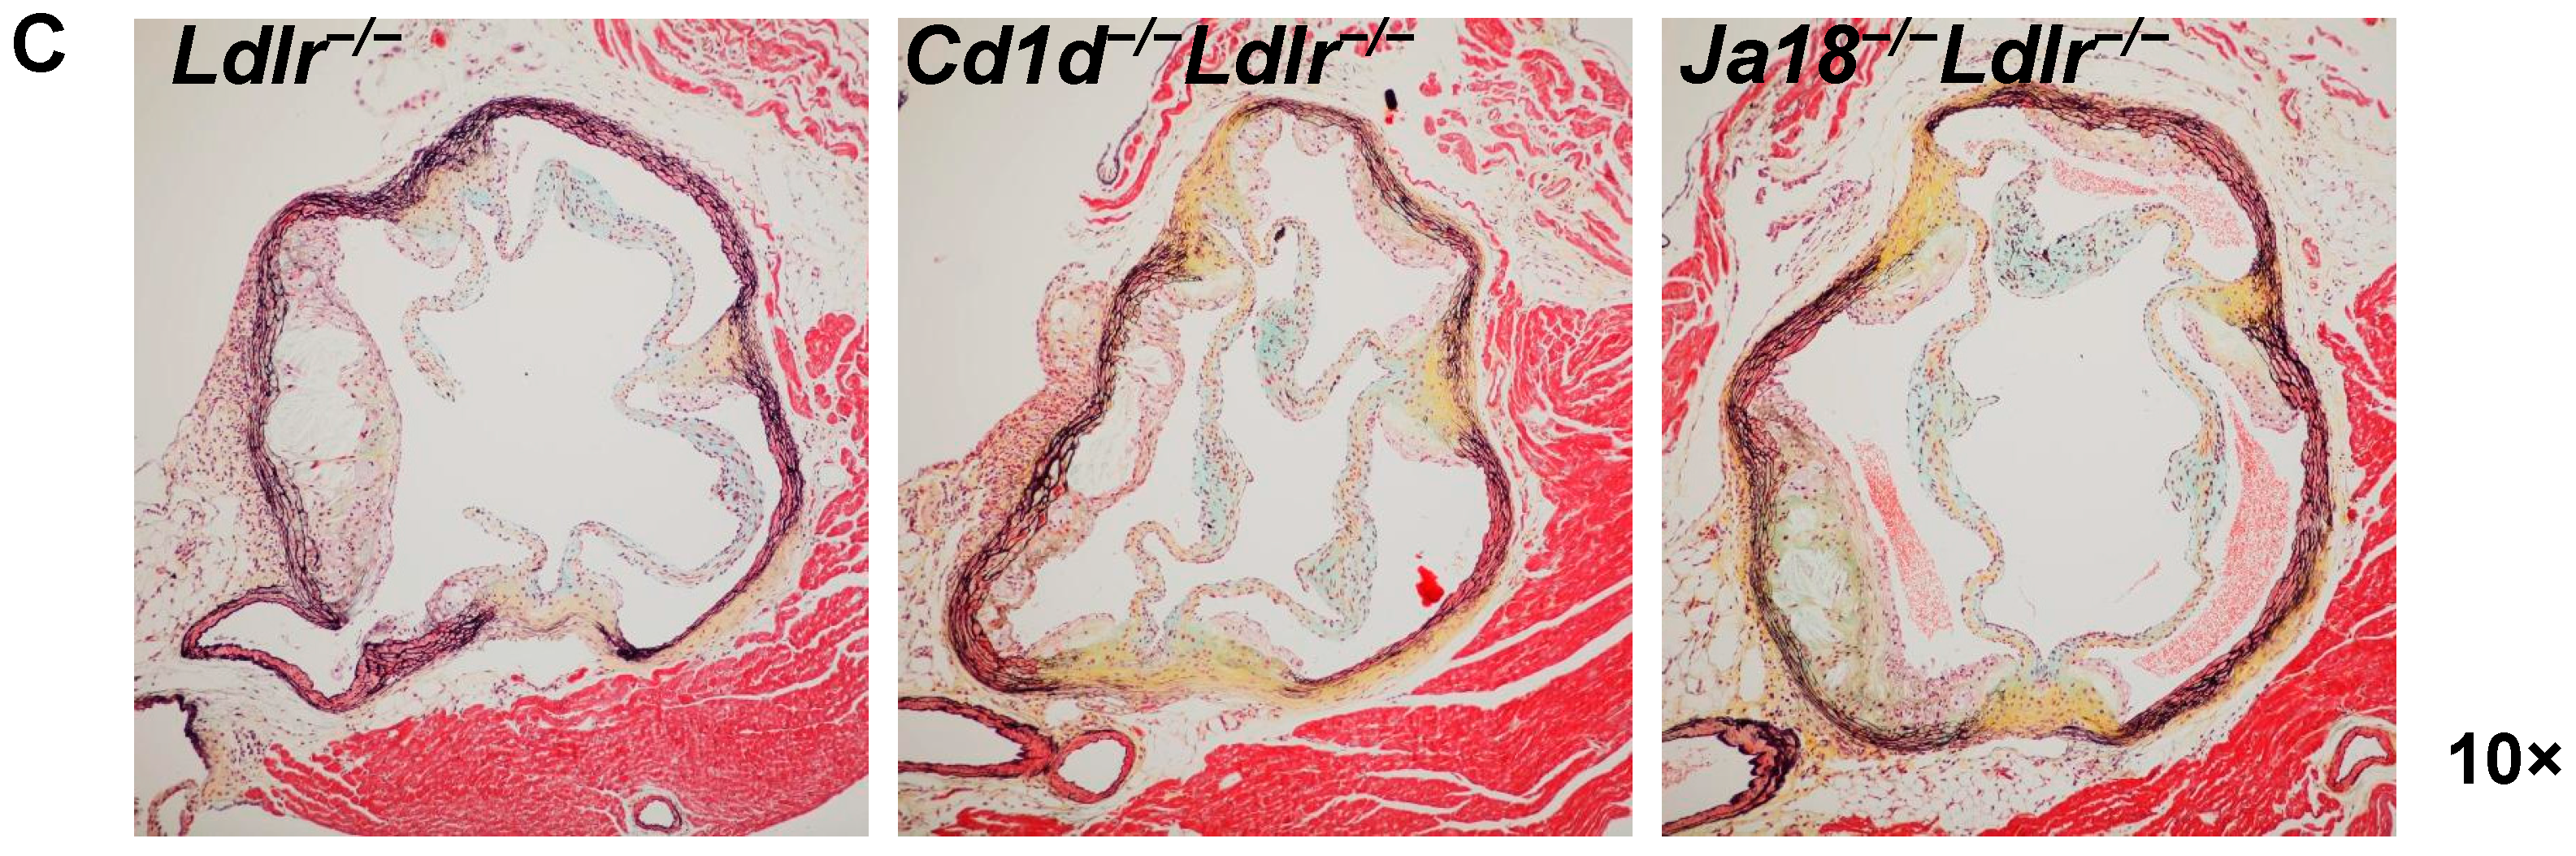
2.5. Aortic Atherosclerosis Is Increased in Ja18−/−Ldlr−/− Mice

Increased number or activation of iNKT cells has been shown to enhance atherosclerotic lesion development [17,30,31,32] and deficiency of NKT cells to decrease atherosclerosis [31,32,33,34,35]. To assess atherosclerosis in our diet-induced obesity models of NKT cell deficiency, we measured aortic atherosclerotic lesion area using the en face technique. Increased aortic atherosclerosis was observed in the obese Ja18−/−Ldlr−/− mice (p < 0.01, Figure 5A) lacking iNKT cells, but not in Cd1d−/−Ldlr−/− mice lacking both classes of NKT cells. However, no significant differences were seen at the aortic sinus (Figure 5B,C).

3. Discussion

The Ldlr−/− mouse develops many features of the metabolic syndrome when fed diets rich in saturated fat and refined carbohydrates. These effects are exacerbated by the addition of moderate amounts of dietary cholesterol [29]. We have recently shown that Vα14tg Ldlr−/− mice, which have an increased complement of iNKT cells throughout the development of obesity, are more obese and have increased inflammation, glucose intolerance, and atherosclerosis when fed this obesogenic diet [17]. The current study extends the analysis of the effects of NKT cells, again on the Ldlr−/− background, on obesity and atherosclerosis, in this case, examining the effect of NKT cell deficiency. Together, the studies represent the first comparisons of NKT cell abundance and deficiency, as they influence obesity in the context of hyperlipidemia in the Ldlr−/− background. Importantly, also they were performed in the same vivarium using the same obesogenic diet. In contrast to what we expected based on our previous study, in the current study, we find that the phenotype of HFHSC-fed Ldlr−/− mice lacking iNKT cells (Ja18−/−Ldlr−/− mouse) was, in many respects, surprisingly similar to that observed in the Vα14tg Ldlr−/− mice. Contrasted with control Ldlr−/− mice, as well as Cd1d−/−Ldlr−/− mice that lack the entire complement of NKT cells, the Ja18−/−Ldlr−/− mice that lack only iNKT cells exhibited increased weight gain, hyperlipidemia, adipose tissue inflammation, as well as increased aortic atherosclerosis.
The current consensus of existing studies is that iNKT cells decline markedly in adipose tissue in the setting of diet-induced obesity. The effect of the absence of iNKT on obesity and adipose tissue inflammation using Ja18−/− mice reported in the literature has been contradictory [28]. These diet-induced obesity studies have utilized a Western type diet or a high fat diet (40% or 60% calories) without added cholesterol in Ldlr+/+ animals. In our studies, the genetic manipulations of NKT cells were in the Ldlr−/− background, enabling us to study metabolic effects of a hypercaloric diet, as well as to evaluate atherosclerosis in the same model. Our results on weight gain and adipose tissue inflammation with the Ja18−/−Ldlr−/− mice are consistent with several [11,16], but not all studies [19,24] using Ja18−/−Ldlr+/+ mice.
The recent description of a sublineage of iNKT cells in adipose tissue as regulatory cells [20] may help explain our results with the Ja18−/−Ldlr−/− mice. This study by Lynch and colleagues determined that adipose tissue iNKT cells have a phenotype that is distinct from that of the iNKT cells of the liver and spleen in that adipose tissue iNKT cells express low levels of the characteristic transcription factor PLZF and high levels of IL-2 and IL-10, even at basal level and little IFNγ, upon stimulation. These NKT cells with regulatory properties, however, do not express the canonical Foxp3 found in T regulatory (Treg) cells [21]. The anti-inflammatory IL-2 and IL-10 cytokines promote the proliferation and function of Treg cells and the polarization of macrophages to the anti-inflammatory M2 subtype. Thus, in mice deficient in iNKT cells, the suppressive actions of iNKT cells in the adipose tissue are absent, and this could account for our observations. However, this does not fully account for the similarity in the phenotype of iNKT deficiency as reported here, and the phenotype of the Ldlr−/− animals that have an overabundance of iNKT cells. One possible explanation for this apparent paradox may be that the nature of the NKT cells in the adipose tissue of the Vα14 transgenic mice do not resemble the suppressive phenotype of iNKT cells seen in normal adipose tissue from wild type mice as described by Lynch and colleagues. The adipose tissue Vα14 iNKT cells may be more similar to the proinflammatory Th1-like iNKT cells found in the liver and spleen of wild type mice with the expression of IFNγ along with IL-4 [7]. So, a possible explanation for the paradox is that the increased inflammation in the adipose tissue of the transgenic mice is due to increased number of proinflammatory iNKT cells, while in the Ja18−/− mice, it is due to the absence of suppressive iNKT cells.
Tregs are an interesting partner for cross talk with iNKT cells. In visceral adipose tissue of lean aged male mice, Tregs constitute ~50% of all CD4+ T cells in the tissue [36]. Treg levels decrease in adipose tissue in genetic models of obesity and upon feeding a high fat diet [36,37]. Loss-of-function experiments using diphtheria toxin receptor expression, specifically in Tregs, resulted in increased adipose inflammation and decreased insulin signaling in adipocytes [36]. Conversely, increasing Tregs using IL-2-anti-IL-2 complexes resulted in increased insulin sensitivity [36]. Thus, the absence of iNKT cells could result in lower Treg numbers [20] that would increase inflammation. Treg cells are not homogeneous, and the spectrum of Tregs may differ from one tissue to another, as has been shown by Mathis and colleagues [1]. iNKT cells may interact with particular subsets of Tregs, allowing for complex metabolic interactions. An additional possibility is that there may be a reduction or skewing of the TCRα repertoire diversity in the knockout mouse strains, especially in the Ja18−/−Ldlr−/− mice [38], that may alter antigen recognition and activation.
Another unexpected result was that CD1d−/−Ldlr−/− mice are less obese, and exhibit overall less adipose tissue inflammation than is described in the other two NKT cell models we have studied, Vα14tg Ldlr−/− and Ja18−/−Ldlr−/− mice. CD1d is the antigen-presenting molecule for all NKT cells, iNKT and the more diverse type II NKT cells. In the absence of CD1d, both types of NKT cells are absent. Due to the requirement of CD1d for the maintenance of iNKT, one would have expected the phenotype of the adipose tissue in Cd1d−/−Ldlr−/− mice to be similar to that observed for the Ja18−/−Ldlr−/− mice. Three possibilities may account for these unexpected results. First is the possibility that type II NKT cells counteract the activity of iNKT cells, and are necessary for the suppressive activity of the iNKT cells in adipose tissue. Second, it is possible that CD1d, known to be expressed on epithelial cells including adipocytes, could, through signaling in these cells, counteract the suppressive action of iNKT cells. Third, is the possibility that the absence of CD1d in intestinal cells influences the intestinal microbiome, which in turn, modifies the obesity phenotype [39,40]. This could be mediated in part by the absence of CD1d-regulated secretion of anti-microbial peptides by Paneth cells [41].
We have studied these models in the Ldlr deficient background so that we are able to assess the effects of modulating NKT cells on atherosclerosis. Similar to the obesity phenotype, Vα14 transgenic animals [17] and Ja18−/− animals, but not Cd1d−/− animals exhibited increased aortic atherosclerosis. The transgenic animals displayed increased plasma cholesterol and lipoproteins, which could have played a role in the increment in atherosclerosis. However, perivascular adipose tissue has been shown to impact atherosclerosis [42,43,44]. So, the arguments raised in relation to NKT cells and adipose tissue inflammation could be relevant to periaortic adipose tissue modification of the underlying lesion development in the aorta.
In this and our previous paper, we have, for the first time, explored the role of different levels and subtypes of NKT cells on adipose tissue inflammation and atherosclerosis in Ldlr−/− mice housed in the same vivarium and fed the same obesogenic, high cholesterol diet. It is clear that the role of NKT cells in diet-induced obesity and atherosclerosis in male Ldlr−/− mice is quite complex, and requires much further exploration.

4. Materials and Methods

4.1. Animals and Diets

Ja18−/− mice obtained from Dr. Albert Bendelac (University of Chicago) and CD1d−/− mice were obtained from Dr. Chyung-Ru Wang (Northwestern University) were crossed with Ldlr−/− mice. All animals were in the C57BL/6J background. Ldlr−/− mice were used as controls. The absence of iNKT cells in the spleen and liver of Ja18−/−Ldlr−/− and Cd1d−/−Ldlr−/− mice was confirmed by the absence of CD3+αGalCer-tetramer+ (NIH Tetramer Core Facility) or CD3+ NK1.1+ cells by flow cytometry, as previously described [17]. Ten-week-old male mice were fed standard chow or a high fat, high sucrose diet with 0.15% cholesterol (HFHSC, Bioserv F4997, Frenchtown, NJ, USA) for 16 weeks (n = 10 per group). Mice were maintained in a temperature and light-controlled facility in cages with micro-isolator filter tops. Body weights were measured weekly. Food intake was recorded after 10 weeks of diet. At sacrifice, harvested tissues were snap-frozen in liquid nitrogen and stored at −70 °C, or were fixed with 10% neutral-buffered formalin and embedded in paraffin wax. All experimental procedures were undertaken with approval from the Institution Animal Care and Use Committee of the University of Washington (Seattle, WA, USA, 3104-01, 28 February 2016).

4.2. Analytical Procedures

Metabolic variables were measured in blood samples obtained from the retro-orbital sinus after a 5 h fast. Lipoproteins were separated from pooled plasma samples by fast-phase liquid chromatography (FPLC) using Superose 6 columns. Cholesterol and triglyceride levels in plasma and FPLC fractions were measured using colorimetric assay kits. Plasma insulin levels were measured using an ELISA kit (Millipore, Billerica, MA, USA). Tissue lipids were extracted using the Folch technique [45] and measured using colorimetric assay kits. Intra-peritoneal glucose and insulin tolerance tests were performed in 5 h fasted animals at weeks 13 and 14 of diet feeding, respectively, as previously described [29]. Body composition was measured using quantitative magnetic resonance (EchoMRI whole body composition analyzer, Echo Medical Systems, Houston, TX, USA). Plasma SAA levels were measured by ELISA, as previously described [46].

4.3. Real-Time Quantitative PCR

Total RNA was extracted from ~100 mg of whole adipose tissue and liver using a commercially available RNA extraction kit according to the manufacturer’s protocol (Agilent Technologies, Santa Clara, CA, USA). After spectroscopic quantification, 2 µg of RNA was reverse-transcribed, and the cDNA was analyzed by real-time quantitative PCR. Primers specific for individual genes were purchased from Applied Biosystems (Assay-on-Demand, Life Technologies, Carlsbad, CA, USA). GAPDH was used as the control housekeeping gene, levels of which did not change with diets. Relative amounts of the target gene were calculated using the ΔΔCt formula.

4.4. Histology, Immunohistochemistry, and Atherosclerosis Quantification

Formalin-fixed, paraffin-embedded adipose tissues were sectioned and stained using Movat’s pentachrome histochemical stain, using standard protocols. Macrophages in adipose tissue were detected using a rat monoclonal antibody (Mac2; titer 1:2500, Cedarlane Laboratories, Burlington, NC, USA). Liver sections were stained with Masson’s trichrome staining using standard protocols. The extent of atherosclerosis was measured in pinned aortas using the en face technique, and aortic sinus lesion analysis was performed as previously described [29].

4.5. Statistics

Data were analyzed using the GraphPad Prism 5 program (GraphPad Software Inc., La Jolla, CA, USA) and are represented as means and standard errors. Student’s t-test was used to detect differences within groups when applicable. One-way analysis of variance (ANOVA) was used to compare differences among all groups, and Bonferroni post hoc testing was used to detect differences among mean values of the groups. A p value < 0.05 was considered as statistically significant.

Acknowledgments

This work was supported by NIH grants DK035816 (Savitha Subramanian and Alan Chait), HL09352 (Alan Chait), HL092969 (Alan Chait) and HL88420 (Godfrey S. Getz and Catherine A. Reardon). The authors acknowledge the technical assistance of Mohamed Omer and Jinkyu Kim.

Authors Contribution

Savitha Subramanian, Alan Chait, Godfrey S. Getz and Catherine A. Reardon conceived and designed the experiments; Savitha Subramanian, Leela Goodspeed, Shari Wang, Yilei Ding and Kevin D. O’Brien performed the experiments; Savitha Subramanian, Alan Chait, Godfrey S. Getz, and Catherine A. Reardon analyzed the data and wrote the paper.

Conflicts of Interest

The authors declare no conflict of interest. The funding sponsors had no role in the design of the study; in the collection, analyses, or interpretation of data; in the writing of the manuscript, and in the decision to publish the results.

Abbreviations

FPLCfast performance liquid chromatography
HFHSChigh fat, high sucrose, cholesterol
iNKTinvariant Natural Killer T
LdlrLow density lipoprotein receptor
SAAserum amyloid A
TCRT cell receptor
TregT regulatory

References

  1. Burzyn, D.; Benoist, C.; Mathis, D. Regulatory T cells in nonlymphoid tissues. Nat. Immunol. 2013, 14, 1007–1013. [Google Scholar] [CrossRef] [PubMed]
  2. Mathis, D. Immunological goings-on in visceral adipose tissue. Cell Metab. 2013, 17, 851–859. [Google Scholar] [CrossRef] [PubMed]
  3. Schipper, H.S.; Prakken, B.; Kalkhoven, E.; Boes, M. Adipose tissue-resident immune cells: Key players in immunometabolism. Trends Endocrinol. Metab. 2012, 23, 407–415. [Google Scholar] [CrossRef] [PubMed]
  4. Brestoff, J.R.; Artis, D. Immune regulation of metabolic homeostasis in health and disease. Cell 2015, 161, 146–160. [Google Scholar] [CrossRef] [PubMed]
  5. McLaughlin, T.; Ackerman, S.E.; Shen, L.; Engleman, E. Role of innate and adaptive immunity in obesity-associated metabolic disease. J. Clin. Investig. 2017, 127, 5–13. [Google Scholar] [CrossRef] [PubMed]
  6. Bonamichi, B.; Lee, J. Unusual suspects in the development of obesity-induced inflammation and insulin resistance: NK cells, iNKT cells, and ILCs. Diabetes Metab. J. 2017, 41, 229–250. [Google Scholar] [CrossRef] [PubMed]
  7. Brennan, P.J.; Brigl, M.; Brenner, M.B. Invariant natural killer T cells: An innate activation scheme linked to diverse effector functions. Nat. Rev. Immunol. 2013, 13, 101–117. [Google Scholar] [CrossRef] [PubMed]
  8. Van Kaer, L.; Parekh, V.V.; Wu, L. Invariant natural killer T cells as sensors and managers of inflammation. Trends Immunol. 2013, 34, 50–58. [Google Scholar] [CrossRef] [PubMed]
  9. Bendelac, A.; Savage, P.B.; Teyton, L. The biology of NKT cells. Annu. Rev. Immunol. 2007, 25, 297–336. [Google Scholar] [CrossRef] [PubMed]
  10. Rossjohn, J.; Pellicci, D.G.; Patel, O.; Gapin, L.; Godfrey, D.I. Recognition of CD1d-restricted antigens by natural killer t cells. Nat. Rev. Immunol. 2012, 12, 845–857. [Google Scholar] [CrossRef] [PubMed]
  11. Huh, J.Y.; Kim, J.I.; Park, Y.J.; Hwang, I.J.; Lee, Y.S.; Sohn, J.H.; Lee, S.K.; Alfadda, A.A.; Kim, S.S.; Choi, S.H.; et al. A novel function of adipocytes in lipid antigen presentation to iNKT cells. Mol. Cell. Biol. 2013, 33, 328–339. [Google Scholar] [CrossRef] [PubMed]
  12. Satoh, M.; Hoshino, M.; Fujita, K.; Iizuka, M.; Fujii, S.; Clingan, C.S.; van Kaer, L.; Iwabuchi, K. Adipocyte-specific Cd1d-deficiency mitigates diet-induced obesity and insulin resistance in mice. Sci. Rep. 2016, 6, 28473. [Google Scholar] [CrossRef] [PubMed]
  13. Kain, L.; Costanzo, A.; Webb, B.; Holt, M.; Bendelac, A.; Savage, P.B.; Teyton, L. Endogenous ligands of natural killer T cells are alpha-linked glycosylceramides. Mol. Immunol. 2015, 68, 94–97. [Google Scholar] [CrossRef] [PubMed]
  14. Brennan, P.J.; Tatituri, R.V.; Heiss, C.; Watts, G.F.; Hsu, F.F.; Veerapen, N.; Cox, L.R.; Azadi, P.; Besra, G.S.; Brenner, M.B. Activation of iNKT cells by a distinct constituent of the endogenous glucosylceramide fraction. Proc. Natl. Acad. Sci. USA 2014, 111, 13433–13438. [Google Scholar] [CrossRef] [PubMed]
  15. Wolf, B.J.; Tatituri, R.V.; Almeida, C.F.; Le Nours, J.; Bhowruth, V.; Johnson, D.; Uldrich, A.P.; Hsu, F.F.; Brigl, M.; Besra, G.S.; et al. Identification of a potent microbial lipid antigen for diverse NKT cells. J. Immunol. 2015, 195, 2540–2551. [Google Scholar] [CrossRef] [PubMed]
  16. Lynch, L.; Nowak, M.; Varghese, B.; Clark, J.; Hogan, A.E.; Toxavidis, V.; Balk, S.P.; O’Shea, D.; O’Farrelly, C.; Exley, M.A. Adipose tissue invariant NKT cells protect against diet-induced obesity and metabolic disorder through regulatory cytokine production. Immunity 2012, 37, 574–587. [Google Scholar] [CrossRef] [PubMed]
  17. Subramanian, S.; Turner, M.S.; Ding, Y.; Goodspeed, L.; Wang, S.; Buckner, J.H.; O’Brien, K.; Getz, G.S.; Reardon, C.A.; Chait, A. Increased levels of invariant natural killer T lymphocytes worsen metabolic abnormalities and atherosclerosis in obese mice. J. Lipid Res. 2013, 54, 2831–2841. [Google Scholar] [CrossRef] [PubMed]
  18. Lynch, L.; O’Shea, D.; Winter, D.C.; Geoghegan, J.; Doherty, D.G.; O’Farrelly, C. Invariant NKT cells and CD1d(+) cells amass in human omentum and are depleted in patients with cancer and obesity. Eur. J. Immunol. 2009, 39, 1893–1901. [Google Scholar] [CrossRef] [PubMed]
  19. Wu, L.; Parekh, V.V.; Gabriel, C.L.; Bracy, D.P.; Marks-Shulman, P.A.; Tamboli, R.A.; Kim, S.; Mendez-Fernandez, Y.V.; Besra, G.S.; Lomenick, J.P.; et al. Activation of invariant natural killer T cells by lipid excess promotes tissue inflammation, insulin resistance, and hepatic steatosis in obese mice. Proc. Natl. Acad. Sci. USA 2012, 109, E1143–E1152. [Google Scholar] [CrossRef] [PubMed]
  20. Lynch, L.; Michelet, X.; Zhang, S.; Brennan, P.J.; Moseman, A.; Lester, C.; Besra, G.; Vomhof-Dekrey, E.E.; Tighe, M.; Koay, H.F.; et al. Regulatory iNKT cells lack expression of the transcription factor PLZF and control the homeostasis of T(reg) cells and macrophages in adipose tissue. Nat. Immunol. 2015, 16, 85–95. [Google Scholar] [CrossRef] [PubMed]
  21. Sag, D.; Krause, P.; Hedrick, C.C.; Kronenberg, M.; Wingender, G. IL-10-producing NKT10 cells are a distinct regulatory invariant nkt cell subset. J. Clin. Investig. 2014, 124, 3725–3740. [Google Scholar] [CrossRef] [PubMed]
  22. Kotas, M.E.; Lee, H.Y.; Gillum, M.P.; Annicelli, C.; Guigni, B.A.; Shulman, G.I.; Medzhitov, R. Impact of CD1d deficiency on metabolism. PLoS ONE 2011, 6, e25478. [Google Scholar] [CrossRef] [PubMed]
  23. Schipper, H.S.; Rakhshandehroo, M.; van de Graaf, S.F.; Venken, K.; Koppen, A.; Stienstra, R.; Prop, S.; Meerding, J.; Hamers, N.; Besra, G.; et al. Natural killer T cells in adipose tissue prevent insulin resistance. J. Clin. Investig. 2012, 122, 3343–3354. [Google Scholar] [CrossRef] [PubMed] [Green Version]
  24. Satoh, M.; Andoh, Y.; Clingan, C.S.; Ogura, H.; Fujii, S.; Eshima, K.; Nakayama, T.; Taniguchi, M.; Hirata, N.; Ishimori, N.; et al. Type II NKT cells stimulate diet-induced obesity by mediating adipose tissue inflammation, steatohepatitis and insulin resistance. PLoS ONE 2012, 7, e30568. [Google Scholar] [CrossRef] [PubMed]
  25. Strodthoff, D.; Lundberg, A.M.; Agardh, H.E.; Ketelhuth, D.F.; Paulsson-Berne, G.; Arner, P.; Hansson, G.K.; Gerdes, N. Lack of invariant natural killer T cells affects lipid metabolism in adipose tissue of diet-induced obese mice. Arterioscler. Thromb. Vasc. Biol. 2013, 33, 1189–1196. [Google Scholar] [CrossRef] [PubMed]
  26. Mantell, B.S.; Stefanovic-Racic, M.; Yang, X.; Dedousis, N.; Sipula, I.J.; O’Doherty, R.M. Mice lacking NKT cells but with a complete complement of CD8+ T-cells are not protected against the metabolic abnormalities of diet-induced obesity. PLoS ONE 2011, 6, e19831. [Google Scholar] [CrossRef] [PubMed] [Green Version]
  27. Martin-Murphy, B.V.; You, Q.; Wang, H.; de La Houssaye, B.A.; Reilly, T.P.; Friedman, J.E.; Ju, C. Mice lacking natural killer T cells are more susceptible to metabolic alterations following high fat diet feeding. PLoS ONE 2014, 9, e80949. [Google Scholar] [CrossRef] [PubMed]
  28. Exley, M.A.; Hand, L.; O’Shea, D.; Lynch, L. Interplay between the immune system and adipose tissue in obesity. J. Endocrinol. 2014, 223, R41–R48. [Google Scholar] [CrossRef] [PubMed]
  29. Subramanian, S.; Han, C.Y.; Chiba, T.; McMillen, T.S.; Wang, S.A.; Haw, A., 3rd; Kirk, E.A.; O’Brien, K.D.; Chait, A. Dietary cholesterol worsens adipose tissue macrophage accumulation and atherosclerosis in obese LDL receptor-deficient mice. Arterioscler. Thromb. Vasc. Biol. 2008, 28, 685–691. [Google Scholar] [CrossRef] [PubMed]
  30. VanderLaan, P.A.; Reardon, C.A.; Sagiv, Y.; Blachowicz, L.; Lukens, J.; Nissenbaum, M.; Wang, C.R.; Getz, G.S. Characterization of the natural killer T-cell response in an adoptive transfer model of atherosclerosis. Am. J. Pathol. 2007, 170, 1100–1107. [Google Scholar] [CrossRef] [PubMed]
  31. Major, A.S.; Wilson, M.T.; McCaleb, J.L.; Su, Y.R.; Stanic, A.K.; Joyce, S.; Van Kaer, L.; Fazio, S.; Linton, M.F. Quantitative and qualitative differences in proatherogenic NKT cells in apolipoprotein E-deficient mice. Arterioscler. Thromb. Vasc. Biol. 2004, 24, 2351–2357. [Google Scholar] [CrossRef] [PubMed]
  32. Tupin, E.; Nicoletti, A.; Elhage, R.; Rudling, M.; Ljunggren, H.G.; Hansson, G.K.; Berne, G.P. CD1d-dependent activation of NKT cells aggravates atherosclerosis. J. Exp. Med. 2004, 199, 417–422. [Google Scholar] [CrossRef] [PubMed]
  33. Nakai, Y.; Iwabuchi, K.; Fujii, S.; Ishimori, N.; Dashtsoodol, N.; Watano, K.; Mishima, T.; Iwabuchi, C.; Tanaka, S.; Bezbradica, J.S.; et al. Natural killer T cells accelerate atherogenesis in mice. Blood 2004, 104, 2051–2059. [Google Scholar] [CrossRef] [PubMed]
  34. Aslanian, A.M.; Chapman, H.A.; Charo, I.F. Transient role for CD1d-restricted natural killer T cells in the formation of atherosclerotic lesions. Arterioscler. Thromb. Vasc. Biol. 2005, 25, 628–632. [Google Scholar] [CrossRef] [PubMed]
  35. Rogers, L.; Burchat, S.; Gage, J.; Hasu, M.; Thabet, M.; Willcox, L.; Ramsamy, T.A.; Whitman, S.C. Deficiency of invariant Valpha 14 natural killer T cells decreases atherosclerosis in LDL receptor null mice. Cardiovasc. Res. 2008, 78, 167–174. [Google Scholar] [CrossRef] [PubMed]
  36. Feuerer, M.; Herrero, L.; Cipolletta, D.; Naaz, A.; Wong, J.; Nayer, A.; Lee, J.; Goldfine, A.B.; Benoist, C.; Shoelson, S.; et al. Lean, but not obese, fat is enriched for a unique population of regulatory T cells that affect metabolic parameters. Nat. Med. 2009, 15, 930–939. [Google Scholar] [CrossRef] [PubMed]
  37. Deiuliis, J.; Shah, Z.; Shah, N.; Needleman, B.; Mikami, D.; Narula, V.; Perry, K.; Hazey, J.; Kampfrath, T.; Kollengode, M.; et al. Visceral adipose inflammation in obesity is associated with critical alterations in Tregulatory cell numbers. PLoS ONE 2011, 6, e16376. [Google Scholar] [CrossRef] [PubMed]
  38. Chandra, S.; Zhao, M.; Budelsky, A.; de Mingo Pulido, A.; Day, J.; Fu, Z.; Siegel, L.; Smith, D.; Kronenberg, M. A new mouse strain for the analysis of invariant NKT cell function. Nat. Immunol. 2015, 16, 799–800. [Google Scholar] [CrossRef] [PubMed]
  39. Ridaura, V.K.; Faith, J.J.; Rey, F.E.; Cheng, J.; Duncan, A.E.; Kau, A.L.; Griffin, N.W.; Lombard, V.; Henrissat, B.; Bain, J.R.; et al. Gut microbiota from twins discordant for obesity modulate metabolism in mice. Science 2013, 341, 1241214. [Google Scholar] [CrossRef] [PubMed]
  40. Karlsson, F.; Tremaroli, V.; Nielsen, J.; Backhed, F. Assessing the human gut microbiota in metabolic diseases. Diabetes 2013, 62, 3341–3349. [Google Scholar] [CrossRef] [PubMed]
  41. Nieuwenhuis, E.E.; Matsumoto, T.; Lindenbergh, D.; Willemsen, R.; Kaser, A.; Simons-Oosterhuis, Y.; Brugman, S.; Yamaguchi, K.; Ishikawa, H.; Aiba, Y.; et al. CD1d-dependent regulation of bacterial colonization in the intestine of mice. J. Clin. Investig. 2009, 119, 1241–1250. [Google Scholar] [CrossRef] [PubMed]
  42. Chatterjee, T.K.; Stoll, L.L.; Denning, G.M.; Harrelson, A.; Blomkalns, A.L.; Idelman, G.; Rothenberg, F.G.; Neltner, B.; Romig-Martin, S.A.; Dickson, E.W.; et al. Proinflammatory phenotype of perivascular adipocytes: Influence of high-fat feeding. Circ. Res. 2009, 104, 541–549. [Google Scholar] [CrossRef] [PubMed]
  43. Ohman, M.K.; Luo, W.; Wang, H.; Guo, C.; Abdallah, W.; Russo, H.M.; Eitzman, D.T. Perivascular visceral adipose tissue induces atherosclerosis in apolipoprotein E deficient mice. Atherosclerosis 2011, 219, 33–39. [Google Scholar] [CrossRef] [PubMed]
  44. Brown, N.K.; Zhou, Z.; Zhang, J.; Zeng, R.; Wu, J.; Eitzman, D.T.; Chen, Y.E.; Chang, L. Perivascular adipose tissue in vascular function and disease: A review of current research and animal models. Arterioscler. Thromb. Vasc. Biol. 2014, 34, 1621–1630. [Google Scholar] [CrossRef] [PubMed]
  45. Folch, J.; Lees, M.; Sloane Stanley, G.H. A simple method for the isolation and purification of total lipides from animal tissues. J. Biol. Chem. 1957, 226, 497–509. [Google Scholar] [PubMed]
  46. Lewis, K.E.; Kirk, E.A.; McDonald, T.O.; Wang, S.; Wight, T.N.; O’Brien, K.D.; Chait, A. Increase in serum amyloid A evoked by dietary cholesterol is associated with increased atherosclerosis in mice. Circulation 2004, 110, 540–545. [Google Scholar] [CrossRef] [PubMed]
Figure 1. Invariant natural killer T (iNKT) cell deficient Ja18−/−Ldlr−/− mice exhibit increased weight gain. (A) Significantly increased weight gain in Ja18−/−Ldlr−/− mice fed high fat, high sucrose cholesterol enriched (HFHSC) diet for 16 weeks; (B) Perigonadal adipose tissue weights; (C) Body composition analysis revealed increased generalized fat distribution in all groups of obese mice. Data represent means ± standard error of the mean (SEM), n = 10 mice per group. *** p < 0.001 vs. lean mice of corresponding group, # p < 0.01 vs. HFHSC-fed Ldlr−/− mice, $$ p < 0.001 vs. HFHSC-fed Cd1d−/−Ldlr−/− mice. Open symbols and solid bars—chow-fed animals; closed symbols and hatched bars—HFHSC-fed animals. BW: body weight.
Ijms 19 00510 g001
Figure 2. Effects of NKT cell deficiency on metabolic abnormalities that accompany obesity. (A) Plasma triglyceride and (B) cholesterol levels in mice fed chow or HFHSC diets. Plasma lipoprotein cholesterol (C) and triglyceride (D) distribution in lean Ldlr−/− and HFHSC-fed Ja18−/−Ldlr−/−, Cd1d−/−Ldlr−/−, and Ldlr−/− mice. (E) Plasma fasting glucose, (F) fasting insulin, and (G) intraperitoneal (ip) glucose tolerance test. (H) Insulin tolerance test. n = 10 per group. * p < 0.05 vs. corresponding lean mice, *** p < 0.001 vs. corresponding lean mice, ### p < 0.0001 vs. HFHSC-fed Ldlr−/− mice. Open symbols and solid bars—chow-fed animals; closed symbols and hatched bars—HFHSC-fed animals.
Ijms 19 00510 g002
Figure 3. Adipose tissue inflammation is enhanced in obese Ja18−/−Ldlr−/− mice. (A) Quantification of macrophage Mac2 staining of adipose tissue; (BI) Expression level of genes in whole perigonadal adipose tissue expressed relative to lean chow-fed Ldlr−/− mice. n = 5–10 per group. * p < 0.05 vs. corresponding lean group, ** p < 0.01 vs. corresponding lean group, # p < 0.05 vs. HFHSC-fed Ldlr−/− mice, ## p < 0.01 vs. HFHSC-fed Ldlr−/−, $ p < 0.05 vs. HFHSC-fed Cd1d−/−Ldlr−/− mice. Solid bars—chow-fed animals; closed symbols and hatched bars—HFHSC-fed animals.
Ijms 19 00510 g003
Figure 4. Effects of NKT cell deficiency in liver. (A) Liver weights, (B) plasma SAA levels, and hepatic triglyceride (C), and cholesterol (D) content. (E) Liver sections stained with Masson’s trichrome, 10× magnification. (FI) Expression level of genes in whole liver tissue expressed as relative to lean chow-fed Ldlr−/− mice. n = 10 per group. * p < 0.05, ** p < 0.01, *** p < 0.001 vs. corresponding lean group, # p < 0.05 vs. HFHSC-fed Ldlr−/− mice. Solid bars—chow-fed animals; hatched bars—HFHSC-fed animals. SAA: serum amyloid A.
Ijms 19 00510 g004aIjms 19 00510 g004b
Figure 5. Aortic atherosclerosis is increased in obese Ja18−/−Ldlr−/− mice. (A) Quantitation of aortic intimal lesions; (B) Quantitation of aortic sinus lesions; (C) Photomicrographs of Movat’s pentachrome stained aortic sinus lesions. 10× magnification. n = 6–8 per group, ** p < 0.01 vs. HFHSC-fed Ldlr−/− mice, # p < 0.05 vs. HFHSC-fed Cd1d−/−Ldlr−/− mice.
Ijms 19 00510 g005aIjms 19 00510 g005b

