Article

MiR-19a Overexpression in FTC-133 Cell Line Induces a More De-Differentiated and Aggressive Phenotype

Department of Biomedical and Biotechnological Sciences, Physiology Section, University of Catania, 95123 Catania, Italy
*
Author to whom correspondence should be addressed.
Int. J. Mol. Sci. 2018, 19(12), 3944; https://doi.org/10.3390/ijms19123944
Submission received: 31 October 2018 / Revised: 29 November 2018 / Accepted: 6 December 2018 / Published: 7 December 2018
(This article belongs to the Special Issue Cell and Molecular Biology of Thyroid Disorders)

Abstract

:
In recent years, microRNAs (miRNAs) have received increasing attention for their important role in tumor initiation and progression. MiRNAs are a class of endogenous small non-coding RNAs that negatively regulate the expression of several oncogenes or tumor suppressor genes. MiR-19a, a component of the oncogenic miR-17-92 cluster, has been reported to be highly expressed only in anaplastic thyroid cancer, the most undifferentiated, aggressive and lethal form of thyroid neoplasia. In this work, we evaluated the putative contribution of miR-19a in de-differentiation and aggressiveness of thyroid tumors. To this aim, we induced miR-19a expression in the well-differentiated follicular thyroid cancer cell line and evaluated proliferation, apoptosis and gene expression profile of cancer cells. Our results showed that miR-19a overexpression stimulates cell proliferation and alters the expression profile of genes related to thyroid cell differentiation and aggressiveness. These findings not only suggest that miR-19a has a possible involvement in de-differentiation and malignancy, but also that it could represent an important prognostic indicator and a good therapeutic target for the most aggressive thyroid cancer.

1. Introduction

Thyroid cancers are considered the most representative malignancies of the endocrine system, affecting about 1% of all newly diagnosed tumor cases with an incidence growing worldwide [1,2]. They comprise some histotypes that can be classified, according to definite histological features, into three different groups: (i) Well-differentiated thyroid carcinomas (WDTCs), (ii) poorly differentiated thyroid carcinomas (PDTCs) and (iii) undifferentiated thyroid carcinomas (UDTCs) [3]. WDTCs include papillary thyroid carcinoma (PTC), which represents about 80% of cases with better prognosis and follicular thyroid carcinoma (FTC) that represents approximately 15% of all thyroid carcinomas, with a less favorable survival rates [4,5,6,7].
PDTCs represents about 0.3% to 6.7% of all thyroid malignancies and display an aggressive clinical behavior, with a poor prognosis [8]. Anaplastic thyroid cancer (ATC) is the most aggressive and lethal form of UDTCs. It shows a quick invasive progression with an early metastatic diffusion, a considerably poorer prognosis and reduced overall survival [9].
MiRNAs, an evolutionally well-conserved class of noncoding RNAs, are capable of controlling gene expression through mRNA cleavage or translational repression [10,11] and their deregulation is involved in the development and progression of several human cancers [12,13,14,15,16]. They work in a complex functional system, in which a precise miRNA regulates hundreds of mRNAs and a single gene is targeted by several miRNAs [17]. MiRNAs regulate various human genes correlated with several cellular processes including proliferation, apoptosis, metastasis, cell immunity and differentiation [18,19,20]. Approximately 2000 miRNAs have been discovered in humans [21] and about 50% have been found in cancer-related genomic regions or fragile sites, confirming their role as drivers of neoplastic alterations [22]. In addition recently, it has been demonstrated that miRNAs expression is correlated with different clinical parameters and their application could be used for cancer diagnosis, prognosis and treatment response [23,24,25].
MiR-19a, one of the seven miRNAs belonging to the miR-17-92 cluster located on chromosome 13q31.3, has been demonstrated to be a tumor-related miRNA involved in cancerogenesis. Several findings have revealed that miR-19a expression is increased in many different types of solid tumors including ATC, as shown in vitro by cell growth induction. Takakura et al., demonstrated that miR-19a is more expressed in thyroid cancer cell lines than in normal primary thyreocytes [26].
The aim of the present study was to evaluate the involvement of miR-19a in promoting de-differentiation towards an aggressive phenotype. For this purpose, we induced miR-19a expression in follicular thyroid cancer cell line (FTC-133) and evaluated its effects on proliferation, cell death and gene expression profile. Our results indicate that miR-19a could contribute to promote a de-differentiation and a more aggressive phenotype of FTC-133 cells. Although further studies are needed, these data could represent a starting point for the development of new therapeutic targets for thyroid carcinomas.

2. Results

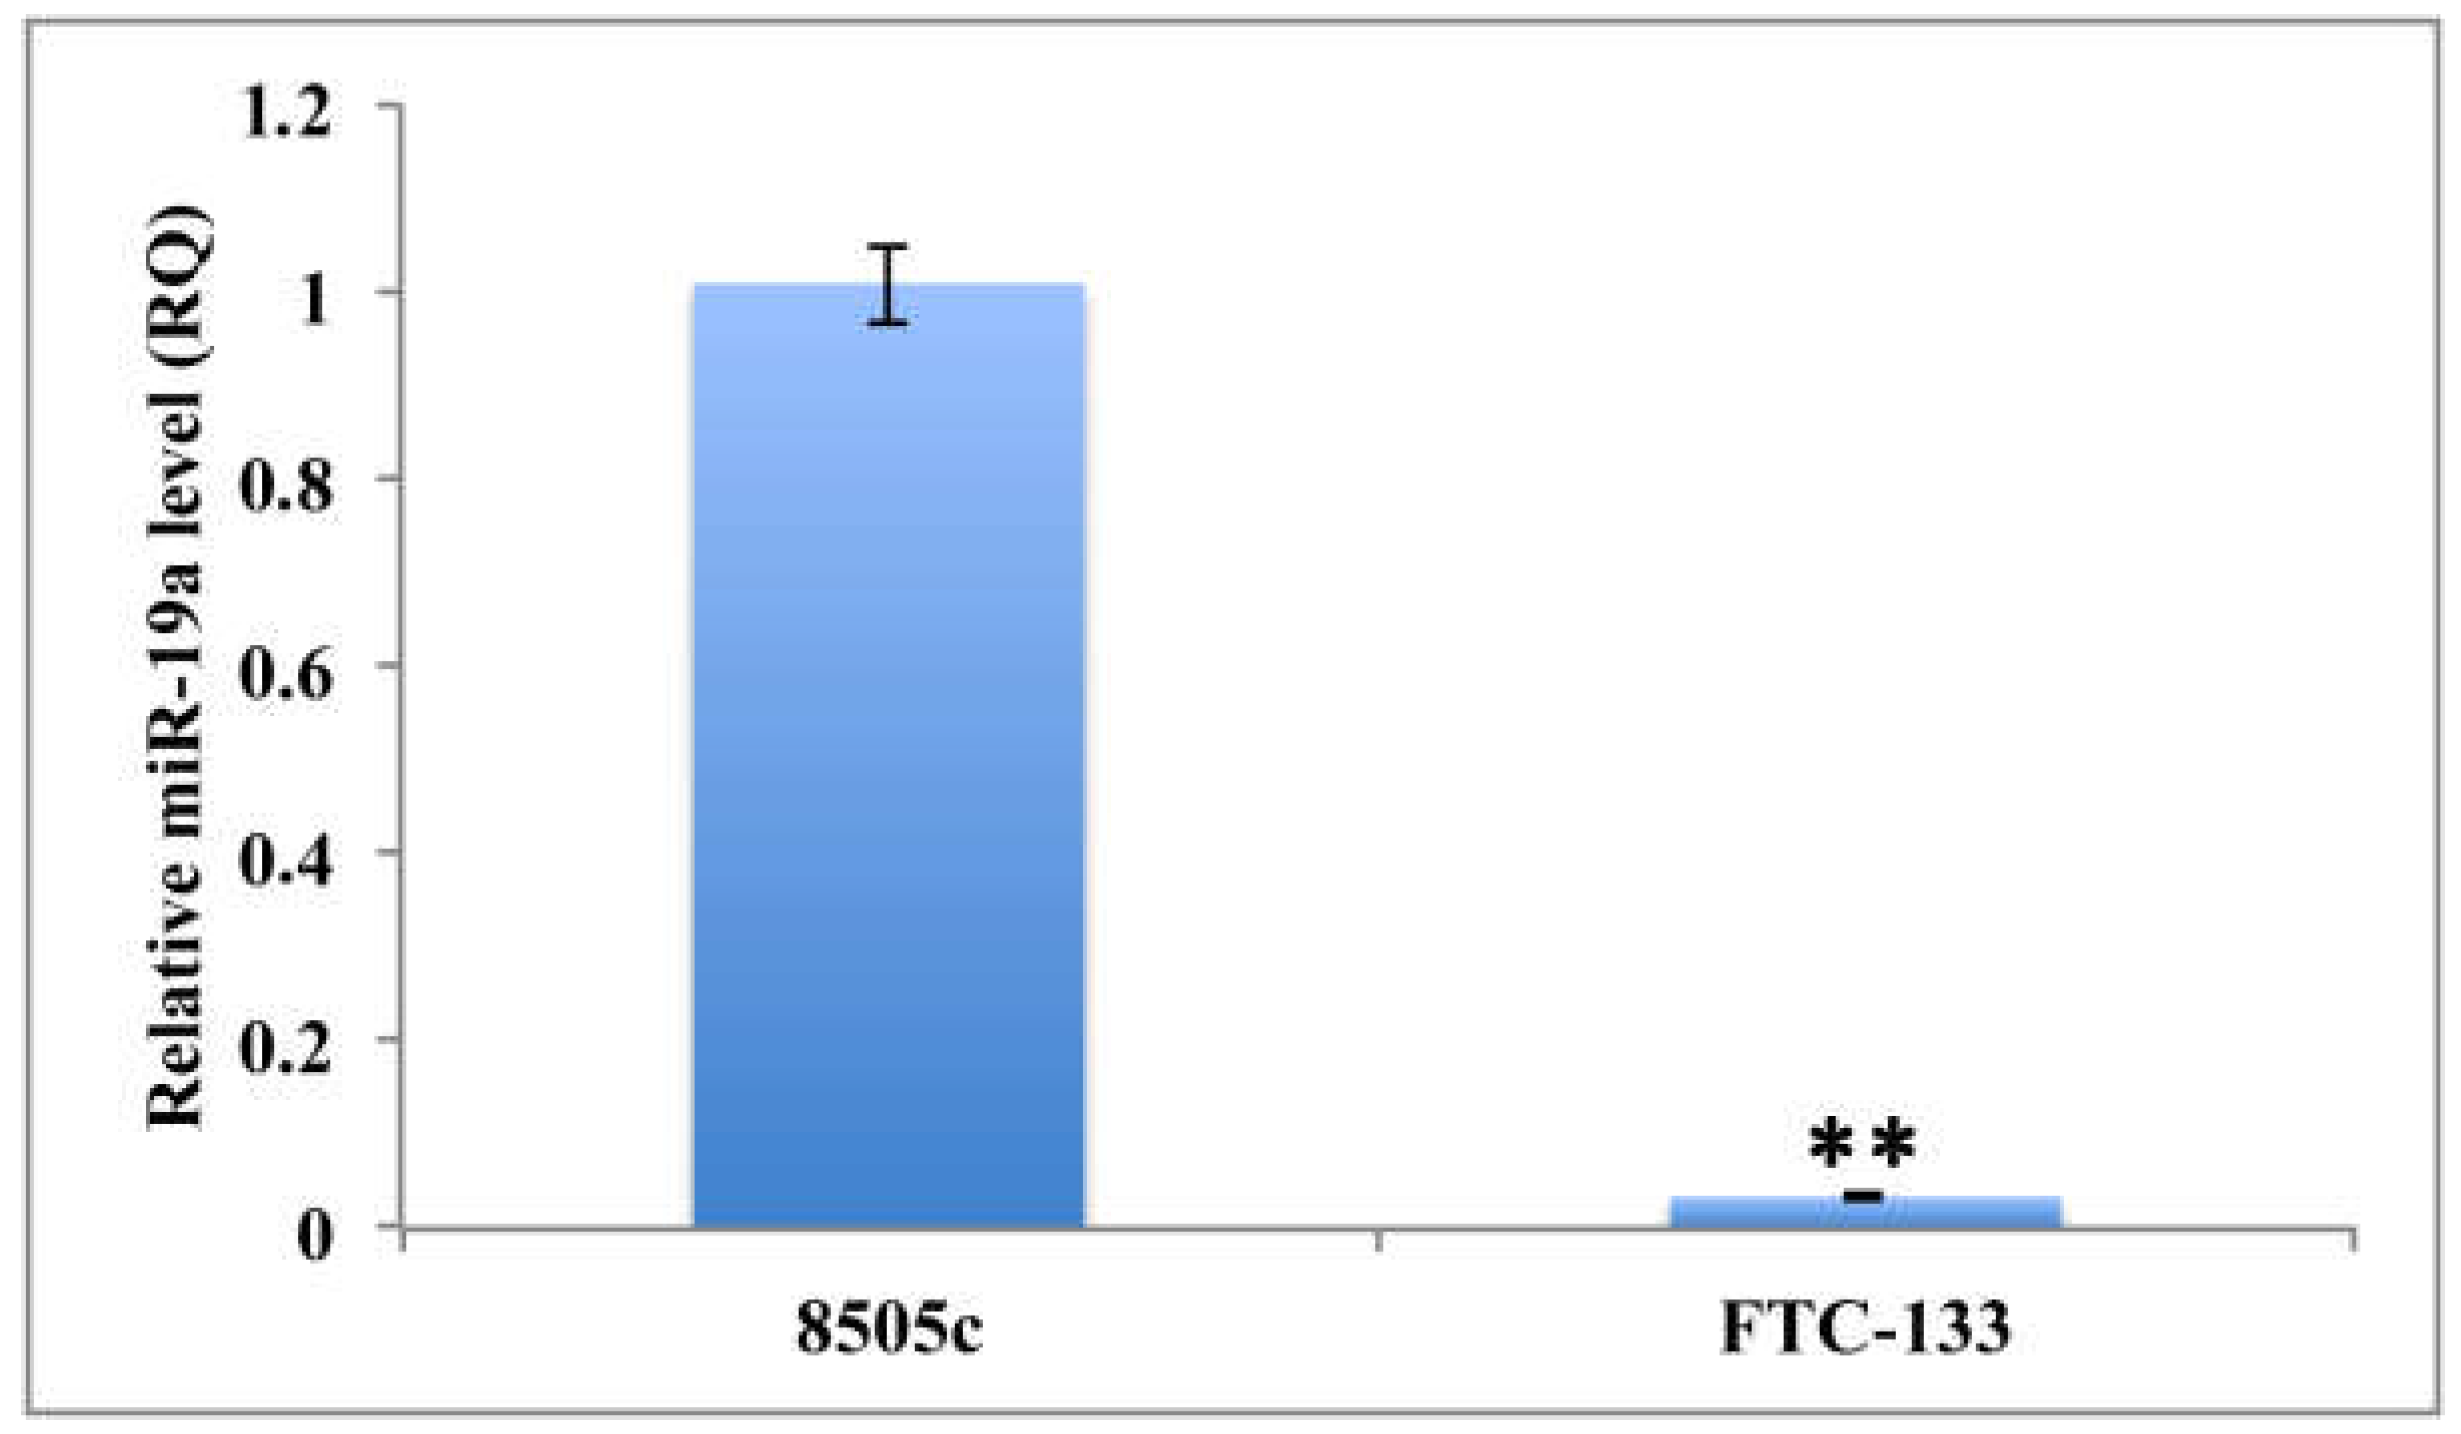
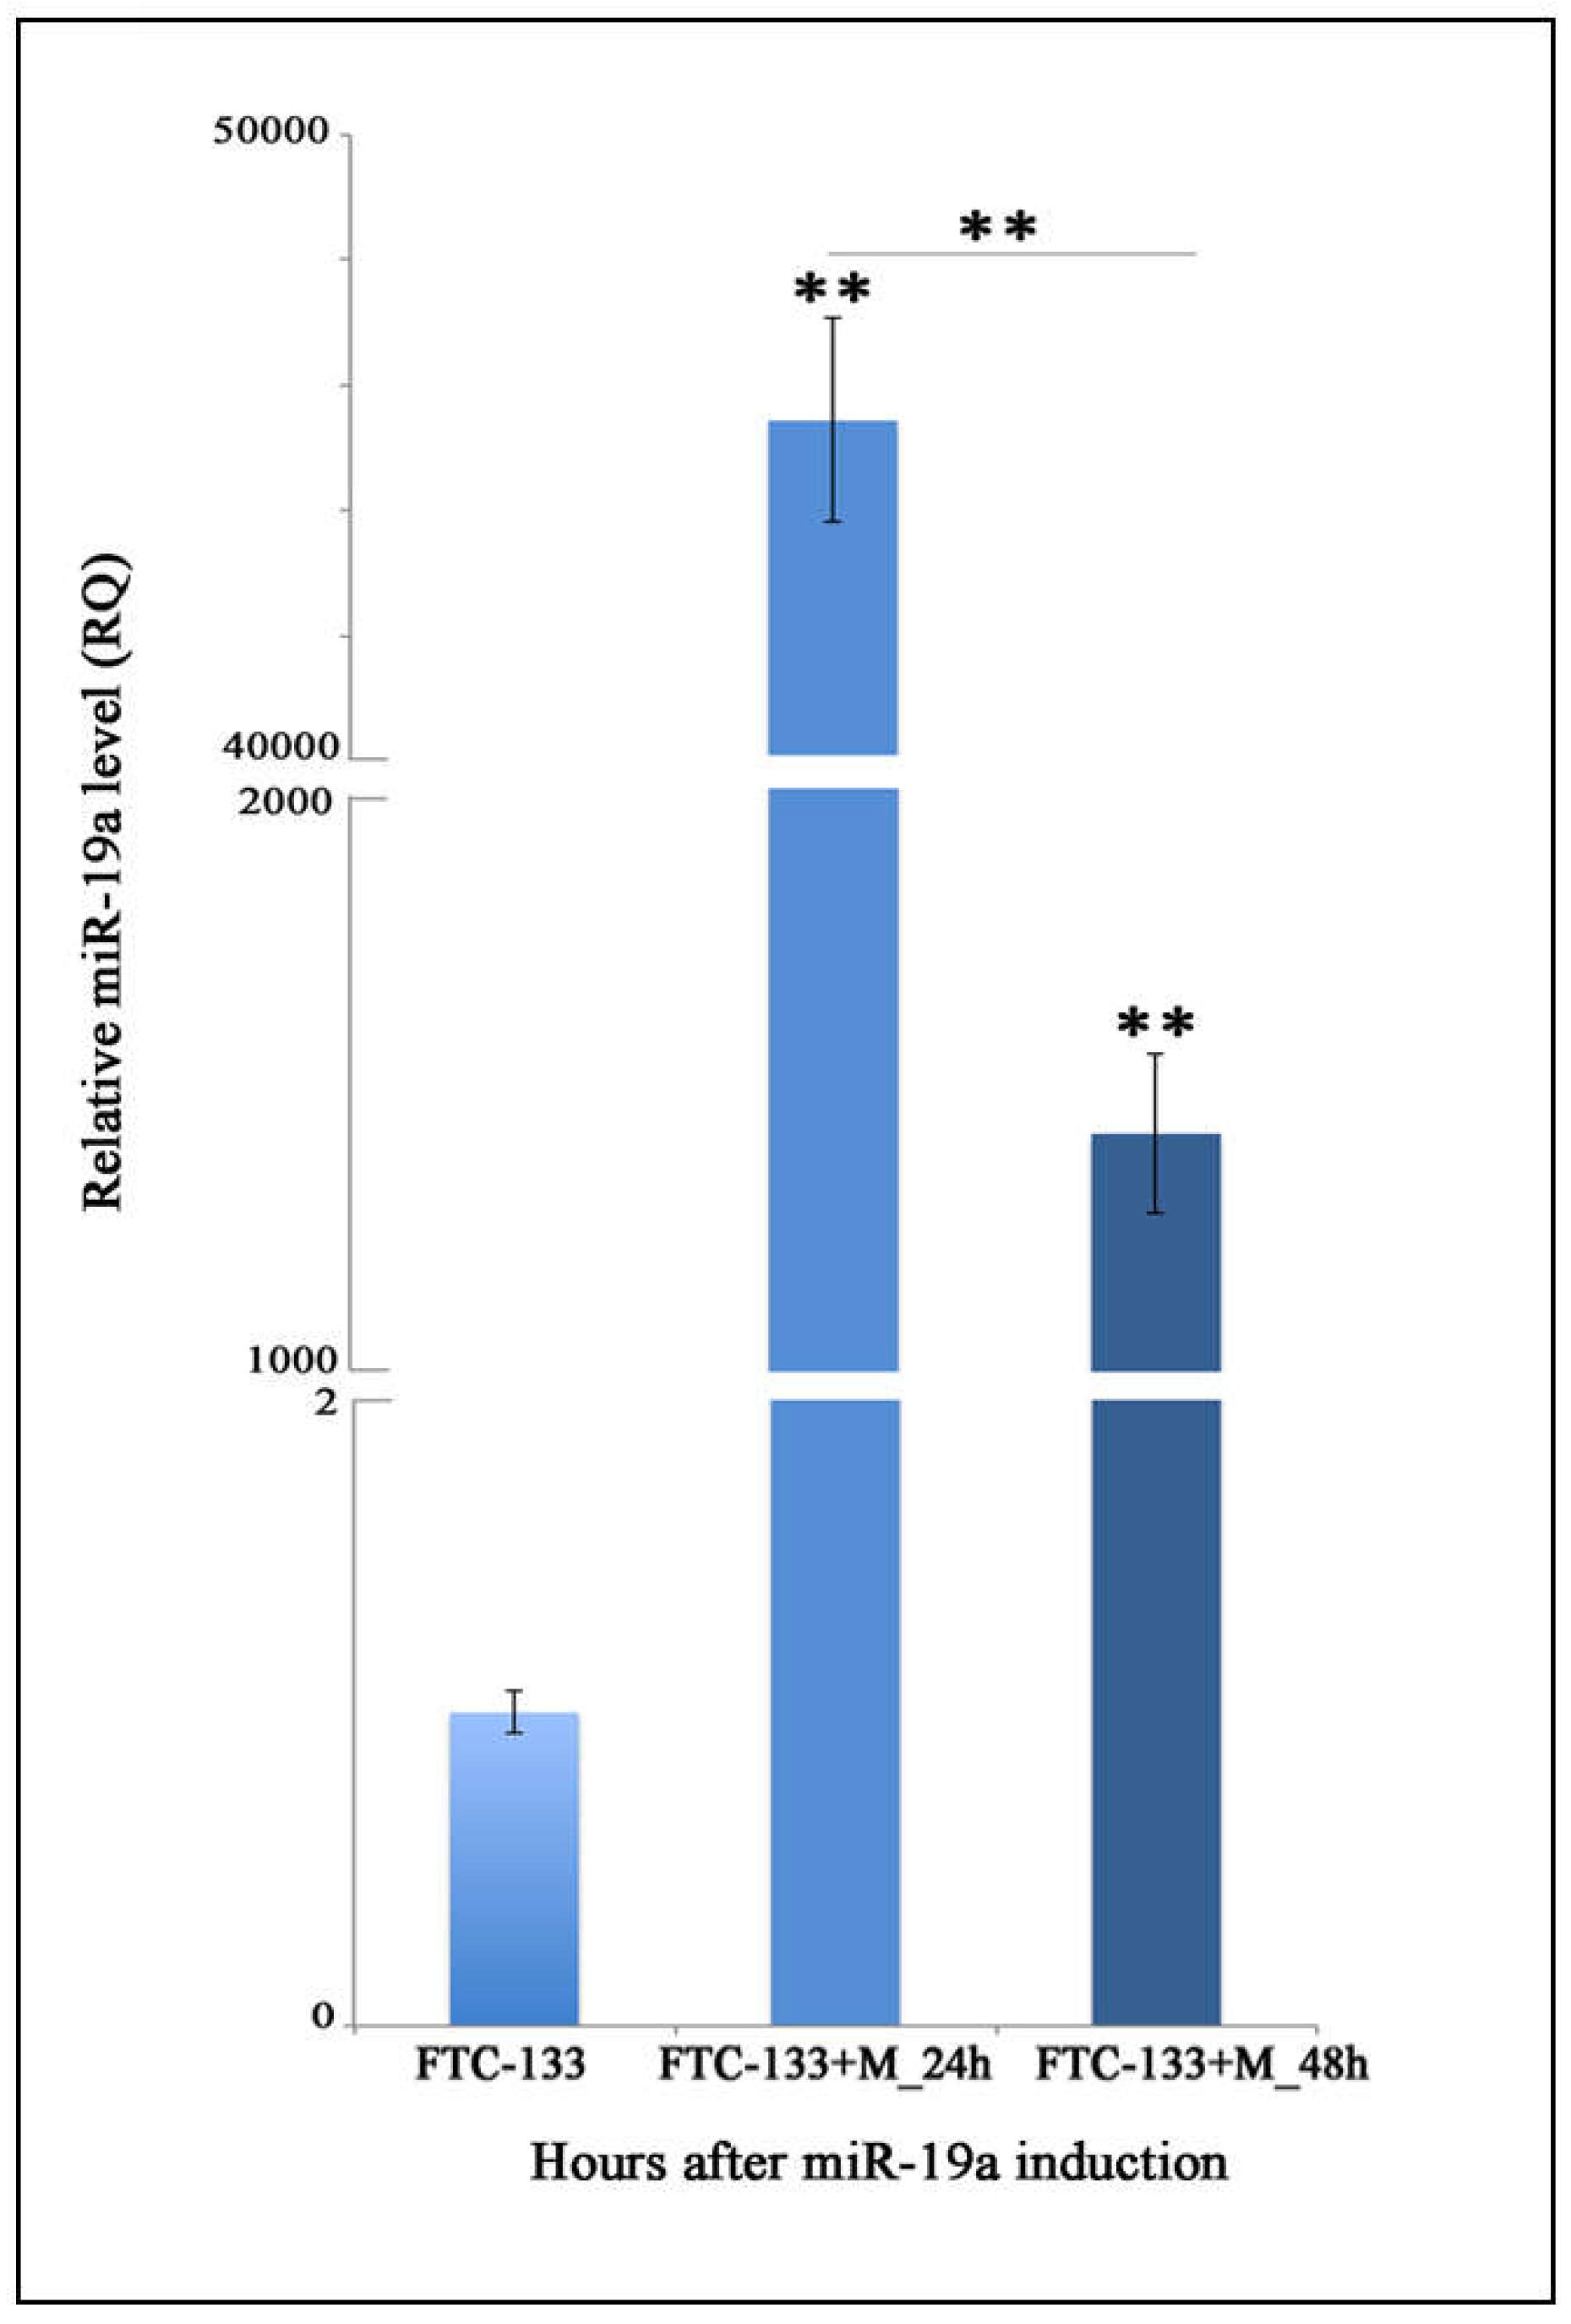
2.1. Quantitation of MiR-19a Level in Basal and Overexpressing Conditions

In order to quantify the expression levels of miR-19a in FTC-133 cells, at both basal and overexpressing conditions, RT-PCR analysis has been performed on total RNA. MiR-19a levels were normalized to those of control U6 snRNA and miRNA levels of cells at 24 and 48 h after overexpression were compared to those of a control group.
Specifically, to determine miR-19a basal level in the FTC-133 cell line, these cells were compared to anaplastic thyroid carcinoma cells (8505c cell line). Our analysis demonstrated that FTC-133 cells exhibit significantly more reduced expression of miR-19a compared to the 8505c (RQ = 0.0339; ** p < 0.01; Figure 1). Furthermore, we quantified miR-19a expression level in FTC-133 cells after miR mimic overexpression and observed a significant increase at both time points (24 and 48 h) compared to the control levels (FTC-133+M_24 h: RQ = 45435.265; FTC-133+M_48 h: RQ = 1389.312; ** p < 0.01; Figure 2) even if in FTC-133+M_24 h the miR-19a level was significantly higher (Figure 2; ** p < 0.01).

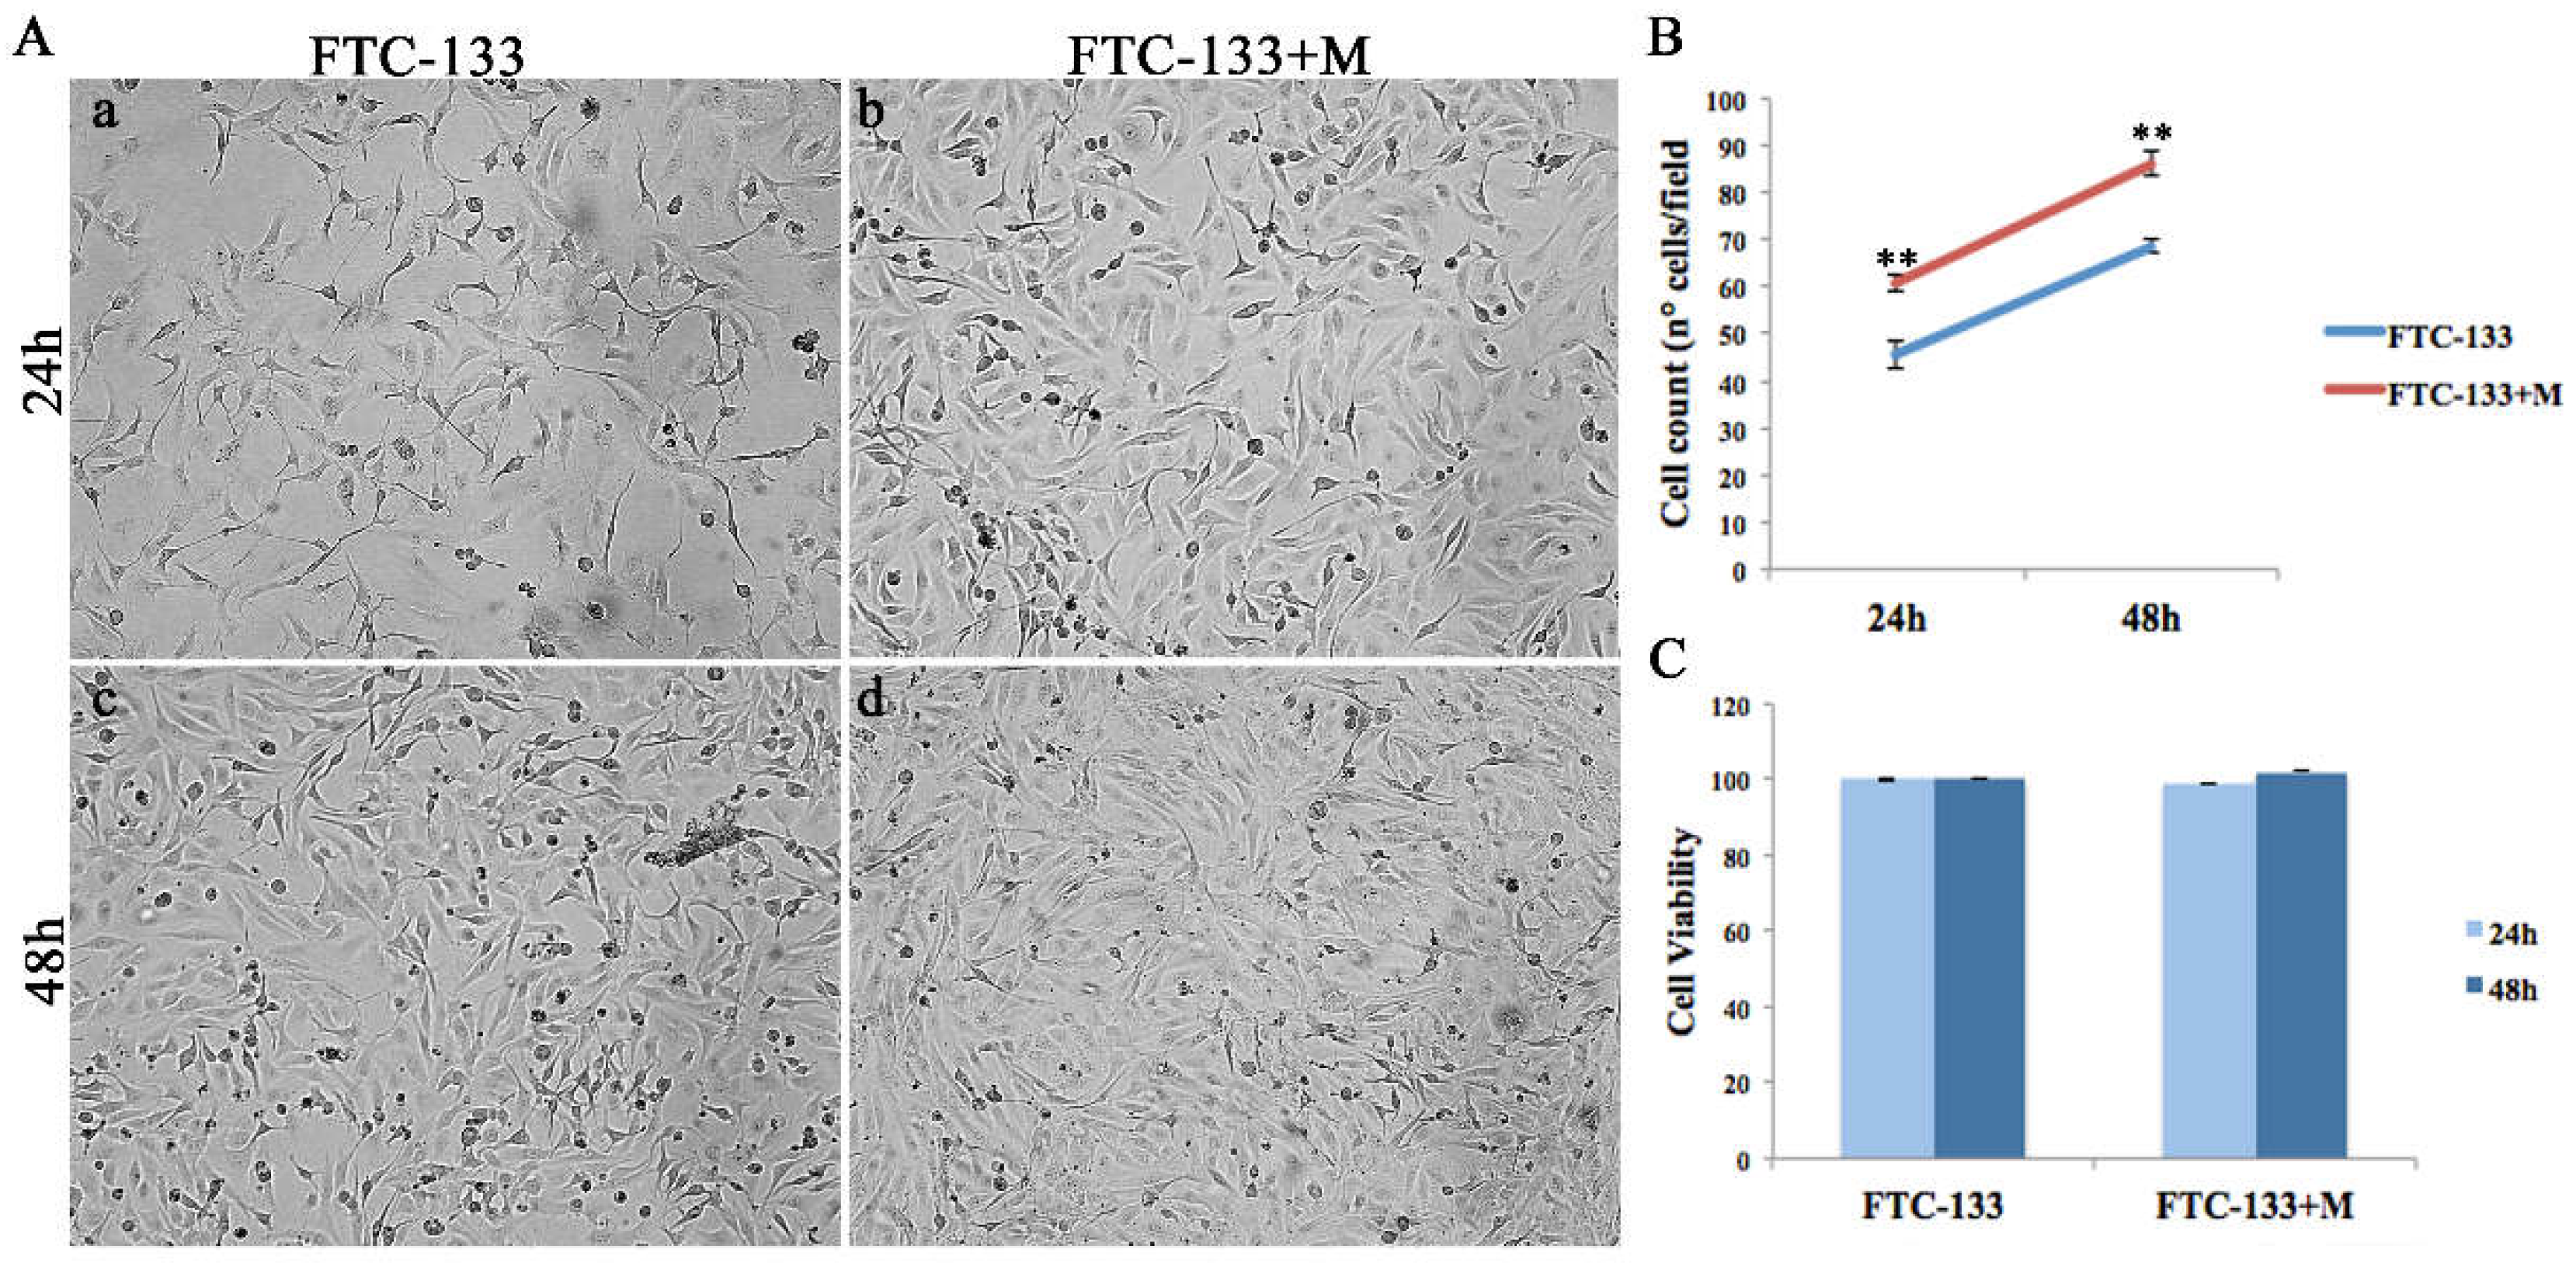
2.2. MiR-19a Overexpression on FTC-133 Induces Phenotypic Changes on Cell Morphology

The morphological analysis of miR-19a mimic overexpressing FTC-133 cells showed phenotypic changes at both analyzed time points (24 and 48 h) (Figure 3Ab,d) compared to the control (Figure 3Aa,c). Specifically, FTC-133 cells overexpressing the miR-19a mimic showed a less starry and elongated shape and an increased proliferation compared to the control cells (Figure 3Aa–d).

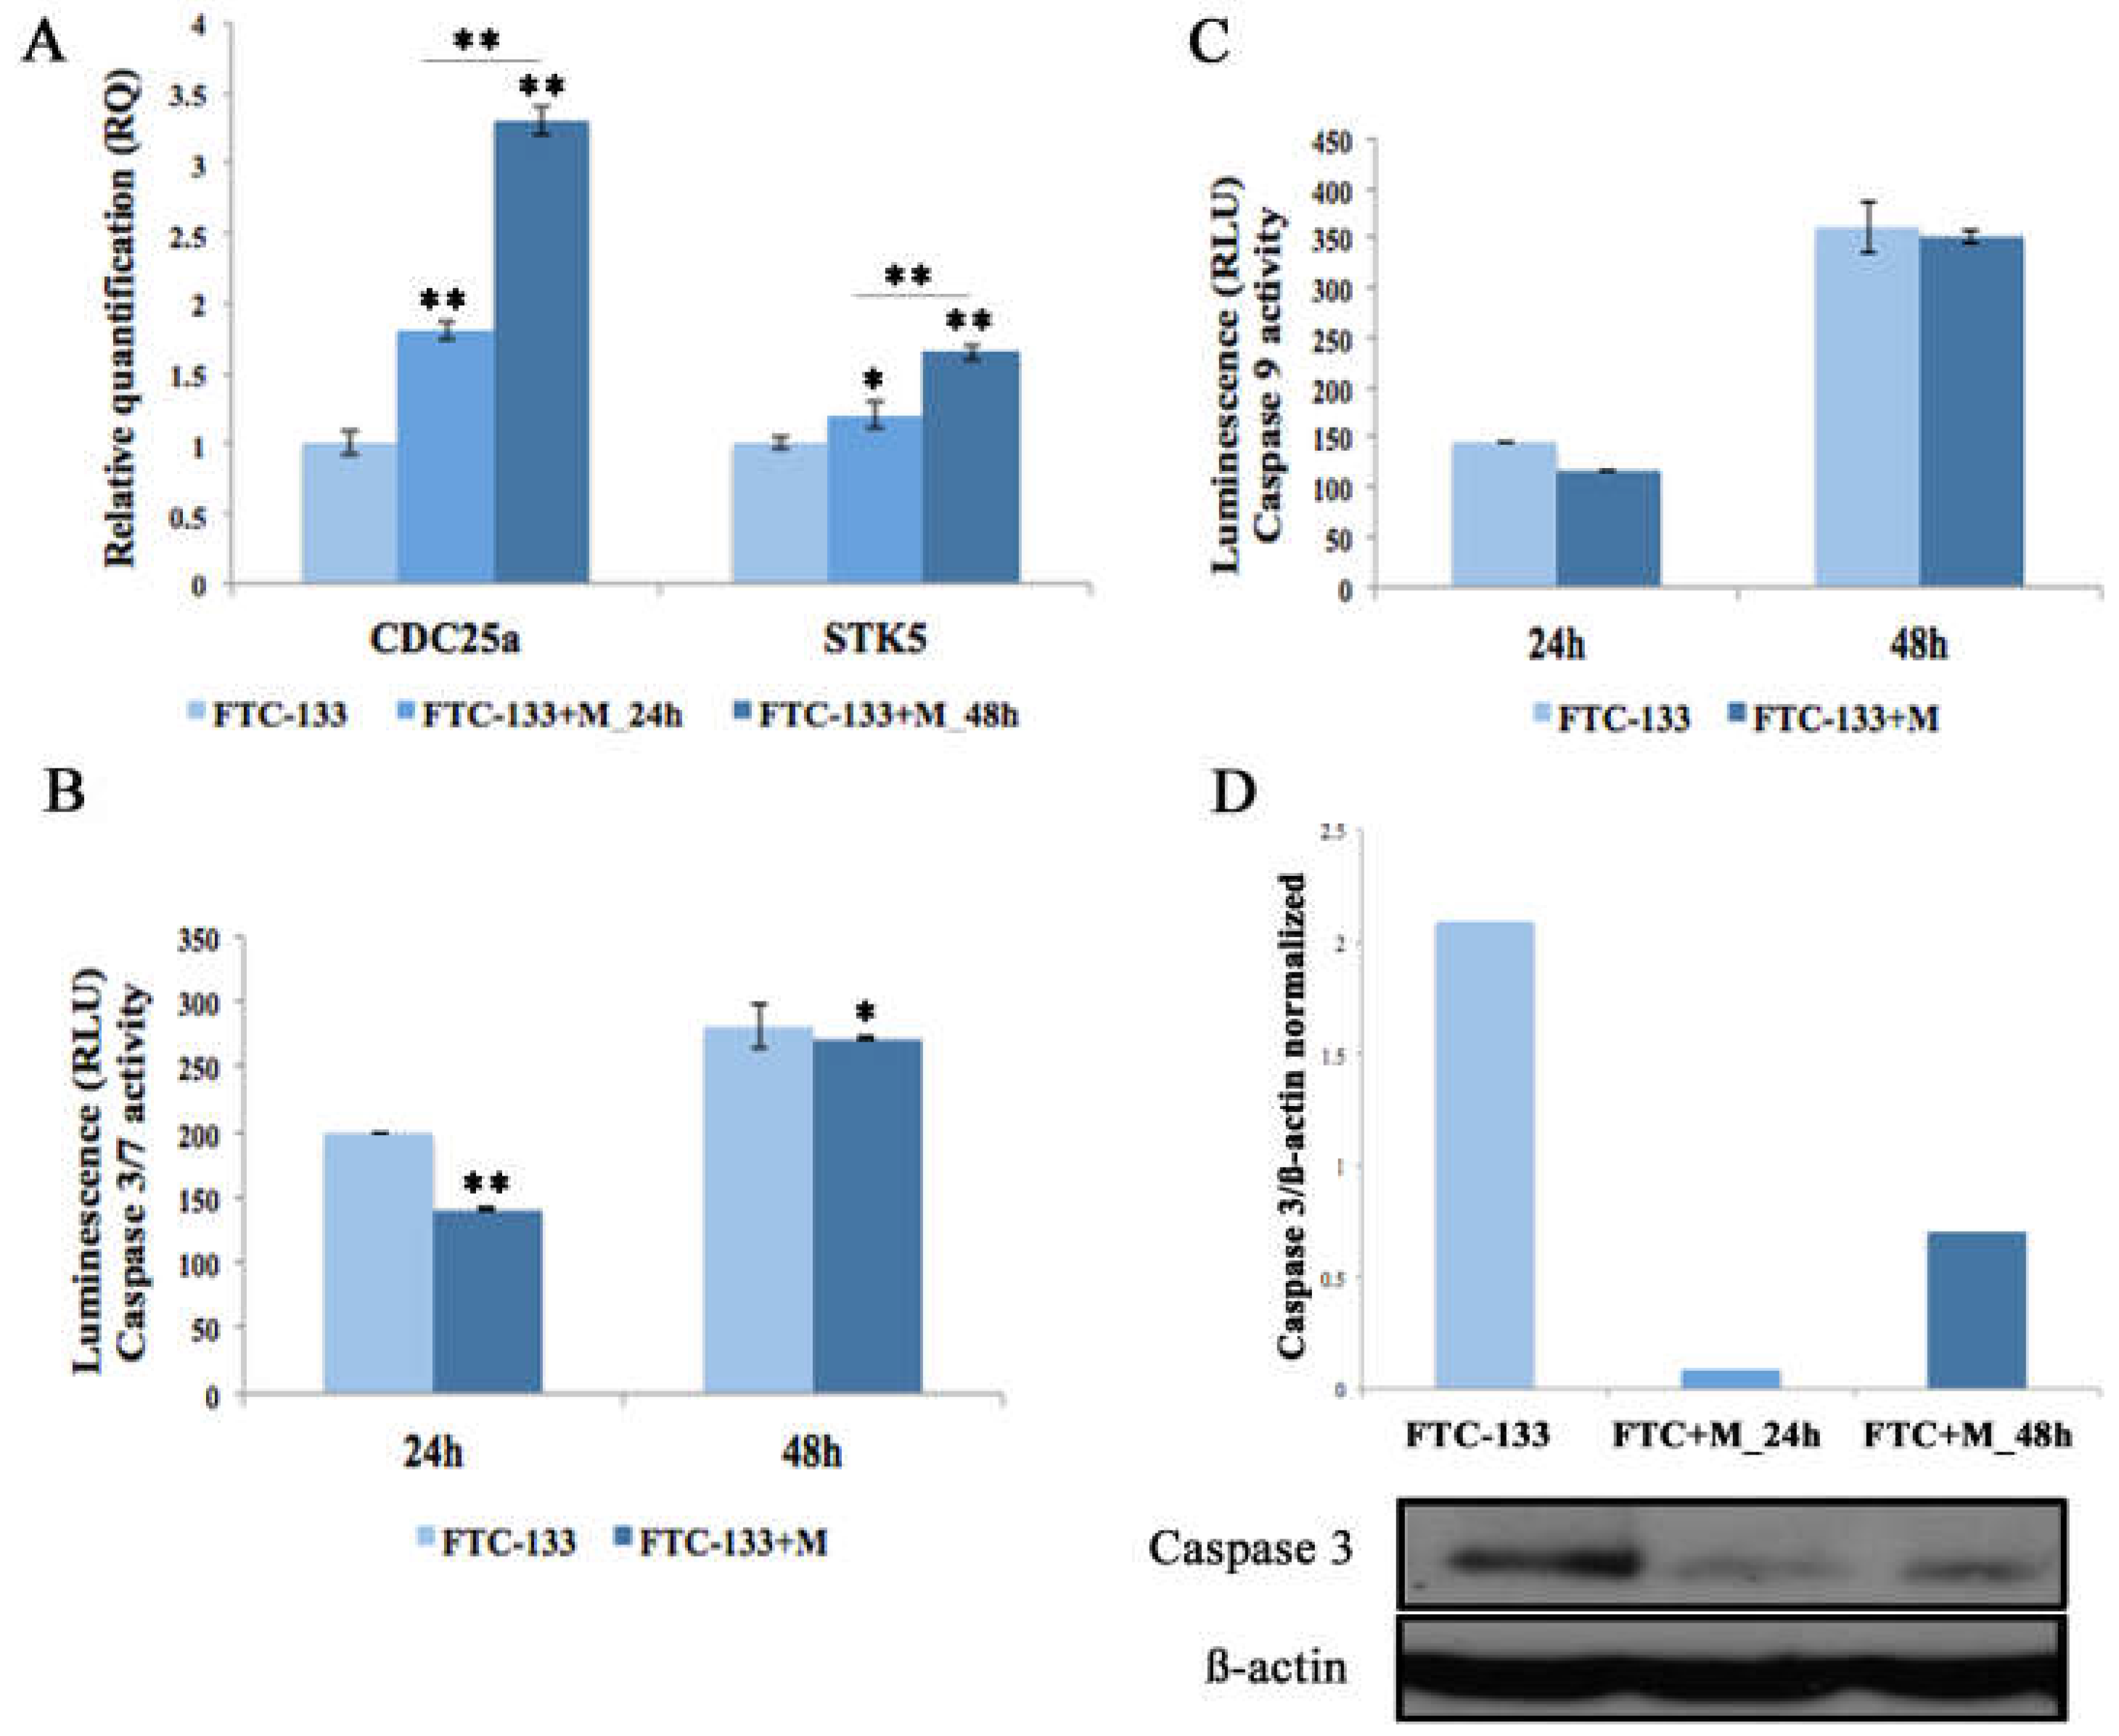
2.3. MiR-19a Overexpression on FTC-133 Promotes Proliferation and Cell Viability and Reduces Apoptosis

To evaluate the effects of miR-19a mimic overexpression on follicular thyroid carcinoma cells we analyzed proliferation, cell viability and apoptosis processes at 24 and 48 h after miR-19a overexpression (Figure 3 and Figure 4).
Both cell proliferation assays, Dapi (data not shown) and Trypan blue dye exclusion staining (Figure 3B), showed that FTC-133 cells overexpressing the miR-19a mimic revealed a significant increase at both time points (24 and 48 h) compared to the control cells (** p < 0.01). Cell viability analysis showed that there was only a slight increase between control and miR-19a mimic overexpressing cells at the time point 48 h (Figure 3C). Further, to detect the effect of miR-19a overexpression on cell growth, we analyzed two cell-cycle genes, CDC25a and Aurora kinase B (STK5) on both FTC-133 cells miR- mimic overexpressing and control cells. CDC25a on FTC-133 cells overexpressing miR-19a mimic displayed an evident up-regulation at both time points compared to the control, more marked at 48 h (Figure 4A, ** p < 0.01). Similarly, STK5 showed an increased expression at both times, 24 and 48 h, statistically more significantly at 48h (Figure 4A, 24 h ** p < 0.05 and 48 h ** p < 0.01).
On the other hand, we performed Caspase 3/7 and Caspase 9 analyses to assess the influence of miR-19a on apoptotic processes at 24 and 48 h after miR mimic overexpression. We showed that the overexpression of miR-19a mimic on FTC-133 cells, at both assessed time points, decreased Caspase 3/7 and Caspase 9 levels (Figure 4B,C) even if the differences were significant only for Caspase 3/7 (Figure 4B, 24 h ** p < 0.01 and 48 h * p < 0.05). Furthermore, we quantified the endogenous Caspase 3 level by Western blot and confirmed that miR-19a overexpression in FTC-133 reduced protein levels at both time points, especially at 24 h (Figure 4D).
In addition, to confirm the possible role of miR-19a overexpression on proliferation and cell survival, we performed miR-19a inhibition on 8505c cells and evaluated its effects at 24 and 48 h after down-regulation. Cell proliferation assay performed 24 and 48 h after miR-19a inhibition on 8505c cells showed a marked decrease only at 48 h (Supplementary Figure S1A, ** p < 0.01). MTT assay assessed on miR-19a down-expressing 8505c cells showed a statistically significant decrease of cell viability at both analyzed time points (Supplementary Figure S1B, 24 h * p < 0.05, 48 h ** p < 0.01). Caspase 3/7 and Caspase 9 analyses performed 24 and 48 h after miR-19a inhibition displayed a significant increase of both caspases only at 48 h (Supplementary Figure S1C,D Caspase 3/7 48 h ** p < 0.01, Caspase 9 48 h * p < 0.05).

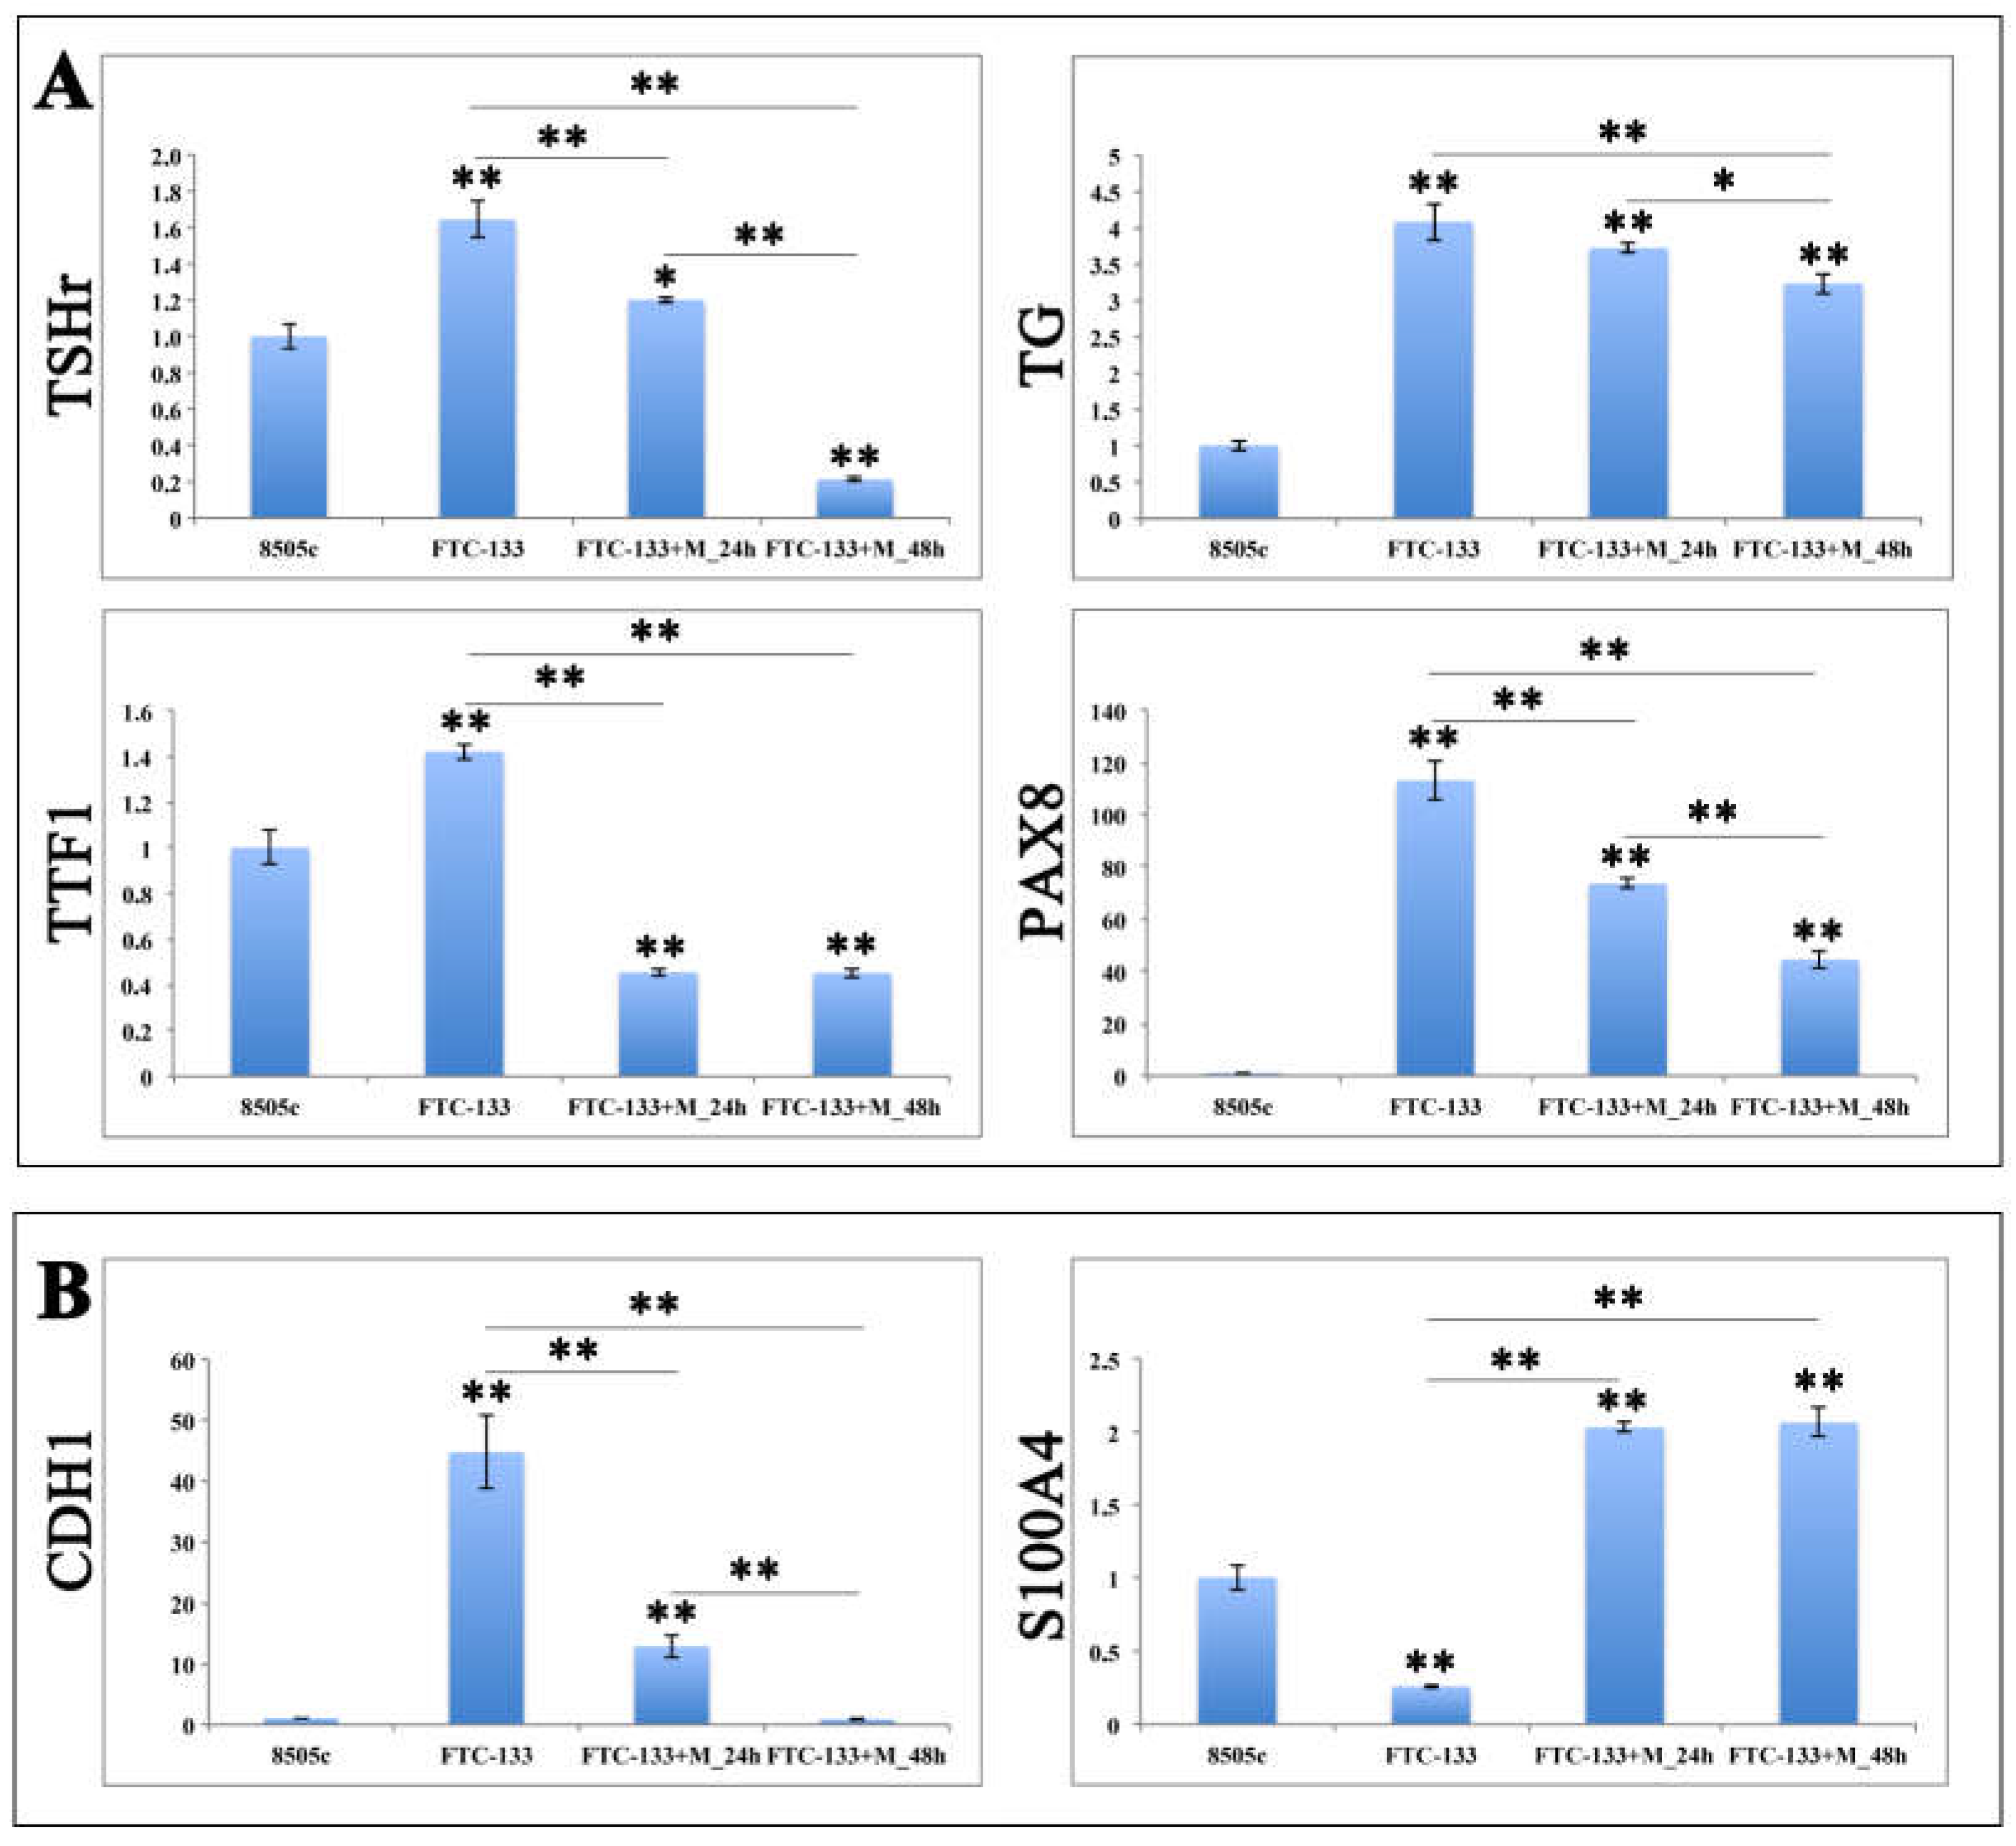
2.4. MiR-19a Overexpression on FTC-133 Alters the Expression of Genes Related to Thyroid Differentiation and Poor Prognosis

To assess if miR-19a up-regulation in FTC-133 altered the expression profile of genes correlated with thyroid cells differentiation and poor prognosis, such as in 8505c cells, we performed qRT-PCR with thyrocyte-specific markers, including thyroid stimulating hormone receptor (TSHr), thyroglobulin (Tg), transcription termination factor 1 (TTF1), paired box gene 8 (Pax8), and poor prognosis genes, including Cadherin-1 (CDH1) and S100 calcium-binding protein A4 (S100A4).
The gene expression profile of FTC-133 cells, overexpressing miR-19a mimic, displayed a statistically significant reduction of genes related to thyroid cells differentiation at 24 and 48 h after miR mimic overexpression (Figure 5A). Specifically, TSHr, Tg and Pax8 expression levels were significantly more down regulated at 24 h than at 48 h when compared to the control, while the levels of TTF1 were equally reduced at both time points. Moreover, FTC-133 cells overexpressing the miR-19a mimic exhibited an higher expression levels of Pax8 and Tg at both 24 and 48 h, compared to the 8505c group, although these were markedly down regulated compared to the FTC-133 control. On the other hand, TSHr and TTF1 were significantly lower than in 8505c, except for TSHr at 24 h (Figure 5A).
The expression profile of CDH1 and S100A4, two poor prognosis genes involved in cell migration, proliferation and invasion, exhibited a striking decrease for CDH1 in FTC-133 transfected cells overtime, compared to the FTC-133 control (Figure 5B; ** p < 0.01) and a comparable expression with 8505c cells at 48 h; while S100A4 revealed an evident constant increased at 24 and 48 h, statistically significant compared to both FTC-133 control and 8505c cells (Figure 5B; ** p < 0.01).

3. Discussion

In the last years, it has been shown that miRNAs deregulation is involved in development and progression of several types of cancers including B cell chronic lymphocytic leukemia [27], breast tumor [28], lung cancer [29], gastric tumor [30], colorectal cancer [31], glioblastoma [32], prostate tumor [33] and thyroid carcinoma [34,35]. MiR-19a is the main component responsible for the oncogenic activity of miR-17-92, promoting the growth and migration of tumor cells [36].
MiR-19a is overexpressed in a great quantity of solid tumors, such as bladder cancer [37], myeloid leukemia [38], colorectal cancer [39,40], gastric cancer [41], multiple myeloma [42], lung cancer [43], ovarian cancer [44], glioma [45,46], clear cell renal cell carcinoma [47], and anaplastic thyroid carcinoma [23]. Moreover, the miR-19a oncogenic role was described in laryngeal squamous cell carcinoma, correlating with lymph node metastasis, poor differentiation and diminished overall survival [48]; it also promotes cell proliferation of bladder cancer cells [37] and it is involved in growth, invasion and migration of non-small cell lung cancer [49].
MiR-19a is also involved in tumor development by promoting cell proliferation and migration, as well as by reducing apoptosis. For example, Liu et al. reported that miR-19a promotes cell proliferation and migration in colorectal cancer cells and accelerates tumor growth in xenograft mice [39]; Fu et al., demonstrated that miR-19a overexpression exerts its oncogenic activity by stimulating cell proliferation, cycle, growth and migration [50]. Finally, Paiva et al., suggested that the development of thyroid cancer derived from miR18a and miR19a altered expression depends primarily on cell-specific proteins [51].
Although miR-19a has also been found to be altered in ATC, its functional involvement is still poorly investigated.
ATC, which is the most aggressive and fatal thyroid neoplasia characterized by uncontrolled growth, high invasiveness and not responsive to surgery and radioiodine, originates from the de-differentiation of a pre-existing well-differentiated or poorly differentiated thyroid carcinoma [52,53,54]. Among conditions and factors promoting ATC, several genetic alterations have been described including mutations in tumor suppressor TP53, MAPK signaling (RAS and BRAF genes), PI3K signaling (PIKCA and PTEN), and Wnt signaling (β-catenin and APC) [55,56,57,58,59].
The BRAF1799T>A mutation, causing the BRAFV600E oncoprotein, is very frequent in well differentiated thyroid cancer and in ATC derived from PTC [60]. Fuziwara et al., in their study demonstrated that BRAFV600E activates miR-17-92 via upregulation of Notch signaling [61].
However, given the severity of this neoplasm, because the scenario that characterizes ATC is still largely unknown, it becomes essential to evaluate the involved functional aspects to identify new and more promising therapeutic targets.
In this study, we firstly investigated miR-19a overexpression in FTC. Thus, to assess the association of miR-19a overexpression with de-differentiation and malignancy of thyroid cancer, we induced miR-19a expression in a well-differentiated thyroid tumor cell line, FTC, and analyzed the expression profile of specific markers of clinical relevance in the poor prognosis and thyroid cells differentiation. We found that miR-19a overexpression significantly increases the cell proliferation and reduces apoptosis consistently with the miR-19a role in other cancers [43,62]. Since it is known that PTEN [63] is one of the predicted targets of miR-19a, it is also possible that miR-19a overexpression might be associated with PTEN inactivation inducing cell proliferation in FTC-133, while its inhibition promotes PTEN activation inducing cell growth reduction. In a recent study, Frisk et al. have suggested that PTEN suppression is associated in extremely malignant or late-stage thyroid tumors, including ATC [64]. These results suggest that miR-19a leads to the poor prognosis in follicular thyroid cancer cells through stimulating cell proliferation.
Furthermore, we demonstrated that miR-19a overexpression correlates with the loss of the most differentiated phenotype, as suggested by the marked down regulation of TSHr, Tg, TTF1 and Pax8, specific genes and transcription factors associated to the thyroid cells differentiation [65,66,67,68]. TTF1 (also known as Nkx2-1) and Pax8 are two key genes for thyroid gland development and morphogenesis [69] and their expression is critical for the thyroid differentiated phenotype and for the transcriptional activation of the differentiation markers, such as Tg and TSHr [67,70,71]. Several studies reported that the neoplastic thyroid cells de-differentiation is correlated with the reduction or even the loss of specific thyroid genes, Tg and TSHr, and their transcription factors, TTF1 and Pax8 [72,73]. Our data support the idea that the decrease or loss of expression of thyroid cells differentiation markers is associated with the most de-differentiated phenotype of thyroid neoplasia.
Finally, we demonstrated that miR-19a is involved in malignant phenotype and aggressiveness as shown by the consistent increase S100A4, a main component of S100 family proteins, strictly associated to the malignant phenotype and metastatic behavior of various tumors [74,75,76] and decrease of CDH1, an E-cadherin, which down expression is found in several types of cancer and relates with infiltrative and metastatic behavior [77,78,79,80].
In conclusion, the present work supports the idea that the miR-19a may be involved in de- differentiation and in the “poorer prognosis” of thyroid cancer, thus suggesting that this miRNA could represent a good prognostic indicator and a valid therapeutic target for highly malignant anaplastic tumors, although additional studies on human samples are also needed in order to prove the association of miR-19a expression with the relevant clinicopathological factors and prognosis.

4. Material and Methods

4.1. Cell Culture

FTC-133 (Sigma-Aldrich, Italy) and 8505c (Sigma-Aldrich, Italy) human cell lines were used in this analysis. FTC-133 cells were cultured in DMEM: Ham’s F12 (1:1) (Sigma-Aldrich, Italy) supplemented with L-Glutamine 2 mM (Euroclone, Italy), penicillin/streptomycin/amphotericin (PSA) (Euroclone, Italy), and 10% Fetal Bovine Serum (FBS) (Sigma-Aldrich, Italy), while 8505c cells were grown in EMEM (Sigma-Aldrich, Italy) containing 1% of non-essential amino acids, L-Glutamine 2 mM, PSA and 10% FBS. Cells were maintained in a humidified environment at 37 °C and 5% CO2. The medium was replaced twice a week and cells were split at about 80% to 90% of confluence.

4.2. MiRNA Mimic/Inhibitor Transfection on FTC-133 and 8505c Cells

FTC-133 and 8505c cells were transfected, respectively, with specific mirVana miRNA mimic and inhibitor (hsa-miR-19a-p3; Life Technologies, Camarillo, CA, USA) in accordance with the manufacturer’s instructions. Briefly, both Lipofectamine RNAiMAX reagent (ThermoFischer Scientific, Italy) and miRNA (10 µM initial concentration) were dilute in Opti-MEM Medium (ThermoFischer Scientific, Italy). MiRNA solution was supplemented with an equivalent volume of Lipofectamine RNAiMAX reagent (1:1 ratio) and the resulting mix was incubated for 5 min at room temperature. After, the mix (miRNA mimic /inhibitor final concentration 0.1 µM) was added to 0.25 × 10⁶ cells/6-well, as reported by the manufactures protocol. Lastly, transfected cells were incubated in a humidified environment at 37 °C and 5% CO2/95% air atmosphere for 24 and 48 h. Cells transfected only with the transfecting agent were used as control. Cell morphology was analyzed, and digital images were acquired using a Leica DMI4000B microscope.

4.3. Cell Proliferation Analysis Through DAPI and Trypan Blue Staining

For DAPI staining, FTC-133 cells were fixed in 4% PFA for 15 min and permeabilized in 0.3% Triton X-100 for 5 min. Successively, the cells were washed three times with PBS and the nuclei stained with DAPI (1:5000) in PBS for 5 min. Slides were mounted in fluorescent mounting medium Permafluor (Thermo Scientific) and digital images were acquired using a Leica DMI4000B fluorescence microscope. At least five images from each sample were taken for the count. Cell count analysis has been performed using Fiji image recognition software. For trypan blue dye exclusion staining we added 0.1 mL of trypan blue solution (0.4% in PBS) to 0.1 mL of cells, and after loaded on a hemacytometer, we counted immediately under a microscope at low magnification the number of blue staining cells and the number of total cells.

4.4. Measurement of Cell Viability Through MTT Assay

The cell viability of the two different cell samples, treated with only transfecting agent and treated with miR mimic or miR-inhibitor, was measured using an MTT [3-(4,5-dimethylthiazol-2-yl)-2,5-diphenyltetrazolium bromide] (Sigma-Aldrich, Italy) assay. Specifically, 24 and 48 h after cell transfection the medium from each well was removed and replaced with 200 µL of MTT solution (1 mg/mL in FBS-free medium). Following 2 h incubation at 37 °C and 5% CO2 MTT solution was removed, each well was washed two times using cold PBS 0.01 M, and the formed crystals were melted using 200 μL of DMSO. Next, the absorbance at 570 nm was read using a synergy HT plate reader (BioTek Instruments, Inc., VT, United States).

4.5. Caspase-3/-7 and Caspase-9 Analyses

Briefly, the Caspase-Glo® 3/7 or 9 Buffer and lyophilized Caspase-Glo® 3/7 or 9 Substrate (Promega, Milan, Italy) as well as the 96-well plates containing cells were equilibrated at room temperature (10 min). Caspase-Glo® 3/7 or 9 Buffer was mixed with Caspase-Glo® 3/7 or 9 Substrate by inverting the contents. A total of 50 µL of the mixed solution was added to an identical volume of each sample, in agitation by using a plate shaker at 500 rpm for 1 min, and the plates left to incubate at room temperature for 1 h. A blank reaction, consisting of Caspase-Glo® 3/7 or 9 Reagent and only vehicle was used as control. The luminescence of each sample was read using a synergy HT plate reader (BioTek Instruments, Inc., VT, United States).
For Western blot analysis, cell pellets were homogenized in lysis buffer (Tris-HCl pH 7.4, 1% Triton X100, NaCl 150 mmol/L and EDTA 1 mmol/L) supplemented with a cocktail of protease inhibitors (1:100, Sigma). For the quantification, 40 µg of protein were separated on a precast 4% to 20% tris-glycine gel (Thermo Scientific, Rockford, IL, USA) and transferred to a nitrocellulose membrane. After blocking the following primary antibodies: Mouse caspase 3 (Santa Cruz, 1:500) and mouse ß-actin (Santa Cruz, 1:500). After three washes in TBST, the membranes were incubated with anti-mouse HRP-conjugated secondary antibody (Thermo Scientific group; 1:6000) for 1 h at RT. Peroxidase activity was developed by enhanced chemiluminescent substrate (Pierce Biotechnology Inc., Thermo Scientific) and visualized by autoradiography. The density of each band was quantified using ImageJ analysis software and to ß-actin levels measured in the same membrane.

4.6. qRT-PCR

For qRT-PCR analyses total RNA from FTC-133 cells was isolated 24 and 48 hours after miR mimic transfection using RNeasy Mini Kit (Qiagen, Germantown, MD, USA) and quantified as previously described [81]. Three independently cultured samples were used for each of the two time points. cDNA was synthesized from 1 µg of total RNA using ImProm-II Reverse Transcription System (Promega, Milan, Italy). qRT-PCR was performed using SYBR Green method on a 7900HT Real Time PCR using manufactures protocol (Applied Biosystems). Specific primers for each of the investigated molecular endpoint were designed using primer blast and selecting exon-exon junctions on mRNA as target region for annealing. Each sample was tested in triplicate and gene expression was assessed using the 2−ΔΔCt method. RNA from control cells was used as reference for relative expression quantitation. The following primers for qRT-PCR were used: CDH1 F: TGCCCAGAAAATGAAAAAGG, R: GTGTATGTGGCAATGCGTTC; S100A4 F: GTGACGCCCTGTCTCTAAGC, R: ATAGCAACAGCGTGTGCAAG; Tg F: AACCCCATTGTGTTCTCAGC, R: CATTAGCCCAGGCTTCAGAG; Pax8 F: AAGGTGGTGGAGAAGATTGG, R: GCTGCTCTGTGAGTCAATGC; TSHr F: ATGGGGATGTACCTGCTCCT, R: AATGAGATTGGGGCCATGCA; TTF1 F: GCCTCAGTCAGAATCCCACC, R: GGTATGCACTCTCGAGGCTC; CDC25a F: GGCAAGCGTGTCATTGTTGT; R: GGCTCACAGTAAGACTGGCA; STK5 F: GTGTACTTGGCTCGGGAGAA; R: CAGCTCTTCTGCAGCTCCTT; GAPDH F: GGAAGGTGAAGGTCGGAGT, R: TGGGTGGAATCATATTGGAA.
Glyceraldehyde 3-Phosphate Dehydrogenase (GAPDH) was used as a reference gene. Expression Suite Software v1.1 was used for data analysis.
The expression levels of miR-19a in FTC-133 after overexpression were calculated as described by Yang and colleagues [82,83]. The following primer sequences were used: miR-19a, RT: 5’-GTCGTATCCAGTGCAGGGTCCGAGGTATTC GCACTGGATACGACTCAGTTT-3’; F: 5’-CTGGAGTGTGCAAATCTATGC-3’; R: 5’-GTGCAGGGTCCGAGGT-3’; U6, RT: 5’-AAAATATGGAACGCTTCACGAATTTG-3’; F: 5’-CTCGCTTCGGCAGCACATATACT-3’; R: 5’-ACGCTTCACGAATTTGCGTGTC-3’. The relative expression level of miR-19a was calculated using 2−ΔΔCt method, with the CT values normalized using U6 as an internal control.

4.7. Statistical Analysis

Statistical analysis was performed by Student t-test and one-way ANOVA. Tukey HSD (Honestly Significant Difference) method was used as a post hoc test when the ANOVA reported statistically significant differences, to evaluate the differences between the individual time-points or treatment groups.

Supplementary Materials

The following are available online at https://www.mdpi.com/1422-0067/19/12/3944/s1, Figure S1: MiR-19a inhibitor effects on 8505c proliferation, cell viability and apoptosis.

Author Contributions

All authors had substantial contribution to the present work. Conceptualization, G.C. and R.P.; Data curation, G.C. and A.Z.; Funding acquisition, R.G. and R.P.; Methodology, A.D. and F.T.; Resources, R.P.; Supervision, R.P.; Writing—review & editing, G.C. and R.P.; G.C. is also the corresponding author. All the authors gave the final approval of the version to be published.

Acknowledgments

This manuscript was supported by University of Catania (“Piano per la ricerca 2016-2018–Linea d’intervento 2” entitled: “Identification of cancer driver genes for novel diagnostics and therapeutic strategies”) to R.G. and R.P.; A.D. was supported by a research fellowship no. 4676/2017 from the Biometec, University of Catania, Italy.

Conflicts of Interest

The authors declare no conflict of interest.

References

  1. Kitahara, C.M.; Sosa, J.A. The changing incidence of thyroid cancer. Nat. Rev. Endocrinol. 2016, 12, 646–653. [Google Scholar] [CrossRef] [PubMed]
  2. Wartofsky, L. Increasing world incidence of thyroid cancer: Increased detection or higher radiation exposure? Hormones (Athens) 2010, 9, 103–108. [Google Scholar] [CrossRef] [PubMed] [Green Version]
  3. Kondo, T.; Ezzat, S.; Asa, S.L. Pathogenetic mechanisms in thyroid follicular-cell neoplasia. Nat. Rev. Cancer 2006, 6, 292–306. [Google Scholar] [CrossRef] [PubMed]
  4. Cooper, D.S.; Doherty, G.M.; Haugen, B.R.; Kloos, R.T.; Lee, S.L.; Mandel, S.J.; Mazzaferri, E.L.; McIver, B.; Sherman, S.I.; Tuttle, R.M. American Thyroid Association Guidelines Taskforce. Thyroid 2006, 16, 109–142. [Google Scholar] [CrossRef] [PubMed]
  5. De Lellis, R.A.; Lloyd, R.V.; Heitz, P.U.; Eng, C. World Health Organization International Classification of Tumors. In Pathology and Genetics of Tumors of Endocrine Organs, 1st ed.; IARC Press: Lyon, France, 2004. [Google Scholar]
  6. Schneider, D.F.; Chen, H.; Sippel, R.S. Impact of lymph node ratio on survival in papillary thyroid cancer. Ann. Surg. Oncol. 2013, 20, 1906–1911. [Google Scholar] [CrossRef]
  7. Gillanders, S.L.; O’Neill, J.P. Prognostic markers in well differentiated papillary and follicular thyroid cancer (WDTC). Eur. J. Surg. Oncol. 2018, 44, 286–296. [Google Scholar] [CrossRef]
  8. Khetrapal, S.; Rana, S.; Jetley, S.; Jairajpuri, Z. Poorly differentiated carcinoma of thyroid: Case report of an uncommon entity. J. Cancer Res. Ther. 2018, 14, 1142–1144. [Google Scholar]
  9. Parenti, R.; Salvatorelli, L.; Magro, G. Anaplastic Thyroid Carcinoma: Current Treatments and Potential New Therapeutic Options with Emphasis on TfR1/CD71. Int. J. Endocrinol. 2014, 2014, 685396. [Google Scholar] [CrossRef]
  10. Bartel, D.P. MicroRNAs: Genomics, biogenesis, mechanism, and function. Cell 2004, 116, 281–297. [Google Scholar] [CrossRef]
  11. Ambros, V. The functions of animal microRNAs. Nature 2004, 431, 350–355. [Google Scholar] [CrossRef]
  12. Forte, S.; La Rosa, C.; Pecce, V.; Rosignolo, F.; Memeo, L. The Role of MicroRNAs in Thyroid Carcinomas. Anticancer Res. 2015, 35, 2037–2048. [Google Scholar] [PubMed]
  13. Li, M.; Li, J.; Ding, X.; He, M.; Cheng, S.Y. microRNA and Cancer. AAPS J. 2010, 12, 309–317. [Google Scholar] [CrossRef] [PubMed]
  14. Reddy, K.B. MicroRNA (miRNA) in cancer. Cancer Cell Int. 2015, 15, 38. [Google Scholar] [CrossRef] [PubMed]
  15. Garzon, R.; Calin, G.A.; Croce, C.M. MicroRNAs in Cancer. Annu. Rev. Med. 2009, 60, 167–179. [Google Scholar] [CrossRef] [PubMed]
  16. Ferracin, M.; Negrini, M. MicroRNAs and Their Role in Cancer. ELS 2012. [Google Scholar] [CrossRef]
  17. Lewis, B.P.; Burge, C.B.; Bartel, D.P. Conserved seed pairing, often flanked by adenosines, indicates that thousands of human genes are microRNA targets. Cell 2005, 120, 15–20. [Google Scholar] [CrossRef] [PubMed]
  18. Garofalo, M.; Condorelli, G.L.; Croce, C.M.; Condorelli, G. MicroRNAs as regulators of death receptors signaling. Cell Death Differ. 2010, 17, 200–208. [Google Scholar] [CrossRef]
  19. Garofalo, M.; Quintavalle, C.; Romano, G.; Croce, C.M.; Condorelli, G. miR221/222 in cancer: Their role in tumor progression and response to therapy. Curr. Mol. Med. 2012, 12, 27–33. [Google Scholar] [CrossRef]
  20. Croce, C.M.; Calin, G.A. miRNAs, cancer, and stem cell division. Cell 2005, 122, 6–7. [Google Scholar] [CrossRef]
  21. Kozomara, A.; Griffiths-Jones, S. miRBase: Annotating high confidence microRNAs using deep sequencing data. Nucleic Acids Res. 2014, 42, D68–D73. [Google Scholar] [CrossRef]
  22. Calin, G.A.; Sevignani, C.; Dumitru, C.D.; Hyslop, T.; Noch, E.; Yendamuri, S.; Shimizu, M.; Rattan, S.; Bullrich, F.; Negrini, M.; et al. Human microRNA genes are frequently located at fragile sites and genomic regions involved in cancers. Proc. Natl. Acad. Sci. USA 2004, 101, 2999–3004. [Google Scholar] [CrossRef] [PubMed] [Green Version]
  23. Shin, V.Y.; Chu, K.-M. MiRNA as potential biomarkers and therapeutic targets for gastric cancer. World J. Gastroenterol. 2014, 20, 10432–10439. [Google Scholar] [CrossRef] [PubMed]
  24. Hu, J.; Li, C.; Liu, C.; Zhao, S.; Wang, Y.; Fu, Z. miRNAs in papillary thyroid carcinoma and their associations with the clinical characteristics of PTC. Cancer Biomark. 2017, 18, 87–94. [Google Scholar] [CrossRef] [PubMed]
  25. Panoutsopoulou, K.; Avgeris, M.; Scorilas, A. miRNA and long non-coding RNA: Molecular function and clinical value in breast and ovarian cancers. Expert Rev. Mol. Diagn. 2018. [Google Scholar] [CrossRef] [PubMed]
  26. Takakura, S.; Mitsutake, N.; Nakashima, M.; Namba, H.; Saenko, V.A.; Rogounovitch, T.I.; Nakazawa, Y.; Hayashi, T.; Ohtsuru, A.; Yamashita, S. Oncogenic role of miR-17-92 cluster in anaplastic thyroid cancer cells. Cancer Sci. 2008, 99, 1147–1154. [Google Scholar] [CrossRef] [Green Version]
  27. Calin, G.A.; Ferracin, M.; Cimmino, A.; Di Leva, G.; Shimizu, M.; Wojcik, S.E.; Iorio, M.V.; Visone, R.; Sever, N.I.; Fabbri, M.; et al. A MicroRNA Signature Associated with Prognosis and Progression in Chronic Lymphocytic Leukemia. N. Engl. J. Med. 2005, 353, 1793–1801. [Google Scholar] [CrossRef]
  28. Iorio, M.V.; Ferracin, M.; Liu, C.G.; Veronese, A.; Spizzo, R.; Sabbioni, S.; Magri, E.; Pedriali, M.; Fabbri, M.; Campiglio, M.; et al. MicroRNA gene expression deregulation in human breast cancer. Cancer Res. 2005, 65, 7065–7070. [Google Scholar] [CrossRef]
  29. Yanaihara, N.; Caplen, N.; Bowman, E.; Seike, M.; Kumamoto, K.; Yi, M.; Stephens, R.M.; Okamoto, A.; Yokota, J.; Tanaka, T.; et al. Unique microRNA molecular profiles in lung cancer diagnosis and prognosis. Cancer Cell. 2006, 9, 189–198. [Google Scholar] [CrossRef] [Green Version]
  30. Xia, J.T.; Chen, L.Z.; Jian, W.H.; Wang, K.B.; Yang, Y.Z.; He, W.L.; He, Y.L.; Chen, D.; Li, W. MicroRNA-362 induces cell proliferation and apoptosis resistance in gastric cancer by activation of NF-KB signaling. J. Transl. Med. 2014, 5, 33. [Google Scholar] [CrossRef]
  31. Michael, M.Z.; O’Connor, S.M.; van Holst Pellekaan, N.G.; Young, G.P.; James, R.J. Reduced accumulation of specific microRNAs in colorectal neoplasia. Mol. Cancer Res. 2003, 1, 882–891. [Google Scholar]
  32. Ciafrè, S.A.; Galardi, S.; Mangiola, A.; Ferracin, M.; Liu, C.G.; Sabatino, G.; Negrini, M.; Maira, G.; Croce, C.M.; Farace, M.G. Extensive modulation of a set of microRNAs in primary glioblastoma. Biochem. Biophys. Res. Commun. 2005, 334, 1351–1358. [Google Scholar] [CrossRef] [PubMed]
  33. Wang, L.; Liu, C.; Li, C.; Xue, J.; Zhao, S.; Zhan, P.; Lin, Y.; Zhang, P.; Jiang, A.; Chen, W. Effects of microRNA-221/222 on cell proliferation and apoptosis in prostate cancer cells. Gene 2015, 572, 252–258. [Google Scholar] [CrossRef] [PubMed]
  34. Marini, F.; Luzi, E.; Brandi, M.L. MicroRNA Role in Thyroid Cancer Development. J. Thyroid Res. 2011, 2011, 407123. [Google Scholar] [CrossRef] [PubMed]
  35. Pallante, P.; Visone, R.; Ferracin, M.; Ferraro, A.; Berlingieri, M.T.; Troncone, G.; Chiappetta, G.; Liu, C.G.; Santoro, M.; Negrini, M.; et al. MicroRNA deregulation in human thyroid papillary carcinomas. Endocr. Relat. Cancer 2006, 13, 497–508. [Google Scholar] [CrossRef] [PubMed] [Green Version]
  36. Bonauer, A.; Dimmeler, S. The microRNA-17-92 cluster: Still a miRacle? Cell Cycle 2009, 8, 3866–3873. [Google Scholar] [CrossRef] [PubMed]
  37. Feng, Y.; Liu, J.; Kang, Y.; He, Y.; Liang, B.; Yang, P.; Yu, Z. miR-19a acts as an oncogenic microRNA and is up-regulated in bladder cancer. J. Exp. Clin. Cancer Res. 2014, 33, 67. [Google Scholar] [CrossRef] [PubMed]
  38. Lepore, I.; Dell’Aversana, C.; Pilyugin, M.; Conte, M.; Nebbioso, A.; De Bellis, F.; Tambaro, F.P.; Izzo, T.; Garcia-Manero, G.; Ferrara, F.; et al. HDAC inhibitors repress BARD1 isoform expression in acute myeloid leukemia cells via activation of miR-19a and/or b. PLoS ONE 2013, 8, e83018. [Google Scholar] [CrossRef] [PubMed]
  39. Liu, Y.; Liu, R.; Yang, F.; Cheng, R.; Chen, X.; Cui, S.; Gu, Y.; Sun, W.; You, C.; Liu, Z.; et al. miR-19a promotes colorectal cancer proliferation and migration by targeting TIA1. Mol. Cancer 2017, 16, 53. [Google Scholar] [CrossRef]
  40. Huang, L.; Wang, X.; Wen, C.; Yang, X.; Song, M.; Chen, J.; Wang, C.; Zhang, B.; Wang, L.; Iwamoto, A.; et al. Hsa-miR-19a is associated with lymph metastasis and mediates the TNF-α inducedepithelial-to-mesenchymal transition in colorectal cancer. Sci. Rep. 2015, 5, 13350. [Google Scholar] [CrossRef]
  41. Wu, Q.; Yang, Z.; An, Y.; Hu, H.; Yin, J.; Zhang, P.; Nie, Y.; Wu, K.; Shi, Y.; Fan, D. MiR-19a/b modulate the metastasis of gastric cancer cells by targeting the tumour suppressor MXD1. Cell Death Dis. 2014, 5, e1144. [Google Scholar] [CrossRef]
  42. Chen, L.; Li, C.; Zhang, R.; Gao, X.; Qu, X.; Zhao, M.; Qiao, C.; Xu, J.; Li, J. miR-17-92 cluster microRNAs confers tumorigenicity in multiple myeloma. Cancer Lett. 2011, 309, 62–70. [Google Scholar] [CrossRef] [PubMed]
  43. Hu, W.; Jin, P.; Ding, C.; Liu, W. miR-19a/b modulates lung cancer cells metastasis through suppression of MXD1 expression. Oncol Lett. 2016, 12, 1901–1905. [Google Scholar] [CrossRef] [PubMed] [Green Version]
  44. Wang, Y.; Zhao, S.; Zhu, L.; Zhang, Q.; Ren, Y. MiR-19a negatively regulated the expression of PTEN and promoted the growth of ovarian cancer cells. Gene 2018, 670, 166–173. [Google Scholar] [CrossRef] [PubMed]
  45. Sun, J.; Jia, Z.; Li, B.; Zhang, A.; Wang, G.; Pu, P.; Chen, Z.; Wang, Z.; Yang, W. MiR-19 regulates the proliferation and invasion of glioma by RUNX3 via β-catenin/Tcf-4 signalling. Oncotarget 2017, 8, 110785–110796. [Google Scholar] [CrossRef] [PubMed]
  46. Jia, Z.; Wang, K.; Zhang, A.; Wang, G.; Kang, C.; Han, L.; Pu, P. miR-19a and miR-19b overexpression in gliomas. Pathol. Oncol. Res. 2013, 19, 847–853. [Google Scholar] [CrossRef] [PubMed]
  47. Niu, S.; Ma, X.; Zhang, Y.; Liu, Y.N.; Chen, X.; Gong, H.; Yao, Y.; Liu, K.; Zhang, X. MicroRNA-19a and microRNA-19b promote the malignancy of clear cell renal cell carcinoma through targeting the tumor suppressor RhoB. PLoS ONE 2018, 13, e0192790. [Google Scholar] [CrossRef] [PubMed]
  48. Wu, T.Y.; Zhang, T.H.; Qu, L.M.; Feng, J.P.; Tian, L.L.; Zhang, B.H.; Li, D.D.; Sun, Y.N.; Liu, M. MiR-19a is correlated with prognosis and apoptosis of laryngeal squamous cell carcinoma by regulating TIMP-2 expression. Int. J. Clin. Exp. Pathol. 2013, 7, 56–63. [Google Scholar]
  49. Yamamoto, K.; Ito, S.; Hanafusa, H.; Shimizu, K.; Ouchida, M. Uncovering direct targets of miR-19a involved in lung cancer progression. PLoS ONE 2015, 10, e0137887. [Google Scholar] [CrossRef]
  50. Fu, F.; Wan, X.; Wang, D.; Kong, Z.; Zhang, Y.; Huang, W.; Wang, C.; Wu, H.; Li, Y. MicroRNA-19a acts as a prognostic marker and promotes prostate cancer progression via inhibiting VPS37A expression. Oncotarget 2018, 9, 1931–1943. [Google Scholar] [CrossRef]
  51. Paiva, M.M.; Kimura, T.E.; Coltri, P.P. miR18a and miR19a Recruit Specific Proteins for Splicing in Thyroid Cancer Cells. Cancer Genom. Proteom. 2017, 14, 373–382. [Google Scholar]
  52. Sadow, P.M.; Faquin, W.C. Poorly differentiated thyroid carcinoma: An incubating entity. Front. Endocrinol. 2012, 3, 2–4. [Google Scholar] [CrossRef] [PubMed]
  53. Ranganath, R.; Shah, M.A.; Shah, A.R. Anaplastic thyroid cancer. Curr. Opin. Endocrinol. Diabetes Obes. 2015, 22, 387–391. [Google Scholar] [CrossRef] [PubMed]
  54. Molinaro, E.; Romei, C.; Biagini, A.; Sabini, E.; Agate, L.; Mazzeo, S.; Materazzi, G.; Sellari-Franceschini, S.; Ribechini, A.; Torregrossa, L.; et al. Anaplastic thyroid carcinoma: From clinicopathology to genetics and advanced therapies. Nat. Rev. Endocrinol. 2017, 13, 644–660. [Google Scholar] [CrossRef] [PubMed]
  55. Ricarte-Filho, J.C.; Ryder, M.; Chitale, D.A.; Rivera, M.; Heguy, A.; Ladanyi, M.; Janakiraman, M.; Solit, D.; Knauf, J.A.; Tuttle, M.R.; et al. Mutational profile of advanced primary and metastatic radioactive iodine-refractory thyroid cancers reveals distinct pathogenetic roles for BRAF, PIK3CA, and AKT1. Cancer Res. 2009, 69, 4885–4893. [Google Scholar] [CrossRef]
  56. Smallridge, R.C.; Marlow, L.A.; Copland, J.A. Anaplastic thyroid cancer: Molecular pathogenesis and emerging therapies. Endocr. Relat. Cancer 2009, 16, 17–44. [Google Scholar] [CrossRef] [PubMed]
  57. Garcia-Rostan, G.; Tallini, G.; Herrero, A.; D’Aquila, T.G.; Carcangiu, M.L.; Rimm, D.L. Frequent mutation and nuclear localization of β-catenin in anaplastic thyroid carcinoma. Cancer Res. 1999, 59, 1811–1815. [Google Scholar] [PubMed]
  58. Nikiforova, M.N.; Tseng, G.C.; Steward, D.; Diorio, D.; Nikiforov, Y.E. MicroRNA expression profiling of thyroid tumors: Biological significance and diagnostic utility. J. Clin. Endocrinol. Metab. 2008, 93, 1600–1608. [Google Scholar] [CrossRef]
  59. Fuziwara, C.S.; Kimura, E.T. MicroRNA Deregulation in Anaplastic Thyroid Cancer Biology. Int. J. Endocrinol. 2014, 2014, 743450. [Google Scholar] [CrossRef]
  60. Nikiforova, M.N.; Kimura, E.T.; Gandhi, M.; Biddinger, P.W.; Knauf, J.A.; Basolo, F.; Zhu, Z.; Giannini, R.; Salvatore, G.; Fusco, A.; et al. BRAF mutations in thyroid tumors are restricted to papillary carcinomas and anaplastic or poorly differentiated carcinomas arising from papillary carcinomas. J. Clin. Endocrinol. Metab. 2003, 88, 5399–5404. [Google Scholar] [CrossRef]
  61. Fuziwara, C.S.; Kimura, E. High Iodine Blocks a Notch/miR-19 Loop Activated by the BRAFV600E Oncoprotein and Restores the Response to TGFβ in Thyroid Follicular Cells. Thyroid 2014, 24, 453–462. [Google Scholar] [CrossRef] [Green Version]
  62. Wang, W.; Zhang, A.; Hao, Y.; Wang, G.; Jia, Z. The emerging role of miR-19 in glioma. J. Cell Mol. Med. 2018, 22, 4611–4616. [Google Scholar] [CrossRef] [PubMed]
  63. Xie, C.Y.; Kong, J.R.; Zhao, C.S.; Xiao, Y.C.; Peng, T.; Liu, Y.; Wang, W.N. Molecular characterization and function of a PTEN gene from Litopenaeus vannamei after Vibrio alginolyticus challenge. Dev. Comp. Immunol. 2016, 59, 77–88. [Google Scholar] [CrossRef] [PubMed]
  64. Forte, S.; Pagliuca, A.; Maniscalchi, E.T.; Gulino, R.; Calabrese, G.; Ricci-Vitiani, L.; Pallini, R.; Signore, M.; Parenti, R.; De Maria, R.; et al. Gene Expression Analysis of PTEN Positive Glioblastoma Stem Cells Identifies DUB3 and Wee1 Modulation in a Cell Differentiation Model. PLoS ONE 2013, 8, e81432. [Google Scholar] [CrossRef] [PubMed]
  65. Opitz, R.; Maquet, E.; Zoenen, M.; Dadhich, R.; Costagliola, S. TSH Receptor Function Is Required for Normal Thyroid Differentiation in Zebrafish. Mol. Endocrinol. 2011, 25, 1579–1599. [Google Scholar] [CrossRef] [PubMed] [Green Version]
  66. Ma, R.; Latif, R.; Davies, T.F. Thyroid Follicle Formation and Thyroglobulin expression in multipotent endodermal stem cells. Thyroid 2013, 23, 385–391. [Google Scholar] [CrossRef] [PubMed]
  67. Fabbro, D.; Di Loreto, C.; Beltrami, C.A.; Belfiore, A.; Di Lauro, R.; Damante, G. Expression of thyroid-specific transcription factors TTF-1 and PAX-8 in human thyroid neoplasms. Cancer Res. 1994, 54, 4744–4749. [Google Scholar] [PubMed]
  68. Damante, G.; Tell, G.; Di Lauro, R. A unique combination of transcription factors controls differentiation of thyroid cells. Prog. Nucleic Acid Res. Mol. Biol. 2001, 66, 307–356. [Google Scholar]
  69. Martinez Barbera, J.P.; Clements, M.; Thomas, P.; Rodriguez, T.; Meloy, D.; Kioussis, D.; Beddington, R.S. The homeobox gene Hex is required in definitive endodermal tissues for normal forebrain, liver and thyroid formation. Development 2000, 127, 2433–2445. [Google Scholar]
  70. Damante, G.; Di Lauro, R. Thyroid-specific gene expression. Biochim. Biophys. Acta 1994, 1218, 255–266. [Google Scholar] [CrossRef]
  71. Pasca di Magliano, M.; Di Lauro, R.; Zannini, M. Pax8 has a key role in thyroid cell differentiation. Proc. Natl. Acad. Sci. USA 2000, 97, 13144–13149. [Google Scholar] [CrossRef] [Green Version]
  72. Ros, P.; Rossi, D.L.; Acebrón, A.; Santisteban, P. Thyroid-specific gene expression in the multi-step process of thyroid carcinogenesis. Biochimie 1999, 81, 389–396. [Google Scholar] [CrossRef]
  73. van Staveren, W.C.G.; Solís, D.W.; Delys, L.; Duprez, L.; Andry, G.; Franc, B.; Thomas, G.; Libert, F.; Dumont, J.E.; Detours, V.; et al. Human Thyroid Tumor Cell Lines Derived from Different Tumor Types Present a Common Dedifferentiated Phenotype. Cancer Res. 2007, 67, 8113–8120. [Google Scholar] [CrossRef] [PubMed] [Green Version]
  74. Fei, F.; Qu, J.; Zhang, M.; Li, Y.; Zhang, S. S100A4 in cancer progression and metastasis: A systematic review. Oncotarget 2017, 8, 73219–73239. [Google Scholar] [CrossRef] [PubMed]
  75. Dahlmann, M.; Kobelt, D.; Walther, W.; Mudduluru, G.; Stein, U. S100A4 in Cancer Metastasis: Wnt Signaling-Driven Interventions for Metastasis Restriction. Cancers (Basel) 2016, 8, 59. [Google Scholar] [CrossRef] [PubMed]
  76. Kwak, J.M.; Lee, H.J.; Kim, S.H.; Kim, H.K.; Mok, Y.J.; Park, Y.T.; Choi, J.S.; Moon, H.Y. Expression of protein S100A4 is a predictor of recurrence in colorectal cancer. World J. Gastroenterol. 2010, 16, 3897–3904. [Google Scholar] [CrossRef] [PubMed]
  77. Yonemura, Y.; Endou, Y.; Kimura, K.; Fushida, S.; Bandou, E.; Taniguchi, E.; Kinoshita, K.; Ninomiya, I.; Sugiyama, K.; Heizmann, C.W.; et al. Inverse Expression of S100A4 and E-Cadherin Is Associated with Metastatic Potential in Gastric Cancer. Clin. Cancer. Res. 2000, 6, 4234–4242. [Google Scholar]
  78. Montero-Conde, C.; Martín-Campos, J.M.; Lerma, E.; Gimenez, G.; Martínez-Guitarte, J.L.; Combalía, N.; Montaner, D.; Matías-Guiu, X.; Dopazo, J.; de Leiva, A.; et al. Molecular profiling related to poor prognosis in thyroid carcinoma. Combining gene expression data and biological information. Oncogene 2008, 27, 1554–1561. [Google Scholar] [CrossRef]
  79. Chan, A.O.O. E-cadherin in gastric cancer. World J. Gastroenterol. 2006, 12, 199–203. [Google Scholar] [CrossRef]
  80. Takeichi, M. Cadherins in cancer: Implications for invasion and metastasis. Curr. Opin. Cell Biol. 1993, 5, 806–811. [Google Scholar] [CrossRef]
  81. Vicari, L.; La Rosa, C.; Forte, S.; Calabrese, G.; Colarossi, C.; Aiello, E.; Salluzzo, S.; Memeo, L. Differential expression of two activating transcription factor 5 isoforms in papillary thyroid carcinoma. OncoTargets Therapy 2016, 9, 6225–6231. [Google Scholar] [CrossRef]
  82. Yang, J.; Gao, T.; Tang, J.; Cai, H.; Lin, L.; Fu, S. Loss of microRNA-132 predicts poor prognosis in patients with primary osteosarcoma. Mol. Cell Biochem. 2013, 381, 9–15. [Google Scholar] [CrossRef] [PubMed]
  83. Caifu, C.; Ridzon, D.A.; Broomer, A.J.; Zhou, Z.; Lee, D.H.; Nguyen, J.T.; Barbisin, M.; Xu, N.L.; Mahuvakar, V.R.; Andersen, M.R.; et al. Real-time quantification of microRNAs by stem-loop RT-PCR. Nucleic Acids Res. 2005, 33, e179. [Google Scholar] [CrossRef]
Figure 1. Quantitation of relative miR-19a expression levels on 8505c and FTC-133 cell lines in basal condition. U6 has been used as endogenous control. Student t-test p value (p < 0.0001) is reported and indicates significant difference between the two groups.
Ijms 19 03944 g001
Figure 2. MiR-19a expression levels after miR-mimic overexpression. Relative quantitation (RQ) of miR-19a expression levels time course, using FTC-133 control cells as control group. U6 has been used as endogenous control. ANOVA test p value (p < 0.0001) is reported and ** (p < 0.01) indicates significant differences both between transfected groups and control cultures and transfected groups as reported by the post-hoc test. FTC-133+M: Cells transfected with the miR mimic.
Ijms 19 03944 g002
Figure 3. MiR-19a mimic overexpression effects on FTC-133 morphology, proliferation and cell viability. (A) Morphological analysis of control (a,c) and miR-19a mimic overexpressing (b,d) FTC-133 cells, at 24 and 48 h post-transfection. (B) Cell count of control cells (blue) and miR-19a mimic overexpressing cells (red), 24 and 48 h after overexpression. Student t-test p value (p < 0.0001) indicates significant differences between miR-19a mimic transfected groups and control samples. (C) MTT assay assessed on FTC-133 and FTC-133+M, 24 and 48 h post-transfection.
Ijms 19 03944 g003
Figure 4. Cell cycle and apoptosis analyses, 24 and 48 h after miR-19a mimic overexpression. (A) Relative Quantitation (RQ) of CDC25a and STK5, using FTC-133 cells as control group. GAPDH has been used as endogenous controls. ANOVA test p value is reported (p < 0.0001) and * (p < 0.05), ** (p < 0.01) indicates significant differences between groups as reported by the post-hoc test. (B,C) Caspase-3/7 and Caspase-9 activity is expressed in relative luminescence units (RLU). The x-axis represents FTC-133 and FTC-133+M at 24 h and 48 h post-transfection. Each point indicates the mean and SD of three independent experiments. Student t-test value (p < 0.001) indicates significant differences between transfected groups and control samples. (D) Western blot analysis of Caspase 3 on FTC-133 and FTC-133+M, 24 and 48 h post-transfection. Data show the ratio between intensity of Caspase 3 bands divided by relative ß-actin bands intensity quantified using imageJ software.
Ijms 19 03944 g004
Figure 5. Gene expression analyses with (A) thyroid cells differentiation and (B) poor prognosis related genes on miR-19a mimic overexpressing FTC-133 cells. Relative Quantitation (RQ) of genes involved in thyroid cells differentiation and poor prognosis using 8505c cells as control group. qRT-PCR has been performed for the mRNA of Tg, TSHr, Pax8, TTF1, CDH1 and S100A4. Glyceraldehyde-3-Phosphate Dehydrogenase (GAPDH) was used as endogenous controls. ANOVA test p value is reported (p < 0.0001) and * (p < 0.05), ** (p < 0.01) indicates significant differences between groups as reported by the post-hoc test.
Ijms 19 03944 g005

