Article

Comparative Characterization of the Complete Mitochondrial Genomes of the Three Apple Snails (Gastropoda: Ampullariidae) and the Phylogenetic Analyses

1
College of Marine Sciences, South China Agricultural University, Guangzhou 510640, China
2
Department of Human Nutrition, Food and Animal Sciences, University of Hawaii at Manoa, Honolulu, HI 96822, USA
3
Institute of Tropical and Subtropical Ecology, South China Agricultural University, Guangzhou 510642, China
4
Xinjiang Acadamy of Animal Sciences, Institute of Veterinary Medicine (Research Center of Animal Clinical), Urumqi 830000, China
5
Guangdong Engineering Research Center for Modern Eco-Agriculture and Circular Agriculture, Guangzhou 510642, China
*
Author to whom correspondence should be addressed.
Int. J. Mol. Sci. 2018, 19(11), 3646; https://doi.org/10.3390/ijms19113646
Submission received: 11 October 2018 / Revised: 31 October 2018 / Accepted: 2 November 2018 / Published: 19 November 2018
(This article belongs to the Section Biochemistry)

Abstract

:
The apple snails Pomacea canaliculata, Pomacea diffusa and Pomacea maculate (Gastropoda: Caenogastropoda: Ampullariidae) are invasive pests causing massive economic losses and ecological damage. We sequenced and characterized the complete mitochondrial genomes of these snails to conduct phylogenetic analyses based on comparisons with the mitochondrial protein coding sequences of 47 Caenogastropoda species. The gene arrangements, distribution and content were canonically identical and consistent with typical Mollusca except for the tRNA-Gln absent in P. diffusa. An identifiable control region (d-loop) was absent. Bayesian phylogenetic analysis indicated that all the Ampullariidae species clustered on the same branch. The genus Pomacea clustered together and then with the genus Marisa. The orders Architaenioglossa and Sorbeoconcha clustered together and then with the order Hypsogastropoda. Furthermore, the intergenic and interspecific taxonomic positions were defined. Unexpectedly, Ceraesignum maximum, Dendropoma gregarium, Eualetes tulipa and Thylacodes squamigerus, traditionally classified in order Hypsogastropoda, were isolated from the order Hypsogastropoda in the most external branch of the Bayesian inference tree. The divergence times of the Caenogastropoda indicated that their evolutionary process covered four geological epochs that included the Quaternary, Neogene, Paleogene and Cretaceous periods. This study will facilitate further investigation of species identification to aid in the implementation of effective management and control strategies of these invasive species.

1. Introduction

Apple snails (Ampullariidae) are freshwater snails distributed naturally throughout the humid tropics and subtropics and Pomacea is the largest of nine genera in the family. Pomacea spp. are indigenous to South America and were introduced from Argentina to Taiwan for commercial purposes. They have subsequently appeared in numerous countries throughout southern and eastern Asia including China. However, these animals have become pests of wetland rice and other crops causing massive economic losses. They have spread into nonagricultural wetlands and their ecological impacts in these habitats are more difficult to estimate [1,2].
P. canaliculata is listed among the world’s 100 worst invasive species by the United States Aquatic Nuisance Species Task Force (USANSTF) [3]. However, the identification and taxonomy of the genus Pomacea are difficult and confusing due to the highly conserved external morphology across the genus despite considerable intraspecific shell variation. This has obscured the true number of species and their identities [4,5,6].
Animal mitochondrial DNAs (mtDNA) are 16–19 kb circular molecules comprised of 37 genes encoding 22 transfer RNAs (tRNA), 13 proteins, two ribosomal RNAs and a control region (CR) that possesses cis regulatory elements [7,8]. The compactness, maternal inheritance, rapid evolutionary rate and short coalescence time compared to nuclear DNA have resulted in the use of mtDNA sequence information for phylogenic studies, taxonomic resolution [9] and population genetics [10].
Currently, P. canaliculata, Pomacea maculate (formerly Pomacea insularum) and Pomacea diffusa are the most widespread species in China. Most studies of the genus Pomacea actually refer to P. canaliculata. This species has been defined in terms of its life history, reproduction and as an intermediate host for the rat lungworm Angiostrongylus cantonensis. Control and management strategies have been largely based on this species [11,12,13,14]. In contrast, there are few studies of P. maculata and P. diffusa [15,16,17,18,19,20].
The Caenogastropoda is the most diverse clade of the Gastropoda and their evolution and population biology are under active investigation. However, phylogenetic analyses based on mtDNA genome have not been completely investigated and only preliminary and limited mtDNA information is available for the apple snails [20,21,22,23,24]. The complete mtDNA genome sequences of the family Ampullariidae are currently under investigation [20,23,25].
We sequenced complete mt genomes of the three apple snails P. canaliculata, P. maculata and P. diffusa using next-generation sequencing (NGS) technology to analyze their phylogeny and evolutionary histories. The identification of new DNA markers and taxonomic viewpoints may facilitate further species identification and assist the development of more effective management and control strategies of these invasive species.

2. Results and Discussion

2.1. Genome Organization and Composition

The complete mt genomes of P. canaliculata, P. diffusa and P. maculate were 16,965, 16,640 and 15,516 bp in length. These contained the canonical 13 PCGs (Protein Coding Genes), two rRNA genes (rrnl and rrns) and 22 tRNA genes with the exception of tRNA-Gln that was absent in P. diffusa. Most of the 37 genes are encoded on the heavy strand (H-strand) as in most Mollusca. However, seven tRNA genes (Met, Tyr, Cys, Trp, Gln, Gly and Glu) from all three species as well as tRNA-Val of P. diffusa and tRNA-Thr of P. diffusa and P. maculate are present on the light strand (L-strand). The G + C content varied from 14.71% to 41.18% (Table 1). The large and small subunit rRNA genes rrnl and rrns were located between tRNA-Leu (TAG) and tRNA-Glu (TTG) genes and separated by the tRNA-Val (TCG) gene (Figure 1). The absence of a specific and identifiable control region is consistent with other Gastropoda [26,27,28,29].
Gene arrangement and distribution of the three apple snails were canonically identical and consistent with typical Mollusca [30,31,32,33,34,35] but obviously different from vertebrates. We identified the presence of 24, 26 and 24 intergenic spacers (IGS) for P. canaliculata; P. diffusa and P. maculate totaling 2020, 1684 and 547 bp, respectively. The largest IGS was located between tRNA-PheCOXIII IGS on the H strand and was 1617 bp in P. canaliculata, 1073 bp in P. diffusa and 141 bp in P. maculate. These regions accounted for the shorter mitogenome in P. maculate (Table 2). MtDNA-IGS are regions of non-coding DNA between genes as well as between the tandem rRNA gene copies. The mtDNA genes in animals generally have very short spacers and are important for evolutionary studies because they change more rapidly than gene sequences. IGS regions are thought to have sequence-independent functions [36]. Additionally, a 119 bp IGS between tRNA-Trp and tRNA-Gly in P. diffusa accounted for the absence of the tRNA-Gln.
Mitochondrial genes overlap and serve to compact the mitogenomes. Each of the snails possessed five overlap sites totaling 11 bp in P. canaliculata, 27 bp in P. diffusa and 13 bp in P. maculate similar to other mitogenomes [37,38,39,40,41,42,43,44,45].
The gene overlaps we identified were present in ND1-tRNA-Pro of P. canaliculata, ND4L-ND4 and ND5-tRNA-Phe of P. diffusa, tRNA-Leu-tRNA-Leu and ND1-tRNA-Pro of P. maculate. (Table 2). Generally, we allowed gene overlaps between adjacent genes but not between protein coding genes and tRNAs. When a full termination codon (UAA or UAG) caused an overlap between a protein-coding gene and a tRNA, we preferred to annotating this gene with incomplete termination codon U/UA rather than an overlap. The incomplete termination codons were not adopted for the three apple snails. The annotation principles were determined by the annotated species available on the website data, which had close relationships with them.

2.2. Nucleotide Composition

The overall nucleotide compositions of the H-strand of the three apple snails in descending order were 40.20% T, 31.18% A, 15.59% G and 13.03% C, with an average G + C content of 28.62% indicating significant strand asymmetry or strand-specific bias commonly observed in the Mollusca [31,35,38,40]. Using the GC-/AT skew analysis, we found that the H-strand showed an over representation of T and A as compared to the L-strand. Strand asymmetry in the nucleotide composition was also reflected in the codon usage of genes oriented in opposite directions. The genes encoded on the H-strand showed clear preference for T or A to end codons, whereas G or C ending codons were over represented on the L-strand. The underlying mechanism responsible for the strand bias has been generally interpreted as evidence of an asymmetrical directional mutation pressure. This is associated with replication processes when one strand remains transiently in a single-stranded state, making it more vulnerable to DNA damage [46,47].
The highest A + T content of the genomes was detected in tRNA-Asp and was 85.29% in P. canaliculata, 82.35% in P. diffusa, and 83.82% in P. maculate. The highest G + C contents were 41.18% in the tRNA-Tyr of P. diffusa, 36.15% in the COXIII of P. canaliculata, and 35.29% in the tRNA-Thr of P. maculate. These phenomena were consistent with the findings of previous reports on other Mollusca [30,32,39,48].

2.3. Protein Coding Genes (PCG)

The 13 PCGs were represented in the apple snail mitogenomes and were H-strand encoded. These included three subunits of cytochrome c oxidase (COXI-III), seven subunits of NADH ubiquinone oxidoreductase complex (ND1-6, ND4L), a cytochrome b oxidoreductase complex (Cyt b) and two subunits of ATP synthases (ATP6 and ATP8). The latter ranged in size from 159 bp (ATP8) to 1728 bp (ND5) comprising 11,220–11,268 bp total accounting for 66.14–72.62% of the entire mitogenomes. Each PCG length was identical between the three snails with the exception of ND4L, ATP6, ND1, ND2, ND4 and ND5 that differed by 6–21 bp. The AT-skew of the 13 PCGs among the three species were all negative and the majority of the GC skew values were positive. The AT skews of COXIII and ND3 were the lowest and the GC skews of ND2 and ND3 were the highest (Figure 2).
We identified initiation and termination codons based on alignments with the corresponding genes of other snails. The mitogenomes of the apple snails exhibited a canonical genetic code shared by all Mollusca. An orthodox initiation codon AUG was used for most of the protein-coding genes. In contrast, AUA was used in ND4L, ND4 and COXIII of P. maculate and in ND4 and COXIII of P. canaliculata. These were also the accepted canonical mitochondrial initiation codons for Mollusca mt genomes (Table 2). Termination codons were represented by only UAA and UAG for all three apple snails and UAA was the most abundant. We did not identify any incomplete termination codons although they are common in other Gastropoda [49,50].
The rates of nonsynonymous amino acid substitutions over synonymous silent substitution (Ka/Ks) for the 13 protein-coding genes were 0.0837. These varied from 0.0065 in COXI to 0.1761 in ND2. This indicated that the functional genes evolved under strong purifying selection, which meant natural selection against deleterious mutations with negative selective coefficients [51] (Figure 3). The selection pressures differed among the genes and they likely evolved in different ways [52]. Interestingly, the ND2 genes possessed the highest ratios indicating that the selection pressures were strand independent.
The conservation of mtDNA genes was evaluated based on the overall p-genetic distance among P. canaliculata (PC), P. diffusa (PD) and P. maculate (PM) (Figure 4). Comparisons of full-length PCGs indicated that COXI and COXII had the lowest overall p-genetic distances (0.122, 0.125) and ATP8 and ND6 had the highest (0.260, 0.222). Furthermore, the values based on the first and second nucleotides of codons were also consistent with those based on data of the full-length codons. This indicated that ATP8 and ND6 likely had the highest evolutionary rates while COXI and COXII had the lowest. The p-genetic distances between PD-PC and PD-PM was much more higher than that for PC-PM. This meant that the PCG sequences of P. canaliculata and P. maculate were the most similar among the three apple snails.

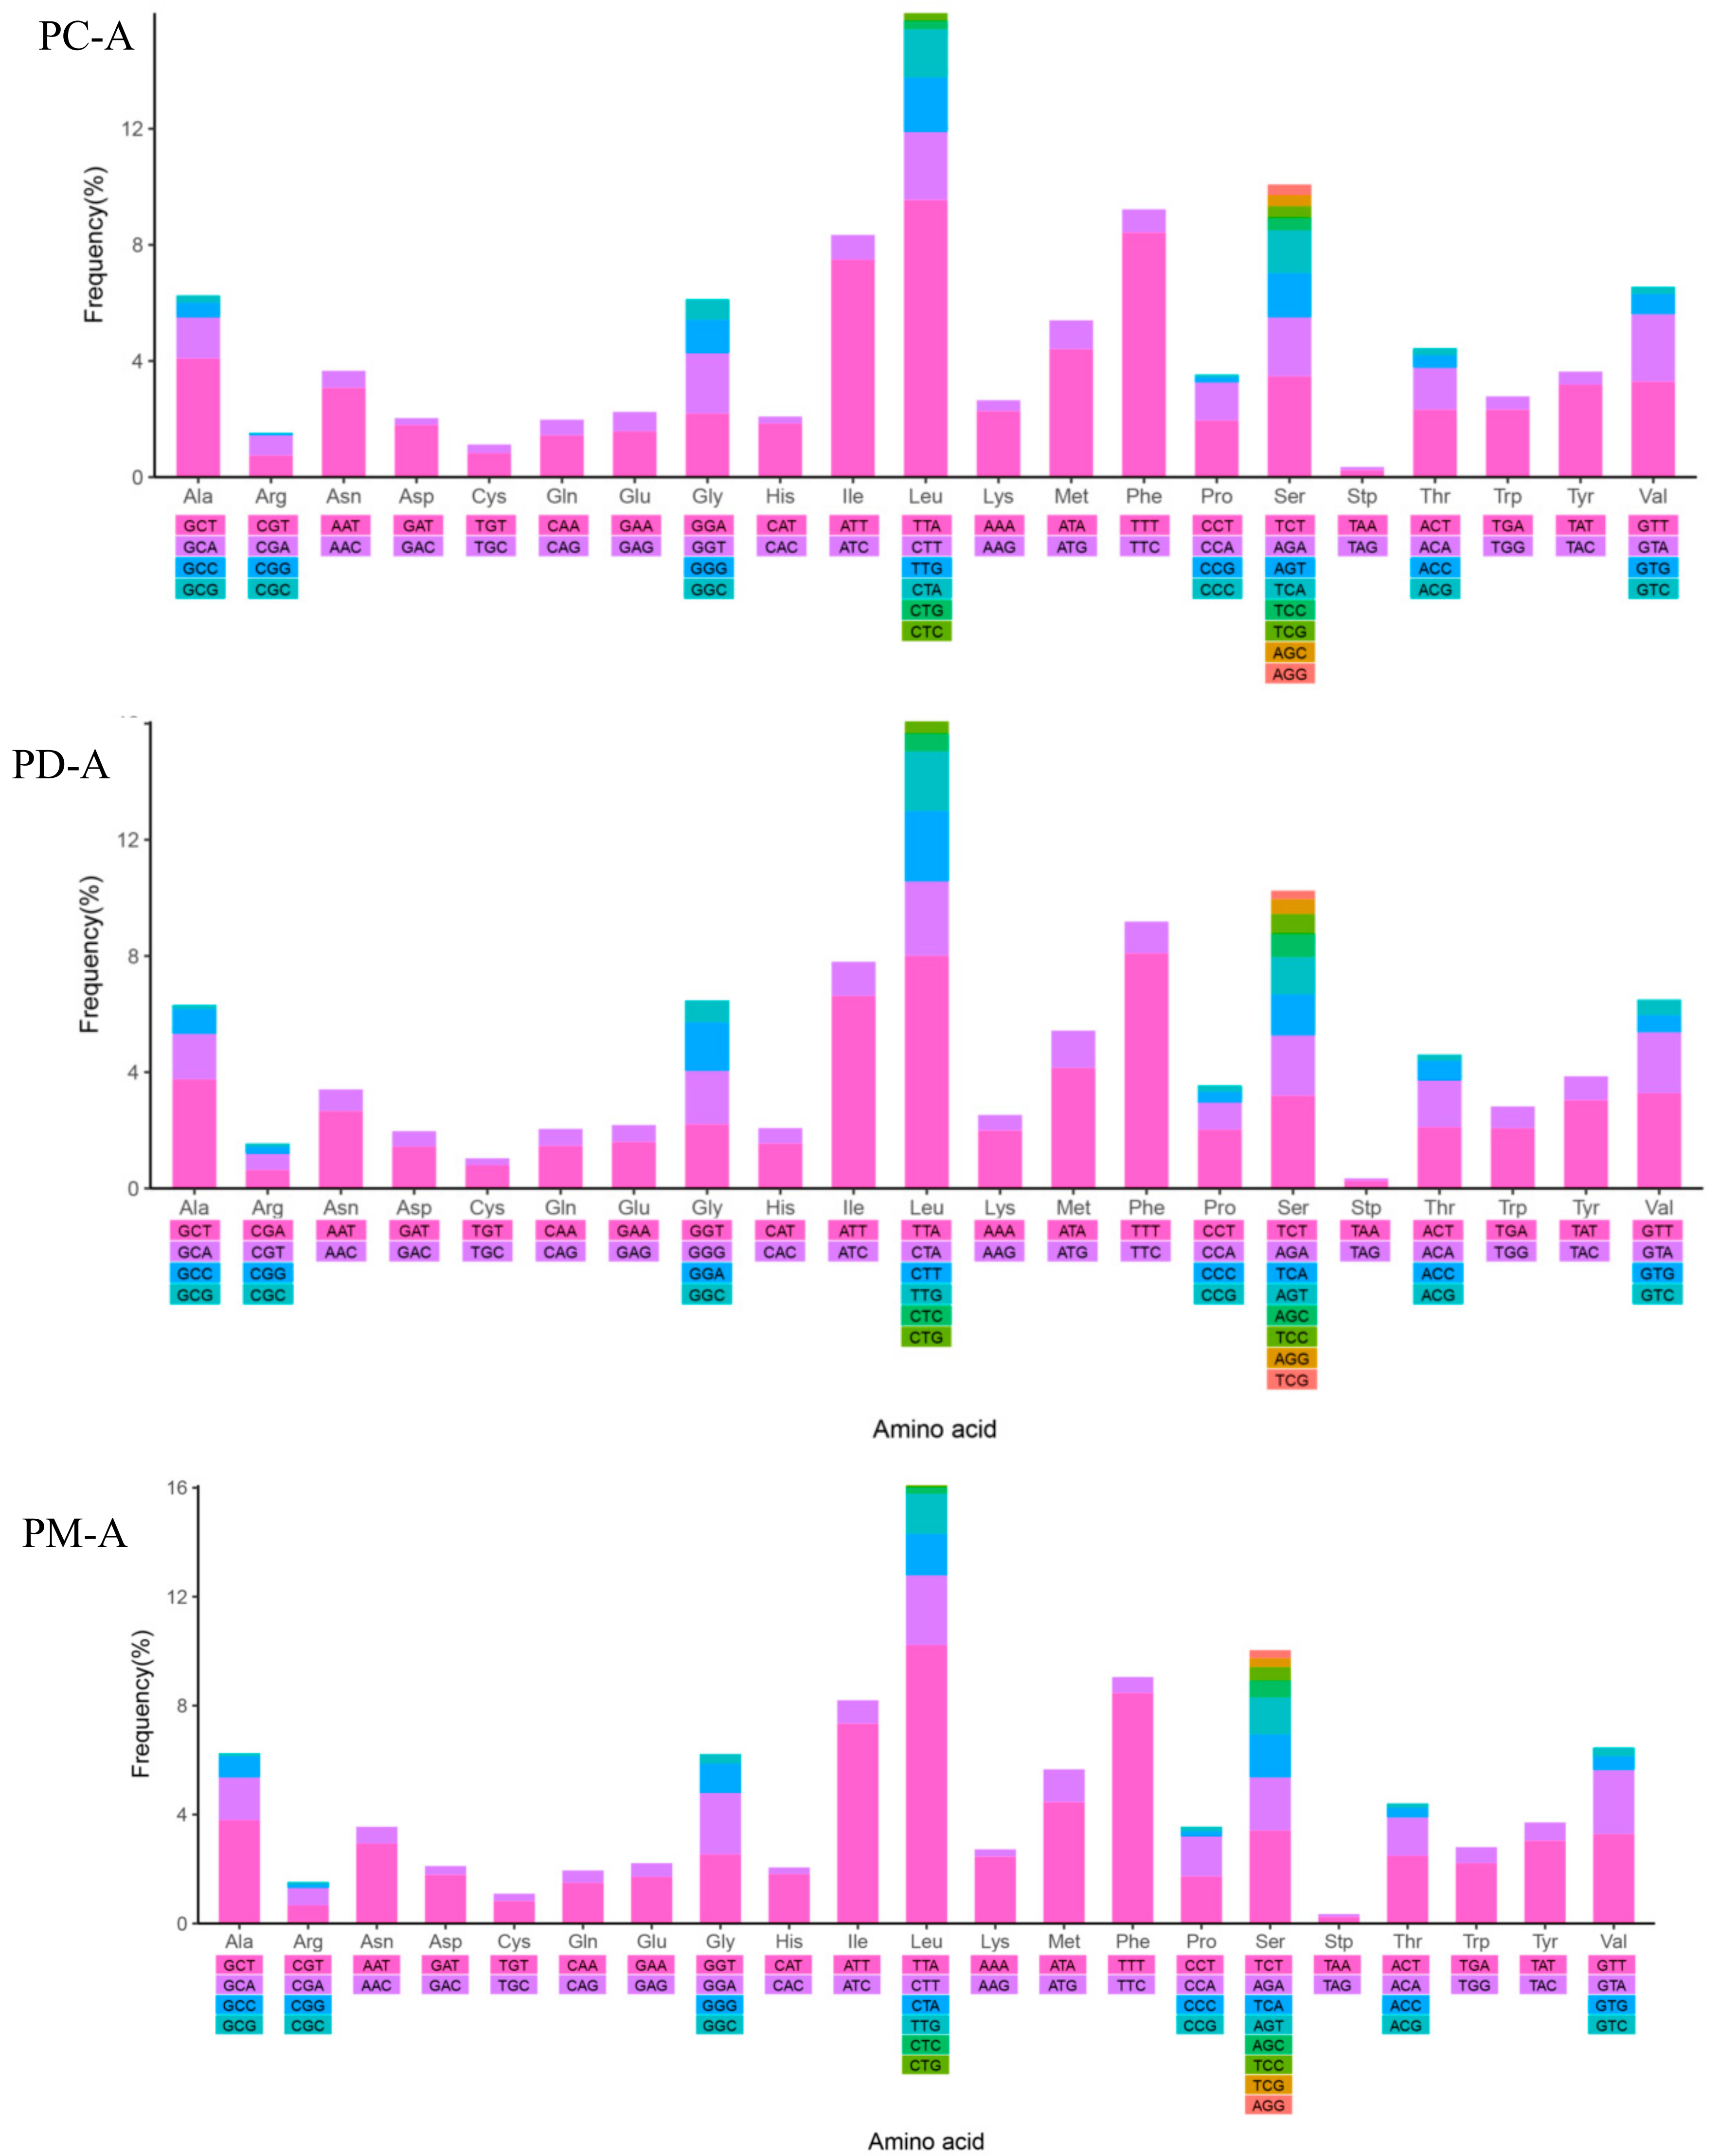
2.4. Mitochondrial Gene Codon Usage

The amino acids Ser and Leu were utilized by eight and six different codons, respectively, while all other amino acids were encoded by either two or four. The frequencies in the PCGs of Phe (UUU), Leu (UUA), Ile (AUU), Met (AUA), and Ala (GCU) were the most frequently used and Stop (UAG) and Arg (CGC) were least frequently used. However, the relative synonymous codon usage (RSCU) analysis indicated that Leu (UUA), Ser (UCU) and Ala (GCU) were the most frequent while Leu (CUC, CUG), Pro (CCC, CCG), Arg (CGC) and Ala (GCG) were rare. Moreover, the GC content and the AT and GC skew of the PCGs were reflected in the codon usage and were closely related and consistent (Table 1; Figure 2) [53,54,55]. The RSCU values indicated that codons with A or U in the third position were more frequent than C or G. Therefore, codons NNA and NNU were in the majority while the synonymous codons NNC and NNG were in the minority (Figure 5).

2.5. Transfer and Ribosomal RNA Genes

The mitogenomes of the apple snails each contained 22 tRNA genes varying from 62 bp (tRNA-Gln and tRNA-Cys) to 72 bp (tRNA-Ile) and were typical of metazoan mitogenomes. In general, there was a one-to-one correspondence of codon and anticodon. However, serine was determined by two types of anticodons (UGA, GCU) and leucine was determined by UAG and UAA in the apple snails, identical to other Mollusca [30,34]. All 22 tRNA genes (tRNA-Gln absent in P. diffusa) were predicted to be folded into canonical cloverleaf secondary structures as predicted using the tRNA Scan-SE software (http://lowelab.ucsc.edu/tRNAscan-SE/) [56], although numerous non-complementary and U-G base pairs existed in the stem regions. Stem mismatches are common for mitochondrial tRNA genes and are repaired via post-transcriptional editing [57].
tRNA genes were predicted using a Cove score cutoff of 0.1 by tRNA scan-SE v.2.0, combined with ARWEN software (www.acgt.se/online.html) and then confirmed by MitoFish (http://mitofish.aori.u-tokyo.ac.jp/) to confirm the annotation. We found high similarity in the corresponding tRNA-Gln sequences among the three snails. In addition, the secondary structure of tRNA-Gln in P. diffusa could not be predicted, but the tRNA-Gln in P. canaliculata and P. maculate could be done successfully. We are unsure whether this gene segment variation led to the unsuccessful prediction of secondary structure or was deficiency true deficiency of tRNA-Gln in P. diffusa. The mitochondrial genes of other snails have not been completely investigated and only preliminary and limited mtDNA information is available. Further research is needed to clarify this situation.
We also identified H-strand large (rrnl) and small subunit (rrns) rRNA genes ranging in size from 929 to 950 bp and 1331 and 1345 bp, respectively. These were positioned between tRNA-Glu (UAG) and tRNA-Leu (UUC) tRNA-Val (UAC) and consistent with most Mollusca [31,33,48].
The AT content of rrns ranged from 70.32 and 71.91% with an AT-skew of 0.012–0.0377 and a GC-skew from 0.1773 to 0.249. The AT content of the rrnl gene ranged from 72.86 to 74.53% with an AT-skew of 0.0051–0.0163 and a GC-skew from 0.1397 to 0.1622. This nucleotide distribution differed when compared with the entire mitogenome; the protein-coding genes and tRNAs all had a T and G bias.

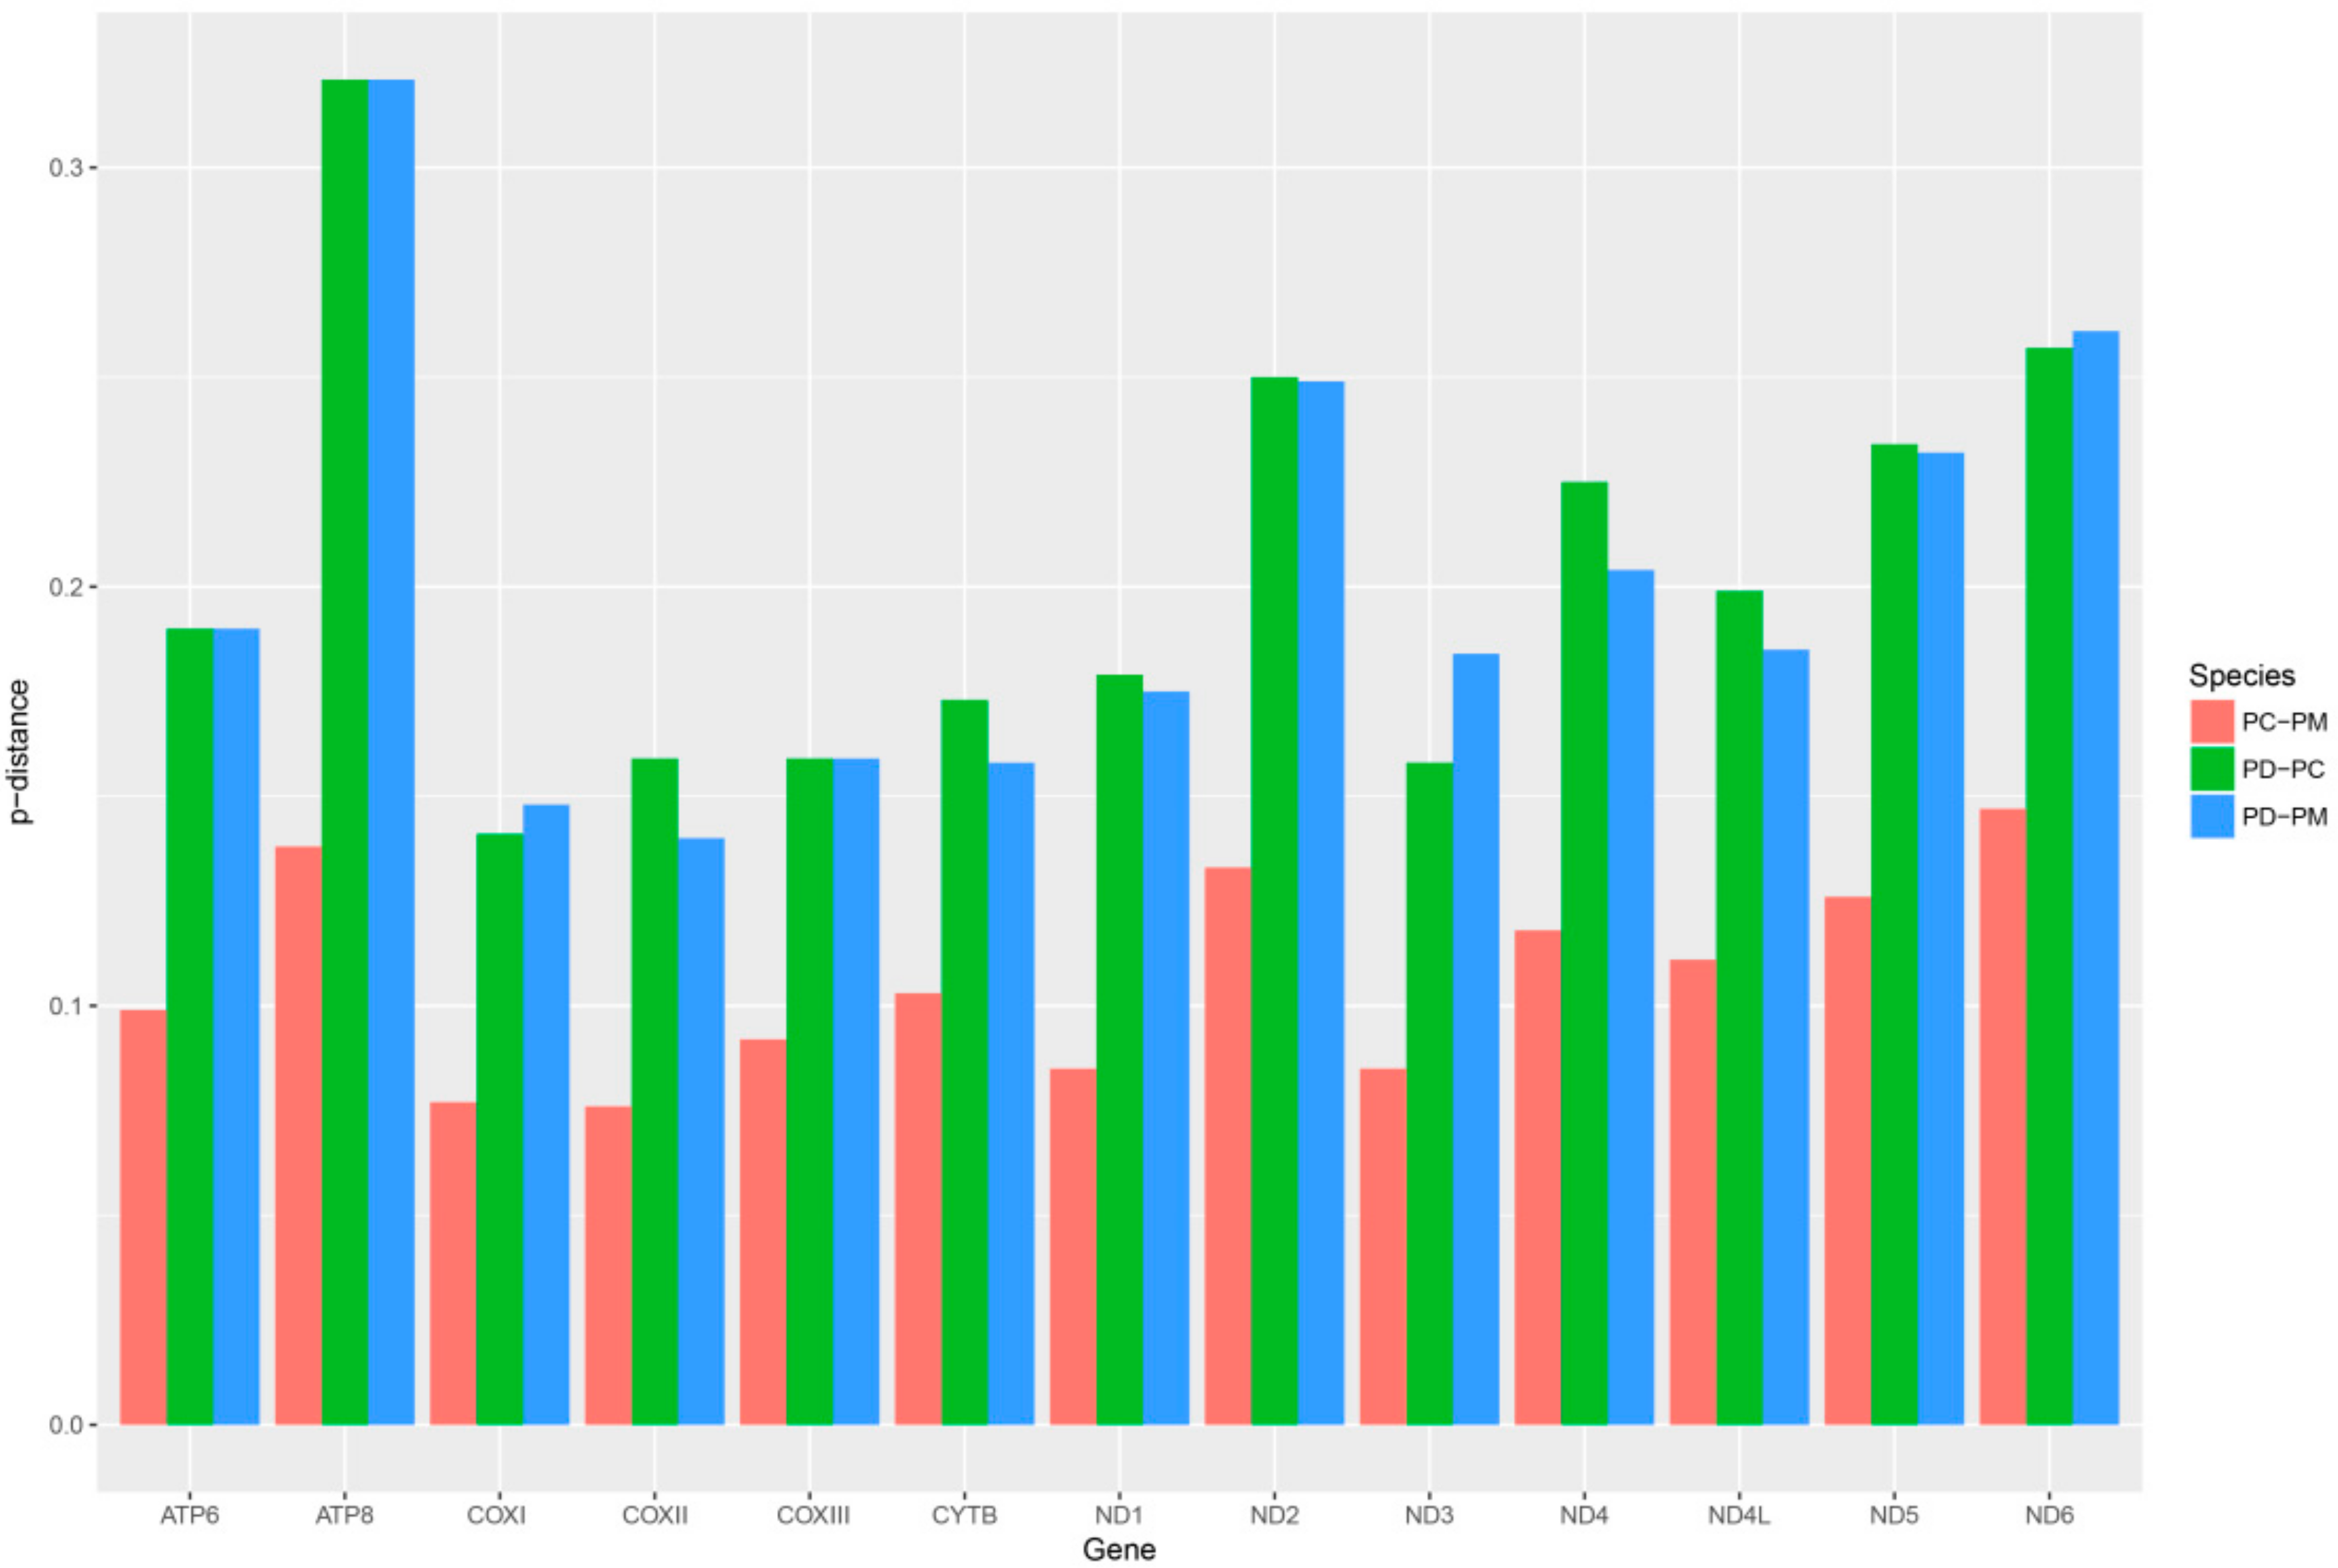
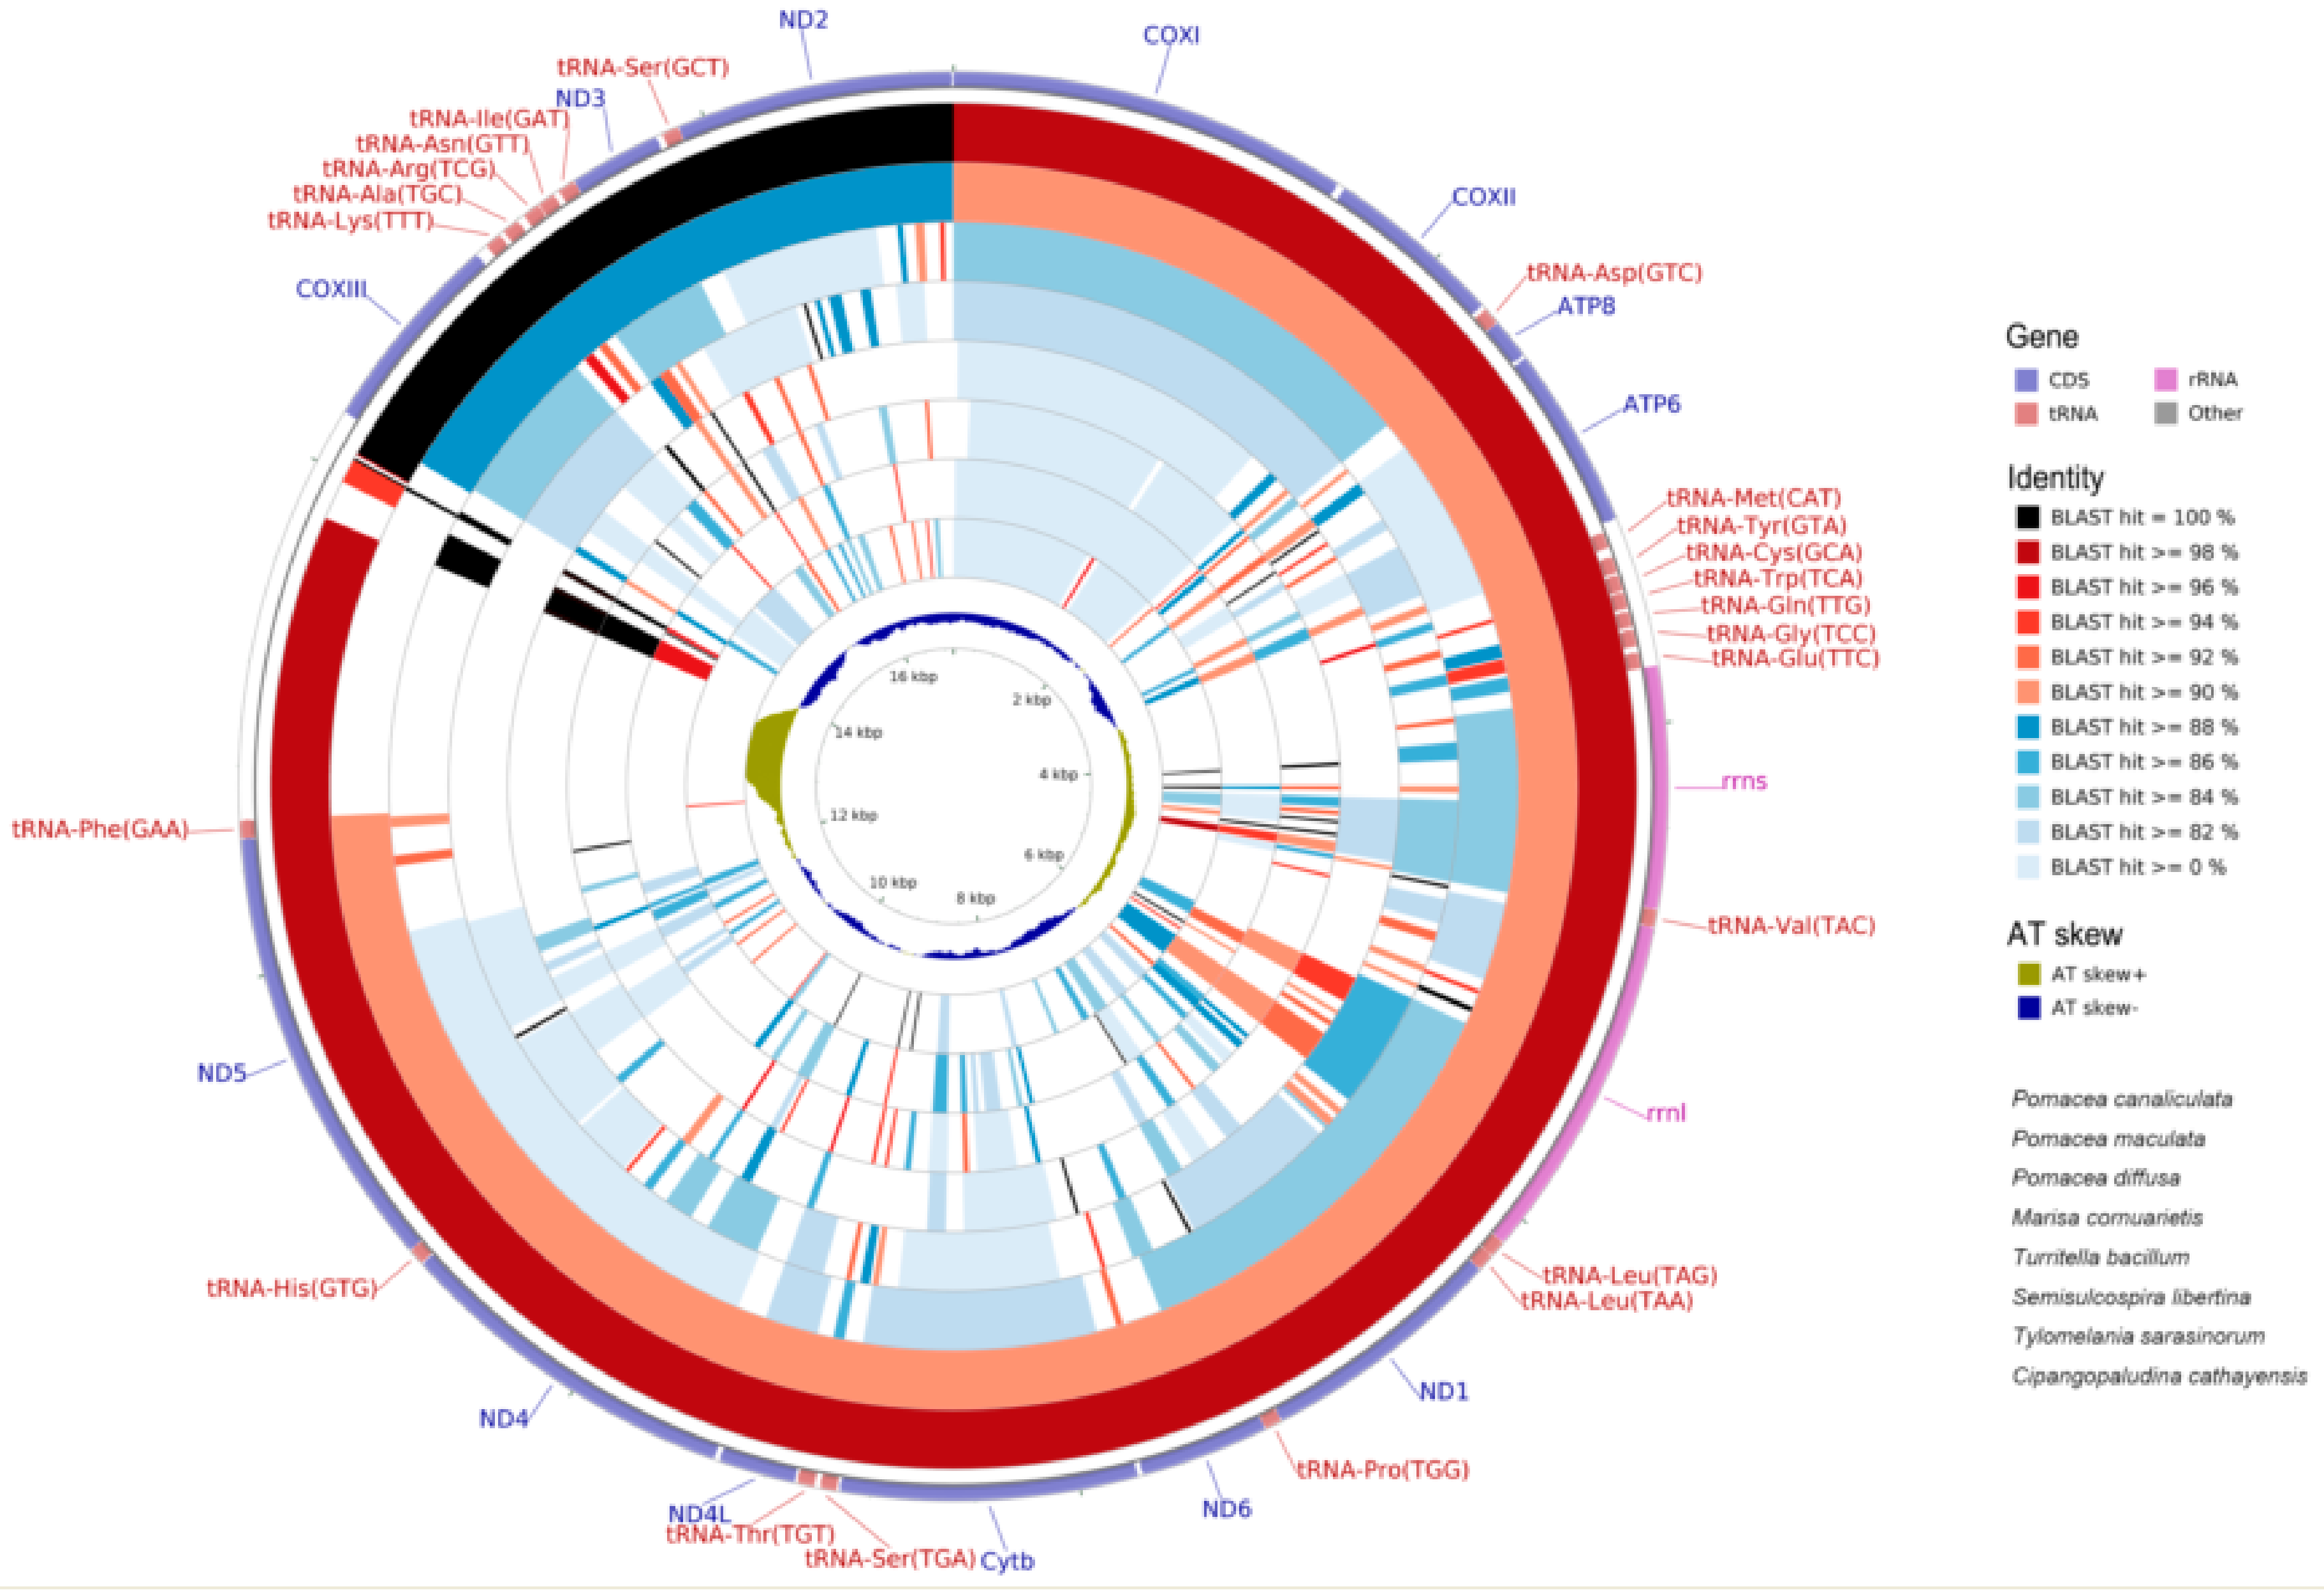
2.6. Mitogenome Comparisions

We compared the mitochondrial genomes of P. canaliculata with other available mitogenomes in the orders Sorbeoconcha and Architaenioglossa of the Caenogastropoda. Both the nucleotide (Figure 6) and CDS (coding DNA sequence) (Figure 7) regions were highly similar. ATP8 was the least conserved over in all species with a 59.34% similarity that was appropriate for the phylogenetic and evolutional analyses within the family Ampullariidae or genus Pomacea. On the contrary, COXI was the most conservative with the highest similarity (95.41%) and appropriate for the analyses above the family Ampullariidae (Figure 7). The average similarities for the 13 CDS genes were 93.96% (P. maculate), 82.41% (P. diffusa), 77.62% (M. cornuarietis), 68.92% (Semisulcospira libertine), 68.24% (Turritella bacillum) and 67.39% (Tylomelania sarasinorum). P. canaliculata was most closely related to P. maculate and then with P. diffusa and M. cornuarietis (Figure 8). Since nucleotide variation and diversity is greater than that for CDS regions, the mitogenome nucleotides showed less identity. This difference was also consistent when the wobble nucleotides are considered, so it was a more effective tool for phylogenetics (compare Figure 6 and Figure 7).

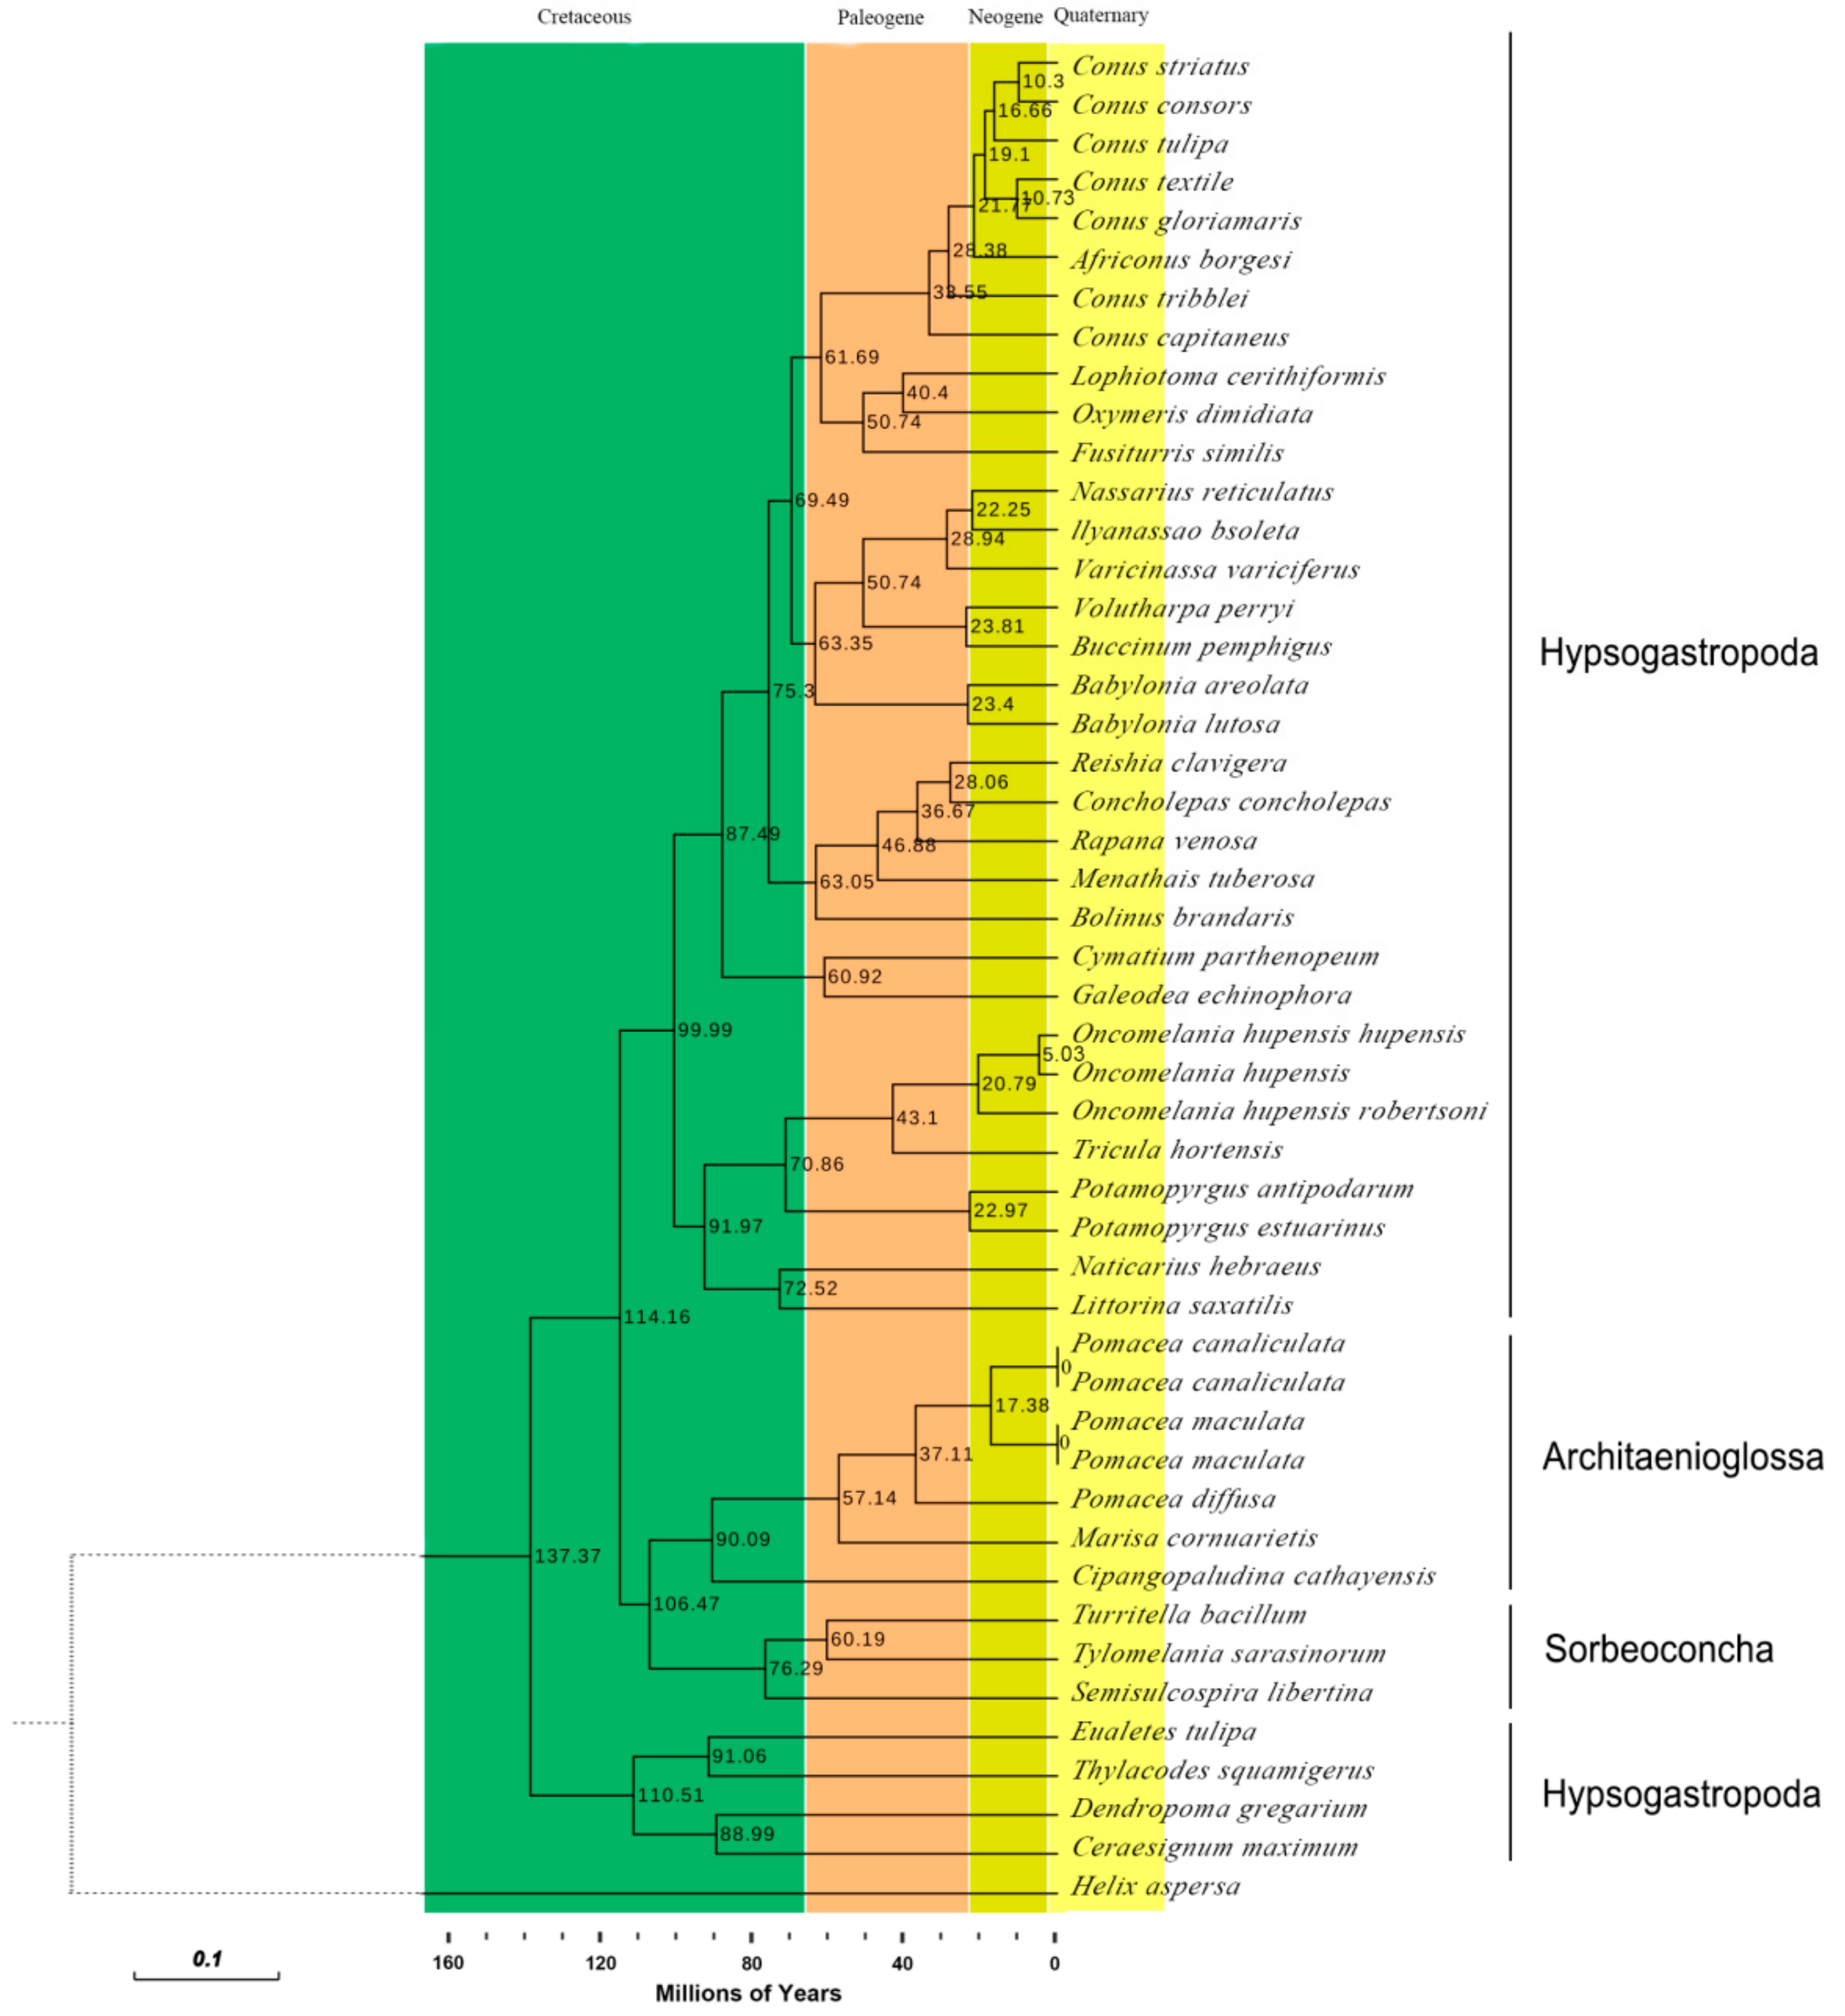
2.7. Phylogenetic Analyses

Phylogenetic analyses were carried out based on the concatenated alignment of amino acid sequences of 13 PCGs covering three orders, 18 families, 32 genera and 47 species of Caenogastropoda. We selected Helix aspersa (NC_021747) (Gastropoda, Heterobranchia) as the out-group (Table S1). Bayesian and Maximum Likelihood (ML) analyses produced almost identical topologies with similar branch lengths and strong bootstraps (ML) and posterior probabilities (Bayesian) values (Figure 8). We preferred the phylogenetic analyses based on the PCG information because the 47 Caenogastropoda species belonged to different orders i.e., Architaenioglossa, Hypsogastropoda and Sorbeoconcha and possessed wide-ranging taxonomies. Multiple amino acid sequence alignments indicated that nucleotide sequences were the more conservative and the most suitable taxonomic method [58,59,60]. In summary, whether the 13 amino acid sequences or nucleotides of the 13 PCGs was appropriate for phylogenetics was species dependent.
Our phylogenetic tree analysis indicated that all of our tested Ampullariidae species clustered on the same branch and all posterior probabilities were 100. These Pomacea species were clustered together and then with the genus Marisa. The species of the orders Architaenioglossa and Sorbeoconcha clustered together and then with Hypsogastropoda. This indicated that orders Architaenioglossa and Sorbeoconcha have a closer genetic relationship to the Pomaceas. Unexpectedly, Ceraesignum maximum, Dendropoma gregarium, Eualetes tulipa and Thylacodes squamigerus traditionally classified in the order Hypsogastropoda were isolated from this order and occupied the most external branch of the Bayesian tree.

2.8. Divergence Times of the Caenogastropoda

We estimated divergence times of the Caenogastropoda based on phylogenetic trees constructed using the Bayesian method and species differentiation time using the ML method [61]. The model MtMam + I + G + F was optimal with an AIC (Akaike Information Criterion) value of 621,746.50. The model JTT + I + G + F was suboptimal with an AIC value of 614,814.31, similar to the one for model MtMam + I + G + F (Figure 9). The JTT + I + G + F model was used for the molecular clock.
Pomacea taxonomy has been based on shell, egg mass and soft tissue morphology [5]. However, there are no clear criteria to distinguish between species because of intraspecific variation, most likely the result of environmental influences [62]. These unclear morphological criteria have confused the taxonomy and identification within the genus, especially between P. canaliculata and P. maculate. Most invasive apple snail populations have been identified as P. canaliculata, but many may belong to other species in a closely related complex. This difficulty has resulted in their informal naming as the “P. canaliculata group” [4]. Preliminary attempts at classifying these species using mitochondrial 12S, 16S, and COXI sequence have been successful [49]. In addition, Pomacea species in Japan have been classified using COXI sequence alignments [63]. However, these studies did not clearly distinguish between these organisms.
In our study, the divergence times indicated that P. canaliculata and P. maculate began to differentiate from other species about 17.38 million years ago (Mya) within the Neogene and then subsequently diverged with P. diffusa 37.11 Mya within the Paleogene (Figure 9). This suggests that the longer the divergence time, the more likely differences in external morphology would be apparent. The divergence time of the orders Architaenioglossa and Sorbeoconcha was 106.47 Mya within the middle Cretaceous. The order Hypsogastropoda terminated their differentiation after three important differentiation nodes at 87.49, 91.97 and 99.99 Mya within the late Cretaceous, and converged with the Architaenioglossa-Sorbeoconcha cluster 114.16 Mya within the middle Cretaceous. Interestingly, the cluster gathered by C. maximum, D. gregarium, E. tulipa and T. squamigerus is traditionally classified in the order Hypsogastropoda and converged with the main Architaenioglossa–Sorbeoconcha-Hypsogastropoda cluster 137.37 Mya within the early Cretaceous.
Early phyletic evolution is primarily based on morphological characteristics. The development of modern molecular methods and techniques has provided additional information but also some new problems and challenges. These include how to comprehensively consider and balance position and function between morphology and modern molecular biology.

3. Materials and Methods

3.1. Sampling and Materials

Wild specimens of the three apple snails (P. canaliculata, P. diffusa and P. maculate) were collected in Ningxi Teaching and Research Farm of South China Agricultural University in Guangzhou (E 113°29′, N 23°5′) China on 2–25 March 2015. Voucher specimens were deposited in the Guangdong Engineering Research Center for Modern Eco-agriculture and Circular Agriculture, Guangzhou, China (Accession numbers: 004022015, 0050315 and 006012015). The dorsal muscle was preserved in 95% ethanol and stored at −70 °C until they were used for DNA extraction. Genomic DNA was isolated from muscle tissue as previously described [64]. Total DNA was eluted in sterile deionized water and was deposited at −20 °C. All animal experiments were conducted based on the guidelines and approval of the Animal Research and Ethics Committees of South China Agricultural University (AREC2003003, 15 March 2003).

3.2. Library Preparation for Sequencing

DNA sample quality and quantity were characterized by gel electrophoresis and UV spectroscopy using the Nano-Drop 2000 instrument (Thermo Scientific, Waltham, MA, USA). We isolated the high-quality genomic DNA to construct the DNA libraries containing insert sizes of 500 bp for paired-end sequencing. Paired-end reads of 100 bp were generated on an Illumina HiSeq2500 instrument (Illumina, Inc., San Diego, CA, USA) using sequencing protocols provided by the manufacturer.

3.3. Sequence Analysis and Annotation

Illumina paired-end sequencing reads were filtered on quality values and the low quality bases (quality < 20, p-error > 0.01) of 50 upstream and 30 downstream were trimmed. Using the Ampullariidae mitochondrial genomes from the NCBI database using bowtie2 (http://Bowtie-Bio.Sourceforge.Net/Bowtie2/Index.Shtml), the mitochondrial genome sequencing reads were captured. De novo assembly with paired-end sequencing reads was determined using SOAPdenovo2 (http://soap.genomics.org.cn/ soapdenovo.html). The protein-coding regions and ribosomal genes were identified using the Basic Local Alignment Search Tool (https://blast.ncbi.nlm.nih.gov/Blast.cgi) [65]. Species maps were drawn using OGDRAW (http://ogdraw.mpimp-golm.mpg.de/). Transfer RNA genes were predicted using a Cove score cutoff of 0.1 by tRNA scan-SE v.2.0 (http://lowelab.ucsc.edu/tRNAscan-SE/), combined with ARWEN software (http://mbio-serv2.mbioekol.lu.se/ARWEN/) [66,67] and then confirmed by MitoFish (http://mitofish.aori.u-tokyo.ac.jp/) to confirm the annotation. Strand asymmetry was calculated using the following formulas: AT skew = [A − T]/[A + T] and GC skew = [G − C]/[G + C] [68] to describe base composition. Repeat sequences were identified using Spectral Repeat Finder v1.1 [69]. Codon usage was determined for all PCGs. Long repeat analysis was used in the web-based REPuter (http://bibiserv.techfak.uni-bielefeld.de/reputer/) and included forward, reverse, and tandem repeats with minimal lengths of 30 bp and edit distances of <3 bp [70]. RSCU values [71] were obtained using MEGA 7 software (https://www.megasoftware.net/) [61]. Statistical analyses of the distributions and visualization of codon usage in the form of heat maps were conducted using R language with RSCU values, a measure of non-uniform usage of synonymous codons in a coding sequence [71]. The RSCU value was the number of times. A particular codon was observed relative to the number of times that the codon would be observed for a uniform synonymous codon usage i.e., all codons for a given amino acid exhibiting similar probabilities. The RSCU value in the absence of any codon usage bias was 1.00. A codon used less frequently than expected would have RSCU values <1.00, whereas codons used more frequently than expected would have RSCU values >1.00.

3.4. Phylogenetic Analyses

Phylogenetic analyses were conducted based on 47 mitochondrial genomes sequences of 47 species of Caenogastropoda (Table S1), using Helix aspersa (NC_021747) (Heterobranchia, Helicidae) as the out-group. All sequences were deposited in GenBank. We aligned amino acid sequences of PCGs in the 48 species using the MUSCLE program in MEGA 7. Our alignments of individual genes excluded the stop codon and the third codon.
We performed phylogenetic analysis by the Maximum Likelihood (ML) and Bayesian Inference (BI) methods. The best model MtMam + I + G + F based on the amino acid sequences in this study was selected using AIC (Akaike Information Criteria). Minimum and best values were fitted with ProtTest 3 (https://omictools.com/prottest-tool) with optimized parameters [72]. ML analysis was carried out using the RAxML 8.1.5 with 1000 bootstrap replicates based on the best-scoring protein substitution model determined automatically of the software [73]. Bayesian phylogenetic analysis with 10,000,000 generations was conducted with MrBayes 3.2.6 software (http://mrbayes.sourceforge.net/index.php) [74]. Four independent Markov chains were used at the same time with sampling every 100 generations. The BI Tree was reliable since the standard deviation of split frequencies was <0.01. The phylogenetic trees were generated using Evolview (http://www.evolgenius.info/evolview/) [75,76]. The NCBI taxonomy server (http://www.ncbi.nlm.nih.gov/taxonomy/) and DeepFin (http://deepfin.org/) were adopted for additional analyses.
The divergence times of the Caenogastropoda were estimated using MEGA 7.0 [77] with the RelTime-ML method and JTT + F + I + G modeling. Divergence times were presented in the Time Tree database (http://www.timetree.org/) [61]. Bayesian phylogenetic data were input to MEGA 7.0 to generate divergence times that ensured consistency between the phylogenetic tree and divergence times.
Sequence differences between three apple snails and other Sorbeoconcha and Architaenioglossa species were analyzed, and P. canaliculata (NC_024586) was used as the reference sequence. Sequences were aligned by BLAST and annular genetic similarity mapping was visualized using the CGView Comparison Tool (http://stothard.afns.ualberta.ca/downloads/CCT).

4. Conclusions

The gene characterization, arrangement and distribution of the three apple snails were canonically identical and consistent with the typical Mollusca except for the absence of tRNA-Gln in P. diffusa. The absence of an identifiable control region or d-loop was consistent with other Gastropoda. Bayesian phylogenetic analysis indicated that all Ampullariidae species including the apple snails clustered on the same branch with 100 posterior probabilities. The members of the genus Pomacea clustered together first and then with genus Marisa. The orders Architaenioglossa and Sorbeoconcha clustered together and then with the order Hypsogastropoda. Furthermore, the intergenic and interspecific taxonomic positions were explicit and clear. Unexpectedly, C. maximum, D. gregarium, E. tulipa and T. squamigerus traditionally classified in order Hypsogastropoda were isolated from it and located in the most external branch of the Bayesian inference topology tree. Divergence times of the Caenogastropoda indicated their evolutionary process covered four geological epochs: Quaternary, Neogene, Paleogene and Cretaceous. Early phyletic evolution is mainly based on morphological characteristics.
This study presents a characterization of mitochondrial genomes and insight into the phylogenetics of Caenogastropoda that may facilitate further investigation of species identification. This is essential for the implementation of effective management and control strategies.

Supplementary Materials

Supplementary materials can be found at https://www.mdpi.com/1422-0067/19/11/3646/s1.

Author Contributions

H.Y. and J.-e.Z. conceived and designed the experiments; H.Y., J.G. and Z.D. performed the experiments; H.Y. analyzed the data (technique supported by SCGene Guangzhou Co., Ltd., Guangzhou, China); M.L. contributed reagents/materials/analysis tools; J.G. collected samples and identified species; H.Y. wrote the paper; J.-e.Z., J.X. and J.Y. polished the paper.

Funding

This work was supported by the National Natural Science Foundation of China (No. U1131006, No. 30770403, No. 30900187, No. 31502144, No. 31870525), Provincial Projects with Special Funds for Promoting Economic Development of Marine and Fisheries Department of Guangdong (SDYY-2018-05), Natural Science Foundation of Guangdong Province (No. 2015A030313409), Guangdong Science and Technology Program (No.2015B090903077, No.2017A090905030), the Science and Technology Project of Guangzhou (No.201604020062), the Innovation Team Construction Project of Modern Agricultural Industry Technology System of Guangdong Province (No.2017LM1100), and the Foundation for High-level Talents in Higher Education of Guangdong Province.

Conflicts of Interest

The authors declare no conflict of interest.

References

  1. Rawlings, T.A.; Hayes, K.A.; Cowie, R.H.; Collins, T.M. The identity, distribution, and impacts of non-native apple snails in the continental United States. BMC Evol. Biol. 2007, 7, 97. [Google Scholar] [CrossRef] [PubMed]
  2. Levin, P.C.R.; Taylor, J.M.; Hayes, K.A.; Burnett, K.M.; Ferguson, C.A. Apple snail invasions and the slow road to control: Ecological, economic, agricultural and cultural perspectives in hawaii. In Global Advances in Ecology and Management of Golden Apple Snails, 2nd ed.; Joshi, R.C., Sebastian, L.S., Eds.; Philippine Rice Research Institute: Nueva Ecija, Philippines, 2006; pp. 325–335. ISBN 9789719081319. [Google Scholar]
  3. Lowe, S.B.M.; Boudjelas, S.; De Poorter, M. 100 of the world’s worst invasive alien species: A selection from the global invasive species database. In The Invasive Species Specialists Group of the Species Survival Commission of the World Conservation Union; Hollands Printing: Auckland, New Zealand, 2000. [Google Scholar]
  4. Cazzaniga, N.J. Old species and new concepts in the taxonomy of pomacea (gastropoda: Ampullariidae). Europe PMC 2002, 26, 71–81. [Google Scholar]
  5. Cowie, R.H.; Hayes, K.A.; Thiengo, S.C. What are apple snails? Confused taxonomy and some preliminary resolution. In Global Advances in Ecology and Management of Golden Apple Snails, 2nd ed.; Joshi, R.C., Sebastian, L.S., Eds.; Philippine Rice Research Institute: Nueva Ecija, Philippines, 2006. [Google Scholar]
  6. RH, C. Apple snails (ampullariidae) as agricultural pests: Their biology, impacts and management. In Molluscs as Crop Pests; Barker, G.M., Ed.; CAB-International: Wallingford, UK, 2002. [Google Scholar]
  7. Boore, J.L. Animal mitochondrial genomes. Nucleic Acids Res. 1999, 27, 1767–1780. [Google Scholar] [CrossRef] [PubMed] [Green Version]
  8. WM, B. The mitochondrial genome of animals. In Molecular Evolutionary Genetics; Mcintyre, R.J., Ed.; Plenum. Press: New York, NY, USA, 1985. [Google Scholar]
  9. Poulin, E.; Cardenas, L.; Hernandez, C.E.; Kornfield, I.; Ojeda, F.P. Resolution of the taxonomic status of chilean and californian jack mackerels using mitochondrial DNA sequence. J. Fish Biol. 2004, 65, 1160–1164. [Google Scholar] [CrossRef]
  10. Habib, M.; Lakra, W.S.; Mohindra, V.; Khare, P.; Barman, A.S.; Singh, A.; Lal, K.K.; Punia, P.; Khan, A.A. Evaluation of cytochrome b mtdna sequences in genetic diversity studies of channa marulius (channidae: Perciformes). Mol. Biol. Rep. 2011, 38, 841–846. [Google Scholar] [CrossRef] [PubMed]
  11. Estebenet, A.L.; Martin, P.R. Pomacea canaliculata (gastropoda: Ampullariidae): Life-history traits and their plasticity. Biocell 2002, 26, 83–89. [Google Scholar] [PubMed]
  12. Liu, J.; He, Y.J.; Tan, J.C.; Xu, C.X.; Zhong, L.; Wang, Z.G.; Liao, Q.G. Characteristics of pomacea canaliculata reproduction under natural conditions. J. Appl. Ecol. 2012, 23, 559–565. [Google Scholar]
  13. Lv, S.; Zhang, Y.; Liu, H.X.; Zhang, C.W.; Steinmann, P.; Zhou, X.N.; Utzinger, J. Angiostrongylus cantonensis: Morphological and behavioral investigation within the freshwater snail pomacea canaliculata. Parasitol. Res. 2009, 104, 1351–1359. [Google Scholar] [CrossRef] [PubMed]
  14. San Martins, R.; Gelmi, C.; de Oliveira, J.V.; Galo, J.L.; Pranto, H. Use of a saponin based molluscicide to control pomacea canaliculata snails in southern brazil. Nat. Prod. Commun. 2009, 4, 1327–1330. [Google Scholar] [PubMed]
  15. Jarusiewicz, J.A.; Fried, B.; Sherma, J. Effects of diet on the carotenoid pigment and lipid content of pomacea bridgesii as determined by quantitative high performance thin layer chromatography. Comp. Biochem. Phys. Part B 2006, 143, 244–248. [Google Scholar] [CrossRef] [PubMed]
  16. Olivier, H.M.; Jenkins, J.A.; Berhow, M.; Carter, J. A pilot study testing a natural and a synthetic molluscicide for controlling invasive apple snails (pomacea maculata). Bull. Environ. Contam. Toxicol. 2016, 96, 289–294. [Google Scholar] [CrossRef] [PubMed]
  17. Pasquevich, M.Y.; Dreon, M.S.; Heras, H. The major egg reserve protein from the invasive apple snail pomacea maculata is a complex carotenoprotein related to those of pomacea canaliculata and pomacea scalaris. Comp. Biochem. Phys. Part B 2014, 169, 63–71. [Google Scholar] [CrossRef] [PubMed]
  18. Pinto, H.A.; Cantanhede, S.P.; Thiengo, S.C.; de Melo, A.L.; Fernandez, M.A. The apple snail pomacea maculata (caenogastropoda: Ampullariidae) as the intermediate host of stomylotrema gratiosus (trematoda: Stomylotrematidae) in Brazil: The first report of a mollusc host of a stomylotrematid trematode. J. Parasitol. 2015, 101, 134–139. [Google Scholar] [CrossRef] [PubMed]
  19. Souza Junior, E.; De Barros, J.C.; Paresque, K.; De Freitas, R.R. The effect of stocking density on the growth of apple snails native pomacea bridgesii and exotic pomacea lineata (mollusca, gastropoda). An. Acad. Bras. Cienc. 2013, 85, 753–760. [Google Scholar] [CrossRef] [PubMed]
  20. Yang, Q.; Liu, S.; Song, F.; Li, H.; Liu, J.; Liu, G.; Yu, X. The mitochondrial genome of pomacea maculata (gastropoda: Ampullariidae). Mitochondrial DNA A DNA Mapp. Seq. Anal. 2016, 27, 2895–2896. [Google Scholar] [PubMed]
  21. Bian, Q.Q.; Li, X.Y.; Fang, Y.Q.; Jia, Y.Q.; Mu, X.D. Molecular identification of pomacea canaliculata and p. Insularum from rice paddy in different origins in china using mitochondrial adenosine triphosphate subunit 6 gene. Mitochondrial DNA 2015, 26, 11–14. [Google Scholar] [CrossRef] [PubMed]
  22. Li, X.Y.; Bian, Q.Q.; Zhao, G.H. Phylogenetic analysis of pomacea canaliculata isolates collected from rice fields in different origins of china by combined mitochondrial 12s and 16s genes. Mitochondrial DNA 2015, 26, 27–31. [Google Scholar] [CrossRef] [PubMed]
  23. Zhou, X.; Chen, Y.; Zhu, S.; Xu, H.; Liu, Y.; Chen, L. The complete mitochondrial genome of pomacea canaliculata (gastropoda: Ampullariidae). Mitochondrial DNA A DNA Mapp. Seq. Anal. 2016, 27, 884–885. [Google Scholar] [CrossRef] [PubMed]
  24. Bouchet, P.; Rocroi, J.-P.; Frýda, J.; Hausdorf, B.; Ponder, W.; Valdés, Á.; Warén, A. Classification and Nomenclator of Gastropod Families; Malacologia ConchBooks: Hackenheim, Germany, 2005; Volume 47. [Google Scholar]
  25. Wang, M.; Qiu, J.W. Complete mitochondrial genome of the giant ramshorn snail marisa cornuarietis (gastropoda: Ampullariidae). Mitochondrial DNA A DNA Mapp. Seq. Anal. 2016, 27, 1734–1735. [Google Scholar] [PubMed]
  26. Liu, G.H.; Wang, S.Y.; Huang, W.Y.; Zhao, G.H.; Wei, S.J.; Song, H.Q.; Xu, M.J.; Lin, R.Q.; Zhou, D.H.; Zhu, X.Q. The complete mitochondrial genome of galba pervia (gastropoda: Mollusca), an intermediate host snail of fasciola spp. PLoS ONE 2012, 7, e42172. [Google Scholar] [CrossRef] [PubMed]
  27. Zeng, T.; Yin, W.; Xia, R.; Fu, C.; Jin, B. Complete mitochondrial genome of a freshwater snail, semisulcospira libertina (cerithioidea: Semisulcospiridae). Mitochondrial DNA 2015, 26, 897–898. [Google Scholar] [CrossRef] [PubMed]
  28. Gao, B.; Peng, C.; Chen, Q.; Zhang, J.; Shi, Q. Mitochondrial genome sequencing of a vermivorous cone snail Conus quercinus supports the correlative analysis between phylogenetic relationships and dietary types of Conus species. PLoS ONE 2018, 13, e0193053. [Google Scholar] [CrossRef] [PubMed]
  29. Wolstenholme, D.R. Animal mitochondrial DNA: Structure and evolution. Int. Rev. Cytol. 1992, 141, 173–216. [Google Scholar] [PubMed]
  30. Abalde, S.; Tenorio, M.J.; Afonso, C.M.L.; Zardoya, R. Mitogenomic phylogeny of cone snails endemic to senegal. Mol. Phylogenet. Evol. 2017, 112, 79–87. [Google Scholar] [CrossRef] [PubMed]
  31. Fontanilla, I.K.; Naggs, F.; Wade, C.M. Molecular phylogeny of the achatinoidea (mollusca: Gastropoda). Mol. Phylogenet. Evol. 2017, 114, 382–385. [Google Scholar] [CrossRef] [PubMed]
  32. Nolan, J.R.; Bergthorsson, U.; Adema, C.M. Physella acuta: Atypical mitochondrial gene order among panpulmonates (gastropoda). J. Mollus. Stud. 2014, 80, 388–399. [Google Scholar] [CrossRef] [PubMed]
  33. Osca, D.; Templado, J.; Zardoya, R. The mitochondrial genome of ifremeria nautilei and the phylogenetic position of the enigmatic deep-sea abyssochrysoidea (mollusca: Gastropoda). Gene 2014, 547, 257–266. [Google Scholar] [CrossRef] [PubMed]
  34. Wang, J.G.; Zhang, D.; Jakovlic, I.; Wang, W.M. Sequencing of the complete mitochondrial genomes of eight freshwater snail species exposes pervasive paraphyly within the viviparidae family (caenogastropoda). PLoS ONE 2017, 12, e0181699. [Google Scholar] [CrossRef] [PubMed]
  35. White, T.R.; Conrad, M.M.; Tseng, R.; Balayan, S.; Golding, R.; Martins, A.M.D.; Dayrat, B.A. Ten new complete mitochondrial genomes of pulmonates (mollusca: Gastropoda) and their impact on phylogenetic relationships. BMC Evol. Biol. 2011, 11, 295. [Google Scholar] [CrossRef] [PubMed]
  36. Sudbery, P. Human Molecular Genetics, 2nd ed.; Pearson Education: Iowa City, IA, USA, 2002. [Google Scholar]
  37. Arquez, M.; Colgan, D.; Castro, L.R. Sequence and comparison of mitochondrial genomes in the genus nerita (gastropoda: Neritimorpha: Neritidae) and phylogenetic considerations among gastropods. Mar. Genom. 2014, 15, 45–54. [Google Scholar] [CrossRef] [PubMed]
  38. Gaitan-Espitia, J.D.; Nespolo, R.F.; Opazo, J.C. The complete mitochondrial genome of the land snail cornu aspersum (helicidae: Mollusca): Intra-specific divergence of protein-coding genes and phylogenetic considerations within euthyneura. PLoS ONE 2013, 8. [Google Scholar] [CrossRef] [PubMed]
  39. Osca, D.; Irisarri, I.; Todt, C.; Grande, C.; Zardoya, R. The complete mitochondrial genome of scutopus ventrolineatus (mollusca: Chaetodermomorpha) supports the aculifera hypothesis. BMC Evol. Biol. 2014, 14, 197. [Google Scholar] [CrossRef] [PubMed]
  40. Sevigny, J.L.; Kirouac, L.E.; Thomas, W.K.; Ramsdell, J.S.; Lawlor, K.E.; Sharifi, O.; Grewal, S.; Baysdorfer, C.; Curr, K.; Naimie, A.A.; et al. The mitochondrial genomes of the nudibranch mollusks, melibe leonina and tritonia diomedea, and their impact on gastropod phylogeny. PLoS ONE 2015, 10. [Google Scholar] [CrossRef] [PubMed]
  41. Yang, H.; Xia, J.; Zhang, J.E.; Yang, J.; Zhao, H.; Wang, Q.; Sun, J.; Xue, H.; Wu, Y.; Chen, J.; et al. Characterization of the complete mitochondrial genome sequences of three croakers (perciformes, sciaenidae) and novel insights into the phylogenetics. Int. J. Mol. Sci. 2018, 19, 1741. [Google Scholar] [CrossRef] [PubMed]
  42. Guo, J.; Yang, H.R.; Zhang, C.X.; Xue, H.Y.; Xia, Y.; Zhang, J.E. Complete mitochondrial genome of the apple snail pomacea diffusa (gastropoda, ampullariidae) with phylogenetic consideration. Mitochondrial DNA B 2017, 2, 865–867. [Google Scholar] [CrossRef]
  43. Yang, H.; Zhang, J.E.; Guo, J.; Deng, Z.; Luo, H.; Luo, M.; Zhao, B. The complete mitochondrial genome of the giant african snail achatina fulica (mollusca: Achatinidae). Mitochondrial. DNA A DNA Mapp. Seq. Anal. 2016, 27, 1622–1624. [Google Scholar] [PubMed]
  44. Yang, H.; Zhang, J.E.; Luo, H.; Luo, M.; Guo, J.; Deng, Z.; Zhao, B. The complete mitochondrial genome of the mudsnail cipangopaludina cathayensis (gastropoda: Viviparidae). Mitochondrial. DNA A DNA Mapp. Seq. Anal. 2016, 27, 1892–1894. [Google Scholar] [PubMed]
  45. Yang, H.R.; Zhang, J.E.; Deng, Z.X.; Luo, H.; Guo, J.; He, S.M.; Luo, M.Z.; Zhao, B.L. The complete mitochondrial genome of the golden apple snail pomacea canaliculata (gastropoda: Ampullariidae). Mitochondrial DNA B 2016, 1, 45–47. [Google Scholar] [CrossRef]
  46. Francino, M.P.; Ochman, H. Strand asymmetries in DNA evolution. Trends Genet. TIG 1997, 13, 240–245. [Google Scholar] [CrossRef]
  47. Perna, N.T.; Kocher, T.D. Patterns of nucleotide composition at fourfold degenerate sites of animal mitochondrial genomes. J. Mol. Evol. 1995, 41, 353–358. [Google Scholar] [CrossRef] [PubMed]
  48. Williams, S.T.; Foster, P.G.; Littlewood, D.T.J. The complete mitochondrial genome of a turbinid vetigastropod from miseq illumina sequencing of genomic DNA and steps towards a resolved gastropod phylogeny. Gene 2014, 533, 38–47. [Google Scholar] [CrossRef] [PubMed]
  49. Thaewnon-ngiw, B.; Klinbunga, S.; Phanwichien, K.; Sangduen, N.; Lauhachinda, N.; Menasveta, P. Genetic diversity and molecular markers in introduced and Thai native apple snails (Pomacea and Pila). J. Biochem. Mol. Biol. 2004, 37, 493–502. [Google Scholar] [CrossRef] [PubMed]
  50. Rawlings, T.A.; Maclnnis, M.J.; Bieler, R.; Boore, J.L.; Collins, T.M. Sessile snails, dynamic genomes: Gene rearrangements within the mitochondrial genome of a family of caenogastropod molluscs. BMC Genom. 2010, 11, 440. [Google Scholar] [CrossRef] [PubMed]
  51. Yang, Z.; Bielawski, J.P. Statistical methods for detecting molecular adaptation. Trends Ecol. Evol. 2000, 15, 496–503. [Google Scholar] [CrossRef] [Green Version]
  52. Lynch, M.; Koskella, B.; Schaack, S. Mutation pressure and the evolution of organelle genomic architecture. Science 2006, 311, 1727–1730. [Google Scholar] [CrossRef] [PubMed]
  53. Zhuang, X.; Qu, M.; Zhang, X.; Ding, S. A comprehensive description and evolutionary analysis of 22 grouper (perciformes, epinephelidae) mitochondrial genomes with emphasis on two novel genome organizations. PLoS ONE 2013, 8, e73561. [Google Scholar] [CrossRef] [PubMed]
  54. Shi, X.; Tian, P.; Lin, R.; Huang, D.; Wang, J. Characterization of the complete mitochondrial genome sequence of the globose head whiptail cetonurus globiceps (gadiformes: Macrouridae) and its phylogenetic analysis. PLoS ONE 2016, 11, e0153666. [Google Scholar] [CrossRef] [PubMed]
  55. Chao, Q.J.; Li, Y.D.; Geng, X.X.; Zhang, L.; Dai, X.; Zhang, X.; Li, J.; Zhang, H.J. Complete mitochondrial genome sequence of Marmota himalayana (rodentia: Sciuridae) and phylogenetic analysis within rodentia. Genet. Mol. Res. GMR 2014, 13, 2739–2751. [Google Scholar] [CrossRef] [PubMed]
  56. Schattner, P.; Brooks, A.N.; Lowe, T.M. The trnascan-se, snoscan and snogps web servers for the detection of trnas and snornas. Nucleic Acids Res. 2005, 33, W686–W689. [Google Scholar] [CrossRef] [PubMed]
  57. Lavrov, D.V.; Brown, W.M.; Boore, J.L. A novel type of rna editing occurs in the mitochondrial trnas of the centipede lithobius forficatus. Proc. Natl. Acad. Sci. USA 2000, 97, 13738–13742. [Google Scholar] [CrossRef] [PubMed]
  58. Li, T.; Yang, J.; Li, Y.; Cui, Y.; Xie, Q.; Bu, W.; Hillis, D.M. A mitochondrial genome of rhyparochromidae (hemiptera: Heteroptera) and a comparative analysis of related mitochondrial genomes. Sci. Rep. 2016, 6, 35175. [Google Scholar] [CrossRef] [PubMed]
  59. Li, Y.; Hu, X.D.; Yang, R.H.; Hsiang, T.; Wang, K.; Liang, D.Q.; Liang, F.; Cao, D.M.; Zhou, F.; Wen, G.; et al. Complete mitochondrial genome of the medicinal fungus ophiocordyceps sinensis. Sci. Rep. 2015, 5, 13892. [Google Scholar] [CrossRef] [PubMed]
  60. Liu, G.H.; Nadler, S.A.; Liu, S.S.; Podolska, M.; D’Amelio, S.; Shao, R.; Gasser, R.B.; Zhu, X.Q. Mitochondrial phylogenomics yields strongly supported hypotheses for ascaridomorph nematodes. Sci. Rep. 2016, 6, 39248. [Google Scholar] [CrossRef] [PubMed]
  61. Kumar, S.; Stecher, G.; Tamura, K. Mega7: Molecular evolutionary genetics analysis version 7.0 for bigger datasets. Mol. Biol. Evol. 2016, 33, 1870–1874. [Google Scholar] [CrossRef] [PubMed]
  62. Estebenet, A.L.; Martin, P.R. Shell interpopulation variation and its origin in pomacea canaliculata (gastropoda: Ampullariidae) from Southern Pampas, Argentina. J. Mollus. Stud. 2003, 69, 301–310. [Google Scholar] [CrossRef]
  63. Matsukura, K.; Okuda, M.; Kubota, K.; Wada, T. Genetic divergence of the genus Pomacea (gastropoda: Ampullariidae) distributed in japan, and a simple molecular method to distinguish P. Canaliculata and P. Insularum. Appl. Entomol. Zool 2008, 43, 535–540. [Google Scholar] [CrossRef]
  64. Green, M.R.; Sambrook, J. Molecular Cloning: A Laboratory Manual, 4th ed.; Cold Spring Harbor Laboratory Press: New York, NY, USA, 2012. [Google Scholar]
  65. Iwasaki, W.; Fukunaga, T.; Isagozawa, R.; Yamada, K.; Maeda, Y.; Satoh, T.P.; Sado, T.; Mabuchi, K.; Takeshima, H.; Miya, M.; et al. Mitofish and mitoannotator: A mitochondrial genome database of fish with an accurate and automatic annotation pipeline. Mol. Biol. Evol. 2013, 30, 2531–2540. [Google Scholar] [CrossRef] [PubMed]
  66. Laslett, D.; Canback, B. Arwen: A program to detect trna genes in metazoan mitochondrial nucleotide sequences. Bioinformatics 2008, 24, 172–175. [Google Scholar] [CrossRef] [PubMed]
  67. Lowe, T.M.; Chan, P.P. Trnascan-se on-line: Integrating search and context for analysis of transfer rna genes. Nucleic Acids Res. 2016, 44, W54–W57. [Google Scholar] [CrossRef] [PubMed]
  68. Junqueira, A.C.; Lessinger, A.C.; Torres, T.T.; da Silva, F.R.; Vettore, A.L.; Arruda, P.; Azeredo Espin, A.M. The mitochondrial genome of the blowfly Chrysomya chloropyga (diptera: Calliphoridae). Gene 2004, 339, 7–15. [Google Scholar] [CrossRef] [PubMed]
  69. Sharma, D.; Issac, B.; Raghava, G.P.; Ramaswamy, R. Spectral repeat finder (srf): Identification of repetitive sequences using fourier transformation. Bioinformatics 2004, 20, 1405–1412. [Google Scholar] [CrossRef] [PubMed]
  70. Kurtz, S.; Choudhuri, J.V.; Ohlebusch, E.; Schleiermacher, C.; Stoye, J.; Giegerich, R. Reputer: The manifold applications of repeat analysis on a genomic scale. Nucleic Acids Res. 2001, 29, 4633–4642. [Google Scholar] [CrossRef] [PubMed]
  71. Sharp, P.M.; Li, W.H. The codon adaptation index--A measure of directional synonymous codon usage bias, and its potential applications. Nucleic Acids Res. 1987, 15, 1281–1295. [Google Scholar] [CrossRef] [PubMed]
  72. Darriba, D.; Taboada, G.L.; Doallo, R.; Posada, D. Prottest 3: Fast selection of best-fit models of protein evolution. Bioinformatics 2011, 27, 1164–1165. [Google Scholar] [CrossRef] [PubMed]
  73. Stamatakis, A. Raxml version 8: A tool for phylogenetic analysis and post-analysis of large phylogenies. Bioinformatics 2014, 30, 1312–1313. [Google Scholar] [CrossRef] [PubMed]
  74. Ronquist, F.; Huelsenbeck, J.P. Mrbayes 3: Bayesian phylogenetic inference under mixed models. Bioinformatics 2003, 19, 1572–1574. [Google Scholar] [CrossRef] [PubMed]
  75. He, Z.; Zhang, H.; Gao, S.; Lercher, M.J.; Chen, W.H.; Hu, S. Evolview v2: An online visualization and management tool for customized and annotated phylogenetic trees. Nucleic Acids Res. 2016, 44, W236–W241. [Google Scholar] [CrossRef] [PubMed]
  76. Zhang, H.; Gao, S.; Lercher, M.J.; Hu, S.; Chen, W.H. Evolview, an online tool for visualizing, annotating and managing phylogenetic trees. Nucleic Acids Res. 2012, 40, W569–W572. [Google Scholar] [CrossRef] [PubMed]
  77. Kumar, S.; Stecher, G.; Suleski, M.; Hedges, S.B. Timetree: A resource for timelines, timetrees, and divergence times. Mol. Biol. Evol. 2017, 34, 1812–1819. [Google Scholar] [CrossRef] [PubMed]
Figure 1. Gene map of the complete mt genomes for P. canaliculata (GenBank accession No. KU052865), P. diffusa (KY008698) and P. maculate (KY008699). The larger ring indicates gene arrangement and distribution. The smaller ring indicates the GC content. ND1-6: NADH dehydrogenase subunits 1–6; COXI-III: cytochrome c oxidase subunits 1–3; ATP6 and ATP8: ATPase subunits 6 and 8; Cytb: cytochrome b; rrn: ribosomal RNA genes; tRNA: transfer RNA gene.
Ijms 19 03646 g001
Figure 2. Graphical illustration showing the AT- and GC-skew in the PCGs of the mitochondrial genome of P. canaliculata (PC), P. diffusa (PD) and P. maculate (PM).
Ijms 19 03646 g002
Figure 3. Evolutionary rates of the mitochondrial genome of P. canaliculata (PC), P. diffusa (PD) and P. maculate (PM). The rates of non-synonymous substitutions to the rate of synonymous substitutions (Ka/Ks) for each PCG are indicated.
Ijms 19 03646 g003
Figure 4. Overall mean p-genetic distances between P. canaliculata, P. diffusa and P. maculate for each of 13 PCG. Values were calculated using the first and second nucleotide positions, the total codon and over the full sequence.
Ijms 19 03646 g004
Figure 5. Codon Frequency (A) and RSCU (B) in the mitochondrial genomes of P. canaliculata (PC), P. diffusa (PD) and P. maculate (PM). PC-A indicated the Codon Frequency of P. canaliculata; PD-A indicated the Codon Frequency of P. diffusa; PM-A indicated the Codon Frequency of P. maculate. PC-B indicated the RSCU of P. canaliculata; PD-B indicated the RSCU of P. diffusa; PM-B indicated the RSCU of P. maculate.
Ijms 19 03646 g005aIjms 19 03646 g005b
Figure 6. Graphical map of the BLAST results showing nucleotide identity between the complete mitochondrial genomes of P. canaliculata and species from the orders Sorbeoconcha and Architaenioglossa. BLAST results are presented in order with the sequence most similar to the reference (P. canaliculata) placed closer to the outer edge of the map. The gene regions, Blast identities and AT skew are depicted from outside to inside on the circle. The species from outside to inside are, respectively, P. canaliculata (KU052865), P. maculata (KY008699), P. diffusa (KY008698), M. cornuarietis (NC_025334), T. bacillum (NC_029717), S. libertine (NC_023364), T. sarasinorum (NC_030263) and C. cathayensis (NC_025577).
Ijms 19 03646 g006
Figure 7. Graphical map of the BLAST results of mitochondrial CDS identities between P. canaliculata (NC_024586) and Sorbeoconcha and Architaenioglossa species. The sequences most similar to the reference (P. canaliculata) are placed closer to the outer edge of the map. COG (Clusters of Orthologous Groups of proteins), gene region, Blast identity and AT skew are shown from outside to inside. The species from outside to inside are named as in Figure 6.
Ijms 19 03646 g007
Figure 8. Bayesian inference tree inferred from the amino acid sequences of 13 PCGs of 47 species of Caenogastropoda. Helix aspersa, NC_021747, was used as the outgroup. The numbers at the nodes represent the Bayesian posterior probabilities. Species in red indicate sequences generated in this study.
Ijms 19 03646 g008
Figure 9. Chronogram for the 47 species of Caenogastropoda with a single out-group (Helix aspersa, NC_021747) based on the Bayesian topology calculated from analysis of the 13 PCGs. Divergence times were estimated using three calibrations. Numbers near the nodes indicated the average estimated divergence time estimated in Mya.
Ijms 19 03646 g009
Table 1. Summary of gene/element feature of P. canaliculata, P. diffusa and P. maculate.
NO.Gene/ElementStrandSize (bp)GC-Content (%)Amino Acids (aa)Inferred Initiation CodonInferred Termination CodonOne Letter CodeAnti-CodonIntergenic Nucleotide*(bp)
1COXIH153633.27–36.07511ATGTAG/TAA 27–32
2COXIIH68731.3–34.79228ATGTAG/TAA 17–21
3tRNA-AspH6814.71–17.65 DGTC0
4ATP8H15921.38–26.4252ATGTAA 12–29
5ATP6H699–71426.90–29.41232–237ATGTAG/TAA 15–28
6tRNA-MetL64–6627.69–34.38 MCAT23–35
7tRNA-TyrL65–6831.34–41.18 YGTA8–25
8tRNA-CysL62–6521.54–29.03 CGCA5–19
9tRNA-TrpL64–6827.94–35.38 WTCA11–119
10tRNA-GlnL62–6434.38–35.48 QTTG9–10
11tRNA-GlyL66–6719.40–20.9 GTCC24–31
12tRNA-GluL65–6720.90–24.62 ETTC0
13rrnsH929–95028.09–29.68 0–2
14tRNA-ValH/L67–6920.90–29.41 VTAC0–1
15rrnlH1331–134525.47–27.14 0
16tRNA-LeuH64–6623.44–27.27 LTAG(−1)–0
17tRNA-LeuH68–6923.53–26.09 LTAA0
18ND1H945–96028.02–31.96314–319ATGTAG/TAA (−12)–9
19tRNA-ProH66–6829.85–30.88 PTGG0
20ND6H49523.64–26.87164ATGTAA 10–19
21CytbH114028.51–32.02379ATGTAG/TAA 9–17
22tRNA-SerH6633.33–34.85 STGA20–30
23tRNA-ThrH/L68–7130.99–35.29 TTGT9–14
24ND4LH297–31226.92–27.9598–103 ATA, ATGTAG/TAA (−7)–20
25ND4H1341–136225.73–29.30446–453ATA, ATGTAA 3–9
26tRNA-HisH64–6516.92–21.88 HGTG0
27ND5H1710–172828.13–31.42569–575ATGTAA (−20)–0
28tRNA-PheH68–6930.88–33.33 FGAA141–1617
29COXIIIH78033.72–37.69259ATA, ATGTAA 47–67
30tRNA-LysH67–6829.85–32.35 KTTT10–18
31tRNA-AlaH68–7123.19–28.17 ATGC29–46
32tRNA-ArgH67–6929.85–33.33 RTCG2–5
33tRNA-AsnH69–7121.13–24.64 NGTT19–30
34tRNA-IleH70–7230.56–34.29 IGAT0–6
35ND3H35429.66–31.92117ATGTAA 20–37
36tRNA-SerH6830.88–32.35 SGCT0
37ND2H1062–107127.12–30.91353–356ATGTAG/TAA 4–6
Intergenic Nucleotide*(bp): positive values indicated the interval sequence of adjacent genes, and negative values indicated the overlapping of adjacent genes.
Table 2. Summary of the base composition of the mitogenomes for eight species of the orders Sorbeoconcha and Architaenioglossa in the Gastropoda.
SpeicsPomacea canaliculataPomacea diffusaPomacea maculataMarisa cornuarietisCipangopaludina cathayensisTurritella bacillumTylomelania sarasinorumSemisulcospira libertina
Accession numberKU052865KY008698KY008699NC_025334.1NC_025577.1NC_029717.1NC_030263.1NC_023364.1
TaxonomyCaenogastropoda, ArchitaenioglossaCaenogastropoda, ArchitaenioglossaCaenogastropoda, ArchitaenioglossaCaenogastropoda, ArchitaenioglossaCaenogastropoda, ArchitaenioglossaCaenogastropoda, SorbeoconchaCaenogastropoda, SorbeoconchaCaenogastropoda, Sorbeoconcha
Length (bp)16,96516,64015,51615,92317,15715,86816,63215,432
A (%)32.6130.1330.8128.9426.7428.8529.4931.4
T (%)39.8539.6241.1341.0444.5135.8835.6534.76
C (%)12.0314.2412.8113.348.2816.2116.5617.78
G (%)15.5116.0215.2516.6820.4819.0618.316.06
AT (%)72.4669.7571.9469.9871.2564.7365.1466.16
AT-skew−0.0998−0.1361−0.1433−0.1729−0.2493−0.109−0.0946−0.0508
GC-skew0.12630.0590.08680.11130.42430.08090.0499−0.0507
Length (aa)37243737373337123727373737553750
AT (%) (all)70.7167.987168.9870.2963.8964.2965.66
AT (%) (3rd)72.3876.0285.6182.3479.3868.7568.5869.35
AT-skew−0.2099−0.2064−0.2022−0.2312−0.3243−0.119−0.1033−0.0642
GC-skew0.08440.04660.06970.07640.38430.08620.0696−0.0397
Length (bp)13341345133113591387135713821347
AT (%)73.5472.8674.5372.7772.1768.5366.9368.08
AT-skew0.00510.01630.006−0.0253−0.1109−0.073−0.107−0.06
GC-skew0.15010.13970.16220.23240.4456−0.002−0.1116−0.0791
Length (bp)929950934977895949899951
AT (%)71.9170.3270.9969.8166.0367.7664.2966.56
AT-skew0.0120.0210.0377−0.0264−0.0592−0.154−0.1142−0.0142
GC-skew0.2490.17730.19560.25420.4474−0.033−0.1153−0.1509
Length (bp)14731484147915001471148614821489
AT (%)71.8971.5672.0868.0772.3364.864.365.14
AT-skew−0.0293−0.0226−0.0263−0.0245−0.0602−0.09−0.0766−0.0124
GC-skew0.08210.06160.08470.08140.27760.05540.0057−0.0405

