Article

Exploring the Structural Transformation Mechanism of Chinese and Thailand Silk Fibroin Fibers and Formic-Acid Fabricated Silk Films

1
Center of Analysis and Testing, Nanjing Normal University, Nanjing 210023, China
2
School of Chemistry and Materials Science, Nanjing Normal University Jiangsu, Nanjing 210023, China
3
School of Physics and Technology, Nanjing Normal University, Nanjing 210023, China
4
Department of Physics and Astronomy, Rowan University, Glassboro, NJ 08028, USA
5
Department of Biomedical Engineering, Rowan University, Glassboro, NJ 08028, USA
6
Department of Molecular and Cellular Biosciences, Rowan University, Glassboro, NJ 08028, USA
*
Authors to whom correspondence should be addressed.
Int. J. Mol. Sci. 2018, 19(11), 3309; https://doi.org/10.3390/ijms19113309
Submission received: 19 September 2018 / Revised: 13 October 2018 / Accepted: 22 October 2018 / Published: 24 October 2018
(This article belongs to the Special Issue Synthesis and Applications of Biopolymer Composites)

Abstract

:
Silk fibroin (SF) is a protein polymer derived from insects, which has unique mechanical properties and tunable biodegradation rate due to its variable structures. Here, the variability of structural, thermal, and mechanical properties of two domesticated silk films (Chinese and Thailand B. Mori) regenerated from formic acid solution, as well as their original fibers, were compared and investigated using dynamic mechanical analysis (DMA) and Fourier transform infrared spectrometry (FTIR). Four relaxation events appeared clearly during the temperature region of 25 °C to 280 °C in DMA curves, and their disorder degree (fdis) and glass transition temperature (Tg) were predicted using Group Interaction Modeling (GIM). Compared with Thai (Thailand) regenerated silks, Chin (Chinese) silks possess a lower Tg, higher fdis, and better elasticity and mechanical strength. As the calcium chloride content in the initial processing solvent increases (1%–6%), the Tg of the final SF samples gradually decrease, while their fdis increase. Besides, SF with more non-crystalline structures shows high plasticity. Two α- relaxations in the glass transition region of tan δ curve were identified due to the structural transition of silk protein. These findings provide a new perspective for the design of advanced protein biomaterials with different secondary structures, and facilitate a comprehensive understanding of the structure-property relationship of various biopolymers in the future.

Graphical Abstract

1. Introduction

Silk is a biopolymer with perfect biocompatibility and tunable biodegradability due to its unique protein compositions and structures [1,2,3,4,5]. In the past few decades, silk has been developed into variable biomaterials including tubes, sponges, hydrogels, fibers and thin films, and combined with various functional nanomaterials to provide unique properties that can be applied to biomedical, electrical, or material engineering [6,7,8,9,10,11].
Generally, different material fabrication methods can affect the multi-step structural transitions and physical properties of silk fibroin materials. For example, Philips et al. [12] compared the dissolution of silk fibroin using different ionic liquids, and demonstrated that 1-butyl-3-methylimidazolium chloride, 1-butyl-2,3-dimethylimidazolium, and 1-ethyl-3-methylimidazolium were able to disrupt the hydrogen bonding in silk fibroin fibers. By controlling drying rate, Lu et al. [13] were able to prepare water-insoluble silk films from 9.3 mol/L LiBr aqueous solution. Tian et al. [14] added poly epoxy materials, such as formaldehyde, glutaraldehyde, and epoxy compounds into silk fibroin. They suggested that the flexibility of silk materials can be improved through the epoxy compounds, which also acted as crosslinking agents for silk fibroin proteins.
Dynamic Mechanical Analysis (DMA) is one of thermal analysis techniques, which is an advanced technique for measuring the viscoelastic change of polymeric materials during their structural relaxation. [15,16,17,18,19,20] Juan et al. [21] investigated the effect of temperature and thermal history on the mechanical properties of native silkworm and spider dragline silks by dynamic mechanical thermal analysis (DMTA). Their results showed that the DMA storage modulus and loss tangent of silk materials depend on their different chemical and physical processing methods. Wang et al. [22] also explored the variability of individual as-reeled A. pernyi silk fibers using DMTA. They suggested that different polar solvents could affect the tensile properties and structure of silk fibers during the quasi-static tensile tests in ethanol, air, methanol, or water. Porter et al. [23,24] assumed that spider silk’s stiffness and strength attributed to the high cohesive energy density of hydrogen bonding, and the toughness attributed to the high energy absorption during post-yield deformation. Furthermore, they found that silk strength was associated with the peculiar molecular and nanoscale structure of its morphology. Kawano et al. [25] measured Nafion silk films with different types of solvent and cations using DMA in the controlled force mode. Their results demonstrated that silk elasticity decreased with the increase of water, methanol, ethanol, or ethanol/water mixture content in the Nafion film, and also decreased with increasing temperature and cation substitutions (Li+, Na+, K+, Cs+ and Rb+).
Besides, Step-scan Differential Scanning Calorimetry (SSDSC) is a relatively new technique which is another thermal analysis technique under temperature modulation, where the temperature program comprises a periodic succession of short, heating rates, and isothermal steps; thus, the measured heat flow contains contributions which arise from the heat capacity and those due to physical transformations or chemical reactions. The total heat flow can be separated into the reversing and non-reversing components, because the reversing component is only observed on the heating part of the cycle and the non-reversing only on the isothermal. Since both the heat capacity equilibration and DSC equilibration are rapid, the Cp calculation is said to be independent of kinetic processes [26]. Therefore, through SSDSC, the “reversing heat capacity”, which represents the reversible heat effect of samples within the temperature range of the modulation, such as the specific heat of samples during the glass transition region, can be measured and calculated. Hu et al. [3] used temperature modulated DSC (TMDSC) to eliminate the non-reversing thermal phenomena of the sample and measure the reversing thermal properties of the silk-tropoelastin samples. Sheng et al. [27] characterized the heat capacity, phase contents and transitions of PLA scaffold using SSDSC approach.
Bombyx Mori silkworms are domestically raised silkworms that can produce white silk fibers (e.g., from China (Chin silk)), or yellow silk fibers (e.g., from Thailand (Thai silk)), due to their different geographical and growing environments [28,29]. Derived from Bombyx mori cocoons, silk fibroin (SF) is a fibrous protein consisting of repeating glycine-alanine or glycine-serine peptides responsible for beta-sheet crystal structures mixed with amorphous regions [3,4,5,6,7,8,9,10,11]. Different silkworm species have different amino acid compositions and therefore have different crystallinity [5,23,24]. The environmental climate can also affect the mulberry leaves. Various silkworm leaves or foods may lead to differences in their cocoons, such as the color and strength. In our previous work, Indian Antheraea mylitta, Philosamia ricini, Antheraea assamensis, Thailand and Chinese Bombyx mori mulberry (Thai, Chin) silk films have been successfully regenerated from the aqueous solution [30]. Moreover, it was found that Chin and Thai silk fibroin films can be regenerated through a calcium chloride-formic acid (CaCl2/FA) solution system [31]. It was demonstrated that Ca2+ ions could interact with the silk structure, and change their glass transition temperature, specific heat, and thermal stability [32]. In this work, the DMA technique was, for the first time, used to explore and compare the structure and mechanical property of these two kinds of silk fibers (Thai, Chin), and also combined with SSDSC and FTIR technologies to investigate these properties and transformation mechanism of their protein films regenerated from the FA solution with a changing CaCl2 content (1%~6%). In addition, a theory developed by Porter et al. [24] Group Interaction Modeling (GIM), was used to investigate and verified the relationship between the stability and structure of regenerated silk materials during the glass transition temperature region (Tg). This work also explained the impact of CaCl2 content to the dynamic mechanical properties of two domesticated silks comprehensively. These comparative studies are important for the design of advanced silk-based materials with tunable structures and properties.

2. Results and Discussion

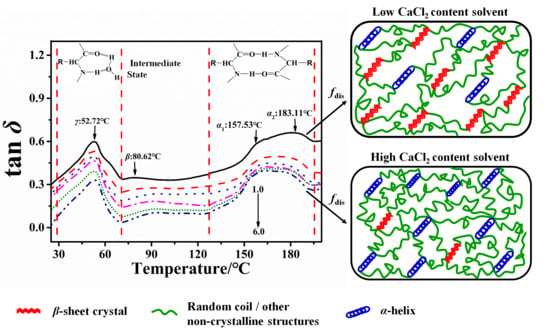
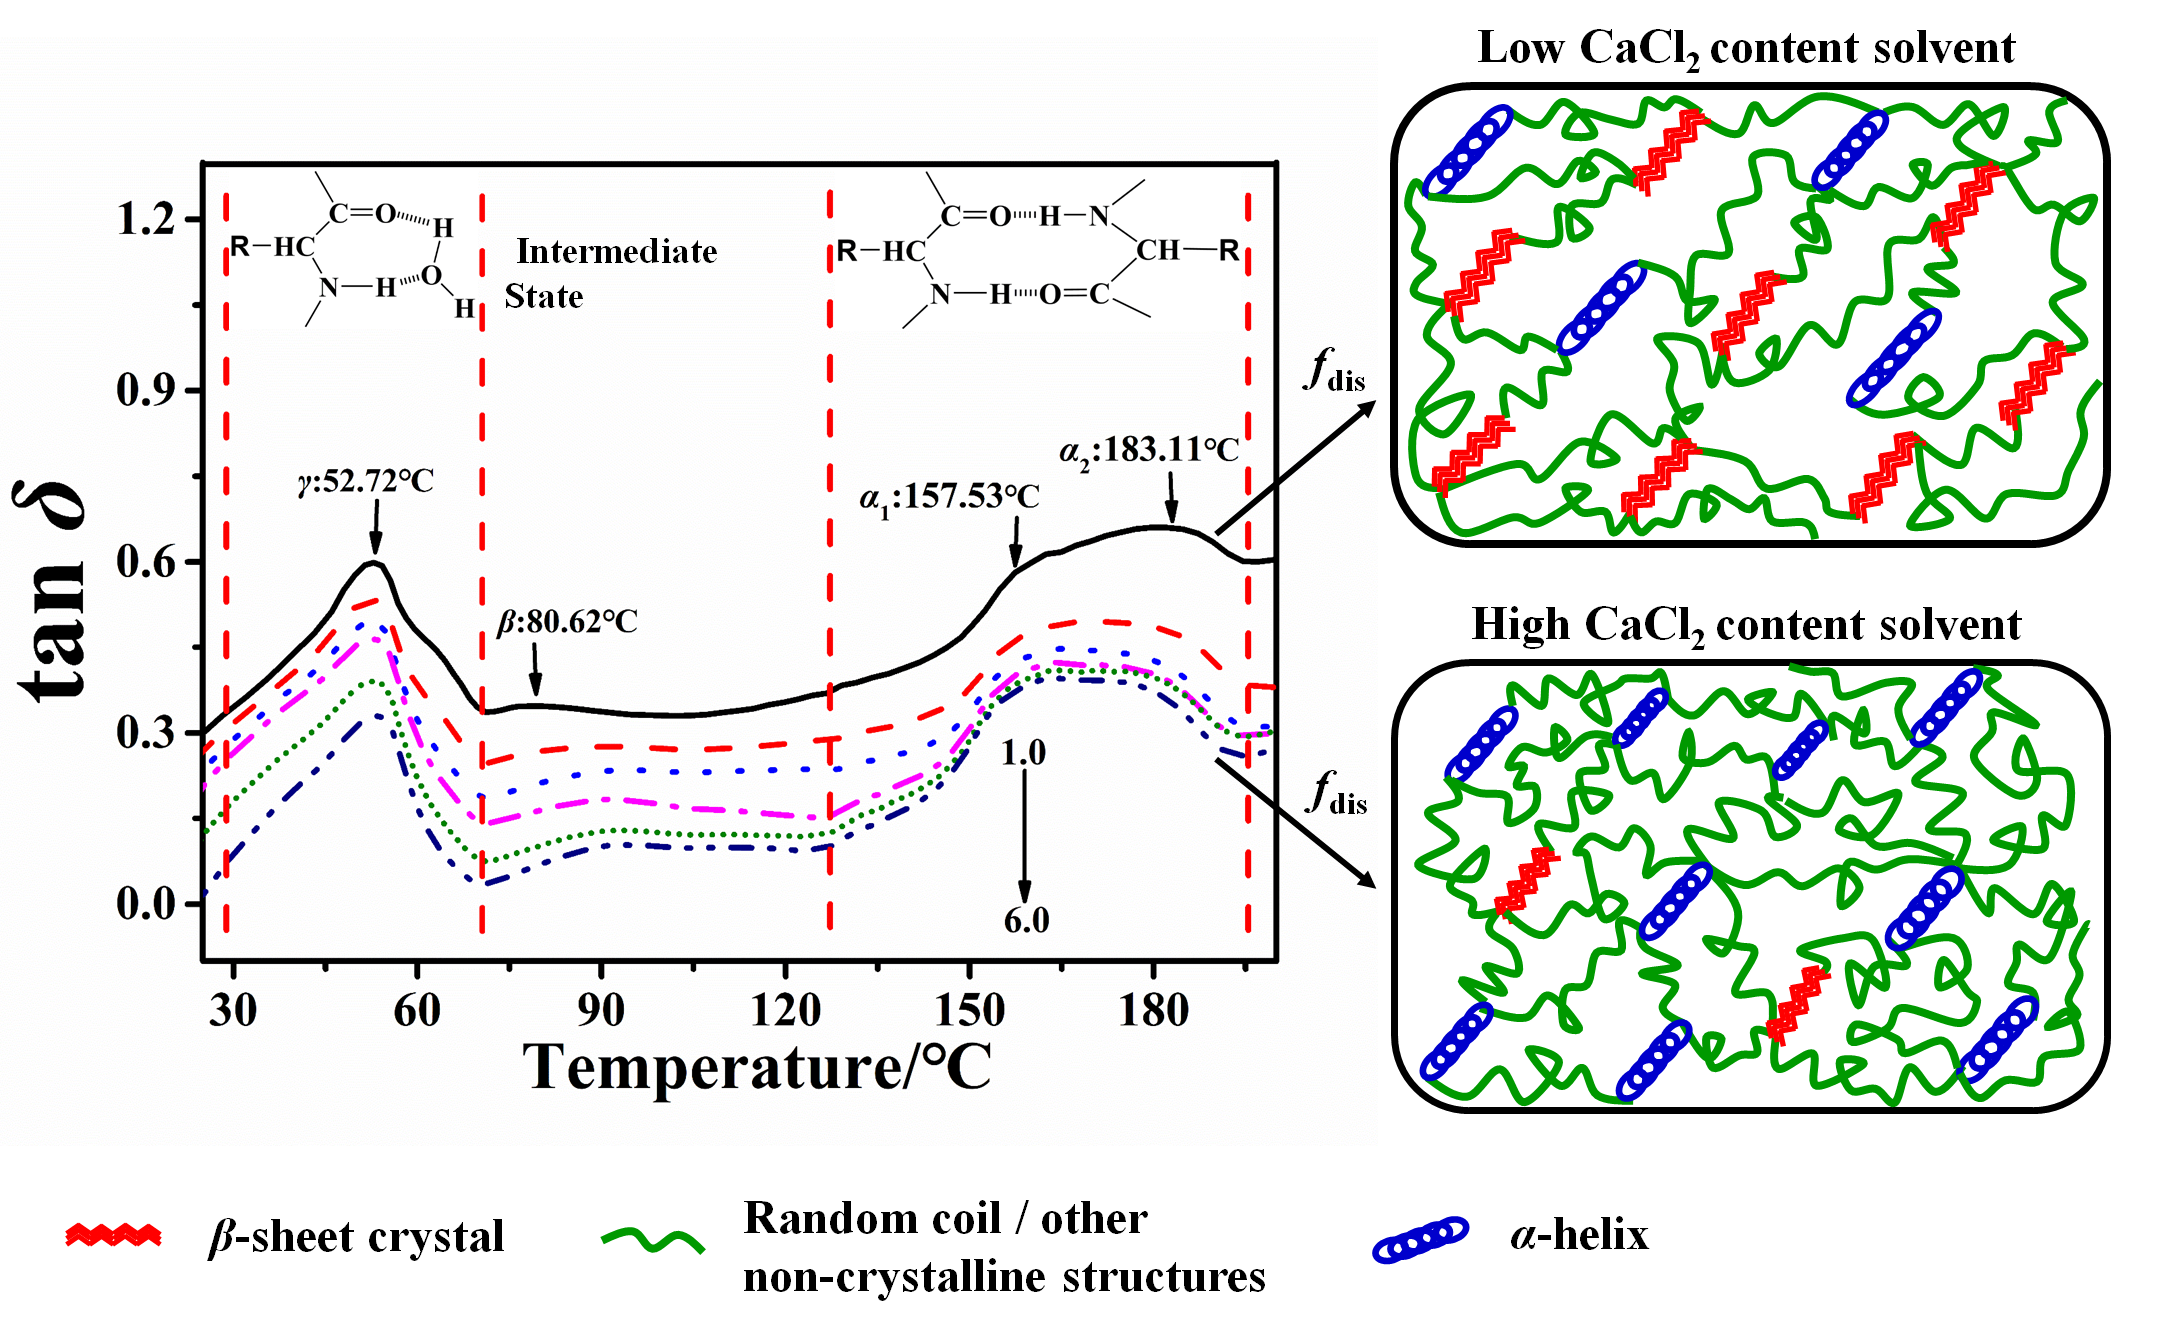
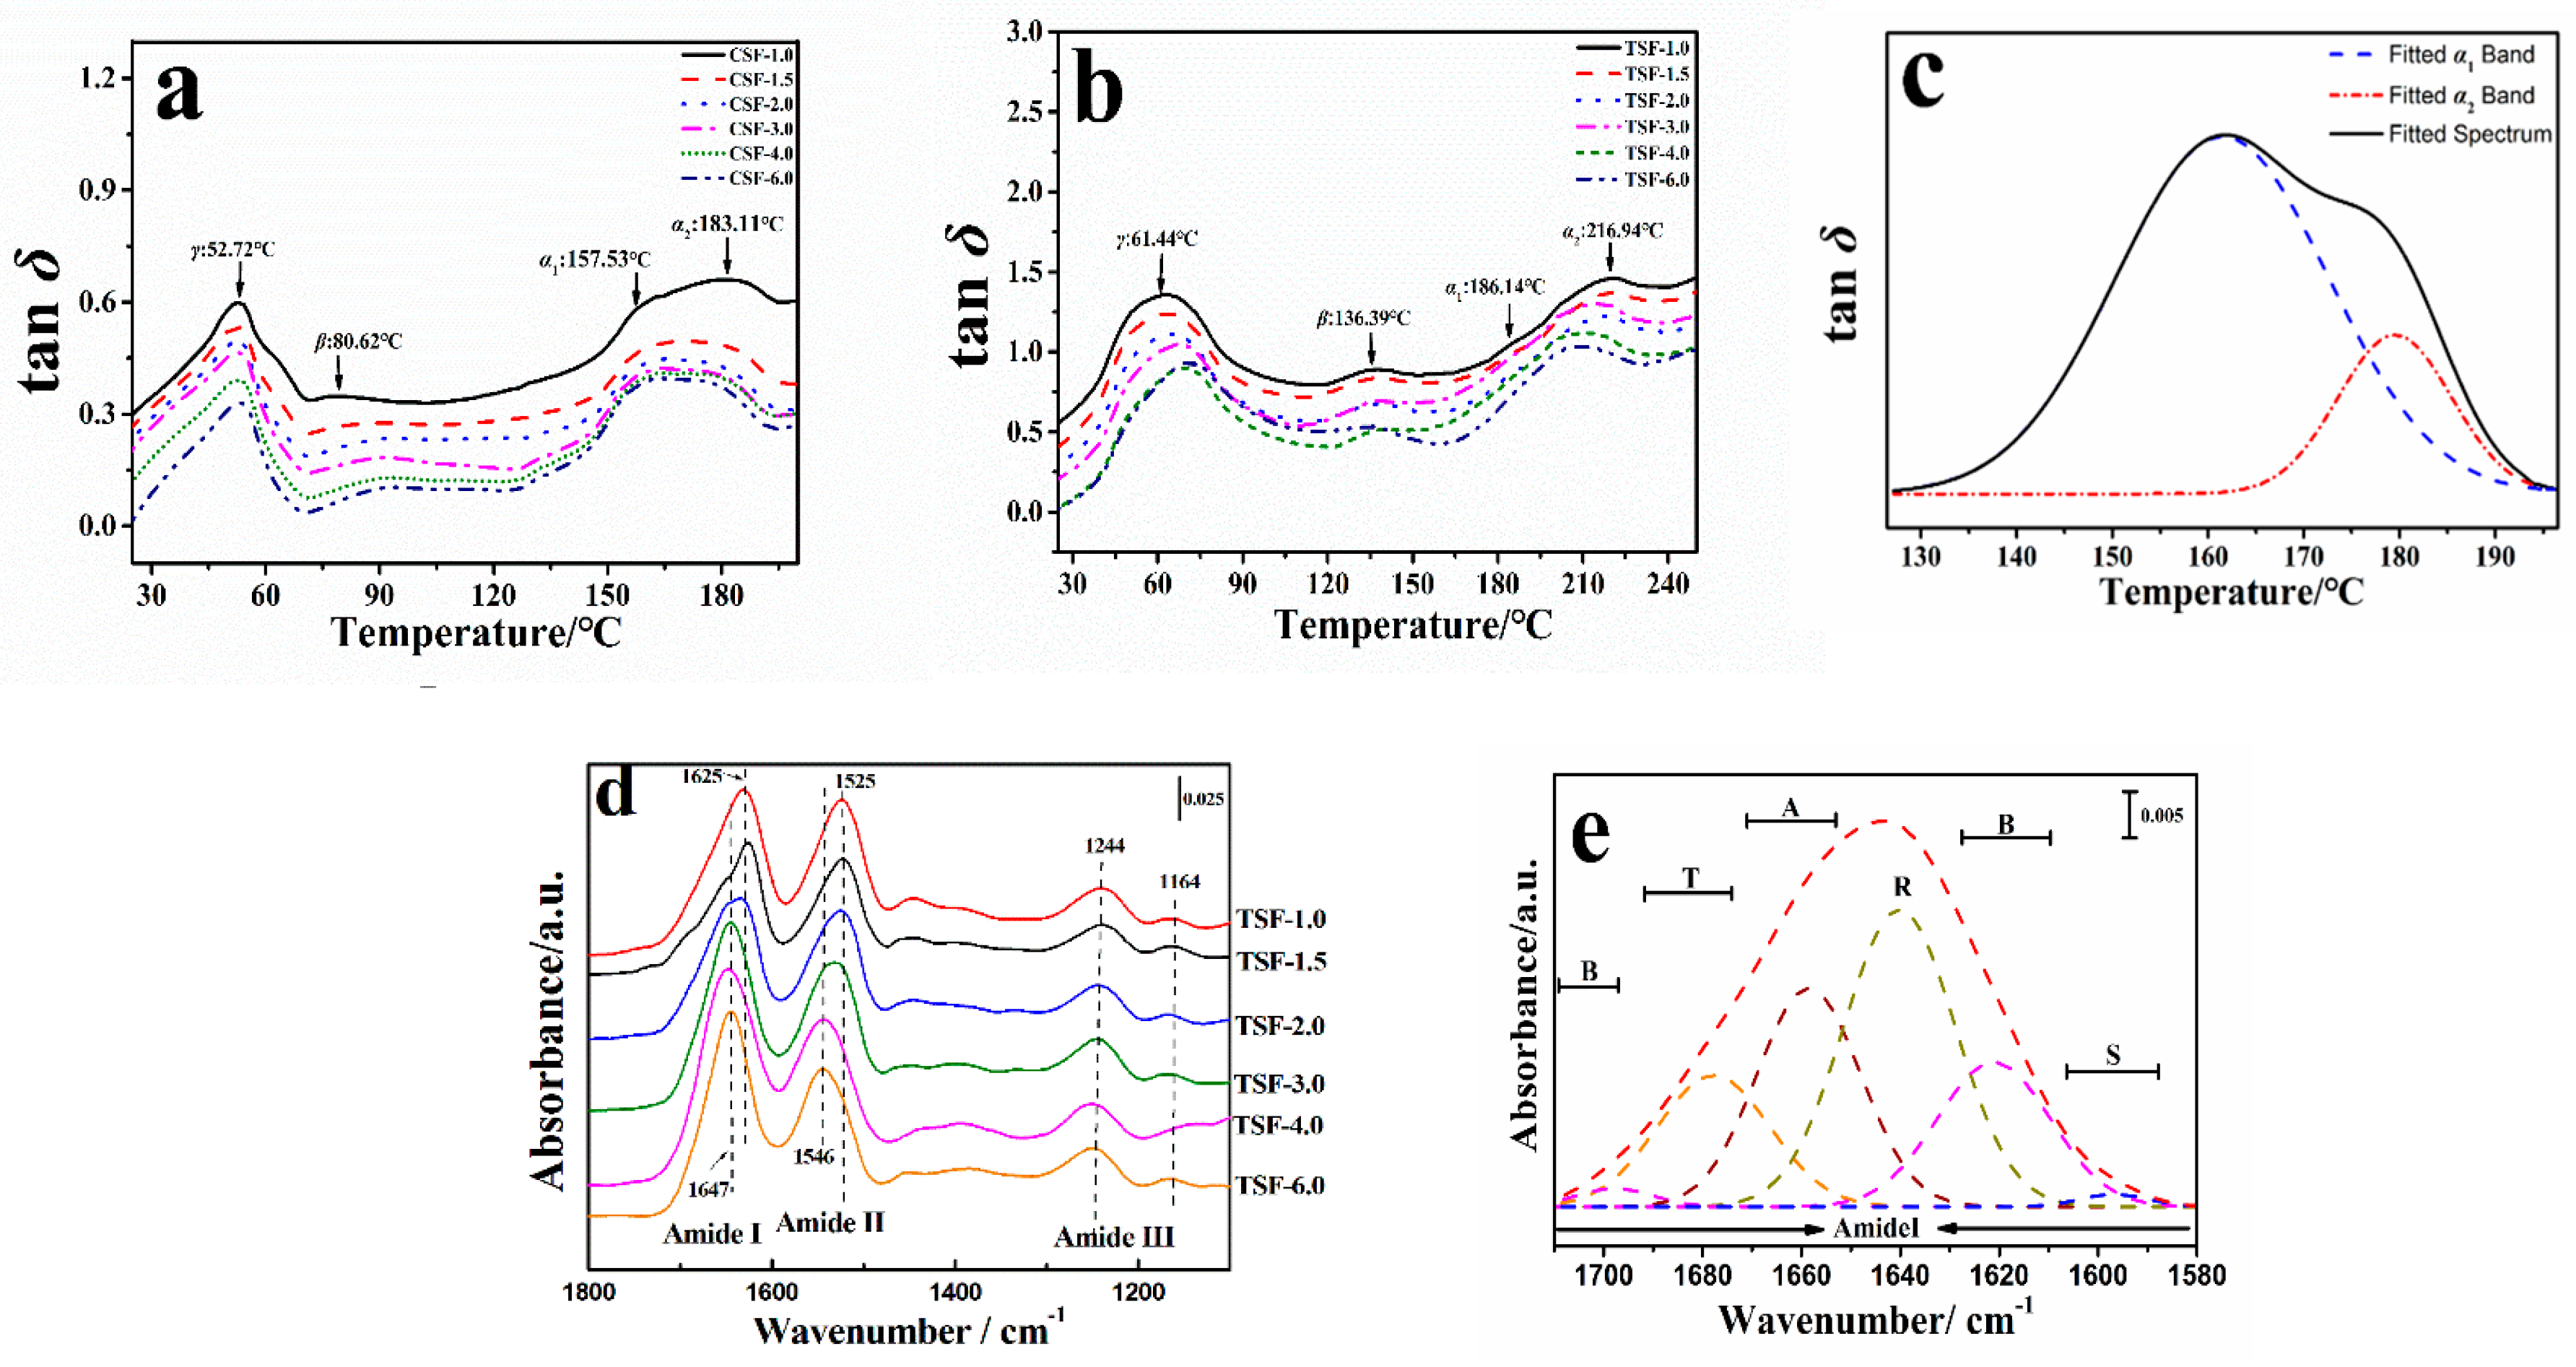
2.1. Dynamic Mechanical Analysis of the Degumming Silk Fiber

Figure 1 shows the storage modulus E′ and loss factor tan δ curves of CRS and TRS natural fibers with the change of temperature at five frequencies (1 Hz, 2 Hz, 5 Hz, 10 Hz, and 20 Hz), respectively. Four peaks were observed in E′ curves of Chin silk fibroin fiber sample under all frequencies (Figure 1a), which were assigned to the protein relaxation of γ, β, αc and α at 25 °C to 280 °C, respectively. As the frequency increases from 1 Hz to 20 Hz, the transition peak moves slightly to a higher temperature, since the time of the molecular segment relaxation and movement is inversely proportional to the frequency intensity. According to the equivalent principle of time and temperature, the increased frequency is equivalent to the shortened relaxation time of the material. Therefore, when the material is tested at a higher frequency, the transition peak of the segment movement could move to a higher temperature [33,34]. Different frequencies of 1 Hz to 20 Hz have the same effect of dynamic thermomechanical property on the silk fibroin. Therefore, in the remaining studies, we will only discuss experimental phenomena with a frequency of 1 Hz. In the 1 Hz force-controlled E′ curve (solid line), the γ-relaxation endear at about 41.64 °C due to the molecular motion of the silk protein side chain and the initial evaporation of free water molecules from silk. The β-relaxation at 96.12 °C could not be precisely assigned, but may be related to the molecular motion of silk fibroin after complete evaporation of water, or to the pendant group of the silk polymers (e.g., Ardhyananta et al. [35] has pointed out that the pendant group of the polysiloxanes could affect the thermal and mechanical properties). This can be confirmed by previous findings [36,37] that regenerative silk usually contains 5–10% (w/w) bound water, which significantly affect the thermal properties of silk. The water content of our samples in this work was around 6 wt.% (Table 1) measured by thermogravimetric analysis (TG), which has been discussed previously [29]. The α-relaxation at about 235.34 °C is associated with the glass transition of the silk protein noncrystalline structure due to the segmental motion of the silk protein backbone. Notably, Um et al. [38] pointed out that an αc-relaxation above 260 °C might occur after the α-relaxation in silk proteins fabricated from the aqueous solution. In our present work, this relaxation appeared around 269.92 °C for CRS and 272.39 °C for TRS. Besides, during the heating scan, the tan δ curves also show clearly three peaks (39.91 °C, 92.72 °C, and 214.25 °C), corresponding to the γ, β, and α-relaxation (Figure 1b). However, the peak of αc-relaxation did not appear obviously in the tan δ curve. The same phenomena can be also found from the TRS fiber sample. For the TRS fiber, three transition events can be observed at 43.82 °C, 109.07 °C, and 238.48 °C in the E′ curve at 1 Hz (Figure 1c, solid line), which correspond to γ, β, α relaxations, respectively. The final transition peak at 272.39 °C (Figure 1c) is belonged to αc-relaxation. Furthermore, in the tan δ curve (Figure 1d, solid line), γ, β and α-relaxation peaks were observed at 42.11 °C, 100.55 °C, and 218.92 °C in the range of 25~280 °C, respectively.
Table 2 compared E′ and tan δ of these two kinds of regenerated silk fibers (CRS and TRS) in the relationship of γ, β, α, and αc under the condition of 1Hz frequency. During the γ-relaxation, CRS sample has a storage modulus of 18.33 MPa and tan δ of 10.45 at 41.64 °C, while TRS sample has a lower storage modulus of 7.48 MPa and a loss factor of 7.21 at 43.82 °C. In the storage modulus E′ curve, the peak temperatures of the CRS sample (41.64 °C, 96.12 °C, 235.34 °C, and 269.92 °C) were 2.18~12.95 °C lower than the TRS sample (43.82 °C, 109.07 °C, 238.48 °C, and 272.39 °C) (Table 2). In tan δ curve, the peak temperatures of the CRS sample (39.91 °C, 92.72 °C, and 214.25 °C) were also 2.20~4.67 °C lower than those of TRS sample (42.11 °C, 100.55 °C, and 218.2 °C) (Table 2). Moreover, the storage modulus E′ of TRS sample under the 1 Hz (7.48 MPa, 11.71 MPa, 23.54 MPa, and 25.73 MPa) were also lower than those of the CRS sample (18.33 MPa, 26.28 MPa, 40.20 MPa and 38.34 MPa) during the γ, β, α and αc transitions, respectively (Table 2). These results indicated that Chin white silk fiber (CRS) can dehydrate more easily and have more disorder in its structure than the yellow Thai TRS fiber, and Chin silk molecular chains can be moved more easily when heated. Besides, it will possess a higher degree of viscous deformation, stronger damping, and faster energy dissipation than the TRS sample. Meanwhile, this might also imply that the CRS fiber has more elasticity and stiffness.
Born et al. [39] pointed out that the thermally induced vitreous transition of silk fibroin was proposed to the derive non-cooperative or cooperative movements of the skeleton segments in the non-crystalline or disordered regions of silk structure, when the intermolecular forces pass through a maximum or the intermolecular rigidity tends to zero. The transition condition is known as Born’s elastic instability criterion, which focuses on the stiffness or mobility of the bonds perpendicular to the axis of interaction instead of the bonds along the axis interaction. Quantitatively, Porter’s Group Interaction Modeling (GIM) theory provided a relationship between the properties and structure of polymeric materials, and the expression between structural parameters and Tg can be presented in Equation (1):
T g c = 0.224 y + 0.0513 E c o h N
where the Tgc is the theoretical glass transition temperature at a reference rate of 1 Hz, which can be written in terms of several parameters: (1) the temperature of skeletal mode vibrations, y; (2) the cohesive energy, Ecoh; and (3) the skeletal degrees of freedom, N [24].
The degrees of freedom N, in the GIM frame is defined as the number of normal vibration skeletons at the axis of the polymer backbone. For detailed calculation of Ecoh for each peptide base, reference can be made to Porter’s work [24]. Wang et al. [22] and Guan et al. [40] studied the cohesive energy Ecoh and degree of freedom N of each group of China silk from Bomby Mori cocoon according to the data in Table 3. B. mori silk’ Ecoh was calculated as: Ecoh = 24.3 (contribution of the peptide base) + 0 × 47.5% (contribution of glycine -H) + 4.5 × 31.7% (Alanine contribution -CH3) + 10.8 × 15.8% (Serine -CH2-OH contribution) + 35.8 × 5% (tyrosine contribution -CH2-Ph-OH) = 29.2 (kJ·mol−1).
While the CRS and TRS samples in our study were grown in different regions (China and Thailand) and have different thermal properties [28,29,30], where they all came from Bombyx Mori silkworm species. Therefore, we considered that these two kinds of silk have the same cohesive energy Ecoh and degree of freedom N.
Meanwhile, in our research, the experimental value of Tg was defined as the temperature from fitted gaussian peak position on the tan δ curve during the glass transition, as shown in Figure 1b,d and Table 4. Using the GIM method and the structural parameters in Table 3, we have Ecoh = 29.2 kJ·mol−1, N = 6, and y = 241 °C. The value of y was common to all structures due to the same average group molecular weight [23]. Therefore, the theoretical value of Tgc of CRS or TRS fiber sample was calculated to 82.4 °C, without considering the contribution from hydrogen-bonds. This theoretical value Tgc was much lower than that of DMA observation (about 218 °C). If one hydrogen bond per peptide group was taken, the calculated result Tg from Equation (1) would become 157.6 °C, which is close to the lower limit of the silk’s experimental Tg. Guan et al. [40] argued that the molecular structures responsible for the glass transition of silk do not have a singular form, but a probability spectrum with several favored forms, e.g., one or two hydrogen bonds per peptide. Thus, the experimental Tg temperatures of 214.25 °C for Chin silk fibroin fibers in Figure 1b and of 218.92 °C for Thai silk fibroin fibers in Figure 1d are the results of the averaged hydrogen-bonding density contributed by hydrogen-bonding forms with different probabilities, respectively. Vollrath et al. [23] believed that if one or two hydrogen bonds were adopted, the molecular structure in the silk would have a 70% chance of 2 hydrogen bonds (H-bonds). Hydrogen bond energy took 10 kJ·mol−1 as an average of N-H...O and N-H...N forms, respectively. The higher Tg implied more hydrogen bonds existed among amide groups of silks, through which highly oriented molecular structure and the number of hydrogen bonds have impact on the cohesive energy directly. In B. Mori silk sample, if two hydrogen bonds per peptide were counted, an additional energy of 20 kJ·mol−1 would be added to the peptide base value of 29.2 kJ·mol−1, which gives the final average Ecoh of 49.2 kJ·mol−1 for each characteristic segment. As a result, the theoretical value Tgc of silk is 243.1 °C through Equation (1) calculation, which is close to the upper limit of experimental temperature of Tg at 214.25 °C in tan δ curve and at 235.34 °C in E′ curve for CRS fiber sample, while at 218.92 °C in tan δ curve, and at 238.48 °C in E′ curve for TRS fiber sample.
Tan δ curves from DMA can be further used to determine the structural change of regenerated silk. As previously introduced, the order-disorder distribution can avoid the complicated assignments of secondary structures, which could be used to effectively predict the macroscopic properties of silk materials. First, a structural parameter, fdis, is defined as the degree of structural disorder, which is the molar fraction of the non-crystalline structures that are responsible for glass transition. The degree of structural disorder approximates an averaged structural parameter of heterogeneous nano-structures in a mean-field homogeneous micro and macroscopic morphology. For these two kinds of silk, their fdis values obtained from amino acid sequence analysis are listed in Table 4.
Equation (2) from GIM model described the quantitative relationship of cumulative tan δ (over the transition temperature range) with the structural parameters of the interactive group, Ecoh and N. A quick calculation of tan δc using Equation (2) for B. Mori silk is shown in Table 4, which appeared much greater than the experimental values of tan δ. Therefore, for semi-crystalline silks, the degree of structural disorder fdis was introduced into the equation, and adapted as a new form, as presented in Equation (3). The function of factor fdis is easy to understand as only the motions of the disordered structure could be activated during the glass transition and contribute to the experimentally measured tan δ.
The coefficient (2/3) in Equation (3) was used to correct the experimental effect of the uniaxial tensile mode in DMA measurement, because the molecular structures subjected to the static stress of the tensile direction could not be relaxed as the motions along this direction are restrained. As a result, the probability of molecular motions of the overall disordered structure through glass transition was reduced by one dimension, or a factor of 2/3.
tan δ c = 0.0085 × E c o h N  
tan δ = 2 3 × f d i s × 0.0085 E c o h N  
Equation (3) opened two avenues: First, it allowed the prediction of the cumulative loss tangent with a known degree of structural disorder. Second, it allowed the calculation of the degree of structural disorder from the theoretical tan δc. A quick calculation using GIM framework (Equation (2)) for B. Mori silk showed that tan δc was in the numerical range of 56–70, which represented the energy dissipation of 100% degrees of structural disorder. The apparent discrepancy between the experimental cumulative tan δ and the theoretical tan δc during the glass transition for native B. Mori silks clearly suggested that crystalline or ordered structure existed in our silk samples. This phenomenon was also mentioned in the work of Porter et al. [41,42,43] The degree of disorder fdis for two silk fibers were also calculated individually by using both the number of hydrogen bonds and the cohesive energy from the Equation (3) (Table 4). Simultaneously, apparent discrepancy between the experimental tan δ and the theoretical tan δc in glass transition region of silks appeared by using the GIM framework. Guan et al. and Porter et al. also reported the same phenomenon [21,24]. By comparing the tan δ of these two kinds of regenerated B. Mori silk, the degree of disorder fdis was deduced: 0.63 for one H-bond and 0.51 for two H-bonds in the CRS sample, and 0.52 for one H-bond and 0.42 for two H-bonds in the TRS sample, as listed in Table 4. The results showed that the disordered structure of silk fibroin had a significant effect on its glass transition. Additionally, the glass transition temperature (Tg) decreased with the degree of disorder (fdis) increasing, since tan δ is directly associated with the fdis as well as the ordered molecular structures in silk.

2.2. Structural Transformation of Chin and Thai Silk Protein Films

Glass transition temperature is a characterization temperature at which the chain segment of polymer molecules starts to move, which is related to the flexibility of polymer chains. In the glass transition region, when the semi-crystalline polymer material changes from the solid state to the flowing liquid state, the specific heat of the semi-crystalline polymer material undergoes a discontinuous mutation during the heating process [28,29]. Our previous studies on silk fibroin films by scanning electron microscopy (SEM) [30] and X-ray diffraction (XRD) [33] showed that a high CaCl2 concentration can significantly reduce the silk fibril structure and micro-/nanoscale morphology in the silk film. Further, two small diffraction peaks appeared at 20.7° and 24.0° in the XRD curves of low CaCl2 concentration sample (e.g., TSF-1.5), which is recognized as the silk I structure. This phenomenon implied that the β-sheet crystal content decreases with the increase of calcium chloride concentration, and higher calcium chloride concentrations may disrupt the hydrogen bonds between the silk fibroin molecular chains, which reduces the silk II content and increases the silk I content. Here, we will explore the structure transformation of silk proteins fabricated from CaCl2–formic acid solution by using DMA, SSDSC, and FTIR results.
In general, the loss factors (tan δ) of silk fibroin membranes CSF-1.0, CSF-1.5, CSF-2.0, CSF-3.0, CSF-4.0, and CSF-6.0 all have three discontinuous events that corresponded to the protein relaxation of γ, β, and α, which have been discussed in the previous section. The γ relaxation peak around 50~60 °C with little shoulders in two side of curve implied the co-events of γ-relaxation (protein-water Tg) and the evaporation of mobile H2O in this region [21]. The water evaporation completed around 80~140 °C, and the major molecular motion of pure silk fibroin (the α relaxation peak of tan δ curve) appeared in the range of 150–230 °C (Figure 2). The water content of various silk protein films samples contained around 0.5–3.23% bound water molecules measured by TG in our previous work [30]. Hu et al. [36]. focused on the interaction of the solid silk film with the intermolecular bound water molecules. The results showed that the silk film start to release the water molecules into air at 35 °C. As the temperature increased, more and more water evaporated and the weight of silk film decreased until about 160 °C. Above 160 °C, there is no more intermolecular water in the silk film. Based on these results, the water should have no contribution to α-relaxation. In addition, this peak also decreased gradually with the increasing of calcium chloride. To better understand the change during the Tg region, StepScan differential scanning calorimetry (SSDSC) measurement were also used to determine the heat capacity increment (ΔCps) of silk samples during the Tg. It demonstrated that the glass transition temperature (Tgs) of SF increased with the calcium chloride concentration decreasing, e.g., from 157.30 °C to 176.88 °C with the change of calcium chloride concentration from 6.0% to 1.0%, respectively. The heat capacity increment (ΔCps) is directly proportional to the average chain mobility of proteins, which reflects the number of freely rotating bonds capable of changing the chain conformation [30]. The ΔCps results summarized in Table 5 indicated that a non-crystalline structure exists in all samples and the SF-6.0 protein chains have the highest fraction of the non-crystalline structure, while the average chain mobility and non-crystalline fraction in the SF-1.0 sample are the lowest. Therefore, with the CaCl2 concentration increasing, the Tgs decreased while ΔCps increased, which indicated that content of non-crystalline structures in SF is increasing with the increase of CaCl2 content.
In our previous study [30], we found that the concentration of CaCl2/FA could significantly affect the secondary structures of silk. Since DMA technique is more sensitive than the SSDSC technique for the glass transition measurement, two relaxation peaks (α1 and α2) can be found in the glass transition region of tan δ curve from 125 °C to 195 °C (Figure 2). For the CSF-1.0 sample, the two transition peaks appeared at 157.53 °C (Tg-α1) and 177.11 °C (Tg-α2), which are associated with α1 and α2- relaxation (Figure 2a, solid line), respectively. For the TSF-1.0 sample, the α1 and α2-relaxation transitions appeared at 186.14 °C (Tg-α1) and 216.94 °C (Tg-α2), respectively. To quantify the percentage of these two peaks, the tan δ curves were curve fitted using Gaussian peaks in the glass transition region of 125–195 °C.
Figure 2c showed an example of curve fitted tan δ curves from the TSF-3.0 sample (dashed lines). Table 5 summarized the fitted percentage of each peak in Tg region for all silk samples. It shows that the TSF-1.0 film has 54.70% α1 relaxion at 186.14 °C (Tg-α1), and 45.30% α2-relaxation at 216.94 °C (Tg-α2). While the TSF-6.0 sample has 76.65% α1 relaxion at 182.47 °C and 23.35% α2 relaxion at 200.82 °C. This suggests that as the concentration of calcium chloride increased, both peaks shifted to lower temperatures (Table 5), but the content of α1 relaxion increased, while the content of α2 relaxion decreased. To better understand the secondary structures of our materials, a FTIR deconvolution method was performed to quantify the percentage of the secondary structures in all silk samples [28]. Figure 2d showed the main characteristics of protein structures of all six silk films in the FTIR spectra. With the concentration of CaCl2 increasing, the center of the absorption band in Amide I region shifted gradually from 1625 cm−1 (beta-sheet structure, TSF-1.0) to 1647 cm−1 (random coil structure, TSF-6.0), while the peak in Amide II region also shifted gradually from 1525 cm−1 (TSF-1.0) to 1546 cm-1 (TSF-6.0). Moreover, for the Amide-III and FTIR fingerprinting regions, Thai silk sample showed same characteristic peaks and two obvious peaks at 1244 cm−1 and 1164 cm−1 [30]. Figure 2e shows an example of the Amide I region of TSF-3.0 sample with the fitted FTIR peaks shown as dashed lines. The peak positions and their related secondary structures were assigned as side chains (S), β-sheets (B), random coil (R), α-helix (A), and turns (T) [30]. We found that the content of helix structures in TSF samples could increase significantly by increasing the concentration of CaCl2. For example, with the increase of CaCl2 concentration, the percentage of β-sheet structures gradually decreased from 26.60% in TSF-1.0 film to 7.07% in the TSF-6.0 sample, while the percentage of random coils decreased from 56.07% to 46.43%, while α-helixes content increased from 8.59% to 28.39%, and the percentage of turns also increased from 7.11% to 17.74%. The similar trend of α-relaxation temperatures and the content of secondary structures in the silk samples were also observed in CSF samples. Table 6 summarized the percentage of secondary structures for each CSF and TSF sample. These results implied that α1 and α2- relaxation events in tan δ curve are associated with the change of protein secondary structures. Um et al. [38] found that there is αc-relaxation after the major α-relaxation in water-regenerated silk materials, which is related to the cooling crystallization of silk proteins. In our silk samples regenerated from CaCl2/FA system, with the decrease of β-sheets in the silk films, the α1 content increased, while α2 percentage decreased, and both of the α1 and α2 peaks shifted to a lower temperature. Therefore, we can claim that random coils or other non-crystalline structures may be contributed to the transition of α1-relaxation which was equaled to the α-relaxation, while the change of α-helix structure may be related to α2-relaxation which was the αc-relaxation found previously [38].
Similarly, DMA experiment also showed that Tg-α1 and Tg-α2 of the CSF samples were lower than those of the TSF samples (Figure 2 and Table 5) at the same calcium chloride content. Both FTIR and DMA results indicate that lower β-sheet structures and higher non-crystalline structures can be obtained in silk films regenerated from the solution with higher calcium chloride concentration.
Base on the above work, the relationship between degree of disorder fdis and the Tg were discussed and the influence of calcium chloride on structure of these silk samples was further explored in this section. It was supposed that the amount of hydrogen bonding effects of calcium chloride on different silk fibroin films were identical (H-bonds = 1; N = 6; Ecoh = 39.2 kJ·mol−1, y = 241 °C), the degree of disorder fdis-α1 and fdis-α2 of two kinds of regenerated silk fibroin were calculated from GIM Equation (3) and is shown in Table 5, as well as the tan δ-α1, tan δ-α2, Tg-α1, and Tg-α2 from DMA test. The increasing trend of fdis-α1 and fdis-α2 indicated that more concentration of calcium chloride could induce the β-sheet transform into the random coil in the secondary structure of silk fibroin and more non-crystalline structure form. Simultaneously, in the same concentration of calcium chloride, CSF samples showed more disorder degree than that of TSF samples, e.g., 0.20 for CSF-1.0 sample, 0.10 for TSF-1.0 sample at α1-relaxation. The results suggested that more β-sheet and crystalline structures in TSF sample than those in CSF sample.

2.3. Stress-Strain Study of CSF and TSF

The stress-strain curve gives information about the Young modulus (slope at the origin), yield point, break point, and recovery behavior of polymeric films. Meanwhile, the stress-strain curve analysis can also provide information on polymer structure, degree of crosslinking, degree of crystallization, processing conditions, and viscoelastic properties of polymer [44,45,46]. The stress-strain curve of the CSF sample (Figure 3a) shows that as the calcium chloride concentration increases from 1.0 to 6.0 mass%, the initial slope decreases from 7.86 to 1.83 and its stress decreases from 14.91 to 11.93 MPa at the yield point, respectively. In addition, under the stress of 10 MPa, their strains were 1.21%, 2.15%, 2.47%, 3.39%, 4.17%, and 5.88%, respectively (Table 7). Compared with the trend of change in CSF samples under the initial slope and yield stress, the trend of change in TSF samples is the same (Figure 3b). These results reveal that increasing the content of calcium chloride can increase the elongation of the sample, while its elasticity and stiffness decrease due to the formation of dominated random coils and other non-crystalline structures in silk samples [33]. Besides, with the same concentration of calcium chloride and the same stress loaded on the sample, the initial slope of CSF sample was higher than that of the TSF sample. For example, the initial slope of the CSF-6.0 sample is 1.83 under the 10 MPa, which was higher than the initial slope of 1.52 from the TSF-6.0 sample.
Similarly, the strain of the TSF-6.0 sample was 6.96%, which was greater than 5.88% of the CSF-6.0 sample. And the yield stress of CSF-6.0 sample was 11.43 MPa, which was higher than 8.93 MPa of the TSF-6.0 sample. These results indicate that the CSF sample has better elasticity than the TSF sample, while the TSF sample has better plasticity than the CSF sample. These results also imply that the average chain mobility of silk films in TSF samples is higher than that in CSF samples. Therefore, at the same CaCl2 concentration, the TSF sample would contain more non-crystalline structures than the CSF sample, which has been proved by FTIR structural analysis in Table 6.

3. Materials and Methods

3.1. Materials and Preparation

The Chinese (Dandong Qiyue Trade co., LTD.) and Thailand Bombyx mori silk cocoons (Queen Sericulture Center, Nakornratchasima, Thailand) were first degummed into Chin regenerated silk fibroin fibers (CRS) and Thai regenerated silk fibroin fibers (TRS) according to a previously reported procedure [47]. Different amounts of calcium chloride (AR, purity 96%, West Gansu Chemical Plant, Shantou, Guangdong) were mixed with formic acid (AR, purity 88%, West Gansu Chemical Plant, Shantou, Guangdong) to form 1.0, 1.5, 2.0, 3.0, 4.0, and 6.0 mass% CaCl2/FA solutions. Then, the degummed silk fibroin (SF) fibers were quickly dissolved into these CaCl2/FA solutions at room temperature. The final solutions were immediately cast onto a Teflon mold (50 mm × 20 mm × 10 mm) and dried at room temperature to form SF films. After being washed (30 mins in running water) and vacuum dried to fully remove CaCl2/FA solvents, the final Chin SF (CSF) and Thai SF (TSF) films were obtained. CSF and TSF samples were named with the numbers (−1.0, −1.5, −2.0, −3.0, −4.0, and −6.0) after the sample names to indicate the initial concentration of CaCl2 (1.0, 1.5, 2.0, 3.0, 4.0, and 6.0 mass%) in the solution.

3.2. Thermal and Mechanical Analyses

Sample with a dimension of 5.0 × 2.0 × 1.0mm3 was subjected to the mechanical analysis by using a Dynamic Mechanical Analyzer (Perkin-Elmer Diamond DMA, Waltham, MA, USA). Experiment was proceeded under a temperature range from 25 °C to 280 °C with a heating rate of 2 °C min−1 and at 1, 2, 5, 10, and 20 Hz frequencies simultaneously. The glass transition temperature (Tg) of sample was taken from the temperature at which the maximum peak of the tangent δ was exhibited. Furthermore, at the atmosphere temperature (25 °C), the stress-strain property of silk fibroin film was tested by DMA in a tensile controlled model. The tensile force increased from 5 mN to 2000 mN at a lifting speed of 50 mN min−1 until the sample was broken. For all experiments, at least three samples were measured under the same test conditions to check the consistency of the experimental results. Dynamic mechanical analysis (DMA) refers to the technique of measuring the dynamic modulus and mechanical loss of a specimen and its relation to temperature or frequency under programmed temperature and alternating stress. In general, a periodically varying (usually refers to the sine) force was applied to the sample to produce periodic changes in the stress. The sample will have a corresponding deformation behavior of the stress; thus, the mechanical modulus of the sample can be determined by the stress and deformation. For example, if a shear stress is applied, a shear G can be obtained, and if a type of stress is applied in tension or bending, Young’s Modulus E can be obtained. DMA measurement modes include tension, compression, bending, single-cantilever, shear, and reverse. In most cases, the specimen undergoes a periodical variation of the mechanical vibration stress, which causes the corresponding vibrational strain. However, the specimen does not always respond instantaneously to the changing stress and the lags behind for a certain period of time. This mainly depends on the viscoelasticity of the specimen and the phase shift between applied stress and deformation. Therefore, sample modulus consists of both real and imaginary parts. The real part describes the sample response as the periodic stress, which is a measurement of the elasticity of the sample, called the storage modulus. The imaginary part describes the response phase shifted by 90°, which is a measurement of the mechanical energy converted to heat, called the loss modulus. The ratio of loss modulus (E″) and storage modulus (E′) is called the loss factor, the phase shift tangent δ (tan δ), which is the express of sample damping performance. The storage modulus E′ is proportional to the mechanical energy stored in the specimen during stress, while the loss modulus E″ represents the energy dissipated in the specimen during stress. The larger the loss modulus is, the more viscous the specimen is, and the stronger the damping of specimen is. The tan δ is independent of the geometry, therefore it can be accurately measured even if the geometry of the sample is not regular. In dynamic mechanical analysis, the force amplitude FA and the displacement amplitude LA are used to calculate the modulus of samples. For example, the tensile modulus or elastic modulus of the experiment E′ can be obtained through the formula:
E = σ ε = F A L A L 0 A = F A L A g  
σ = FA/A
ε = L0/LA
g = L0/A
where σ and ε are the stress and strain of the sample, respectively; FA and LA are the force amplitude and the displacement amplitude, respectively; L0 is the original length of the sample; A is the unit area of the sample; g is the geometry efficiency; and FA/LA is the rigidity of the material [48].
Generally, materials with low storage modulus E′ implies it will deform easily when applying load on it; and the tan δ represents the viscoelasticity of materials during the loading cycle. A high value of tan δ suggests a high degree of energy dissipation and a high degree of viscous deformation for this material.
Besides, the dried CRS and TRS samples were encapsulated in Al pans and heated in a differential scanning calorimeter under Step-Scan modulated (SSDSC, Diamond DSC, Perkin-Elmer, USA) at a heating rate of 3 °C/min−1 with a 3 °C step and isothermal time of 2 min with 25 mL min−1 purged dry nitrogen gas, and equipped with a refrigerated cooling system. Each sample was about 5 mg.

3.3. Fourier Transform Infrared Spectrometry

Fourier transform infrared spectra (FTIR) of silk protein film sample was obtained using a FTIR spectrometer (Nicolet-NEXUS 670, Nicolet, Madison, WI, USA), equipped with a deuterated triglycine sulfate detector and a multiple-reflection, horizontal MIRacle ATR attachment (OMNIT, using a Ge crystal, Madison, WI, USA). Spectra were recorded in the wavenumber range of 1800 to 1100 cm−1 with a resolution of 4 cm−1, and 64 scans were applied for each measurement. Fourier self-deconvolution (FSD) of the IR spectra covering the Amide I region (1595–1705 cm−1) was performed by the Nicolet Omnic software. Deconvolution was performed using Gauss line shape with a half-bandwidth of 25 cm−1 and a noise reduction factor of 0.3. FSD spectra were then curve-fitted by Gaussian peaks to measure the relative areas in the Amide I region.

3.4. Thermogravimetric Analysis

Thermogravimetric (TG) analysis (PerkinElmer Pyris 1, Waltham, MA, USA) was used to measure the change in the mass of the silk samples during temperature increase. The TG curves were obtained under a nitrogen atmosphere with a gas flow of 50 mL·min−1. Samples of about 2–3 mg were heated from 30 to 600 °C with a heating rate of 10 °C·min−1. The mass change percentages during heating were recorded.

4. Conclusions

Dynamic Mechanical Analysis (DMA) analysis is more sensitive than Differential Scanning Calorimetry (DSC), as short-range chain motion changes are easier to detect than heat capacity changes during the phase transitions of biopolymer materials. The various structures and mechanical properties of two kinds of domesticated silk fibroin (SF) films (Chinese and Thailand B. Mori) regenerated from formic acid-CaCl2 solutions were investigated using DMA. Our study showed that by using the GIM model, the disorder degree (fdis) of silk samples can be inferred from the cohesive energy (Ecoh), the skeletal degree of freedom (N), and the loss factor (tan δ) at the glass transition region. Four disordered phase relaxation events were explored by DMA technique, with a focus on the glass transition and the degree of structural disorder. Our results illustrated that there are nearly two hydrogen bonds formed in each peptide group in the Bombyx Mori silk fibers. With the increase of calcium chloride concentration in the SF sample, the Tg of silk material decreases, which implied that the sample could contain more non-crystalline structures, such as random coils and helix. α1 and α2-relaxation events in DMA curves are both associated with the silk secondary structures. The random coils as well as other non-crystalline structures may be attributed to the change of α1-relaxation, while α2-relaxation could be directly associated to the α-helix to β-sheet transition. Moreover, at the same calcium chloride concentration, the CSF sample is more disordered than the TSF sample, which suggests that there are more β-sheet in the TSF sample than in the CSF sample. It also showed that the elasticity of the TSF sample is lower than that of the CSF sample, while their ductility is the opposite. Besides, SF samples prepared with lower concentrations of calcium chloride have higher elasticity, while SF samples prepared with high concentrations have better ductility. The effects of calcium chloride concentrations on the structure and mechanical properties of regenerated silk fibroin films were further investigated by comparing GIM theoretical model calculations with experimental results. These results provide us a new way to understand the structural changes and mechanical properties of different domesticated silk regenerated from acid-based solution system, which would be critical for engineering applications of silk materials. These results provide us with a new way to understand the structural changes and mechanical properties of different domesticated silk regenerated from acid-based solution system, which would be critical for engineering applications of silk materials in the future.

Author Contributions

Q.L., F.W. and X.H. conceived and designed the experiments; Q.L., F.W., Z.G., and Q.M. performed the experiments, Q.L., F.W. and X.H. analyzed the data and wrote the paper.

Funding

This work was supported by the National Natural Science Foundation of China (11474166) and the College of Natural Science Foundation of Jiangsu Province, China (15KJB150018). X.H. is supported by Rowan University Start-up Grants, and US-NSF Biomaterials Program (DMR-1809541) and Materials Eng. and Processing program (CMMI-1561966).

Conflicts of Interest

The authors declare no conflict of interest.

References

  1. Bhardwaj, N.; Singh, Y.P.; Devi, D.; Kandimalla, R.; Kotoky, J.; Manda, B.B. Potential of silk fibroin/chondrocyte constructs of muga silkworm Antheraea assamensis for cartilage tissue engineering. J. Mater. Chem. B 2016, 4, 3670–3684. [Google Scholar] [CrossRef]
  2. Yu, S.; Yang, W.; Chen, S.; Chen, M.; Liu, Y.; Shao, Z.; Chen, X. Floxuridine-loaded silk fibroin nanospheres. RSC Adv. 2014, 4, 18171–18177. [Google Scholar] [CrossRef]
  3. Hu, X.; Wang, X.; Rnjak, J.; Weiss, A.S.; Kaplan, D.L. Biomaterials derived from silk-tropoelastin protein systems. Biomaterials 2010, 31, 8121–8131. [Google Scholar] [CrossRef] [PubMed]
  4. Hu, X.; Shmelev, K.; Sun, L. Regulation of Silk Material Structure by Temperature-Controlled Water Vapor Annealing. Biomacromolecules 2011, 12, 1686–1696. [Google Scholar] [CrossRef] [PubMed] [Green Version]
  5. Jao, D.; Xue, Y.; Medina, J.; Hu, X. Protein-Based Drug-Delivery Materials. Materials 2017, 10, 517. [Google Scholar] [CrossRef] [PubMed]
  6. Kambe, Y.; Murakoshi, A.; Urakawa, H.; Kimura, Y.; Yamaoka, T. Vascular induction and cell infiltration into peptide-modified bioactive silk fibroin hydrogels. J. Mater. Chem. B 2017, 5, 7557–7571. [Google Scholar] [CrossRef]
  7. Aytemiz, D.; Sakiyama, W.; Suzuki, Y.; Nakaizumi, N.; Tanaka, R.; Ogawa, Y.; Takagi, Y.; Nakazawa, Y.; Asakura, T. Small-diameter silk vascular grafts (3 mm diameter) with a double-raschel knitted silk tube coated with silk fibroin sponge. Adv. Healthc. Mater. 2013, 2, 361–368. [Google Scholar] [CrossRef] [PubMed]
  8. Shahbazi, B.; Taghipour, M.; Rahmani, H.; Sadrjavadi, K.; Fattahi, A. Preparation and characterization of silk fibroin/oligochitosan nanoparticles for siRNA delivery. Colloids Surf. B 2015, 136, 867–877. [Google Scholar] [CrossRef] [PubMed]
  9. Tesfaye, M.; Patwa, R.; Kommadath, R.; Kotecha, P.; Katiyar, V. Silk nanocrystals stabilized melt extruded poly (lactic acid) nanocomposite films: Effect of recycling on thermal degradation kinetics and optimization studies. Thermochim. Acta 2016, 643, 41–52. [Google Scholar] [CrossRef]
  10. Yin, Z.; Wu, F.; Xing, T.; Yadavalli, V.K.; Kundu, S.C.; Lu, S. A silk fibroin hydrogel with reversible sol-gel transition. RSC Adv. 2017, 7, 24085–24096. [Google Scholar] [CrossRef]
  11. Hu, X.; Park, S.H.; Gil, E.S.; Xia, X.X.; Weiss, A.S.; Kaplan, D.L. The Influence of Elasticity and Surface Roughness on Myogenic and Osteogenic-Differentiation of Cells on Silk-Elastin Biomaterials. Biomaterials 2011, 32, 8979–8989. [Google Scholar] [CrossRef] [PubMed]
  12. Phillips, D.M.; Drummy, L.F.; Conrady, D.G.; Fox, D.M.; Naik, R.R.; Stone, M.O. Dissolution and Regeneration of Bombyx mori Silk Fibroin Using Ionic Liquids. J. Am. Chem. Soc. 2004, 126, 14350–14361. [Google Scholar] [CrossRef] [PubMed]
  13. Lu, Q.; Hu, X.; Wang, X.; Kluge, J.A.; Lu, S. Water-Insoluble Silk Films with Silk I Structure. Acta Biomater. 2010, 6, 1380–1387. [Google Scholar] [CrossRef] [PubMed]
  14. Tian, L.; Chen, Y.; Min, S. Research on Cytotoxicity of Silk Fibroin Gel Materials Prepared with Polyepoxy Compound. J. Biomed. Eng. 2007, 24, 1309–1313. [Google Scholar]
  15. Crawford, D.M.; Escarsega, J.A. Dynamic mechanical analysis of novel polyurethane coating for military applications. Thermochim. Acta 2000, 357, 161–168. [Google Scholar] [CrossRef]
  16. Yin, B.; Hakkarainen, M. Core–shell nanoparticle–plasticizers for design of high-performance polymeric materials with improved stiffness and toughness. J. Mater. Chem. 2011, 21, 8670–8677. [Google Scholar] [CrossRef]
  17. Khandaker, M.S.K.; Dudek, D.M.; Beers, E.P.; Dillard, D.A.; Bevan, D.R. Molecular modeling of the elastomeric properties of repeating units and building blocks of resilin, a disordered elastic protein. J. Mech. Behav. Biomed. Mater. 2016, 61, 110–121. [Google Scholar] [CrossRef] [PubMed] [Green Version]
  18. Mahdi, E.M.; Tan, J.C. Dynamic molecular interactions between polyurethane and ZIF-8 in a polymer-MOF nanocomposite: Microstructural, thermo-mechanical and viscoelastic effects. Polymer 2016, 97, 31–43. [Google Scholar] [CrossRef]
  19. Saba, N.; Jawaid, M.; Alothman, O.Y.; Paridah, M.T. A review on dynamic mechanical properties of natural fibre reinforced polymer composites. Constr. Build. Mater. 2016, 106, 149–159. [Google Scholar] [CrossRef]
  20. Nalyanya, K.M.; Migunde, O.P.; Ngumbu, R.G.; Onyuka, A.; Rop, R.K. Thermal and dynamic mechanical analysis of bovine hide. J. Therm. Anal. Calorim. 2016, 121, 1–8. [Google Scholar] [CrossRef]
  21. Guan, J.; Porter, D.; Vollrath, F. Thermally induced changes in dynamic mechanical properties of native silks. Biomacromolecules 2013, 14, 930–937. [Google Scholar] [CrossRef] [PubMed]
  22. Wang, Y.; Guan, J.; Hawkins, N.; Porter, D.; Shao, Z. Understanding the variability of properties in Antheraea pernyi silk fibres. Soft Matter 2014, 10, 6321–6331. [Google Scholar] [CrossRef] [PubMed]
  23. Vollrath, F.; Porter, D. Spider silk as a model biomaterial. Appl. Phys. A 2006, 82, 205–212. [Google Scholar] [CrossRef]
  24. Porter, D.; Vollrath, F.; Shao, Z. Predicting the mechanical properties of spider silk as a nanostructured polymer. Eur. Phys. J. E 2005, 16, 199–206. [Google Scholar] [CrossRef] [PubMed]
  25. Kawano, Y.; Wang, Y.; Palmer, R.; Aubuchon, A.; Steve, R. Stress-Strain Curves of Nafion Membranes in Acid and Salt Forms. Polímeros 2002, 12, 96–101. [Google Scholar] [CrossRef]
  26. Pyda, M.; Wunderlich, B. Reversing and nonreversing heat capacity of poly (lactic acid) in the glass transition region by TMDSC. Macromolecules 2005, 38, 10472–10479. [Google Scholar] [CrossRef]
  27. Sheng, S.J.; Hu, X.; Wang, F.; Ma, Q.Y.; Gu, M.F. Mechanical and thermal property characterization of poly-L-lactide (PLLA) scaffold developed using pressure-controllable green foaming technology. Mat. Sci. Eng. C.-Mater. 2015, 49, 612–622. [Google Scholar] [CrossRef] [PubMed]
  28. Wang, F.; Wolf, N.; Rocks, E.M.; Vuong, T.; Hu, X. Comparative studies of regenerated water-based Mori, Thai, Eri, Muga and Tussah silk fibroin films. J. Therm. Anal. Calorim. 2015, 122, 1069–1076. [Google Scholar] [CrossRef]
  29. Mazzi, S.; Zulker, E.; Buchicchio, J.; Anderson, B.; Hu, X. Comparative thermal analysis of Eri, Mori, Muga, and Tussar silk cocoons and fibroin fibers. J. Therm. Anal. Calorim. 2014, 116, 1337–1343. [Google Scholar] [CrossRef]
  30. Wang, F.; Yu, H.Y.; Gu, Z.G.; Si, L.; Liu, Q.C.; Hu, X. Impact of calcium chloride concentration on structure and thermal property of Thai silk fibroin films. J. Therm. Anal. Calorim. 2017, 130, 1–9. [Google Scholar] [CrossRef]
  31. Wang, F.; Chandler, P.; Oszust, R.; Sowell, E.; Graham, Z.; Ardito, W.; Hu, X. Thermal and structural analysis of silk–polyvinyl acetate blends. J. Therm. Anal. Calorim. 2017, 127, 923–929. [Google Scholar] [CrossRef]
  32. Hu, X.; Lu, Q.; Sun, L.; Cebe, P.; Wang, X.Q.; Zhang, X.H.; Kaplan, D.L. Biomaterials from Ultrasonication-Induced Silk Fibroin−Hyaluronic Acid Hydrogels. Biomacromolecules 2010, 11, 3178–3188. [Google Scholar] [CrossRef] [PubMed]
  33. Zhu, Z.; Jiang, C.; Cheng, Q.; Zhang, J.; Guo, S. Accelerated aging test of hydrogenated nitrile butadiene rubber using the time-temperature-strain superposition principle. RSC Adv. 2015, 5, 90178–90183. [Google Scholar] [CrossRef]
  34. Butaud, P.; Placet, V.; Klesa, J.; Ouisse, M.; Foltête, E.; Gabrion, X. Investigations on the frequency and temperature effects on mechanical properties of a shape memory polymer (Veriflex). Mech. Mater. 2015, 8, 50–60. [Google Scholar] [CrossRef]
  35. Ardhyananta, H.; Kawauchi, T.; Ismail, H.; Takeichi, T. Effect of pendant group of polysiloxanes on the thermal and mechanical properties of polybenzoxazine hybrids. Polymer 2009, 25, 5959–5969. [Google Scholar] [CrossRef]
  36. Hu, X.; Kaplan, D.; Cebe, P. Effect of Water on Thermal Properties of Silk Fibroin. Thermochim. Acta 2007, 461, 137–144. [Google Scholar] [CrossRef]
  37. Motta, A.; Fambri, L.; Migliaresi, C. Regenerated silk fibroin films: Thermal and dynamic mechanical analysis. Chem. Phys. 2002, 203, 1658–1665. [Google Scholar] [CrossRef]
  38. Um, I.C.; Kim, T.H.; Kweon, H.Y.; Chang, S.K.; Park, Y.H. A comparative study on the dielectric and dynamic mechanical relaxation behavior of the regenerated silk fibroin films. Macromol. Res. 2009, 17, 785–790. [Google Scholar] [CrossRef]
  39. Born, M. Thermodynamics of crystals and melting. J. Chem. Phys. 1939, 7, 591–603. [Google Scholar] [CrossRef]
  40. Guan, J.; Wang, Y.; Mortimer, B.; Holland, C.; Shao, Z.; Porter, D.; Vollrath, F. Glass transitions in native silk fibres studied by dynamic mechanical thermal analysis. Soft Matter 2016, 12, 5926–5936. [Google Scholar] [CrossRef] [PubMed]
  41. Porter, D.; Vollrath, F. Water mobility denaturation and the glass transition in proteins. Biochim. Biophys. Acta 2012, 1824, 785–791. [Google Scholar] [CrossRef] [PubMed]
  42. Chen, F.; Porter, D.; Vollrath, F. Silk cocoon (Bombyx mori): Multi-layer structure and mechanical properties. Acta Biomater. 2012, 8, 2620–2627. [Google Scholar] [CrossRef] [PubMed]
  43. Fu, C.; Porter, D.; Chen, X.; Vollrath, F.; Shao, Z. Understanding the Mechanical Properties of Antheraea Pernyi Silk-From Primary Structure to Condensed Structure of the Protein. Adv. Funct. Mater. 2015, 21, 729–737. [Google Scholar] [CrossRef]
  44. Qin, G.; Hu, X.; Cebe, P.; Kaplan, D.L. Mechanism of resilin elasticity. Nat. Commun. 2012, 3, 1003–1013. [Google Scholar] [CrossRef] [PubMed]
  45. Roberts, D.R.T.; Holder, S.J. Mechanochromic systems for the detection of stress, strain and deformation in polymeric materials. J. Mater. Chem. 2011, 21, 8256–8268. [Google Scholar] [CrossRef]
  46. Hu, X.; Kaplan, D.; Cebe, P. Determining beta-sheet crystallinity in fibrous proteins by thermal analysis and infrared spectroscopy. Macromolecules 2006, 39, 6161–6170. [Google Scholar] [CrossRef]
  47. Yu, H.Y.; Wang, F.; Liu, Q.C.; Ma, Q.Y.; Gu, Z.G. Structure and Kinetics of Thermal Decomposition Mechanism of Novel Silk Fibroin Films. Acta Phys.-Chim. Sin. 2017, 33, 344–355. [Google Scholar]
  48. Sgreccia, E.; Chailan, G.F.; Khadhraoui, M.; Vona, M.L.D.; Knauth, P. Mechanical properties of proton-conducting sulfonated aromatic polymer membranes: Stress–strain tests and dynamical analysis. J. Power Sources 2010, 195, 7770–7775. [Google Scholar] [CrossRef] [Green Version]
Figure 1. Dynamic mechanical analysis of the storage modulus (E′) curves of Chin silk fibroin fibers (a) and Thai silk fibroin fibers (c); and tan δ curves of Chin silk fibroin fibers (b) and Thai silk fibroin fibers (d) at five different frequencies: 1 Hz (solid line), 2 Hz (dash line), 5 Hz (dot line), 10 Hz (dash dot line), and 20 Hz (short dot line).
Ijms 19 03309 g001
Figure 2. Tan δ curves of CSF (a) and TSF (b) from 1.0% (Solid); 1.5 (Dash); 2.0 (Dot); 3.0 (Dash Dot); 4.0 (Short Dot); 6.0 (Dash Dot Dot) CaCl2/FA; (c) Curve fitting example of the Tg region (sample TSF-3.0). The fitted peaks are shown as Dash (α1 Peak) and Dash Dot Dot (α2 Peak); (d) FTIR absorbance spectra of TSF samples from different CaCl2 conctration solutions in the range of 1100–1800 cm−1; (e) Curve fitting example of the amide I region (sample TSF-3.0) in FTIR spectra. The fitted peaks were shown as short dash-dotted lines, and assigned as side chains (S), β-sheets (B), random coils (R), α-helixes (A), and turns (T).
Ijms 19 03309 g002
Figure 3. The stress-strain curves of CSF (a) and TSF (b) samples regenerated from 1.0% (solid square), 1.5% (hollow square), 2.0% (solid circle), 3.0% (hollow circle), 4.0% (solid triangle), and 6.0% (hollow triangle) CaCl2/FA solutions.
Ijms 19 03309 g003
Table 1. The water content of different SF film samples by Thermogravimetric Analysis (TG) *.
SampleWater Content/%SampleWater Content/%
CRS9.70TRS7.26
CSF-1.03.23TSF-1.01.26
CSF-1.52.97TSF-1.51.04
CSF-2.02.05TSF-2.01.10
CSF-3.01.79TSF-3.01.20
CSF-4.01.35TSF-4.00.52
CSF-6.01.16TSF-6.00.51
* All of the numbers have an error bar of ± 3%.
Table 2. The experimental parameters of degummed Chinese (CRS) and Thailand (TRS) B. Mori silk fibers obtained from DMA analysis *
SampleCRS/TRS
Attributionγβααc
E′/MPa18.33/7.4826.28/11.7140.20/23.5438.34/25.73
Tan δ10.45/7.216.24/4.7223.49/19.36N/A
TE/°C41.64/43.2896.12/109.07235.34/238.48269.92/272.39
Ttanδ/°C39.91/42.1192.72/100.55214.25/218.92N/A
ΔTE/°C2.1812.953.142.47
ΔTtanδ/°C2.207.834.67N/A
* E′ and tan δ represent the storage modulus and integral loss factor of CRS and TRS samples at 1 Hz frequency respectively in DMA tensile mode. TE and Ttanδ represent the peak temperatures for the storage modulus and the loss factor curves, which are corresponding to the protein relaxation of γ, β, α and αc. ΔTE and ΔTtanδ represent the peak temperature differences between TRS and CRS samples at γ, β, or α-relaxation regions. The E′ and Tan δ values have an error bar of ±0.3, the TE and Ttanδ values have an error bar of ±0.5 °C.
Table 3. Calculated GIM parameters based on peptide group contributions and amino acid (AA) sequences for B Mori silks [24].
PeptideStructureEcoh/kJ·mol−1 (without H-Bond)Degrees of Freedom NMolar Fraction as Counted in AA Sequence B Mori
Peptidebase(-R group)-C-CO-NH-24.360
Glycine(G)-H0047.5%
Alanine(A)-CH34.5231.7%
Serine(S)-CH2-OH10.8315.8%
Glutamine(Q)-CH2-CH2-CO-NH228.850
Tyrosine(Y)-CH2-Ph-OH35.845%
Leucine(L)-CH2-C(CH3)21840
Arginine(R)-CH2-CH2-CH2-NH-C(NH2)24570
AverageB. Mori29.26/
Table 4. GIM parameters used for Tg and the degree of structural disorder fdis calculations b*
SampleGroupH-BondsEcoh/kJ·mol−1NTgc/°CTg/°CTan δcTan δfdis
ChinG0.475A0.317S0.158Y0.0051
2
39.2
49.2
6
6
157.6
243.1
214.2556
70
23.490.63
0.51
ThaiG0.475A0.317S0.158Y0.0051
2
39.2
49.2
6
6
157.6
243.1
218.9256
70
19.360.52
0.42
* The number of H-bonds per peptide group is 1 or 2. Cohesive energy Ecoh is the sum of energy from hydrogen bonds and the peptide base. N is the degrees of freedom. Tgc is the theoretical glass transition temperature calculated from Equation (1), in which y is set as 241 °C for all cases. Tg represents the experimental glass transition temperature from tan δ curve at α relaxation. The theoretical Tan δc was calculated from Equation (2), which represents the energy dissipation for 100% degrees of structural disorder. Tan δ is the integral loss factor at α relaxation in DMA curve, and fdis is the predicted degree of structural disorder by using Equation (3).
Table 5. SSDSC and DMA analysis of CSF and TSF samples in their glass transition region [30] *.
Sample[CaCl2]/wt %Tgs/°CΔCp/J·g−1·°C−1Tg-α1/°CContent in α1 Region/%Tan δ-α1fdis-α1Tg-α2/°CContent in α2 Region/%Tan δ-α2fdis-α2
CSF1.0176.880.1667157.5332.876.650.18177.1167.137.520.20
1.5172.650.1721155.4952.567.150.19171.4747.447.920.21
2.0169.040.1890155.1653.957.890.21168.3246.058.910.24
3.0167.420.1998154.8771.539.890.27165.5128.479.250.25
4.0163.210.2157154.3973.5411.570.3163.9326.4610.370.27
6.0157.300.2204153.9279.9912.440.34162.3620.0111.030.30
TSF1.0181.540.1641186.1454.704.340.12216.9445.304.020.10
1.5177.080.1643184.5465.515.730.15212.0134.494.970.13
2.0175.940.1644184.3171.146.520.18209.2728.865.560.14
3.0173.420.1972183.6975.247.220.19206.4524.766.250.16
4.0164.010.2136183.0875.728.930.23204.8524.287.670.20
6.0159.200.2137182.4776.6510.170.26200.8223.358.930.23
* [CaCl2] is the concentration of calcium chloride in the solution. Tgs is the glass transition temperature of SF measured by SSDSC. Tg-α1 and Tg-α2 represent the peak temperatures of α1-relaxtion and α2-relaxtion from the tan δ curves, respectively. Their content values were obtained by fitting the tan δ curve in α1 and α2-relaxtion regions using Gaussian peaks. Tan δ1 and Tan δ-α2 are the integral loss factor at α relaxations. fdis-α1 and fdis-α2 are the predicted degree of structural disorder at α1-relaxtion and α2-relaxtion by the GIM model, respectively. The Tgs, Tg-α1, and Tg-α2 have an error bar of ±0.5 °C. The Content in α1 region and Content in α2 region have an error bar of ±3%. The Tan δ-α1, Tan δ-α2, fdis-α1 and fdis-α2 have an error bar of ±0.05.
Table 6. Percentage of secondary structures in CSF and TSF samples obtained by FTIR structural analysis [28].
CSFTSF
[CaCl2] (wt %)β-Sheet/%Turns/%Side Chains%α-Helix/%Random Coils/%β-Sheet/%Turns/%Side Chains/%α-Helix/%Random Coils/%
1.023.326.031.3310.0759.2526.607.111.638.5956.07
1.520.257.591.0711.3959.7024.768.021.159.9656.11
2.013.5612.050.9113.7859.7014.7014.311.1912.5457.26
3.08.0914.130.8518.7958.1410.9216.610.9418.2253.31
4.08.1715.410.6325.6650.138.2517.050.7921.8352.08
6.06.8315.890.5730.2646.457.0717.740.3728.3946.43
Table 7. Mechanical properties of CSF and TSF samples measured by DMA *.
CSFTSF
[CaCl2]/wt %Initial SlopeYield Stress/MPaStrain/%Initial SlopeYield Stress/MPaStrain/%
1.07.86 ± 0.1014.91 ± 1.571.21 ± 0.087.37 ± 0.2414.28 ± 1.291.86 ± 0.07
1.57.11 ± 0.3214.30 ± 1.382.15 ± 0.156.94 ± 0.1913.33 ± 1.372.27 ± 0.10
2.05.48 ± 0.5513.98 ± 1.552.47 ± 0.133.57 ± 0.3612.45 ± 1.562.50 ± 0.05
3.02.96 ± 0.3713.66 ± 1.293.39 ± 0.162.70 ± 0.2711.20 ± 1.283.93 ± 0.12
4.02.16 ± 0.8612.97 ± 1.374.17 ± 0.091.80 ± 0.5810.17 ± 1.355.45 ± 0.27
6.01.83 ± 0.2711.43 ± 0.985.88 ± 0.171.52 ± 0.498.93 ± 1.886.96 ± 0.16
* [CaCl2] is the concentration of calcium chloride in the formic acid solution system. The initial slope is the ratio of stress to strain, which represents the elasticity of SF sample. The yield stress is the stress at the yield point in stress-strain curve. The strain value is the material elongation ratio under the stress force of 10 MPa. Every sample have to do five experiment times. Their errors or deviations were shown in each column after symbol ‘±’.

