Article

Proteomics Analysis of SsNsd1-Mediated Compound Appressoria Formation in Sclerotinia sclerotiorum

1
College of Plant Science, Jilin University, Changchun 130062, China
2
College of Plant Health and Medicine, Qingdao Agricultural University, Qingdao 266109, China
*
Authors to whom correspondence should be addressed.
These authors contributed equally to this work.
Int. J. Mol. Sci. 2018, 19(10), 2946; https://doi.org/10.3390/ijms19102946
Submission received: 10 September 2018 / Revised: 21 September 2018 / Accepted: 24 September 2018 / Published: 27 September 2018
(This article belongs to the Special Issue Microbial Virulence Factors)

Abstract

:
Sclerotinia sclerotiorum (Lib.) de Bary is a devastating necrotrophic fungal pathogen attacking a broad range of agricultural crops. In this study, although the transcript accumulation of SsNsd1, a GATA-type IVb transcription factor, was much lower during the vegetative hyphae stage, its mutants completely abolished the development of compound appressoria. To further elucidate how SsNsd1 influenced the appressorium formation, we conducted proteomics-based analysis of the wild-type and ΔSsNsd1 mutant by two-dimensional electrophoresis (2-DE). A total number of 43 differentially expressed proteins (≥3-fold change) were observed. Of them, 77% were downregulated, whereas 14% were upregulated. Four protein spots fully disappeared in the mutants. Further, we evaluated these protein sequences by mass spectrometry analysis of the peptide mass and obtained functionally annotated 40 proteins, among which only 17 proteins (38%) were identified to have known functions including energy production, metabolism, protein fate, stress response, cellular organization, and cell growth and division. However, the remaining 23 proteins (56%) were characterized as hypothetical proteins among which four proteins (17%) were predicted to contain the signal peptides. In conclusion, the differentially expressed proteins identified in this study shed light on the ΔSsNsd1 mutant-mediated appressorium deficiency and can be used in future investigations to better understand the signaling mechanisms of SsNsd1 in S. sclerotiorum.

Graphical Abstract

1. Introduction

Sclerotinia sclerotiorum (Lib.) de Bary is a destructive and hard-to-control plant necrotrophic fungal pathogen on a broad range of agricultural crops [1,2]. Developmentally, vegetative hyphae gathered together forming hardened, multicellular sclerotia enclosed by a melanized rind layer, which plays an important role in the development and pathogenesis of S. sclerotiorum [3,4]. Under suitable environmental conditions, sclerotia germinate to form vegetative hyphae or apothecia, and the latter release numerous ascospores that initiate new disease cycles [5]. Mycelia from sclerotia or ascospores can directly infect the plant tissues by forming compound appressoria (also known as infection cushions) from modified hyphae [2,4] or enter the plant tissue through open stomata by secreting oxalic acid [6]. Therefore, a better understanding of the developmental mechanism of appressorium is also critical to the control of this important plant disease.
The formation of compound appressoria in S. sclerotiorum has been reported to require a contact stimulus [7]. Prior to penetration, the tips of hyphae become swollen and extensively branched, and then form modified, multicellular, and melanin-rich compound appressoria [8,9]. The tip of compound appressorium could penetrate the host epidermis and form vesicles of bulbous [8]. Some events are consistent with this development process, such as the production and accumulation of oxalic acid (OA), cell wall-degrading enzymes (CWDE), and effector proteins, which contribute to S. sclerotiorum pathogenesis in myriad ways [9,10,11,12,13,14]. However, despite these important findings, the detailed molecular mechanism underpinning the development and formation of compound appressoria in S. sclerotiorum is still largely unclear.
In the past years, many genetic factors have already been characterized to be essential for appressoria development in S. sclerotiorum. The disruption of the oxalic acid biosynthesis gene (Ssoah1) promotes the compound appressorium development; however, the disruption of Sspks13 only eliminates the pigmentation of the compound appressorium without attenuating its infection and pathogenicity potential [2]. Significant accumulation of the oxalate decarboxylase (OxDC) gene Ss-odc2 occurs during the compound appressorium development, and ΔSs-odc2 mutants were found to have less effective compound appressorium differentiation [11]. In addition, the secretory proteins Ss-Rhs1 and Ss-Caf1 were highly expressed during the hyphal infection process, whereas the silenced strains had decreased appressoria formation [9,15]. Furthermore, Ss-ggt1 (γ-glutamyl transpeptidase gene), sac1 (cAMP pathway adenylatecyclase gene), and rgb1 (type-2A phosphoprotein phosphatase (PP2A) B regulatory subunit gene) have also been identified to be associated with the development of compound appressoria [16,17,18]. Recently, the type IV GATA zinc finger transcription factor SsNsd1, orthologous to the Aspergillus nidulans NsdD (never in sexual development) proteins and Botrytis cinerea BcLTF1 [19], was reported to regulate asexual–sexual development and appressoria formation [4]. Its knockout mutants were defective in the transition from hyphae to compound appressorium formation, resulting in a loss of infection-dependent pathogenicity on healthy hosts [4]. However, the signal pathway by which the SsNsd1 regulates the development and pathogenicity remains to be further elucidated.
Life sciences have been deeply influenced by the “omics” technologies in last decade, including genomics, transcriptomics, proteomics, and metabolomics, aiming at a global perspective on biological systems [20]. Proteomics strategies, such as the two-dimensional gel electrophoresis (2-DE) approaches, have been confirmed as efficient, rapid, and powerful means to identify proteins (or genes) followed by mass spectrometry, and matrix-assisted laser desorption/ionization (MALDI) [21]. Large-scale analyses of proteins by 2-DE have been conducted in a number of organisms, such as animals [22], plants [23], yeast [24], and fungi [25,26], which contributes considerably to our understanding of gene functions in the postgenomic era. However, the development and application of such methods in the filamentous plant-pathogenic fungus S. sclerotiorum have not yet been reported.
Modern agriculture faces a huge challenge in the prevention from the diseases caused by S. sclerotiorum. The transcription factor SsNsd1 was characterized to be essential for appressoria development in our previous study [4]. The possibility to control plant diseases by suppressing the compound appressorium formation would eliminate initial infections. Here, we used the SsNsd1 knockout mutant (ΔSsNsd1) to confirm the loss-of-function nature in compound appressorium development and conducted proteomics analysis by 2-DE. Using comparative proteomics analysis of the ΔSsNsd1 mutant and the wild-type S. sclerotiorum, we attempted to identify the ΔSsNsd1-mediated differentially expressed proteins combined with peptide mass spectrometry analysis, which would contribute significantly to the SsNsd1-mediated compound appressorium formation.

2. Results

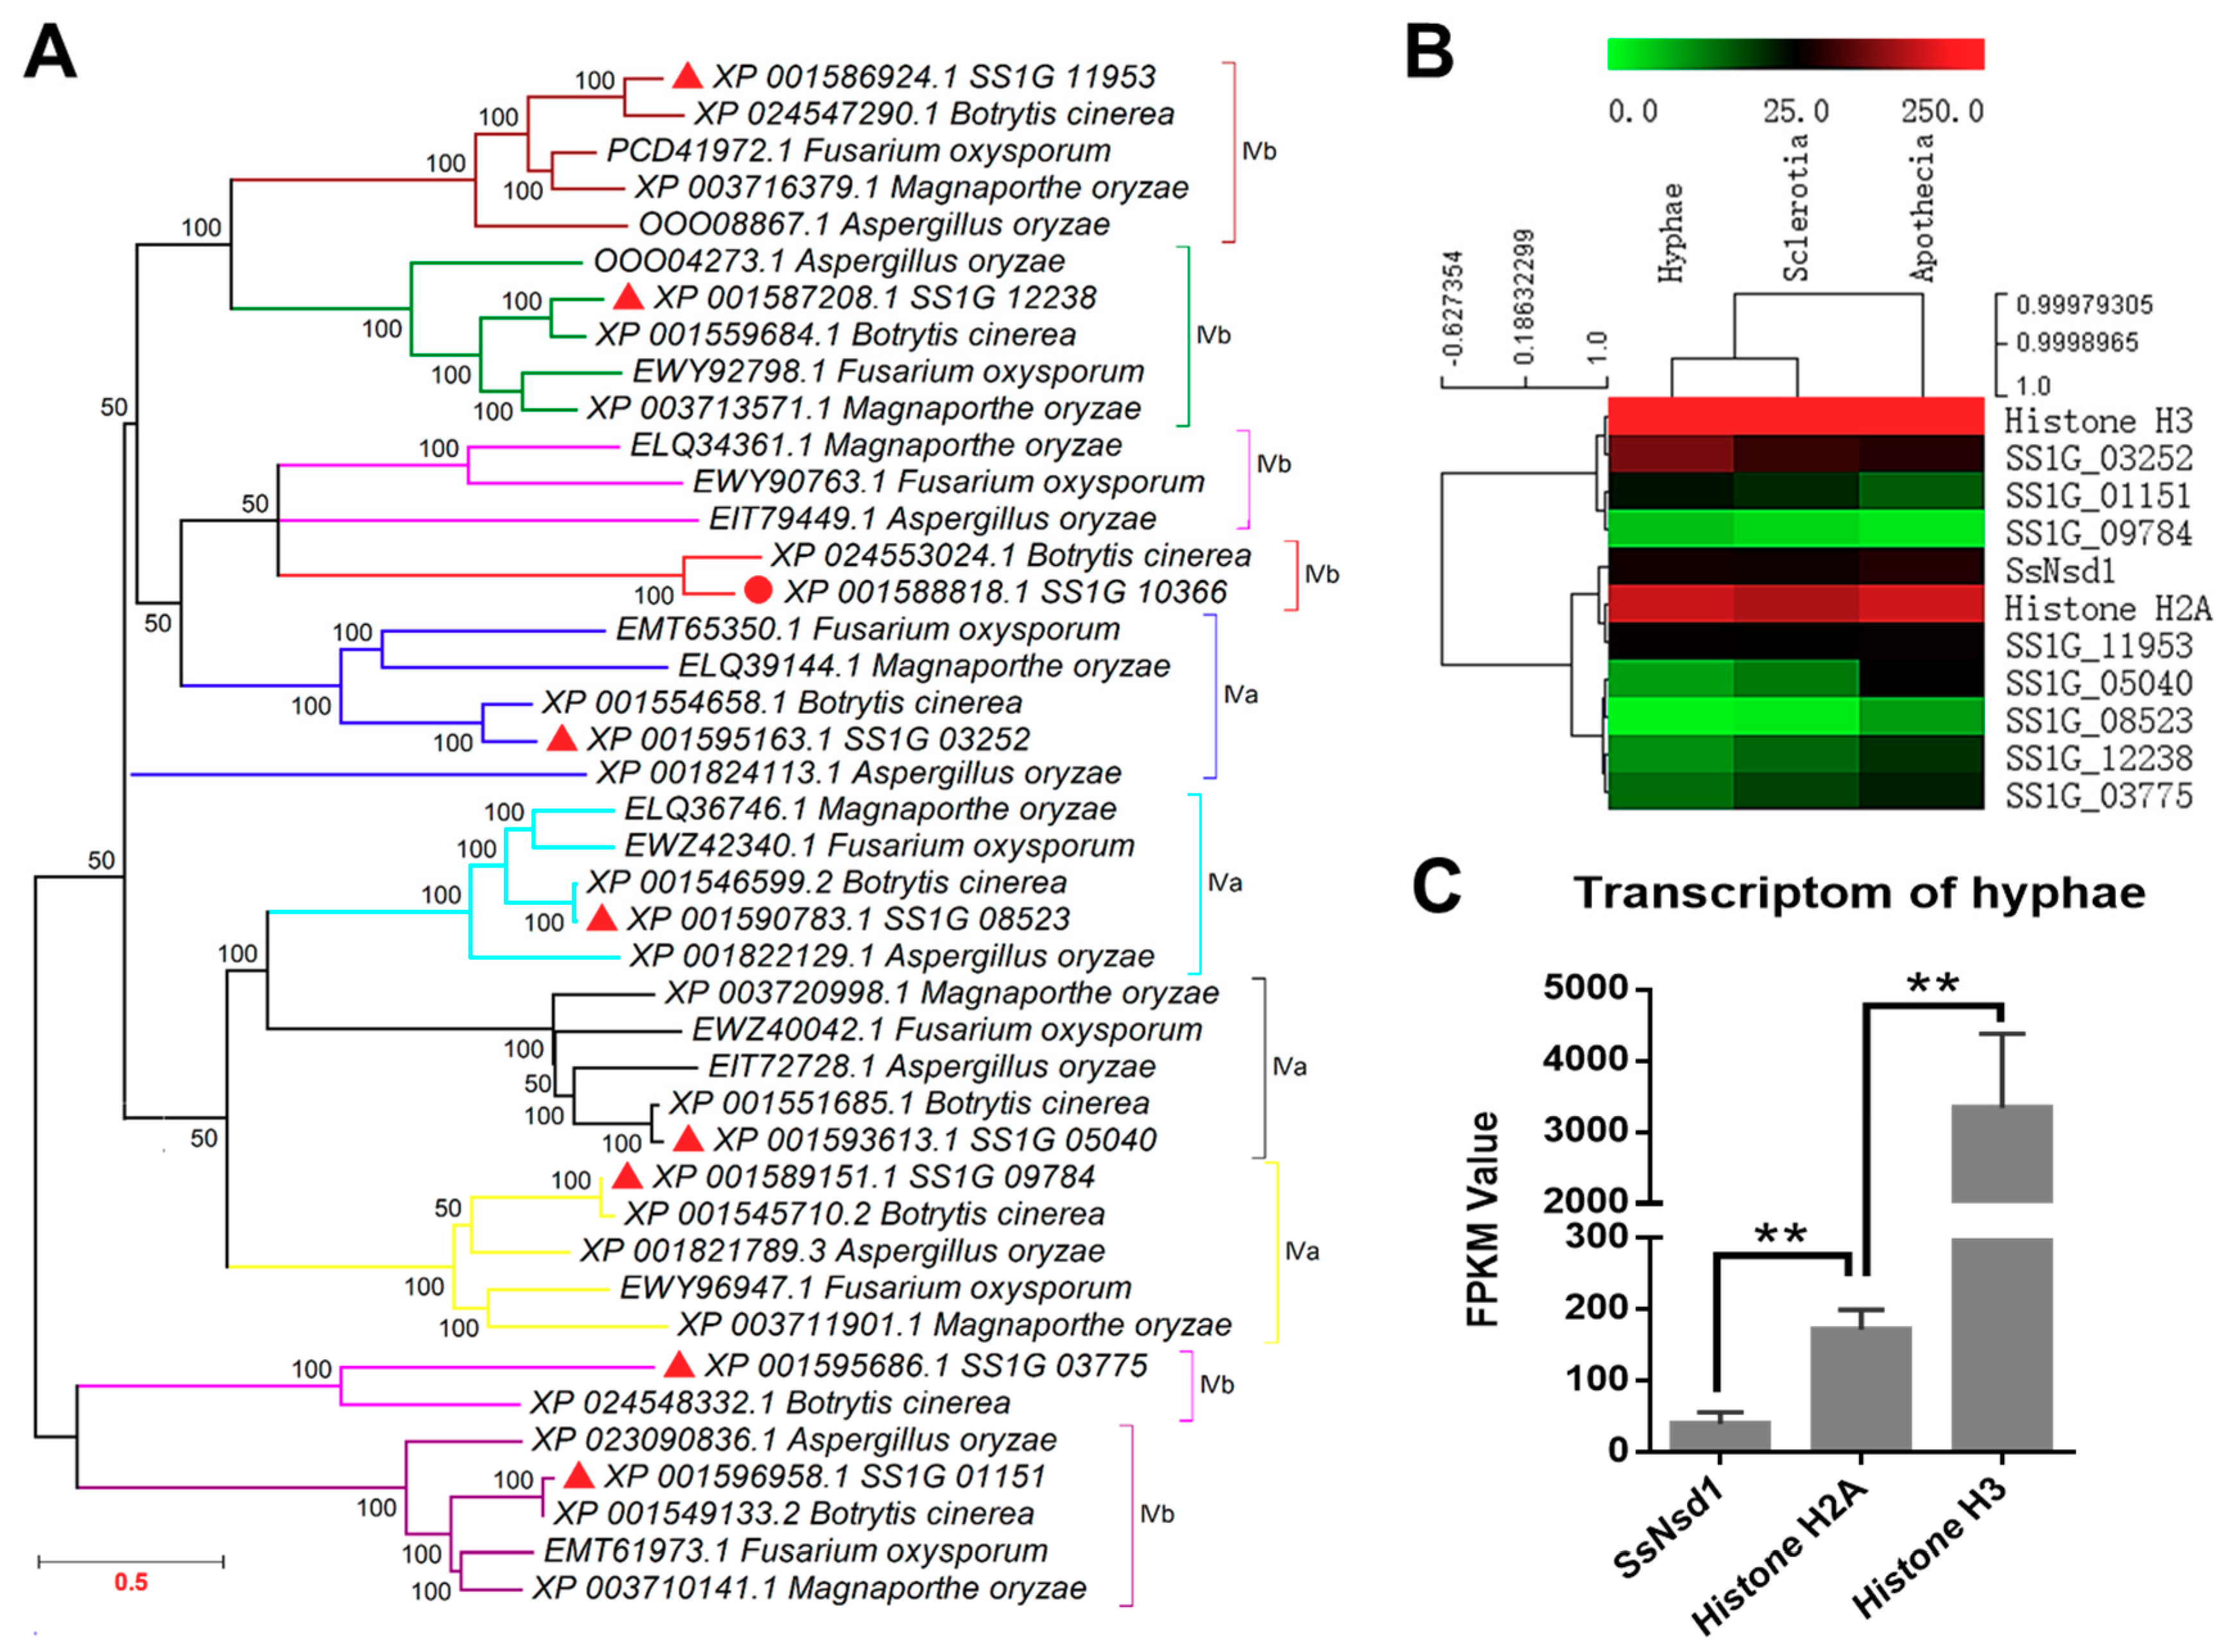
2.1. Phylogenetic Analysis of SsNsd1 and Other GATA-Type Proteins

In this study, similar proteins of SsNsd1 and other GATA-type proteins of S. sclerotiorum were searched from Botrytis cinerea, Fusarium oxysporum, Magnaporthe oryzae, and Aspergillus oryzae by BLAST. The homolog of SsNsd1 was obtained only from the B. cinerea. However, all other GATA-type proteins had homologs in B. cinerea, F. oxysporum, M. oryzae, and A. oryzae. Phylogenetic analysis of the putative amino acid sequence of these GATA-type proteins showed their genetic relationship in different fungi (Figure 1A). Coincidently, the GATA-type proteins of S. sclerotiorum were closely related to B. cinerea. Besides, two forms of the type IV zinc finger motif (IVa and IVb) are also depicted in Figure 1A based on the residue loops. Most of the clades contained all five sequences from S. sclerotiorum, B. cinerea, F. oxysporum, M. oryzae, and A. oryzae. However, the SS1G_03775 and its homologs were separated as shown by the pink color clade. One branch was also separated from the clade of the SS1G_03252 and its homologs, which might be due to the poor similarity in different fungi.

2.2. Transcript Accumulation of SsNsd1 and Other GATA-Type Proteins

Digital gene expression (DGE) analysis based on FPKM values was performed using the transcriptomes during three the developmental stages of S. sclerotiorum (Figure 1B). The transcript accumulation in the GATA-type proteins was lower than those of the histone genes (histone H3 and histone H2A). Only the SS1G_03252 protein showed a little higher transcript accumulation in the hyphae development stage, whereas most of the other GATA-type proteins displayed low contents with FPKM values ranging from 1.3 to 64 in all three development stages. Obviously, the SS1G_08523 and SS1G_09784 proteins were extremely low abundant with FPKM values under 10 in all three development stages.
As one of the GATA-type proteins, the varied expression patterns of SsNsd1 were previously examined and compared across developmental stages [4]. In this study, to further determine the regulation mechanism of the Ssnsd1 expression, we obtained its expression profile in the vegetative hyphae development stage (Figure 1C). The transcript accumulation of the SsNsd1 gene was significantly lower than those of the histone genes (histone H2A or histone H3) during the vegetative mycelial growth prior to the compound appressorium formation. SsNsd1 was expressed at the lowest level (FPKM value of 39.6), however, Histone H2A was expressed higher (FPKM value of 171.8). Moreover, Histone H3 (FPKM value of 3337.3) displayed the highest expression level, indicating its predominant role, usually as a housekeeping gene. Overall, the transcript accumulation of SsNsd1 and other GATA-type proteins were exceedingly low in the development stages of S. sclerotiorum.

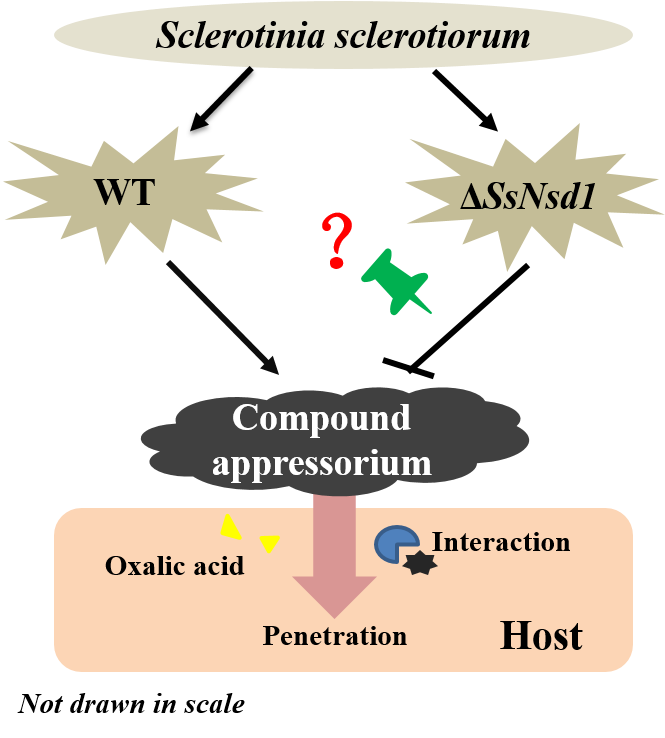
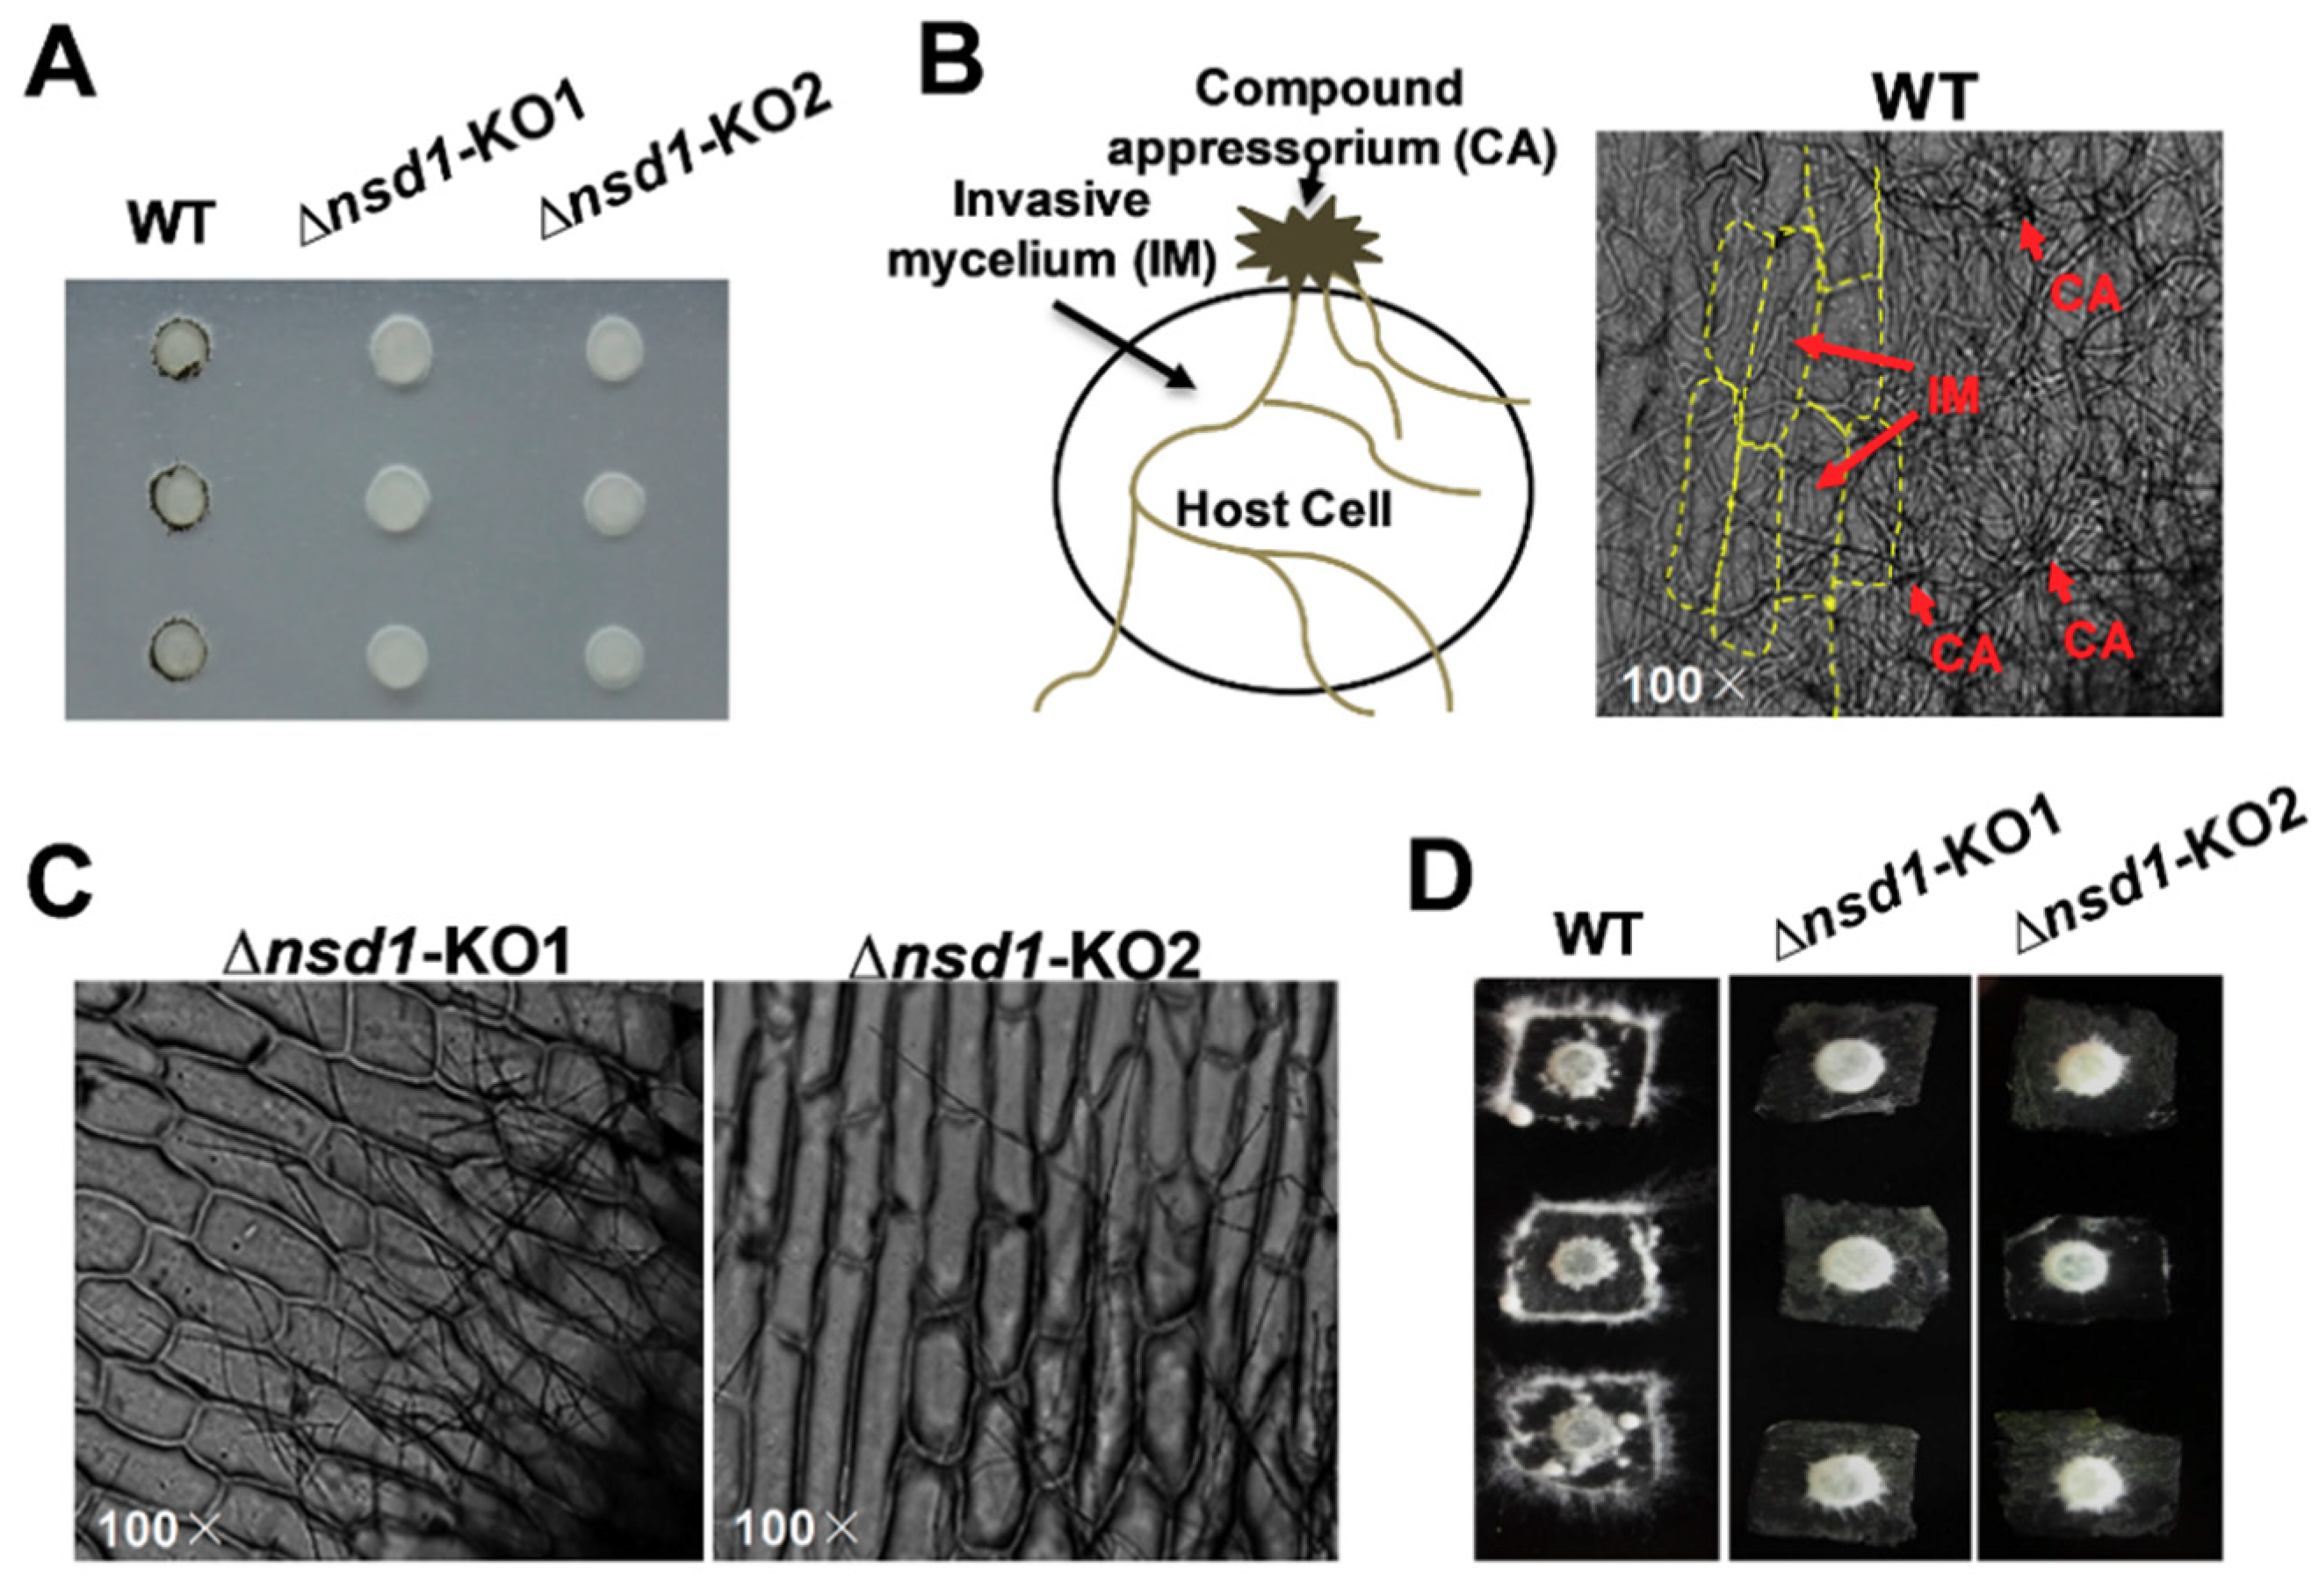
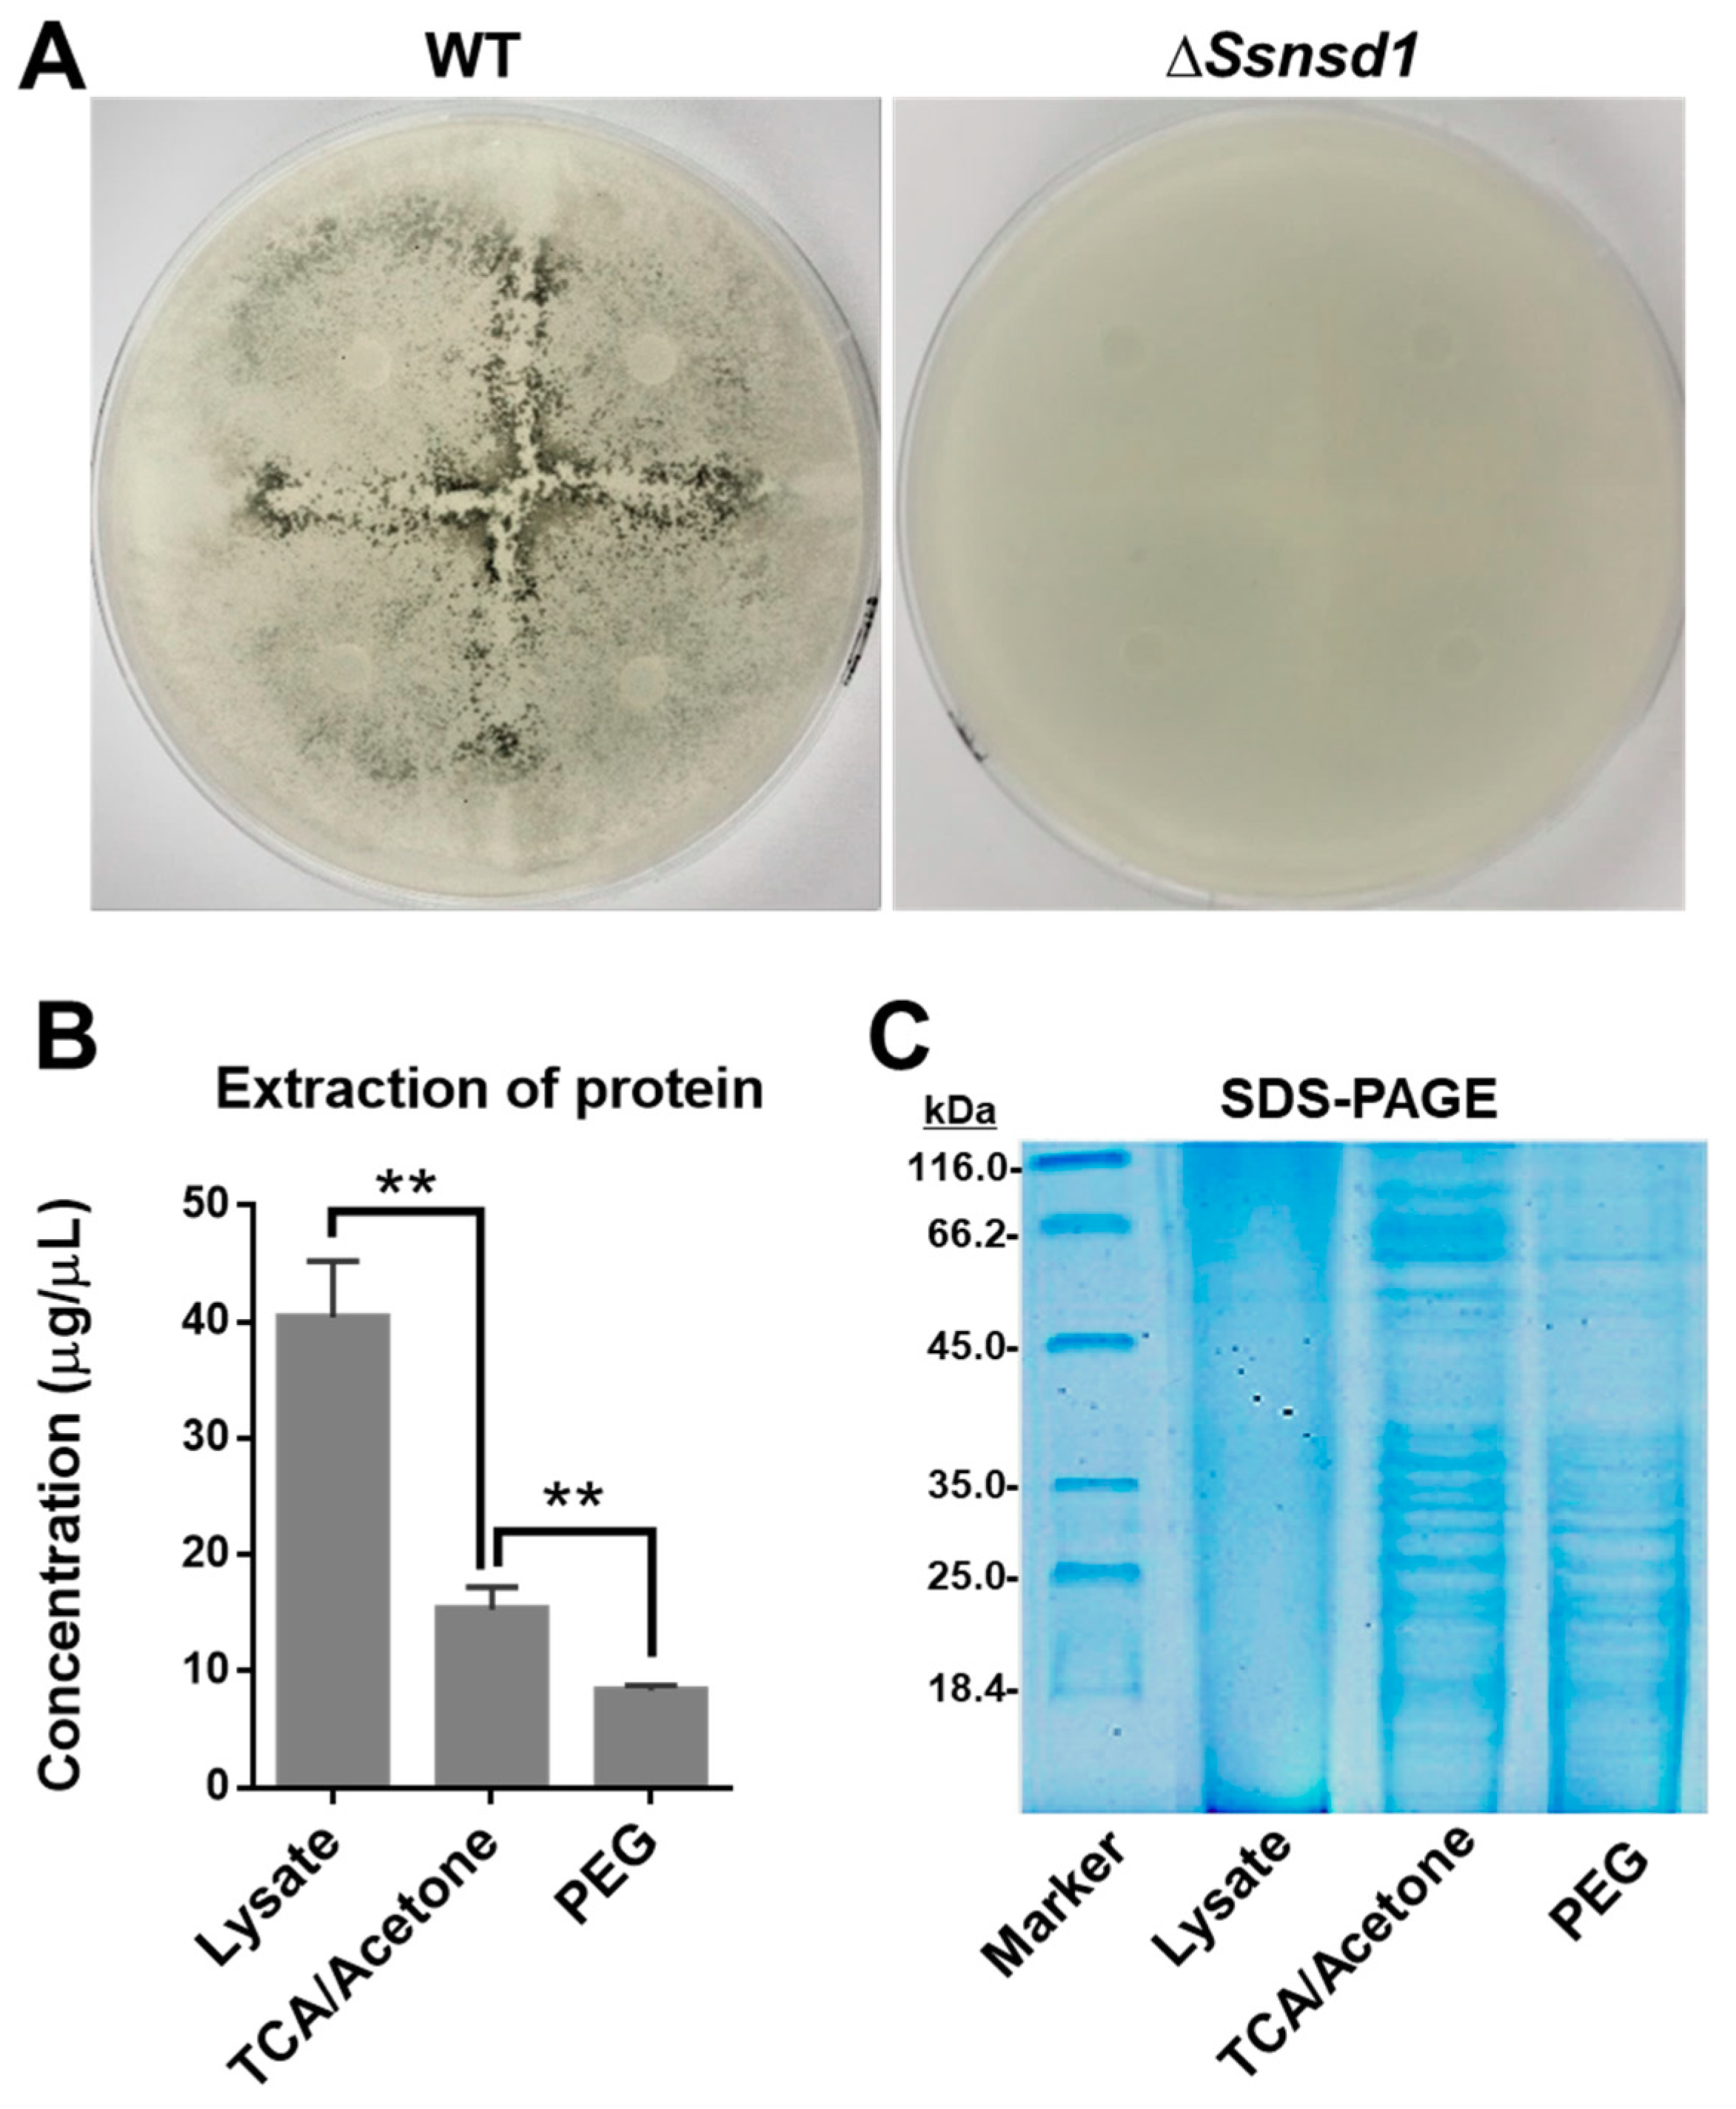
2.3. ΔSsNsd1 Mutant Suppressed Compound Appressorium Formation

Although SsNsd1 exhibited a low expression level during the hyphae development, it still played a crucial role in appressorium development (Figure 2). Phenotypically, the ΔSsNsd1 mutant had inhibited normal production of pigmented compound appressoria from the vegetative hyphae, as established by paraffin film assays (Figure 2A). In determining whether ΔSsNsd1 affected the compound appressorium formation or only the pigmentation, normal compound appressorium and penetration (invasive mycelium) were observed microscopically only on onion epidermal strips inoculated with the wild type (WT) strain (Figure 2B), but not on the ΔSsNsd1 mutant strain. The WT strain could colonize onion cells, but no invasive mycelium was observed from ΔSsNsd1 mutants (Figure 2C). Thus, SsNsd1 abolished the compound appressoria formation from the modified hyphae, resulting in the penetration-dependent loss of pathogenicity.

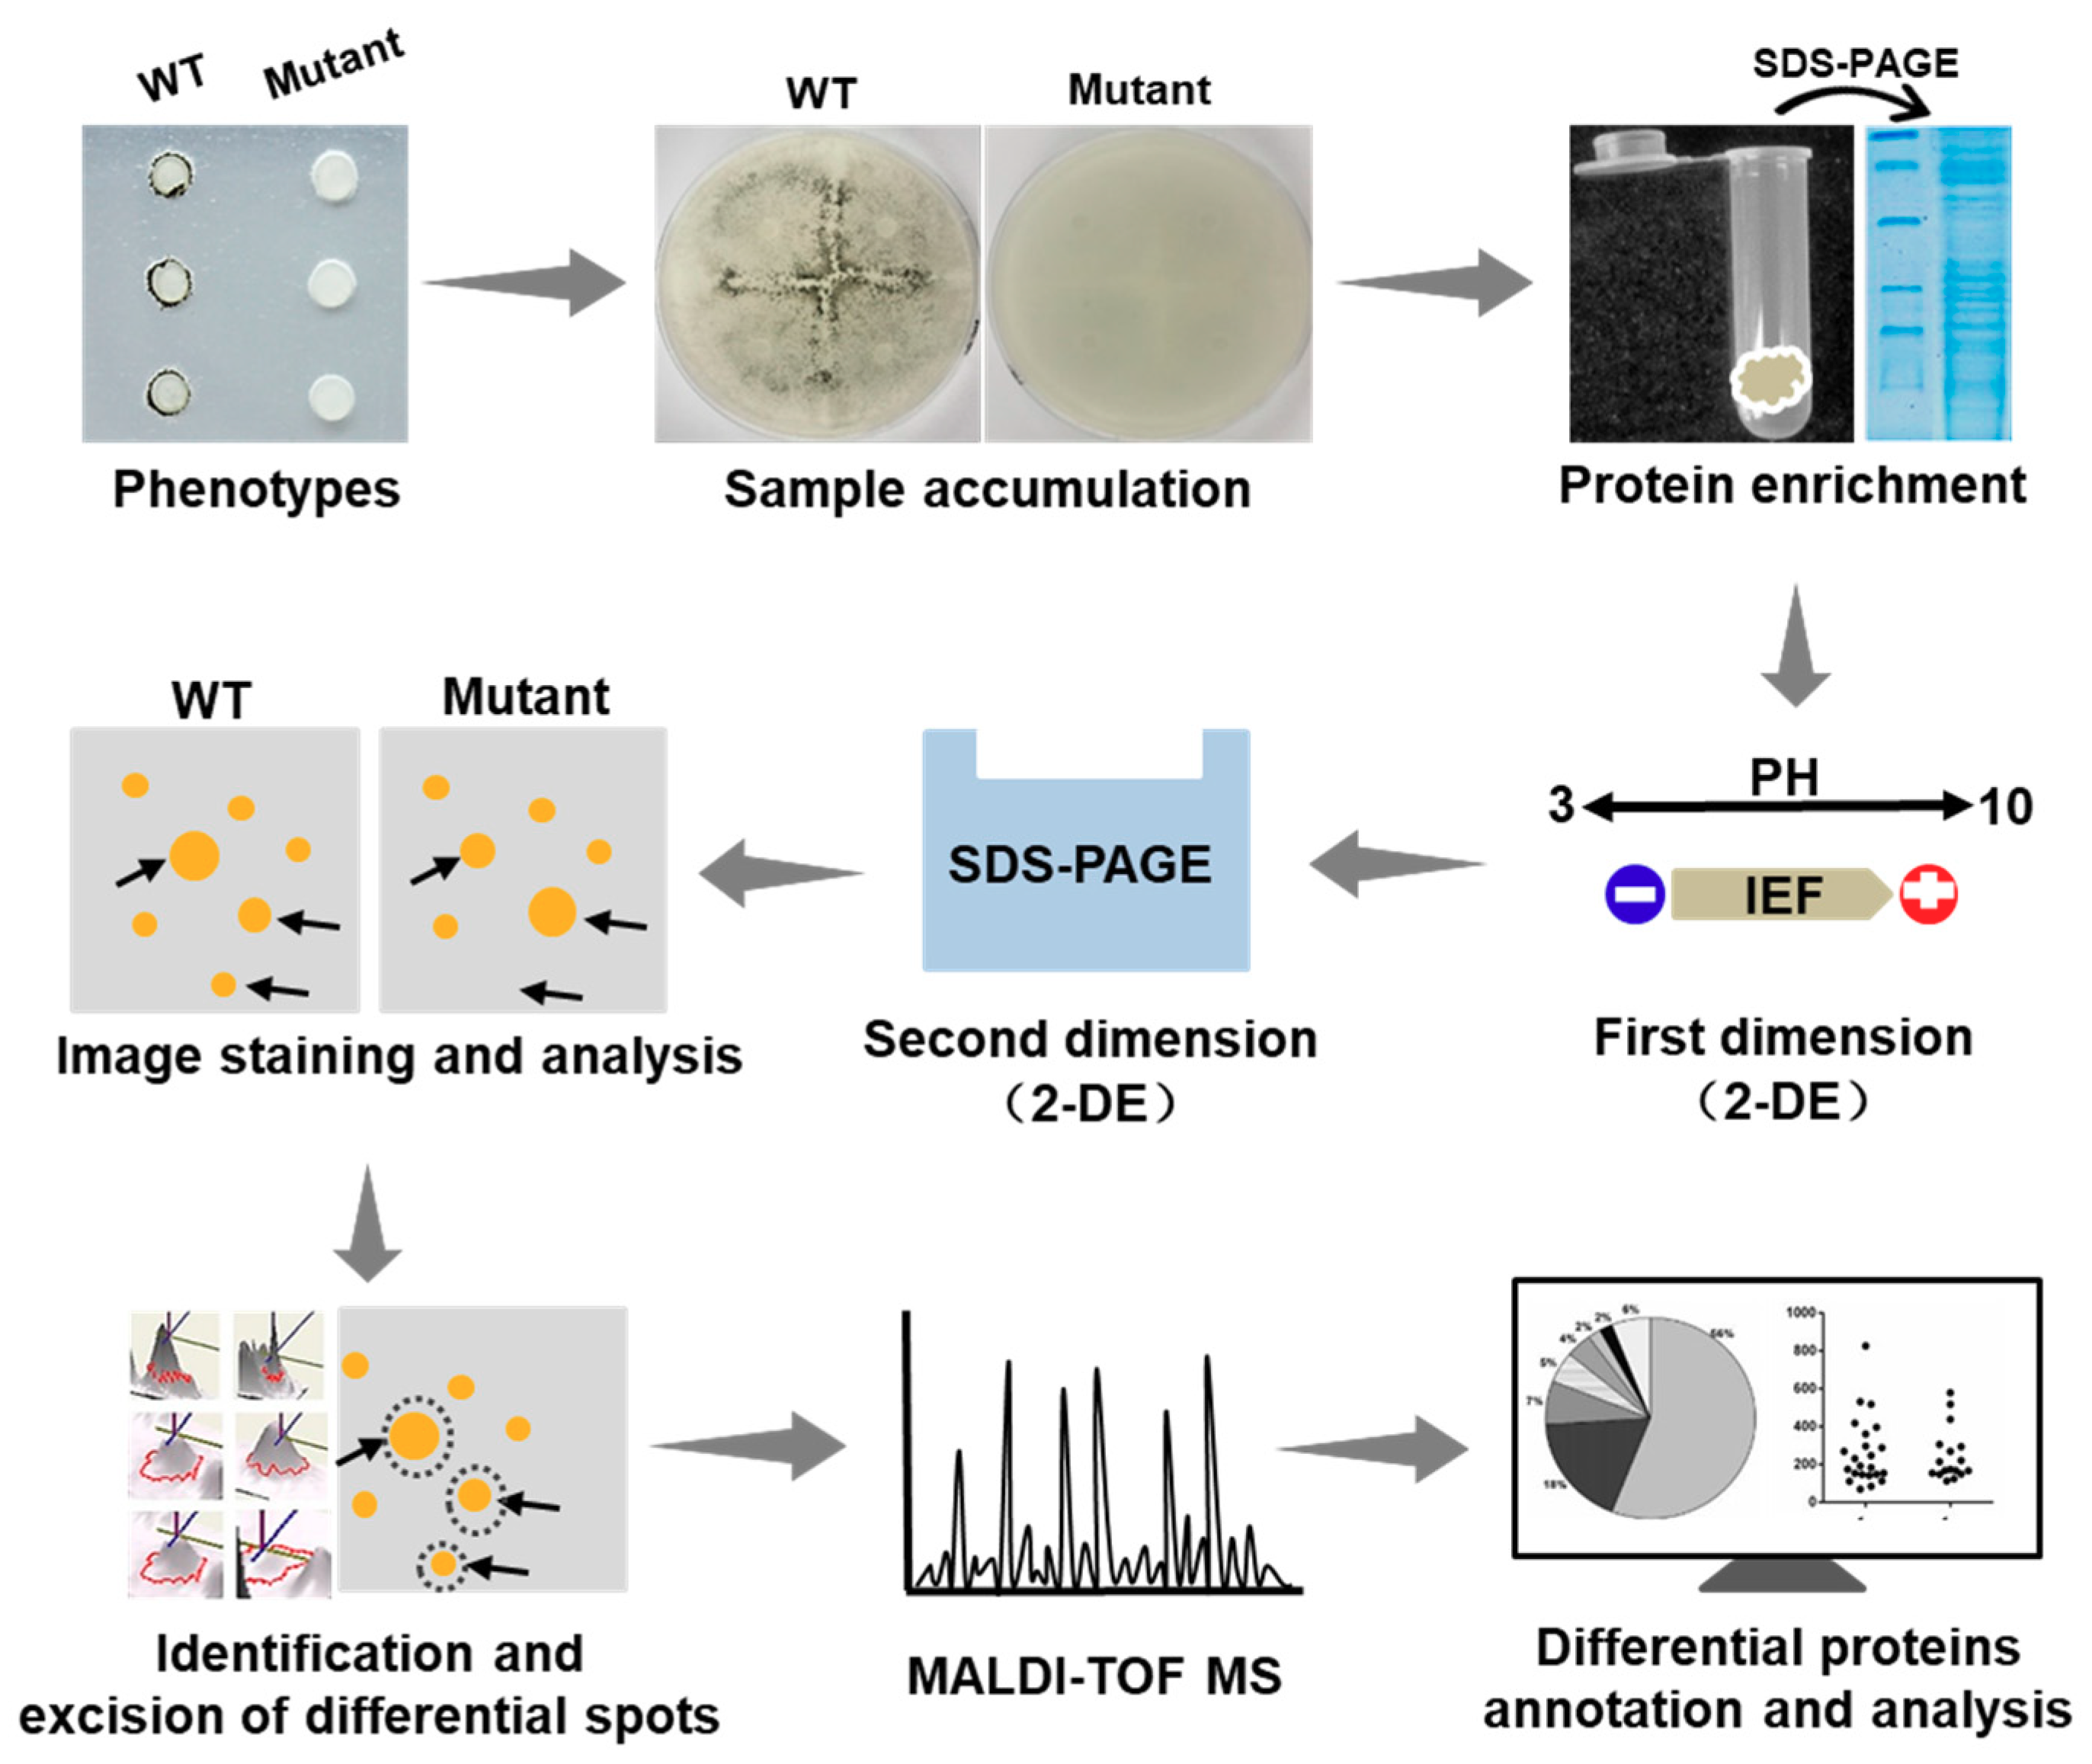
2.4. Diagram of the Identification of Differential Proteins

In this study on S. sclerotiorum, we applied the 2-DE technology. A diagram illustrating the approach of the determination of the proteomics changes is presented in Figure 3. In this diagram, the comprehensive protocol is described by individual steps of the application of this technique, i.e., sample preparation and solubilization, isoelectric focusing (IEF) in IPG strips, running SDS-PAGE gels, image analysis, differential spots identification and mass spectrometry (MS) analysis, and bioinformatic prediction.

2.5. Protein Extraction from Enriched Compound Appressoria

The cellophane induced the formation of abundant compound appressoria from the modified hyphae, which were observed macroscopically when the WT was cultured on cellophane (Figure 4A). No pigmentation was observed due to the lack of compound appressoria when ΔSsNsd1 were cultured on cellophane (Figure 4A). Thus, this was an effective method to provide enriched compound appressoria tissue with simple sample collection, which was ideally suited for protein extraction.
To optimize the best protein extraction method for 2-DE separation, we compared the concentration and quality of the extracted proteins using the three different methods. The highest concentration of protein was extracted by the use of the lysate as compared with those extracted by trichloroacetic acid (TCA)/acetone or polyethylene glycol (PEG) precipitation (Figure 4B); however, the quality of this protein, established by the SDS-PAGE test, was extremely poor (Figure 4C). In contrast, the protein extracted by further TCA/acetone or PEG precipitation exhibited clearer bands, but that extracted by TCA/acetone precipitation was at a higher concentration; the best result was obtained using the SDS-PAGE test (Figure 4C). Furthermore, the 2-DE clearly showed protein spots aggregation and transparent background (Figure 5). Thus, the protein extraction with further TCA-acetone precipitation could lay a foundation for a novel approach in comparative proteomics analysis by 2-DE technology in S. sclerotiorum.

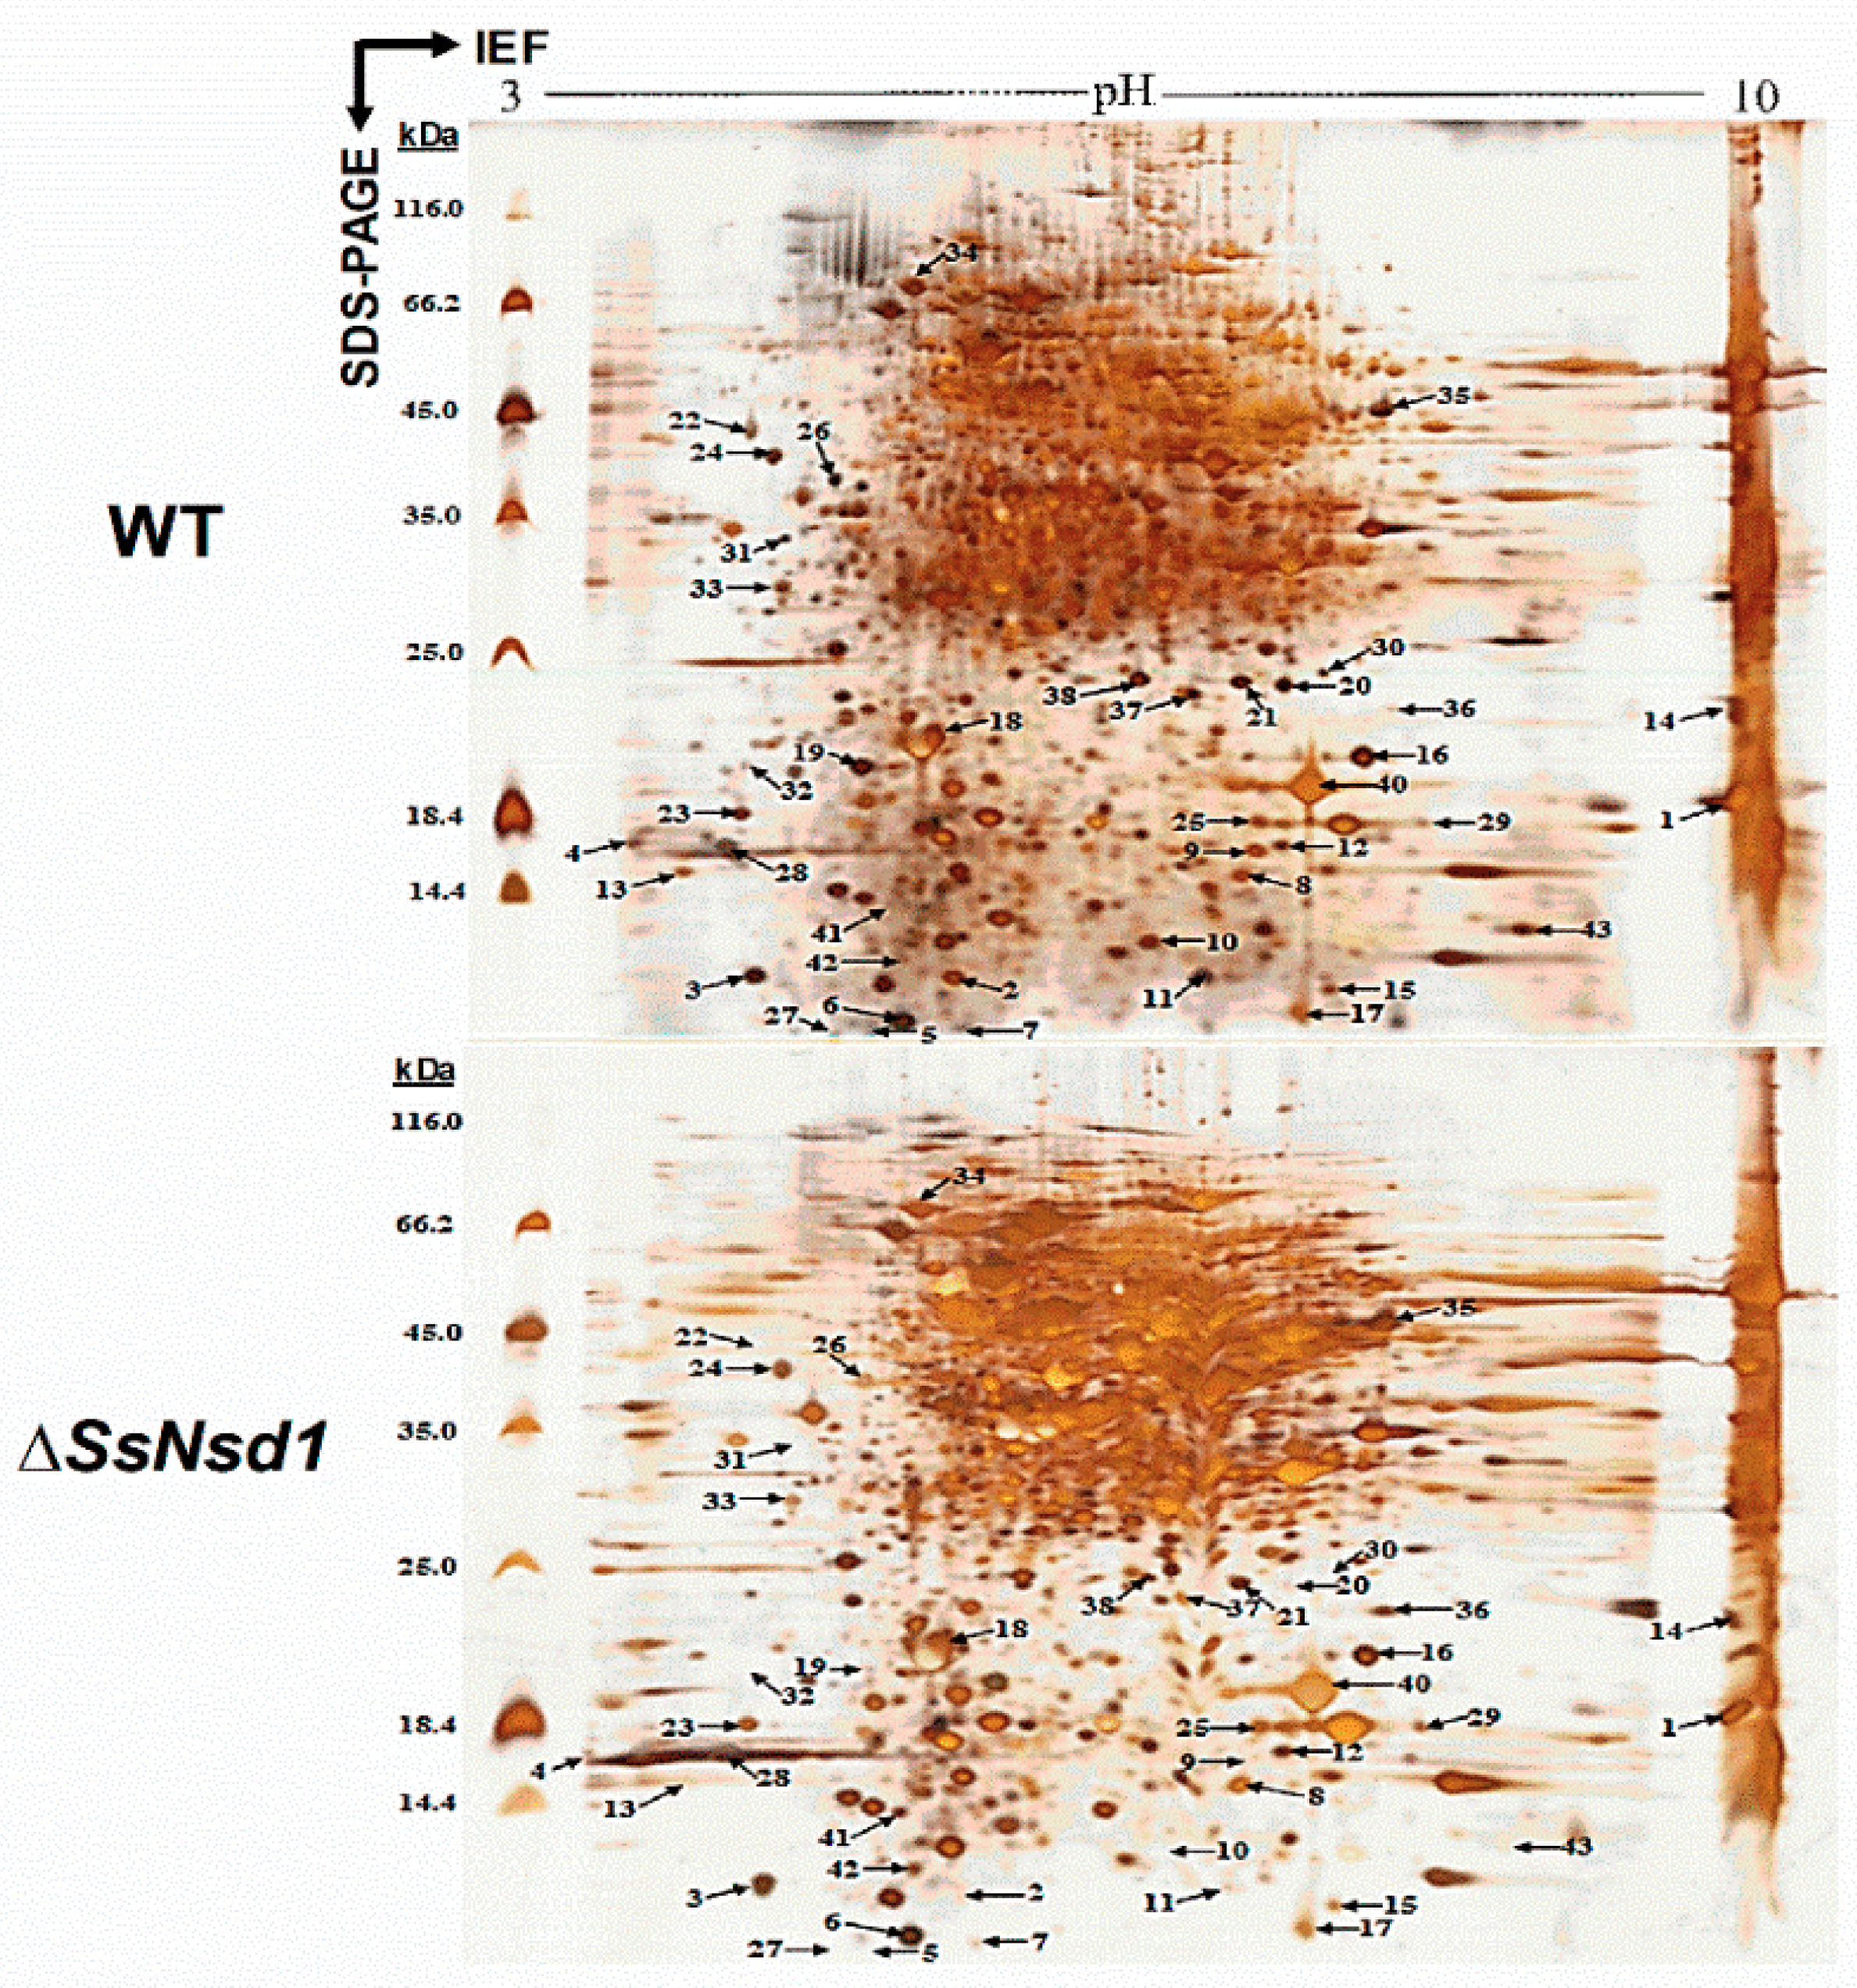
2.6. Identification of the Differential Protein Spots by 2-DE Analysis

The proteins extracted from the WT and ΔSsNsd1 culture on cellophane were separated by 2-DE (Figure 5). In this figure, 2-DE displayed well-visible protein spot aggregation and transparent background, while few nonspecific bands or foreign matters were observed. Using three biological replicates for both the wild-type and mutant strains, the clear 2-DE images were compared and analyzed by ImageMaster™ 2D Platinum 6.0 software. More than 2660 protein spots were detected reproducibly on each 2-DE gel image for the WT and ΔSsNsd1 mutant, within the pH range of 4 to 10 and with relative molecular masses of 8 to 80 kDa. However, only 43 protein spots exhibited changes in the differential abundance (more than three-fold) between the WT and the ΔSsNsd1 mutant, which are marked with arrows and numbers in Figure 5. Among these selected differential protein spots, 33 protein spots were downregulated, six proteins spots were upregulated, and four proteins spots disappeared in the ΔSsNsd1 strain compared to the wild type (Figure 6A). Subsequently, all differential expression proteins were excised and subjected to MALDI-TOF analysis.

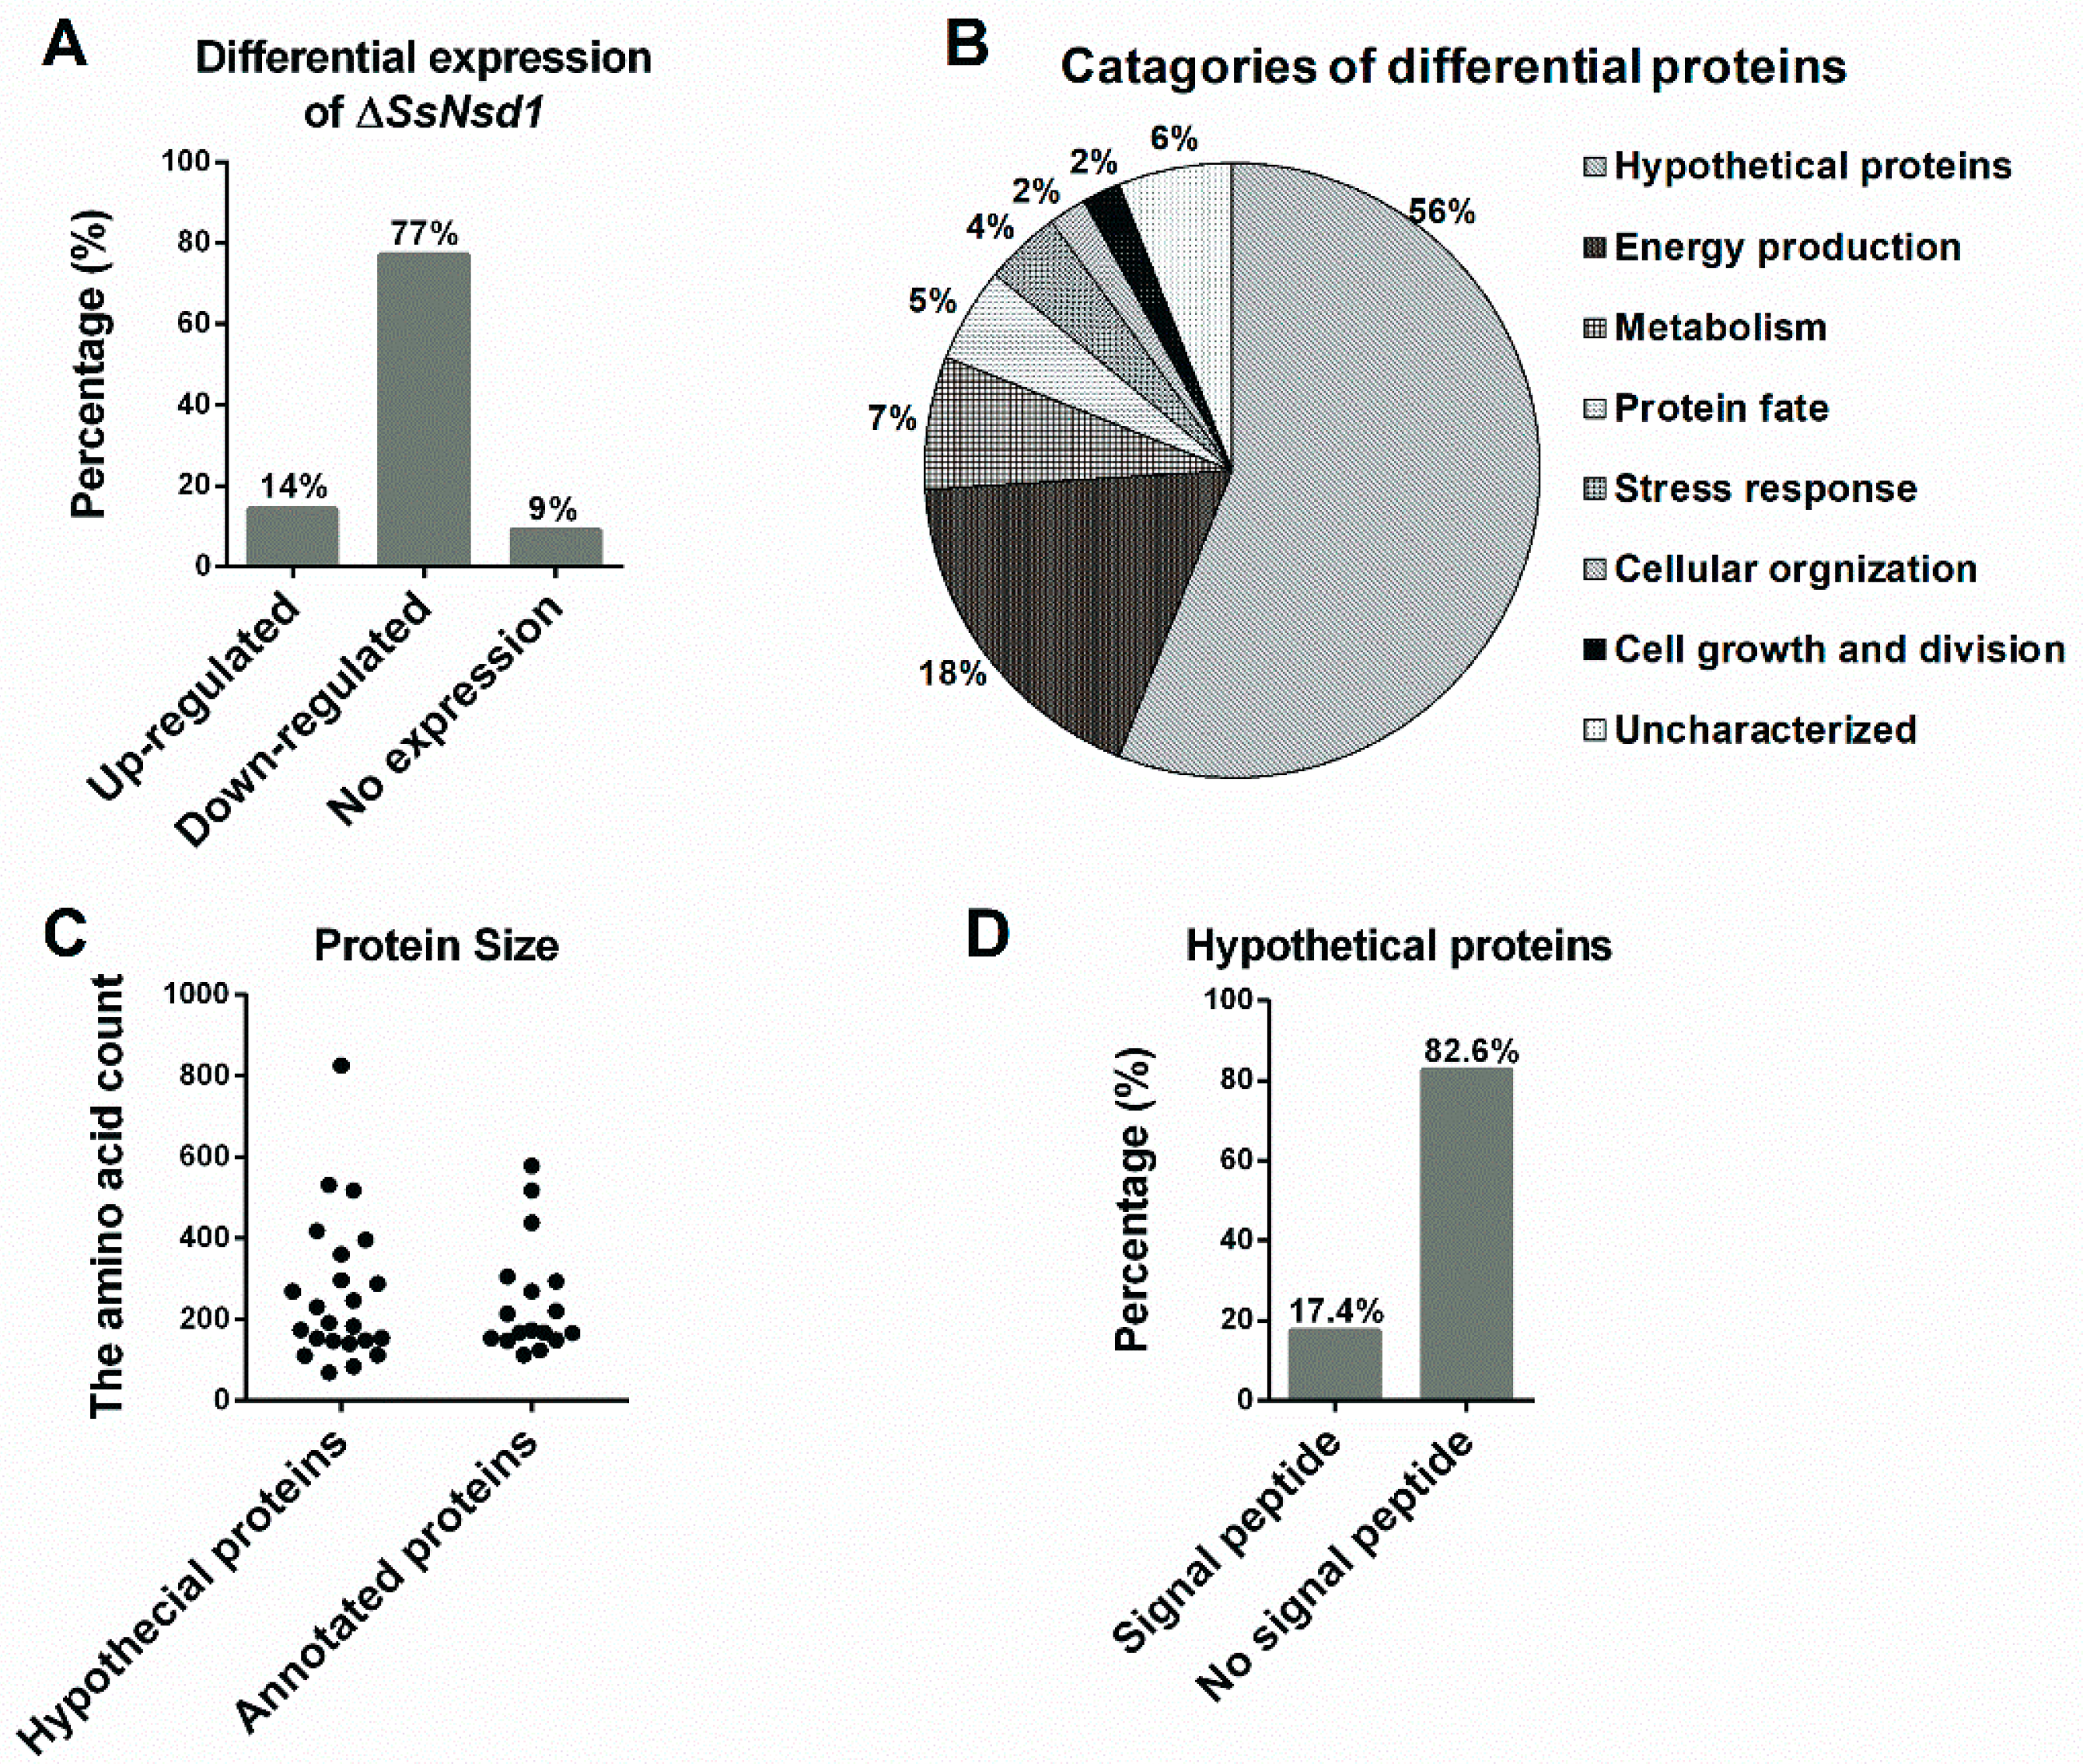
2.7. Prediction and Characteristics of the Identified Proteins

After prediction and functional annotation of these excised proteins, 40 proteins were identified. Of them, 17 proteins (38%) were predicted with the known functions (Table 1), and other 23 homologous to unnamed or predicted proteins were collectively designated as “hypothetical proteins”, accounting for 56% (Table 2). However, three proteins (spots 7, 13, and 23) were not identified by MALDI for unknown reason, which were designated as “uncharacterized” (6%). The predicted known functional categories (38%) were further sorted into six functional categories, including energy production (18%), metabolisms (7%), protein fate (5%), stress responses (4%), cellular organization (2%), and cell growth and division (2%) (Figure 6B).
In addition to providing functional categories, the global view of the protein sizes was also evaluated by the numbers of the amino acids (Figure 6C). Based on the function annotation, they were divided into hypothetical and annotated proteins. Then, the distribution of their protein size was similar to that of 262 and 247 amino acids, respectively (Figure 6C). Furthermore, we predicted the signal peptide among these hypothetical proteins to obtain additional insights into the putative functions of the hypothetical proteins (Figure 6D, Table 2). Four proteins (17.4%) were predicted to contain the N-terminal signal peptide, which indicated they might be potential secretory proteins during the compound appressorium formation.

2.8. Functional Analysis of Annotated Proteins

The 2-DE approach provided a powerful proteomic screening tool to identify the initial candidate differentially expressed proteins. We evaluated these predicted proteins after functional annotation and identified 17 proteins to be functionally known, representing 10 nonredundant unique proteins (Table 1). The fact that identical proteins were available in different protein spots might have been due to the protein modification or other unclear reasons as analyzed in the discussion section.
Here, we provide information concerning the analysis of the predicted functionally known proteins. Nucleoside diphosphate kinase (NDPK) (spots 1, 9, and 17) usually possesses kinase activity exerted by direct response to the G-protein signaling or indirect catalytic GDP–GTP exchange activity, which also plays a major role in the synthesis of nucleoside triphosphates [27,28,29]. The eukaryotic translation initiation factor 5A-1 (eIF5A-1; spot 18) is involved in the protein fate pathway [30], which activates the 60 s subunits combination, assists in the conformational changes of the 80 s subunits, and participates in the intracellular part; proteins associate with ribosomes cyclically during the elongation phase of the protein synthesis [31]. The elongation factor 1-β (spot 26) plays a central role in the elongation step in eukaryotic protein biosynthesis [32]. The 60 s ribosomal protein L23 (Spot 4) is usually involved in cell growth; its expression was decreased in the mutant (Table 1). Ribosomal protein is involved in regulating gene transcription, translation, and regulation of cell proliferation, differentiation, apoptosis, etc. [33].
The nuclear transport factor 2 (spot 3) mediates the nucleus introduction of GDP-bound RAN (ras-related nuclear) from the cytoplasm, which is of great significance in the cargo receptor-mediated nucleocytoplasmic transport [34]. The GTP-binding nuclear protein (spot 30) is also known as the GDP-bound RAN, which is involved in the nucleocytoplasmic transport processes, nuclear envelope formation, and mitotic spindle formation [35].
The predicted ubiquitin-conjugating (UBC) enzyme E2 (spot 8) belongs to the ubiquitin pathway enzymes, which are involved in protein degradation in eukaryotic cells [36]. The SCF (Skp1/Cul1/F-box) complex submit Skp1 (spot 32) is involved in the assembly of protein complex and joins in ubiquitin depending on the protein catabolism process [37]. Peptidyl-prolyl cis-trans isomerase (spots 12, 25, 16, and 39) was downregulated, whereas spot 29 was upregulated (Table 1). Peptidyl-prolyl cis-trans isomerase regulates the mitosis-related protease in the cell cycle by protein phosphorylation of the substrate proteins [38] or through other mechanisms such as the ubiquitin-mediated proteasomal degradation [39].
Citrate synthase (spot 35) is localized in the mitochondrial matrix and catalyzes the condensation reaction from acetyl coenzyme A (CoA) and oxaloacetate to form the six-carbon citrate [40]. Oxalic acid biogenesis is realized through the hydrolysis of oxaloacetate, which is a key pathogenicity factor accumulated during the compound appressorium development [10].
The functional analysis of the predicted differential proteins was mainly based on the evidence in mammalian, plant, or yeast cells. However, the proteins displayed their important role on the cell proliferation, differentiation, protein synthesis and degradation, protein transport and modification, etc., which might determine they function as a complex regulatory network during the compound appressorium formation in S. sclerotiorum.

3. Discussion

Novel strategies for prevention and control of the devastating plant pathogenic fungus S. sclerotiorum have been intensively investigated [5]. However, still no effective method has been discovered to control the diseases caused by this pathogen. Compound appressoria are formed unless penetration occurs directly via stomata, which could be one of the key targets for disease control. The GATA-family transcription factors are involved in several essential aspects of the life cycle of M. oryzae, especially in the regulation of appressorium development and sporulation [41]. In S. sclerotiorum, the GATA-type transcription factors SsSFH1 and SsNsd1 were recently reported to be involved in the development of compound appressoria [4,42]. Here, phylogenetic analysis was performed, and transcription accumulation of all the predicted GATA-type proteins was detected. Importantly, even the transcription accumulation of SsNsd1 in the vegetative hyphae was significantly higher than that during the sclerotium and apothecium developmental stages [4]. The transcript accumulation remained at a much lower level even during vegetative mycelial growth, compared to that of the histone genes (Figure 1C). The SsNsd1 gene knockout strain was defective in the development of appressorium, and no penetration was observed into unwounded onion epidermal cells (Figure 2), which confirmed the findings of a previous study [4]. In general, NsdD or its orthologous gene is involved in providing a regulatory balance between asexual and sexual development in ascomycete fungi (e.g., the development of perithecia, fruiting body, conidia, or sclerotia) [43,44,45]. In addition, NsdD is also involved in pathogenicity. The Δbclft1 mutants of B. cinerea exhibited only a postpenetration virulence defect without causing significant defects in the compound appressorium development; however, the S. sclerotiorum ΔSsnsd1 mutant was essentially reversed as established earlier [4]. Due to the particularly different infection defects between B. cinerea and S. sclerotiorum, in the present study, we focused on the compound appressorium deficiency phenotype and the biological role of SsNsd1, aiming to find the key target of appressorium formation-related genes that would enable the control of this pathogen.
The proteomics analysis as an evaluation of the final level of gene expression started out with techniques based on 2-DE and extended its reach by the use of MS-based techniques that have been increasingly employed in recent years [20]. Although alternative technologies, such as multidimensional protein identification technology (MudPIT), or arrays, have already emerged, thus far, there is no technology that matches 2-DE in its capability to realize routine parallel expression profiling of large mixtures [46]. Furthermore, 2-DE combined with the identification by MS is currently the major approach utilized in most of the undergoing proteome projects to develop a global understanding of the living cell [46]. Compared to the quantitative analysis based on MALDI-TOF techniques, LC–MS is currently in an early stage considering limitations, such as the availability of software, algorithms, etc. [20]. MALDI-TOF is already widely used in fungal proteome research, such as that in yeast [24], A. fumigatus [25], and Cryomyces antarcticus [26]. Therefore, we applied the 2-DE technology and MALDI-TOF mass spectrometry in this project to investigate the plant pathogenic fungus S. sclerotiorum using proteomics analysis for identification of differentially expressed proteins during the compound appressorium formation (Figure 3). Using suitable equipment and experienced laboratory personnel, this system approach can quickly perform the identification of functional proteins.
The 2-DE technology combined with IPGs has already conquered most limitations of carrier ampholyte-based 2-DE with in the respect of reproducibility, handling, resolution, and separation [47]. The efforts to develop the 2-DE technology further have been concentrated on improved solubilization/separation of hydrophobic proteins, show of low abundance, and more reliable quantitation by fluorescent dye technologies in recent years [46]. Despite the obvious advantages of the 2-DE technology, high quality proteins samples are always the bottleneck and precondition to the 2-DE project approach. As the 2-DE was firstly applied in S. sclerotiorum, we provided an optimal method for sample preparation after comparing three different pathways for protein extraction (Figure 4). By SDS-PAGE test, the protein extracted by further TCA/acetone precipitation and PEG methods has a better quality and could be used for 2-DE analysis. Both TCA/acetone and PEG methods are useful for minimizing protein degradation and removing interfering compounds, such as salt or polyphenols [48]. However, the amount of protein extracted by the PEG method is difficult to meet the requirements of 2-DE as established based on our results and those of a previous study [49]. In a comprehensive analysis, the TCA/acetone method displayed its advantages and was found to be the best method for protein extraction, which was consistent with the findings of a previous examination on another fungus, A. fumigatus [50]. Furthermore, in the 2-DE analysis, we achieved the separation of as many protein spots as needed on the gel, which was a prerequisite for the computerized analysis (Figure 5). In addition, a clear peptide mass spectrum was finally obtained by extraction of the different expressed protein spots, which laid the foundation of further research on SsNsd1-mediated differentially expressed proteins.
The development of the compound appressoria involves several distinct stages [9] and is tightly regulated by numerous genetic factors. In the present study, a total of 43 differentially expressed proteins were identified with significantly differential expression changes (≥3-fold) by computer analysis (Figure 5 and Figure 6). Most of them were downregulated, which indicated that the SsNsd1 transcript factor might positively regulate them. SsNsd1 might exert a reverse role in the signal pathway of the upregulated protein spots. By MS analysis of peptides and functional annotation, these functionally known proteins were predicted to be involved into energy production, metabolism, protein fate, stress response, cellular organization, and cell growth and division. However, attention had to be paid to the hypothetical proteins as they contained the signal peptide. The secretion and accumulation of effector proteins are usually coincident with the appressorium formation process, which contributes to S. sclerotiorum pathogenesis [9,15]. Therefore, these newly identified four proteins might have the effector protein role during the compound appressoria formation, but this notion needs to be further studied (Table 2). Overall, the differentially expressed proteins were finally obtained from the ΔSsNsd1 mutant, which might play an important role during the compound appressorium formation. Furthermore, losing the capacity to produce compound appressorium could also lead to defective sclerotium development, which is a key factor in the disease cycle of S. sclerotiorum, such as the mutation of Ss-ggt1 (a γ-glutamyltranspeptidase gene) [16], sac1 (a cAMP pathway adenylatecyclase gene) [17], and rgb1 (a type-2A phosphoprotein phosphatase (PP2A) B regulatory subunit gene) [18]. Therefore, these identified differential expression proteins were important gene resources involved in the development of S. sclerotiorum, which might be associated with the formation of both compound appressoria and sclerotia.
Last but not the least, a section on how to evaluate the 2-DE and the identified differential proteins is included here. After 2-DE, each protein could be theoretically resolved at a unique isoelectric point/molecular size coordinate [51]. Although hundreds of protein spots were also separated on the gel, omission of partial differential proteins can always occur due to unfavorable experimental factors, such as incomplete precipitation and/or dissolution of proteins [48], loss of sample during gel entry, inefficiency transfer of the protein from the first to the second dimension, loss of protein during staining [20], and truly absent spots from the samples [52]. In addition, some spots from 2-DE might result multiple protein identification, however, only the first identified protein with best protein score and most peptide counts was accepted for further study. Moreover, attention had also to be paid to the identical proteins (listed in Table 1), such as the nucleoside diphosphate kinase, peptidyl-prolyl cis-trans isomerase, and the 60 s ribosomal protein. Post-translational protein modifications affect the isoelectric point and, therefore, the focusing behavior of the protein in the first dimension [23], which could lead to the presence of identical proteins in different locations (i.e., spot 25 and spot 29; spot 4 and spot 28) (Table 1 and Figure 5). Post-translational modifications by fatty acid acylation, glycosylation, methylation, acetylation, or phosphorylation largely modulate the activity of most eukaryote proteins [53,54]. For example, certain signaling pathways were found to consist of series of phosphorylation and dephosphorylation events, which defined directionality and allowed different levels of feedback regulation [55]. In addition, the incomplete and insensitive separation can also lead to the appearance of identical proteins in different locations. Besides, attention is to be paid to the silver staining, as Coomassie brilliant blue was used in most of the 2-DE staining [56]. The silver staining has a low dynamic range, which has been criticized for the quantitative analyses of spots. However, the silver staining has very high sensitivity, which allows for a detection of very low protein amounts [20]; the improved and advanced image processing method could become feasible in better quantification of protein spots [57]. Besides, to obtain more data of the exact protein abundance, only the differential proteins with ≥3-fold changes were accepted for further study in this research. Therefore, the 2-DE technology of gradual optimization, further analysis of protein modifications, and other proteomic analysis methods are still needed to employ, which would present formidable challenges but generate indispensable insight into biological functions in S. sclerotiorum.

4. Materials and Methods

4.1. Fungal Strains and Culture Conditions

The wild-type (WT) S. sclerotiorum isolate 1980 and its derived mutant ΔSsNsd1 were used in this study based on our previous reports [4]. The strains were routinely grown on potato dextrose agar (PDA) at normal room conditions. The WT and ΔSsNsd1 stocks were stocked as dry sclerotia or as desiccated mycelia-colonized filter paper at −20 °C.

4.2. Phylogenetic Analysis of SsNsd1 and Other GATA-Type Proteins

From the genome of S. sclerotiorum, nine proteins are predicted to containing GATA-type DNA domains: SS1G_1036, SS1G_11953, SS1G_12238, SS1G_03252, SS1G_08523, SS1G_05040, SS1G_09784, SS1G_03775, and SS1G_01151 [4,42]. The BLASTX program at NCBI (http://www.ncbi.nlm.nih.gov/) was employed to search for the homologs of the sequence of the SsNsd1 (SS1G_1036) and other GATA-type proteins from pathogenic fungi (Botrytis cinerea, Fusarium oxysporum, Magnaporthe oryzae, and Aspergillus oryzae). The phylogenetic tree was generated using neighbor-joining method in MEGA5 [58]. Prediction of protein zinc finger domain was performed to classify the different categories. Most fungal GATA factors contain a single zinc finger domain, which can be divided into two distinct categories: the 17-residue loops (CX2CX17CX2C; zinc finger type IVa) and the 18-residue loops (CX2CX18CX2C; zinc finger type IVb) [59,60].

4.3. Digital Gene Expression of SsNsd1 and Other GATA-Type Proteins

The transcription accumulation of SsNsd1 from three different developmental stages (hyphae, sclerotia, and apothecia) has been characterized by qRT-PCR [4]. To further study the gene expression patterns of SsNsd1 prior to compound appressorium development, we profiled gene expression patterns in S. sclerotiorum from hyphae, sclerotia, and apothecia through RNA-seq approach. The transcription level of SsNsd1 and other GATA-type proteins were quantified using the fragments per kilobase of exon per million mapped fragments (FPKM) method [61]. The FPKM means were generated from three technical replicate samples. The FPKM values of histone H3 (SS1G_09608.3) and histone H2A (SS1G_02052) were used as endogenous control for quantitative comparison with SsNsd1 and other GATA-type protein genes. Hierarchical clustering was performed using the MeV program [62]. Clustering was based on the average of FPKM values.

4.4. Compound Appressorium Assays

Deficiency of compound appressoria was observed macroscopically by placing the freshly colonized mycelial agar plugs (5-mm diameter) on parafilm due to the presence of pigmented appressoria surrounding the agar plug [2]. Yellow onions were purchased from a local grocery store, and the onion epidermal strips were used for inoculation with a colonized PDA agar plug for observing the penetration of compound appressorium using light microscopy. For the enrichment of compound appressoria, colonized agar was cultured on PDA medium covered with cellophane and grown at a temperature of 22 to 25 °C as reported previously [2].

4.5. Two-Dimensional Gel Electrophoresis (2-DE) Strategy in This Study

The 2-DE combines isoelectric focusing separation based on isoelectric point of protein in the first dimension and sodium dodecyl sulfate (SDS) polyacrylamide gel electrophoresis (SDS-PAGE) to separate the complex mixtures of proteins according to the molecular size in the second dimension [23]. The Combined with identification by mass spectrometry (MS), 2-DE is currently the major method used in the majority of the ongoing proteome projects [46]. Besides, 2-DE gels are easy to handle and could be produced in a highly parallelized way. Furthermore, the corresponding software has also reached a level that allows for routine bioinformatic analysis. Meanwhile, in the presence of a suitable laboratory equipment and experienced personnel, analysis of samples can be theoretically completed through this approach with investments of time and efforts that are much smaller than those needed for the laboratory work [20]. Thus, these mature and coherent techniques are well-suited for comparative proteomics analysis of ΔSsNsd1 mutant-mediated appressoria deficiency in S. sclerotiorum. In detail, tissues derived from two different strains, WT and ΔSsNsd1, were harvested, and the proteome was enriched and solubilized. The protein mixture was then applied to a “first dimension” gel strip that separated the proteins based on isoelectric focusing (IEF) in IPG strips. Next, the IPG strip was subjected to equilibration and running of multiple “second dimension” SDS–PAGE gels, where proteins were finally separated by their molecular charge and molecular size. After staining, the visual protein spots were recorded and analyzed by sophisticated software. Then, the differential protein spots were excised for MS analysis. Finally, the differential proteins were subjected to functional annotation and prediction analysis.

4.6. Protein Extraction and Optimization

The enriched compound appressoria on the cellophane were harvested and frozen in liquid nitrogen, and then ground to a fine powder for protein extraction. To optimize the method for protein extraction from S. sclerotiorum and separate the protein by 2-DE, during the compound appressoria production, the protein was extracted by direct lysate and further TCA/acetone or PEG precipitation methods. For the lysate method [63], 0.1 g powdered sample was suspended in 300 µL of precooled lysate (7 M urea, 2 M thiourea, 2% (w/v) 3-[(3-Cholamidopropyl)dimethylammonio]propanesulfonate (CHAPS), 20 mM Tris-HCl, and 20 mM dithiothreitol), then vortexed for 30 s and centrifuged at 15,000× g rpm for 10 min at 4 °C. The supernatant was further centrifuged at 15,000× g rpm for 30 min. Approximately 250 µL of the supernatant was taken as the crude protein solution and stored in a freezer at −80 °C. For further precipitation by trichloroacetic acid (TCA)/acetone [64], 80 µL of crude protein solution was suspended in 5 mL of cold TCA/acetone (10% TCA, 0.07% β-Mercaptoethanol (ME) in acetone) and mixed for 30 s, then precipitated at −20 °C for 2 h. Further, the precipitate was centrifuged at 15,000× g rpm for 15 min at 4 °C. Then, the supernatant was discarded, and the pellet washed three times with 800 µL of cold acetone and finally centrifuged at 15,000× g rpm for 15 min at 4 °C. Next, the pellet was desiccated using a vacuum dryer and stored at −80 °C. For the PEG precipitation [65], 80 µL of crude protein solution was suspended using 40% PEG solution for 30 s and then precipitated at −20 °C for 2 h. Further, the pellet was washed with 800 µL of cold acetone and desiccated, as described above. The final protein was resuspended in 80 µL of rehydration buffer (7 M urea, 2 M thiourea, 4% (w/v) CHAPS, 0.002% (w/v) bromophenol blue, 2% (v/v) Bio-Lyte, and 20 mM dithiothreitol). The concentration of the dissolved protein solution was determined according to the method of Bradford [66]. Then, the results were compared by routine SDS-PAGE test to optimize the method for protein extraction, and the extracted protein with the best quality was further separated by 2-DE for image analysis.

4.7. The 2-DE Assay and Image Analysis

Comparative 2-DE was performed using a EttanTM IPGphor apparatus (GE Healthcare, Pittsburgh, PA, USA) for isoelectric focusing (IEF; first dimension), and an EttanTM DALTsix (GE Healthcare) for the second dimension according to the manufacturer’s instructions [48] and the protocol described in a previous report [56]. For IEF, 300 µg hydrated protein was loaded on immobilized pH gradient (IPG) strips (18 cm length, pH 3.0–10.0). The following IEF steps were used: 500 V for 1 h, 1000 V for 1 h, 4000 V for 1 h, 8000 V for 1 h with a linear gradient, holding at 8000 V until a total of at least 40,000 Vh was reached, then holding at 500 V for 20 h. After the strips were balanced twice, the second dimension was performed with 12% SDS-PAGE gel, and the total proteins were stained before further analysis. The stained gel image was captured with an Image Master LabScan (GE Healthcare), and the images were analyzed using the ImageMasterTM 2D Platinum 6.0 software (GE Healthcare) for spot detection, gel matching, and statistical analysis of the spots [56]. The image analysis remains one of the most labor-intensive parts of the 2-DE approach. In brief, triplicate images from three independent gels for the WT and mutant were obtained, while the normalization of the gels was carried out by the sum of the spot densities on each gel to compare the spots. The abundance of the individual protein spots was determined as vol.%. To identify the protein spots, the silver staining method was applied to the prepared gels. Silver nitrate was added to the solution before use, and then it was quickly admixed into the dyeing tray. The tray was then covered with an opaque cloth to reduce the decomposition of the silver nitrate utilized.
After visualization by staining and gel image analysis, protein spots with at least 3-fold spot volume ratio change (p < 0.05) were excised and subjected to mass spectrometry sequence analysis combined with database comparison. Statistical comparisons were conducted using the one-way ANOVA with the Tukey’s HSD test.

4.8. MALDI-TOF Analysis and Prediction of Differential Proteins

In this study, the spots showing statistically significant changes were cut out from the preparative gels and washed twice with ultrapure water. Then, the protein spots were destained with 50% acetonitrile (ACN) in 25 mM NH4HCO3. After removing the destaining buffer, the gel pieces were lyophilized and rehydrated in 30 μL of 50 mM NH4HCO3 containing 50 ng trypsin (Promega, Madison, WI, USA) at 37 °C overnight. The supernatant of the resulting peptides was washed with 0.1% trifluoroacetic acid (TFA) in 67% ACN. Extracts were pooled and lyophilized for MS analysis. The MS spectra were obtained using an ABI 4800 MALDI-TOF/MS-MS Proteomics Analyzer (Applied Biosystems, Foster City, CA, USA) as previously described [56]. The positive ion reflector (2 kV accelerating voltage) with 1000 laser shots per spectrum and automatic data acquisition modes were used for data collection, and the TOF spectra were collected over the mass range within 800–4000 Da with a signal-to-noise ratio minimum set to 10 and a local noise window width of m/z 250. A maximum of 10 precursors per spot with a minimum signal/noise ratio of 50 were selected for data-dependent MS/MS analysis.
Then, the resultant MS and MS/MS spectra data were analyzed with the GPS Explorer software (Version 2.0, Applied Biosystems). The database search was performed on the Mascot server (http://www.matrixscience.com) by searching the NCBInr (nonredundant protein sequence) database of S. sclerotiorum (http://www.ncbi.nlm.nih.gov/) to identify the proteins. The other important parameters were set as follows trypsin cleavage, two missed cleavage allowed, carbamidomethylation set as fixed modification, oxidation of methionine allowed as variable modification, monoisotopic precursor mass, precursor ion mass tolerance set to ±100 ppm, and fragment mass tolerance set to ±0.5 Da. The protein was correctly identified if a sufficient number of peptides were matched with a high score to a protein in the database. Only the significant hits with a protein score of 100% and the highest peptide counts were recorded and analyzed. Then the predicted protein sequences that matched the sequences in the NCBInr database were further analyzed for functional category denomination [56,62]. Prediction of the signal peptide was done using the online SignalP 4.1 Server (http://www.cbs.dtu.dk/services/SignalP/).

4.9. Data Analysis

All graphs were exported by the GraphPad Prism 6 software (La Jolla, CA, USA). Statistical comparisons were done using the one-way ANOVA with the Tukey’s HSD (Honestly Significant Difference) test in the PASW Statistics 18 (SPSS Inc., Chicago, IL, USA).

5. Conclusions

In this study, we combined TCA/acetone precipitation for protein extraction, 2-DE, and peptide mass analysis to develop a fast and simple method for studying the proteomics changes of ΔSsNsd1 mutant during compound appressorium formation. In our approach the results from 2-DE gel analysis are put into a larger context by combining spot data with functional annotations to explore the SsNsd1-mediated compound appressoria formation. Visualizing results, such as differential expression, functional categories, and predicted effector proteins makes it possible to gain new insights from the data accumulated by the “omics” technologies. Thus, this system approach can be effectively used to identify important candidate proteins in response to the SsNsd1-mediated appressorium formation, but it will require subsequent, more detailed studies to determine the precise role of the differentially expressed proteins.

Author Contributions

J.L. (Jingtao Li), X.Z., and L.L. performed the experiments and analyzed the data. J.L. (Jingtao Li) wrote the manuscript. H.P. and Y.Z. conceived the study and provided funding. J.L. (Jinliang Liu) provided technical support. All authors commented on the manuscript.

Funding

This study was financially supported by the National Natural Science Foundation of China (31772108, 31471730, and 31271991) and the National Research and Development Program of China (2018YFD0201005).

Acknowledgments

We gratefully acknowledge Jeffrey A. Rollins (University of Florida) for donating the wild-type strain 1980 and the mutants. We also thank Gang Yu for manuscript proofreading and technical assistance.

Conflicts of Interest

The authors declare no conflict of interest.

References

  1. Boland, G.J.; Hall, R. Index of plant hosts of Sclerotinia sclerotiorum. Can. J. Plant Pathol. 1994, 16, 93–108. [Google Scholar] [CrossRef]
  2. Li, J.; Zhang, Y.; Zhang, Y.; Yu, P.-L.; Pan, H.; Rollins, J.A. Introduction of large sequence inserts by CRISPR-Cas9 to create pathogenicity mutants in the multinucleate filamentous pathogen Sclerotinia sclerotiorum. mBio 2018, 9, e00567-18. [Google Scholar] [CrossRef] [PubMed]
  3. Bardin, S.D.; Huang, H.C. Research on biology and control of sclerotinia diseases in Canada. Can. J. Plant Pathol. 2001, 23, 88–98. [Google Scholar] [CrossRef]
  4. Li, J.; Mu, W.; Veluchamy, S.; Liu, Y.; Zhang, Y.; Pan, H.; Rollins, J.A. The GATA-type IVb zinc-finger transcription factor SsNsd1 regulates asexual–sexual development and appressoria formation in Sclerotinia sclerotiorum. Mol. Plant Pathol. 2018, 19, 1679–1689. [Google Scholar] [CrossRef] [PubMed]
  5. Bolton, M.D.; Thomma, B.P.H.J.; Nelson, B.D. Sclerotinia sclerotiorum (Lib.) de Bary: Biology and molecular traits of a cosmopolitan pathogen. Mol. Plant Pathol. 2006, 7, 1–16. [Google Scholar] [CrossRef] [PubMed]
  6. Guimarães, R.L.; Stotz, H.U. Oxalate production by Sclerotinia sclerotiorum deregulates guard cells during infection. Plant Physiol. 2004, 136, 3703–3711. [Google Scholar] [CrossRef] [PubMed]
  7. Garg, H.; Hua, L.; Sivasithamparam, K.; Kuo, J.; Barbetti, M.J. The infection processes of Sclerotinia sclerotiorum in cotyledon tissue of a resistant and a susceptible genotype of Brassica napus. Ann. Bot. 2010, 106, 897–908. [Google Scholar] [CrossRef] [PubMed]
  8. Lumsden, R.D.; Dow, R.L. Histopathology of Sclerotinia sclerotiorum infection of bean. Phytopathology 1973, 63, 708. [Google Scholar] [CrossRef]
  9. Xiao, X.; Xie, J.; Cheng, J.; Li, G.; Yi, X.; Jiang, D.; Fu, Y. Novel secretory protein Ss-Caf1 of the plant-pathogenic fungus Sclerotinia sclerotiorum is required for host penetration and normal sclerotial development. Mol. Plant Microbe Interact. 2014, 27, 40–55. [Google Scholar] [CrossRef] [PubMed]
  10. Liang, X.; Liberti, D.; Li, M.; Kim, Y.-T.; Hutchens, A.; Wilson, R.; Rollins, J.A. Oxaloacetate acetylhydrolase gene mutants of Sclerotinia sclerotiorumdo not accumulate oxalic acid, but do produce limited lesions on host plants. Mol. Plant Pathol. 2015, 16, 559–571. [Google Scholar] [CrossRef] [PubMed]
  11. Liang, X.; Moomaw, E.W.; Rollins, J.A. Fungal oxalate decarboxylase activity contributes to Sclerotinia sclerotiorum early infection by affecting both compound appressoria development and function. Mol. Plant Pathol. 2015, 16, 825–836. [Google Scholar] [CrossRef] [PubMed]
  12. Zuppini, A.; Navazio, L.; Sella, L.; Castiglioni, J.; Favaron, F.; Mariani, P. An endopolygalacturonase from Sclerotinia sclerotiorum induces calcium-mediated signaling and programmed cell death in soybean cells. Mol. Plant Microbe Interact. 2005, 18, 849–855. [Google Scholar] [CrossRef] [PubMed]
  13. Yajima, W.; Liang, Y.; Kav, N.N.V. Gene disruption of an arabinofuranosidase/beta-xylosidase precursor decreases Sclerotinia sclerotiorum virulence on canola tissue. Mol. Plant Microbe Interact. 2009, 22, 783–789. [Google Scholar] [CrossRef] [PubMed]
  14. Zhu, W.; Wei, W.; Fu, Y.; Cheng, J.; Xie, J.; Li, G.; Yi, X.; Kang, Z.; Dickman, M.B.; Jiang, D. A secretory protein of necrotrophic fungus Sclerotinia sclerotiorum that suppresses host resistance. PLoS ONE 2013, 8, e53901. [Google Scholar] [CrossRef] [PubMed]
  15. Yu, Y.; Xiao, J.; Zhu, W.; Yang, Y.; Mei, J.; Bi, C.; Qian, W.; Qing, L.; Tan, W. Ss-Rhs1, a secretory Rhs repeat-containing protein, is required for the virulence of Sclerotinia sclerotiorum. Mol. Plant Pathol. 2017, 18, 1052–1061. [Google Scholar] [CrossRef] [PubMed]
  16. Li, M.; Liang, X.; Rollins, J.A. Sclerotinia sclerotiorum γ-Glutamyl transpeptidase (Ss-Ggt1) is required for regulating glutathione accumulation and development of sclerotia and compound appressoria. Mol. Plant Microbe Interact. 2012, 25, 412–420. [Google Scholar] [CrossRef] [PubMed]
  17. Jurick, W.M.; Rollins, J.A. Deletion of the adenylate cyclase (sac1) gene affects multiple developmental pathways and pathogenicity in Sclerotinia sclerotiorum. Fungal Genet. Biol. 2007, 44, 521–530. [Google Scholar] [CrossRef] [PubMed]
  18. Erental, A.; Harel, A.; Yarden, O. Type 2A phosphoprotein phosphatase is required for asexual development and pathogenesis of Sclerotinia sclerotiorum. Mol. Plant Microbe Interact. 2007, 20, 944–954. [Google Scholar] [CrossRef] [PubMed]
  19. Schumacher, J.; Simon, A.; Cohrs, K.C.; Viaud, M.; Tudzynski, P. The transcription factor BcLTF1 regulates virulence and light responses in the necrotrophic plant pathogen Botrytis cinerea. PLoS Genet. 2014, 10, e1004040. [Google Scholar] [CrossRef] [PubMed]
  20. Berth, M.; Moser, F.M.; Kolbe, M.; Bernhardt, J. The state of the art in the analysis of two-dimensional gel electrophoresis images. Appl. Microbiol. Biotechnol. 2007, 76, 1223–1243. [Google Scholar] [CrossRef] [PubMed]
  21. Pandey, A.; Mann, M. Proteomics to study genes and genomes. Nature 2000, 405, 837. [Google Scholar] [CrossRef] [PubMed]
  22. Michael, F.; Peter, B.; Hanno, L.; Laura, S. The rat liver mitochondrial proteins. Electrophoresis 2002, 23, 311–328. [Google Scholar]
  23. Mayer, K.; Albrecht, S.; Schaller, A. Targeted Analysis of Protein Phosphorylation by 2D Electrophoresis. In Plant Phosphoproteomics: Methods and Protocols; Schulze, W.X., Ed.; Springer: New York, NY, USA, 2015; pp. 167–176. [Google Scholar]
  24. Makrantoni, V.; Antrobus, R.; Botting, C.H.; Coote, P.J. Rapid enrichment and analysis of yeast phosphoproteins using affinity chromatography, 2D-PAGE and peptide mass fingerprinting. Yeast 2005, 22, 401–414. [Google Scholar] [CrossRef] [PubMed] [Green Version]
  25. Voedisch, M.; Scherlach, K.; Winkler, R.; Hertweck, C.; Horn, U.; Brakhage, A.A.; Kniemeyer, O. Characterisation of the hypoxic response of the human-pathogenic fungus Aspergillus fumigatus by 2D-gel electrophoresis. Infection 2009, 37, 19. [Google Scholar]
  26. Zakharova, K.; Sterflinger, K.; Razzazi-Fazeli, E.; Noebauer, K.; Marzban, G. Global proteomics of the extremophile black fungus Cryomyces antarcticus using 2D-electrophoresis. Nat. Sci. 2014, 6, 978–995. [Google Scholar]
  27. Dharmasiri, S.; Harrington, H.M.; Dharmasiri, N. Heat shock modulates phosphorylation status and activity of nucleoside diphosphate kinase in cultured sugarcane cells. Plant Cell Rep. 2010, 29, 1305–1314. [Google Scholar] [CrossRef] [PubMed]
  28. Shen, Y.; Han, Y.-J.; Kim, J.-I.; Song, P.-S. Arabidopsis nucleoside diphosphate kinase-2 as a plant GTPase activating protein. BMB Rep. 2008, 41, 645–650. [Google Scholar] [CrossRef] [PubMed] [Green Version]
  29. Hetmann, A.; Kowalczyk, S. Nucleoside diphosphate kinase isoforms regulated by phytochrome A isolated from oat coleoptiles. Acta Biochim. Pol. 2009, 56, 143–153. [Google Scholar] [PubMed]
  30. Wang, X.-L.; Cai, H.-P.; Ge, J.-H.; Su, X.-F. Detection of eukaryotic translation initiation factor 4E and its clinical significance in hepatocellular carcinoma. World J. Gastroenterol. 2012, 18, 2540–2544. [Google Scholar] [CrossRef] [PubMed]
  31. Xu, G.-D.; Shi, X.-B.; Sun, L.-B.; Zhou, Q.-Y.; Zheng, D.-W.; Shi, H.-S.; Che, Y.-L.; Wang, Z.-S.; Shao, G.-F. Down-regulation of eIF5A-2 prevents epithelial-mesenchymal transition in non-small-cell lung cancer cells. J. Zhejiang Univ. Sci. B 2013, 14, 460–467. [Google Scholar] [CrossRef] [PubMed] [Green Version]
  32. Achilonu, I.; Elebo, N.; Hlabano, B.; Owen, G.R.; Papathanasopoulos, M.; Dirr, H.W. An update on the biophysical character of the human eukaryotic elongation factor 1 beta: Perspectives from interaction with elongation factor 1 gamma. J. Mol. Recognit. 2018, 31, e2708. [Google Scholar] [CrossRef] [PubMed]
  33. Dai, M.-S.; Sun, X.-X.; Lu, H. Ribosomal protein L11 associates with c-Myc at 5 S rRNA and tRNA genes and regulates their expression. J. Biol. Chem. 2010, 285, 12587–12594. [Google Scholar] [CrossRef] [PubMed]
  34. Cushman, I.; Bowman, B.R.; Sowa, M.E.; Lichtarge, O.; Quiocho, F.A.; Moore, M.S. Computational and biochemical identification of a nuclear pore complex binding site on the nuclear transport carrier NTF2. J. Mol. Biol. 2004, 344, 303–310. [Google Scholar] [CrossRef] [PubMed]
  35. De Boor, S.; Knyphausen, P.; Kuhlmann, N.; Wroblowski, S.; Brenig, J.; Scislowski, L.; Baldus, L.; Nolte, H.; Krüger, M.; Lammers, M. Small GTP-binding protein Ran is regulated by posttranslational lysine acetylation. Proc. Natl. Acad. Sci. USA 2015, 112, E3679–E3688. [Google Scholar] [CrossRef] [PubMed]
  36. Uben. Ubiquitin-conjugating Enzyme, E2. In Encyclopedic Reference of Cancer; Schwab, M., Ed.; Springer: Berlin/Heidelberg, Germany, 2001; p. 942. [Google Scholar]
  37. Takayama, Y.; Mamnun, Y.M.; Trickey, M.; Dhut, S.; Masuda, F.; Yamano, H.; Toda, T.; Saitoh, S. Hsk1- and SCFPof3-dependent proteolysis of S. pombe Ams2 ensures histone homeostasis and centromere function. Dev. Cell 2010, 18, 385–396. [Google Scholar] [CrossRef] [PubMed]
  38. Velazquez, H.A.; Hamelberg, D. Conformational selection in the recognition of phosphorylated substrates by the catalytic domain of human Pin1. Biochemistry 2011, 50, 9605–9615. [Google Scholar] [CrossRef] [PubMed]
  39. Liou, Y.-C.; Zhou, X.Z.; Lu, K.P. Prolyl isomerase Pin1 as a molecular switch to determine the fate of phosphoproteins. Trends Biochem. Sci. 2011, 36, 501–514. [Google Scholar] [CrossRef] [PubMed] [Green Version]
  40. Wiegand, A.; Remington, S.J. Citrate synthase: Structure, control, and mechanism. Annu. Rev. Biophys. Biophys. Chem. 1986, 15, 97–117. [Google Scholar] [CrossRef] [PubMed]
  41. Quispe, C.F. GATA-Family Transcription Factors in Magnaporthe oryzae. Master’s Thesis, University of Nebraska-Lincoln, Lincoln, NE, USA, 2011. [Google Scholar]
  42. Liu, L.; Wang, Q.; Sun, Y.; Zhang, Y.; Zhang, X.; Liu, J.; Yu, G.; Pan, H. Sssfh1, a gene encoding a putative component of the RSC chromatin remodeling complex, is involved in hyphal growth, reactive oxygen species accumulation, and pathogenicity in Sclerotinia sclerotiorum. Front. Microbiol. 2018, 9. [Google Scholar] [CrossRef] [PubMed]
  43. Tsitsigiannis, D.I.; Kowieski, T.M.; Zarnowski, R.; Keller, N.P. Endogenous lipogenic regulators of spore balance in Aspergillus nidulans. Eukaryot. Cell 2004, 3, 1398–1411. [Google Scholar] [CrossRef] [PubMed]
  44. Han, K.-H.; Han, K.-Y.; Yu, J.-H.; Chae, K.-S.; Jahng, K.-Y.; Han, D.-M. The nsdD gene encodes a putative GATA-type transcription factor necessary for sexual development of Aspergillus nidulans. Mol. Microbiol. 2001, 41, 299–309. [Google Scholar] [CrossRef] [PubMed]
  45. Lee, M.-K.; Kwon, N.-J.; Lee, I.-S.; Jung, S.; Kim, S.-C.; Yu, J.-H. Negative regulation and developmental competence in Aspergillus. Sci. Rep. 2016, 6, 28874. [Google Scholar] [CrossRef] [PubMed]
  46. Weiss, W.; Görg, A. High-resolution two-dimensional electrophoresis. Methods Mol. Biol. 2009, 564, 13–32. [Google Scholar] [PubMed]
  47. Weiss, W.; Görg, A. Two-dimensional electrophoresis for plant proteomics. Methods Mol. Biol. 2007, 355, 121–143. [Google Scholar] [PubMed]
  48. Görg, A.; Weiss, W.; Dunn, M.J. Current two-dimensional electrophoresis technology for proteomics. Proteomics 2004, 4, 3665–3685. [Google Scholar] [CrossRef] [PubMed]
  49. Görg, A.; Weiss, W. Two-Dimensional Electrophoresis with Immobilized pH Gradients. In Proteome Research: Two-Dimensional Gel Electrophoresis and Identification Methods; Rabilloud, T., Ed.; Springer: Berlin/Heidelberg, Germany, 2000; pp. 57–106. [Google Scholar]
  50. Yu, Z.; Dan, H.; Wang, S. Comparison of methods for extraction of protein secreted from Aspergillus fumigatus. Chin. J. Biol. 2010, 23, 313–316. [Google Scholar]
  51. Smith, R. Two-Dimensional Electrophoresis: An Overview. In Two-Dimensional Electrophoresis Protocols; Tyther, R., Sheehan, D., Eds.; Humana Press: Totowa, NJ, USA, 2009; pp. 2–17. [Google Scholar]
  52. Pedreschi, R.; Hertog, M.L.; Carpentier, S.C.; Lammertyn, J.; Robben, J.; Noben, J.P.; Panis, B.; Swennen, R.; Nicolaï, B.M. Treatment of missing values for multivariate statistical analysis of gel-based proteomics data. Proteomics 2008, 8, 1371–1383. [Google Scholar] [CrossRef] [PubMed]
  53. Boyle, W.J.; van der Geer, P.; Hunter, T. Phosphopeptide mapping and phosphoamino acid analysis by two-dimensional separation on thin-layer cellulose plates. Methods Enzymol. 1991, 201, 110–149. [Google Scholar] [PubMed]
  54. Mann, M.; Jensen, O.N. Proteomic analysis of post-translational modifications. Nat. Biotechnol. 2003, 21, 255. [Google Scholar] [CrossRef] [PubMed]
  55. Schulze, W.X. Proteomics approaches to understand protein phosphorylation in pathway modulation. Curr. Opin. Plant Biol. 2010, 13, 279–286. [Google Scholar] [CrossRef] [PubMed]
  56. Zhang, X.; Fu, J.; Hiromasa, Y.; Pan, H.; Bai, G. Differentially expressed proteins associated with fusarium head blight resistance in wheat. PLoS ONE 2013, 8, e82079. [Google Scholar] [CrossRef] [PubMed]
  57. Kishimoto, M.; Tatsumi, Y.; Tamesui, N.; Kumada, Y.; Horiuchi, J.I.; Okumura, K. Dynamic analysis of the silver staining gel image of 2-DE for protein spots segmentation. J. Electrophor. 2010, 54, 1–7. [Google Scholar] [CrossRef] [Green Version]
  58. Li, J.; Yu, G.; Sun, X.; Zhang, X.; Liu, J.; Pan, H. AcEBP1, an ErbB3-Binding Protein (EBP1) from halophyte Atriplex canescens, negatively regulates cell growth and stress responses in Arabidopsis. Plant Sci. 2016, 248, 64–74. [Google Scholar] [CrossRef] [PubMed]
  59. Teakle, G.R.; Gilmartin, P.M. Two forms of type IV zinc-finger motif and their kingdom-specific distribution between the flora, fauna and fungi. Trends Biochem. Sci. 1998, 23, 100–102. [Google Scholar] [CrossRef]
  60. Reyes, J.C.; Muro-Pastor, M.I.; Florencio, F.J. The GATA family of transcription factors in Arabidopsis and rice. Plant Physiol. 2004, 134, 1718–1732. [Google Scholar] [CrossRef] [PubMed]
  61. Yuan, J.-B.; Zhang, X.-J.; Liu, C.-Z.; Wei, J.-K.; Li, F.-H.; Xiang, J.-H. Horizontally transferred genes in the genome of pacific white shrimp, Litopenaeus vannamei. BMC Evol. Biol. 2013, 13, 165. [Google Scholar] [CrossRef] [PubMed]
  62. Li, J.; Sun, X.; Yu, G.; Jia, C.; Liu, J.; Pan, H. Generation and analysis of expressed sequence tags (ESTs) from halophyte Atriplex canescens to explore salt-responsive related genes. Int. J. Mol. Sci. 2014, 15, 11172–11189. [Google Scholar] [CrossRef] [PubMed]
  63. Papura, D.; Jacquot, E.; Dedryver, C.A.; Luche, S.; Riault, G.; Bossis, M.; Rabilloud, T. Two-dimensional electrophoresis of proteins discriminates aphid clones of Sitobion avenae differing in BYDV-PAV transmission. Arch. Virol. 2002, 147, 1881–1898. [Google Scholar] [CrossRef] [PubMed]
  64. Méchin, V.; Damerval, C.; Zivy, M. Total protein extraction with TCA-acetone. Methods Mol. Biol. 2007, 355, 1–8. [Google Scholar] [PubMed]
  65. Sim, S.-L.; He, T.; Tscheliessnig, A.; Mueller, M.; Tan, R.B.H.; Jungbauer, A. Protein precipitation by polyethylene glycol: A generalized model based on hydrodynamic radius. J. Biotechnol. 2012, 157, 315–319. [Google Scholar] [CrossRef] [PubMed]
  66. Bradford, M.M. A rapid and sensitive method for the quantitation of microgram quantities of protein utilizing the principle of protein-dye binding. Anal. Biochem. 1976, 72, 248–254. [Google Scholar] [CrossRef]
Figure 1. Phylogenetic analysis and transcription expression of SsNsd1 and other proteins containing GATA-type DNA domains in S. sclerotiorum. (A) Phylogenetic analysis of the amino acid sequences of SsNsd1 (SS1G_10366) and other GATA-type proteins in pathogenic fungi (S. sclerotiorum, B. cinerea, F. oxysporum, M. oryzae, and A. oryzae). A phylogenetic tree was generated by MAGE using the neighbor-joining method. The nine GATA-type proteins were separated by using a different branch color. (B) Hierarchical cluster of GATA-type genes and two histone genes in transcript abundance from three developments stages (hyphae, sclerotia, and apothecia) of S. sclerotiorum. Each gene is represented by a single row of colored boxes, and a single column indicates different development stages. The gene transcription abundance was evaluated by the fragments per kilobase of exon per million mapped fragments (FPKM) value. (C) The transcription level of SsNsd1, Histone H2A, and Histone H3 genes at the hyphae developmental stage. The expression level of SsNsd1 gene was significantly different from those of the histone genes (n = 3; ** p < 0.01).
Ijms 19 02946 g001
Figure 2. The defective compound appressoria of ΔSsNsd1 mutant strain led to a loss of penetration into unwounded onion tissue. (A) Pigmented compound appressoria of wild type (WT) were observed on parafilm. Pictures were taken four days after transfer (DAT) of 5-mm-diameter mycelial plugs to parafilm. (B) Penetration assays with the WT on onion epidermal strips. Invasion mycelium (penetration) of WT strain on onion epidermal strips was observed by light microscopy two days after inoculation (DAI). (C) Penetration assays with the ΔSsNsd1 strain on onion epidermal strips at 2 DAI. No invasion mycelium was observed on onion epidermal strips inoculated by ΔSsNsd1 strain. (D) Penetration assays with the WT and the ΔSsNsd1 mutant on onion epidermal strips at 4 DAI.
Ijms 19 02946 g002
Figure 3. Schematic diagram illustrating the process of identifying the changes of proteomics between the ΔSsNsd1 mutant and wild type (WT) during the compound appressorium formation. Generally, tissue samples with different phenotypes were subjected to protein extraction and SDS-PAGE test. Then the proteomics profiles were analyzed by two-dimensional gel electrophoresis (2-DE) to obtain the differential expression spots, which were further identified by mass spectrometry (MS) of the peptides and bioinformatics analyses (2-DE, two-dimensional gel electrophoresis; IEF, isoelectric focusing; SDS-PAGE, sodium dodecyl sulfate polyacrylamide gel electrophoresis).
Ijms 19 02946 g003
Figure 4. Protein extraction and SDS-PAGE test of accumulated compound appressoria tissue induced on cellophane. (A) Induction assay for compound appressoria development on potato dextrose agar (PDA) overlaid with cellophane at 3 DAI. (B) Quantification of protein concentration, which was enriched by three different extraction methods: lysate, trichloroacetic acid (TCA)/acetone precipitation, and polyethylene glycol PEG method (n = 3; ** p < 0.01). (C) Quality detection of proteomics by SDS-PAGE to optimize the method for protein extraction.
Ijms 19 02946 g004
Figure 5. Silver nitrate-stained 2-DE gel image of the WT and ΔSsNsd1 strains. The proteins were extracted from the accumulated compound appressoria tissue induced by cellophane. The numbers and arrows correspond to the identified differential expression proteins (≥3-fold change) for further MS analysis of the peptides.
Ijms 19 02946 g005
Figure 6. Analysis and evaluation of differentially expressed proteins. (A) Differential expression analysis of the identified protein spots in the ΔSsNsd1 mutant compared to the WT strain. (B) Functional categories of differential expression proteins after MS identification and functional annotation. The percentage corresponds to the proportion of the annotated proteins in the classification. (C) The population distribution of the protein size evaluated by the amino acid count of the predicted proteins. (D) The signal peptide was predicted by running amino acid sequences of predicted hypothetical proteins on the SignalP server.
Ijms 19 02946 g006
Table 1. List of the differential expression proteins identified as function known proteins.
Spot aProtein Name bLocus cAccession No. dScore ePM fCov g
01↓nucleoside diphosphate kinasegi/156063126XP_001597486.1360644
03↓nuclear transport factor 2gi/156052963XP_001592408.1364434
04↓60 s ribosomal protein L23gi/154703604EDO03343.185647
08↓ubiquitin-conjugating enzyme E2gi/156042748XP_001587931.1141548
09↓nucleoside diphosphate kinasegi/156063126XP_001597485.1130874
12↓peptidyl-prolyl cis-trans isomerasegi/156054872XP_001593362.1532953
16↓peptidyl-prolyl cis-trans isomerase Bgi/156042834XP_001587974.15831037
17↓nucleoside diphosphate kinasegi/156063126XP_001597485.1281539
18↓eukaryotic translation initiation
factor 5A-1
gi/156063512XP_001597678.197244
25↓peptidyl-prolyl cis-trans isomerasegi/156054872XP_001593362.16201257
26↓elongation factor 1-betagi/156053087XP_001592470.1107231
28↓60 s ribosomal protein L23gi/154703604EDO03343.159262
29↑peptidyl-prolyl cis-trans isomerase gi/156054872XP_001593362.1406846
30↓GTP-binding nuclear protein
GSP1/Ran
gi/156057585XP_001594716.1215747
32-SCF complex subunit Skp1gi/156065065XP_001598454.16031369
35↓citrate synthase, mitochondrial precursorgi/156063018XP_001597431.1104942
39↓peptidyl-prolyl cis-trans isomerasegi/156054872XP_001593362.14981151
a: The number of identified protein spots was showed on the two-dimensional gel electrophoresis (2-DE) image; The identified function known proteins were shown in this table; b: Protein name searched by locus tag in NCBI result; c: Locus tag number in NCBI annotation; d: Accession number in NCBI; e: Mascot score (threshold score > 50); f: Peptide count; g: Percent sequence coverage (%); ↓: expression level of proteins was down-regulated in the mutant; ↑: expression level of protein was up-regulated in the mutant; -: protein spot was disappeared in the mutant.
Table 2. List of the differential expression proteins identified as hypothetical proteins.
Spot aProtein Name bLocus cAccession No. dScore ePM fSignalP g
02↓hypothetical proteinsSS1G_05791gi|1560538864126No
05-hypothetical proteinsSS1G_08534gi|1560496551475No
06↓hypothetical proteinsSS1G_02967gi|156061643109016Yes
10↓hypothetical proteinsSS1G_13380gi|1560333203297No
11↓hypothetical proteinsSS1G_10490gi|1560447721365No
14↑hypothetical proteinsSS1G_05792gi|1560538884046No
15↓hypothetical proteinsSS1G_03527gi|156059030583No
19↓hypothetical proteinsSS1G_03843gi|15605966254510No
20↓hypothetical proteinsSS1G_06246gi|1560547961434No
21↓hypothetical proteinsSS1G_06246gi|15605479665810No
22↓hypothetical proteinsSS1G_11818gi|156039363104014Yes
24↑hypothetical proteinsSS1G_04923gi|1560551441995Yes
27-hypothetical proteinsSS1G_09167gi|156045782467No
31↓hypothetical proteinsSS1G_02387gi|1560604972375No
33↓hypothetical proteinsSS1G_06394gi|1560524573894No
34↓hypothetical proteinsSS1G_02266gi|156060255151032Yes
36↑hypothetical proteinsSS1G_03994gi|156056527615No
37↓hypothetical proteinsSS1G_12818gi|1560362603838No
38↓hypothetical proteinsSS1G_14285gi|1560310094918No
40↓hypothetical proteinsSS1G_03527gi|15605903042111No
41↑hypothetical proteinsSS1G_08260gi|156049107572No
42↑hypothetical proteinsSS1G_06959gi|1560511041554No
43-hypothetical proteinsSS1G_06561gi|1560527871863No
a: The number of identified protein spots was showed on the 2-DE gel image; The hypothetical proteins were shown in this table; b: Protein name searched by locus tag in NCBI result; c: Locus tag number in NCBI annotation; d: Accession number in NCBI; e: Mascot score (threshold score > 50); f: Peptide count; g: Signal peptide predicted (Yes or No); ↓: expression level of protein was down-regulated in the mutant; ↑: expression level of protein was up-regulated in the mutant; -: protein spot was disappeared in the mutant.

