Article

Chlorophyll Composition, Chlorophyll Fluorescence, and Grain Yield Change in esl Mutant Rice

1
College of Life Sciences, Fujian Agriculture and Forestry University, Fuzhou 350002, China
2
College of Crop Science, Fujian Agriculture and Forestry University, Fuzhou 350002, China
3
Institute of Crop Science, College of Agriculture and Biotechnology, Zhejiang University, Hangzhou 310058, China
*
Author to whom correspondence should be addressed.
Int. J. Mol. Sci. 2018, 19(10), 2945; https://doi.org/10.3390/ijms19102945
Submission received: 16 September 2018 / Revised: 24 September 2018 / Accepted: 25 September 2018 / Published: 27 September 2018
(This article belongs to the Section Molecular Plant Sciences)

Abstract

:
To evaluate the effect of changes in chlorophyll (Chl) composition and fluorescence on final yield formation, early senescence leaf (esl) mutant rice and its wild-type cultivar were employed to investigate the genotype-dependent differences in Chl composition, Chl fluorescence, and yield characteristics during the grain-filling stage. However, the temporal expression patterns of key genes involved in the photosystem II (PSII) reaction center in the leaves of two rice genotypes were analyzed by quantitative real-time polymerase chain reaction (qRT-PCR). Results showed that the seed-setting rate, 1000-grain weight, and yield per plant remarkably decreased, and the increase in the 1000-grain weight during the grain-filling stage was retarded in esl mutant rice. Chl composition, maximal fluorescence yield (Fm), variable fluorescence (Fv), a maximal quantum yield of PSII photochemistry (Fv/Fm), and net photosynthetic rate (Pn) in esl mutant rice considerably decreased, thereby indicating the weakened abilities of light energy harvesting and transferring in senescent leaves. The esl mutant rice showed an increase in the minimal fluorescence yield (F0) and 1 − Fv/Fm and decreases in the expression levels of light-harvesting Chl a/b binding protein (Cab) and photosystem II binding protein A (PsbA), PsbB, PsbC, and PsbD encoding for the reaction center of the PSII complex during the grain-filling stage. These results indicated the PSII reaction centers were severely damaged in the mesophyll cells of senescent leaves, which resulted in the weakened harvesting quantum photon and transferring light energy to PSI and PSII for carbon dioxide assimilation, leading to enhanced heat dissipation of light energy and a decrease in Pn.

Graphical Abstract

1. Introduction

As a staple food, rice (Oryza sativa L.) is one of the most important cereal crops in the world because it feeds nearly a half of the world’s population, especially in Asia [1]. Rice grain yield is highly dependent on the photosynthetic assimilation of leaves during the grain-filling stage. Previous studies have shown that 60% to 80% of nutrients required for rice grain filling are contributed by the photosynthesis of source leaves during the grain-filling period [2,3]. The rest of the nutrients are made up of remobilized carbohydrates that are temporarily stored in culms and leaf sheaths before the heading stage [4]. The photosynthetic intensity and durability of the source leaves are essential for grain filling in the rice plant. Maintaining the vitality of functional rice leaves during the grain-filling stage guarantees carbohydrate synthesis and increased yield [5]. The final grain yield can increase by 1% if the leaf lifespan can be prolonged for 1 day during the grain-filling stage for the rice plant [6]. However, leaf senescence is one of the main factors that restrict the yield and quality of grain in hybrid rice varieties. Leaf senescence often occurs prematurely under severe environmental stresses during the grain-filling stage. Premature leaf senescence shortens the photosynthetic duration and reduces the amount of assimilation substance that originates from photosynthesis, thereby retarding nutrient translocation from source leaves to developing grains during the grain-filling stage, resulting in incomplete grain setting, and reducing the final grain yield [7,8].
Leaf senescence is the final phase of development that culminates in the death of the cell, tissue, and organ. A positive purpose of leaf senescence is to remobilize valuable nutrients from older leaves for recycling in grain filling during the grain-filling stage [9]. However, a consequence of leaf senescence is that photosynthesis declines with the degradation of chlorophylls (Chl) and proteins involved in photosynthetic reactions, indicating a problem in the efficient operation of photosynthesis [10]. The decrease in photosynthesis is associated with the structural changes in thylakoid membranes, which are related to the disintegration of the grana and damage of the stromal thylakoids [11]. In the membranes of the thylakoids, the light-harvesting complexes consist of CP43, CP47, D1, D2 proteins, and Chl; they are mainly involved in the harvesting and transportation of light energy and play a primary role in the photosynthetic reaction [12]. During leaf senescence, the reduction of photosynthesis is associated with the breakdown of protein components and Chl content [13]. In addition, Chl fluorescence is often used in biological research as an indicator of photosynthetic regulation and plant responses to various stresses [14,15]. The fluorescence parameters are closely correlated with the function of photosystem II (PSII), and the photoinhibition of PSII is easily sensed by a reduction in the dark-adapted ratio of variable to maximum Chl fluorescence [16]. Analysis of the Chl fluorescence parameters can provide valuable information on the photosynthetic apparatus [17]. Stefanov et al. [18] found that high light stress reduces the content of pigments and efficiency of photochemical energy conversion and inhibits the maximum and effective quantum yields of PSII photochemistry, resulting in a decrease in the photochemical quenching and photosynthetic rates in two hybrid lines. During leaf senescence in wheat, the apparent quantum yield of net photosynthesis decreased; the maximal efficiency of PSII photochemistry slightly decreased and led to the down-regulation of the biological function of the PSII apparatus, followed by reduced net photosynthesis in senescent leaves [19]. Wingler et al. [20] investigated the leaf senescence of Arabidopsis and revealed that nonphotochemical quenching and minimum fluorescence (F0) increase in the tips of inner rosette leaves during the early stage of leaf senescence. However, little is known regarding the involvement of pigment composition and Chl fluorescence parameters in the leaf senescence of rice plants during the grain-filling stage. In addition, the changing mechanism of the core components of the PSII reaction center has yet to be elucidated during leaf senescence.
Therefore, the current study aimed to evaluate the changes in Chl composition and fluorescence and compare the genotype-dependent differences in the efficiency of the photosynthetic apparatus in the leaves of early senescence leaf (esl) mutant and its corresponding wild-type cultivar during the grain-filling stage. The genotype-dependent differences in the temporal expression patterns of key genes involved in the PSII core reaction center in the leaves were analyzed by quantitative real-time polymerase chain reaction (qRT–PCR).

2. Results

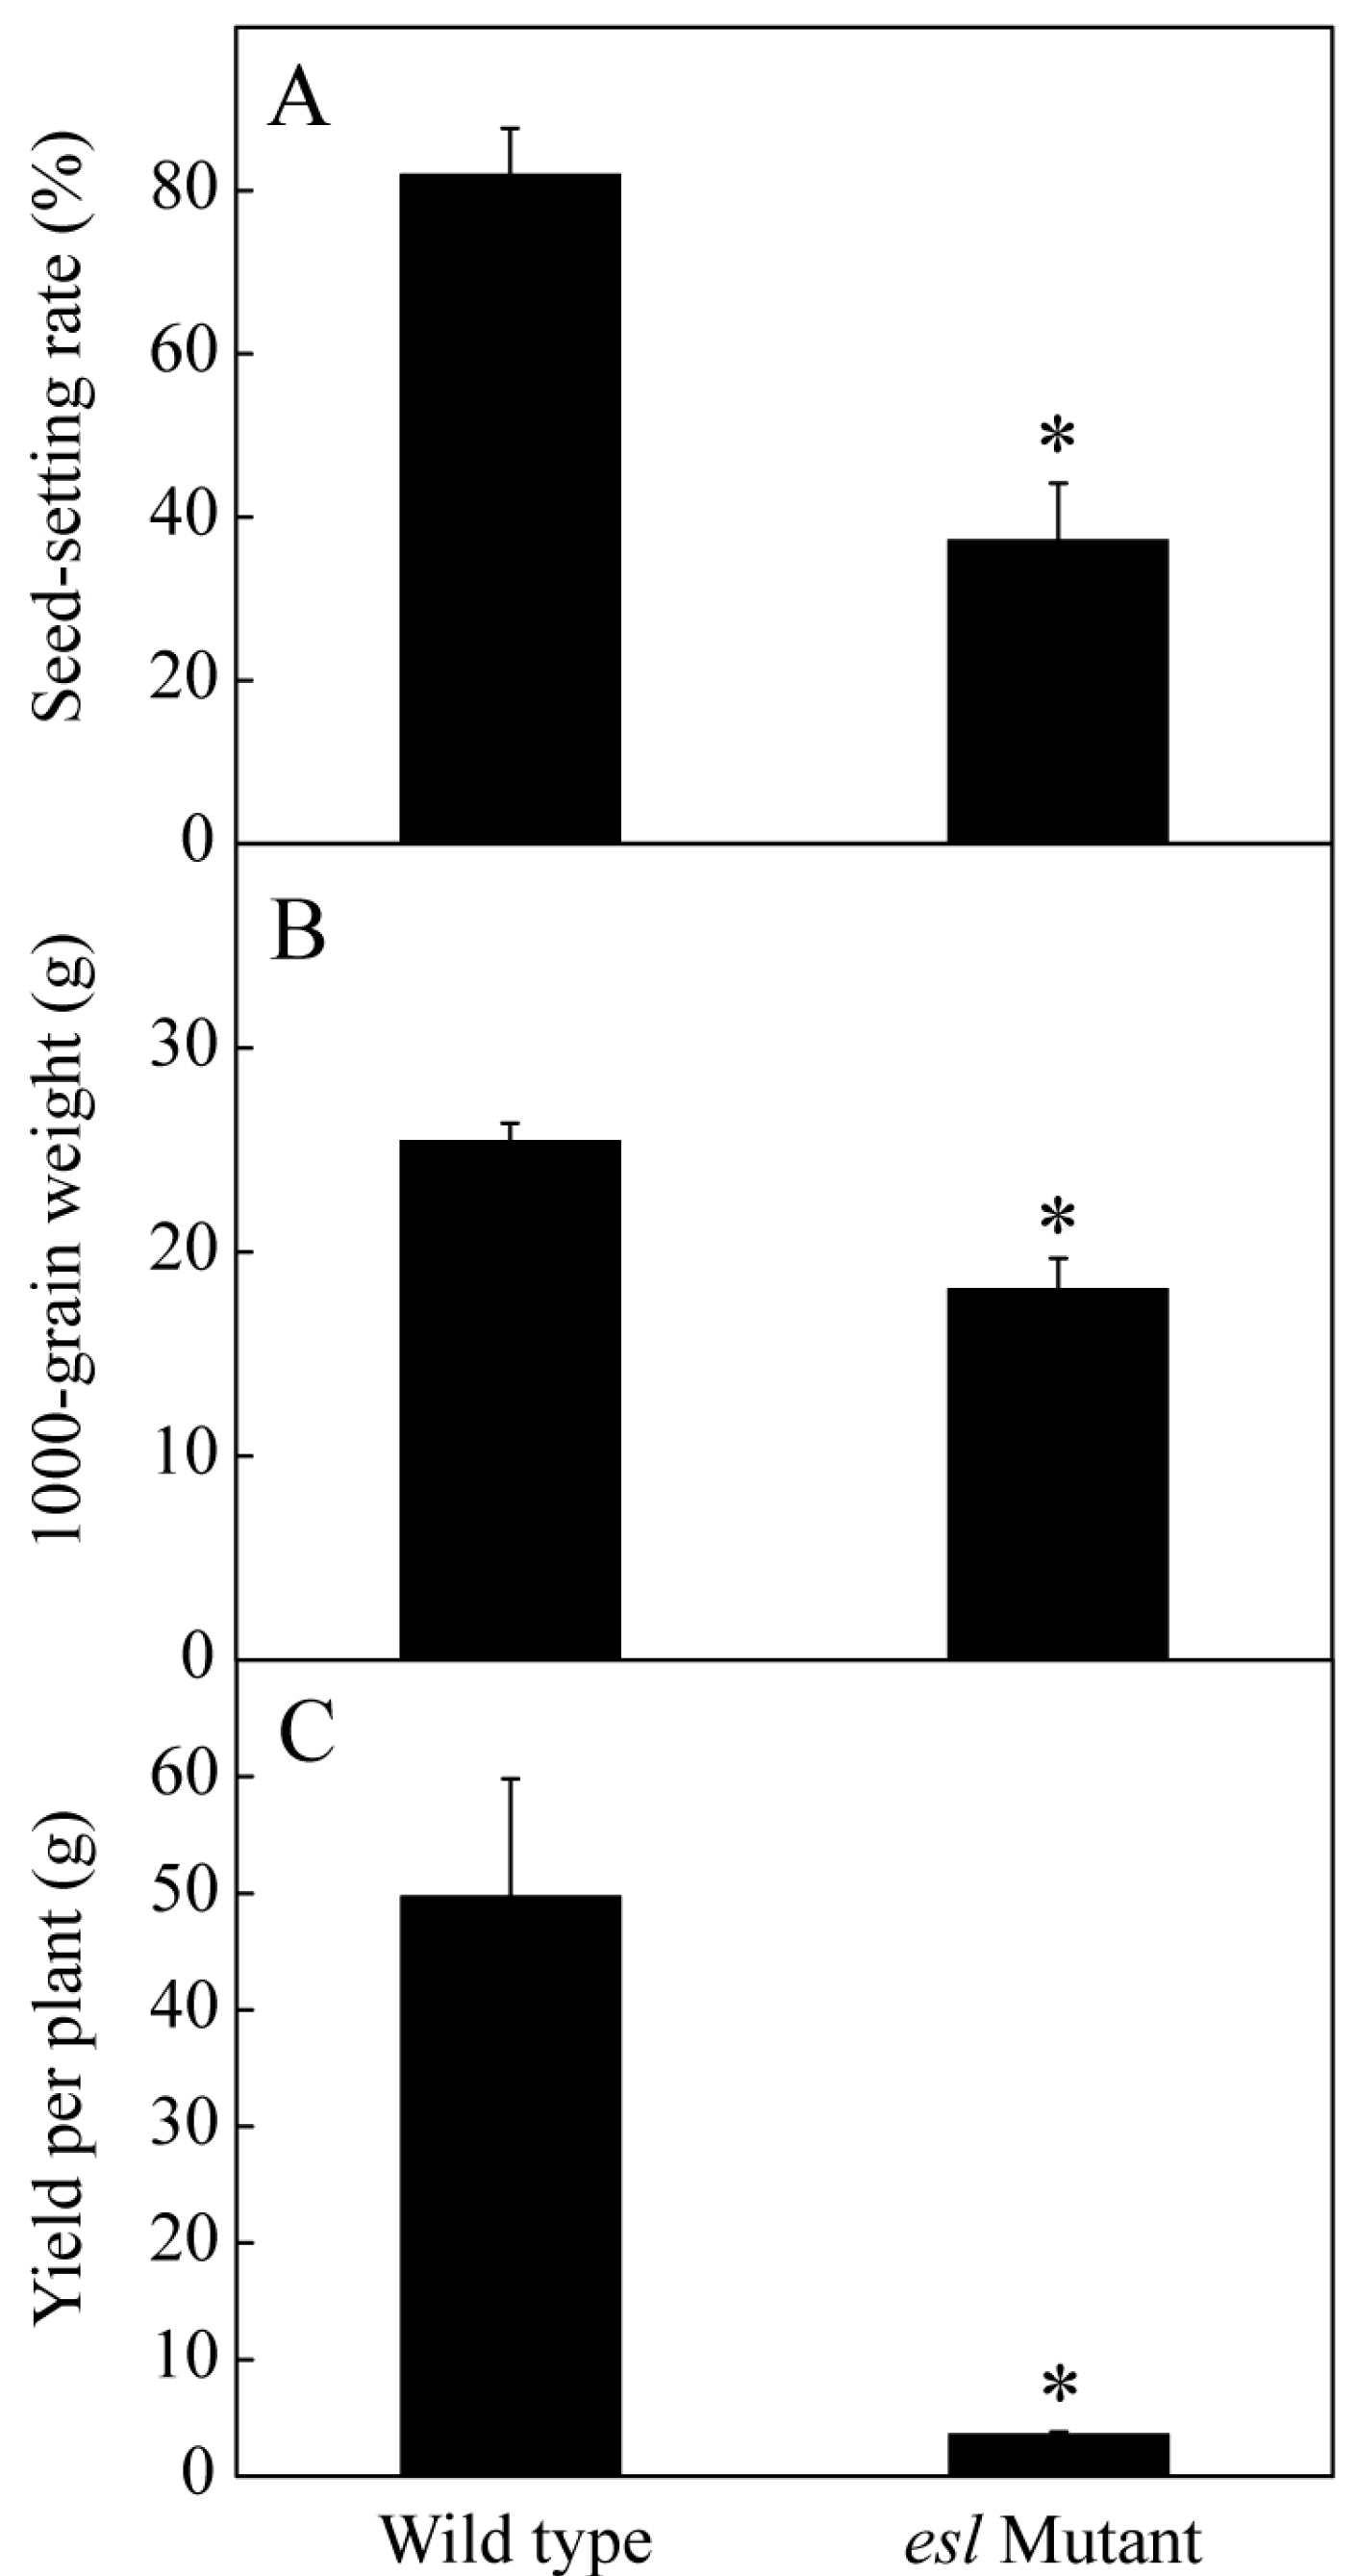
2.1. Genotype-Dependent Differences in the Yield Properties and Grain Filling

To compare the genotype-dependent differences in the yield properties, the seed-setting rate, 1000-grain weight, and grain yield per plant were investigated for the esl mutant rice and its wild-type after harvesting. Figure 1 shows a significant difference between the two rice genotypes for the three properties. The seed-setting rate of the esl mutant rice was only 37%, which was significantly lower than that of the wild-type (82%; Figure 1A). The 1000-grain weight of the esl mutant rice was 17 g, which was also lower than that of the wild-type (nearly 25 g; Figure 1B). In addition, the esl mutant rice achieved 3.6 g of grain yield for each plant and showed a considerably reduced yield compared with the wild-type (49.7 g; Figure 1C). These results suggested that the yield properties of the esl mutant rice deteriorated. The dynamic changes in the 1000-grain weight during the entire grain-filling stage showed that the 1000-grain weight increased slowly for the esl mutant rice but increased rapidly for the wild-type. Moreover, the 1000-grain weight of the esl mutant rice was significantly lower than that of the wild-type after 7 days of grain filling (Figure 2). This result suggested the decelerating grain-fitting rate and weakening seed-setting rate in the esl mutant rice.

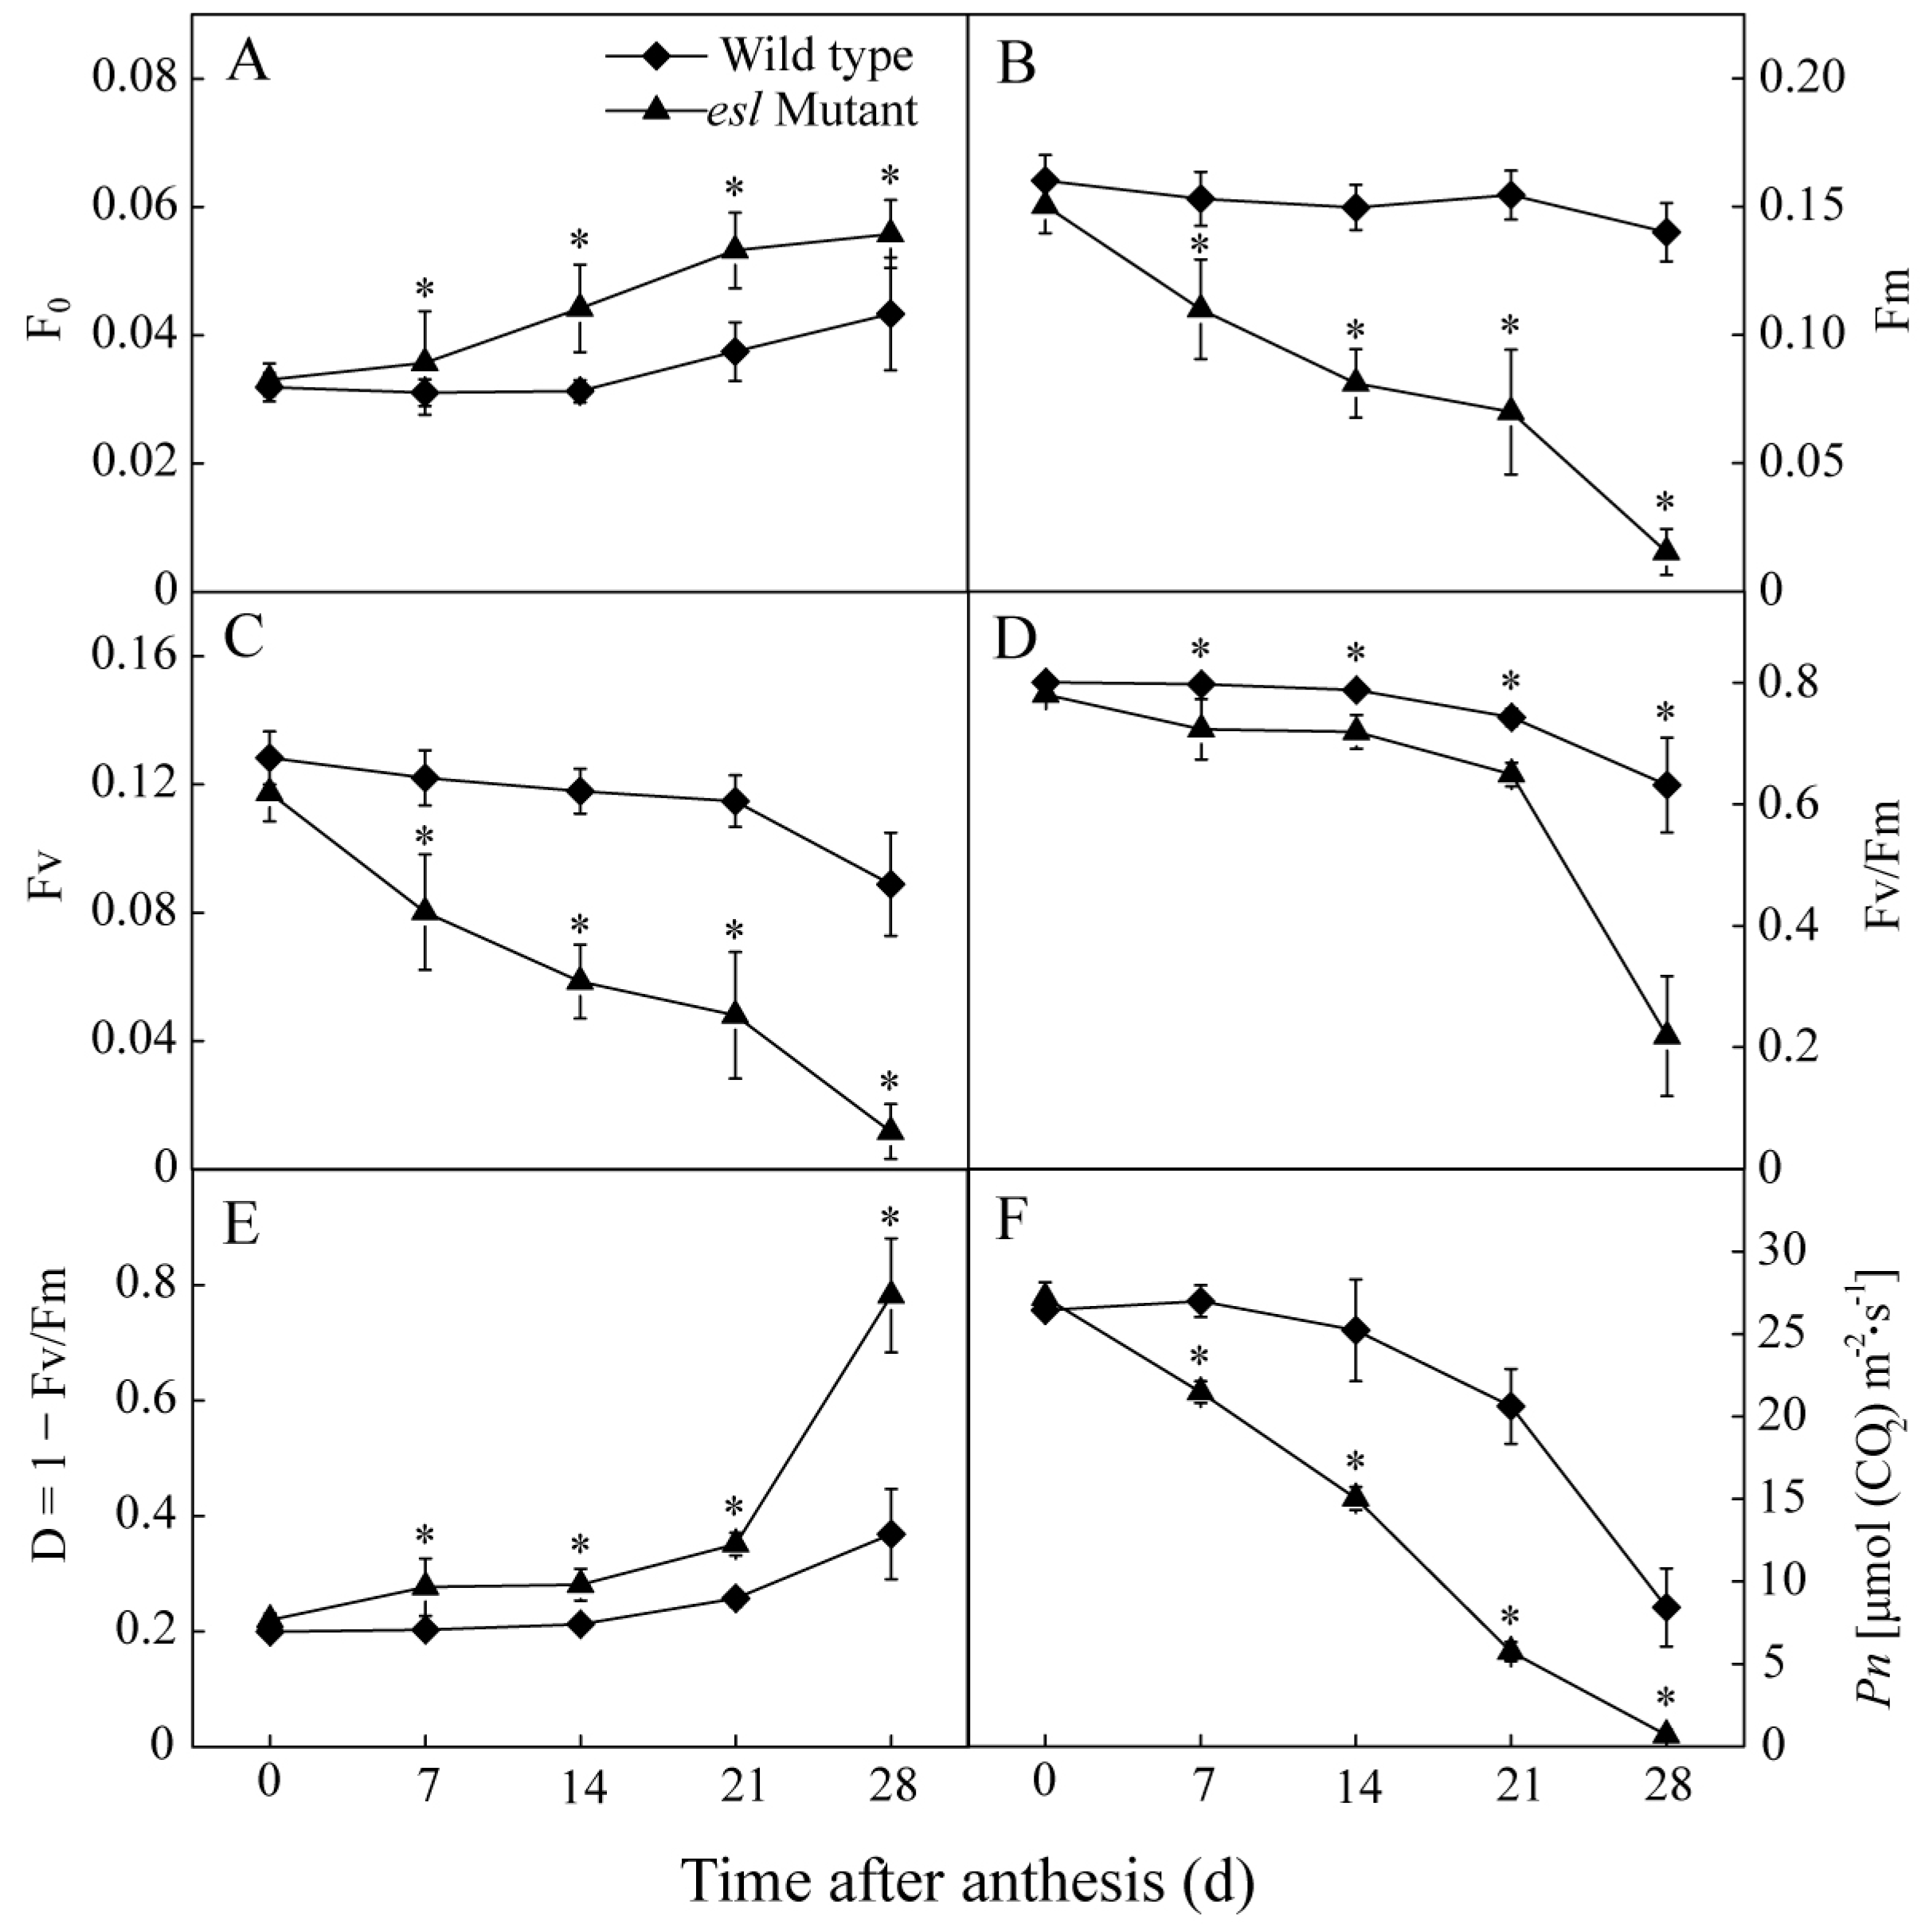
2.2. Genotype-Dependent Differences in Leaf Characteristics and Photosynthetic Performance during the Grain-Filling Stage

As the most important source organ, the flag leaf plays an essential role in grain filling during the grain-filling stage. The genotype-dependent differences in the flag leaf length, width, dry weight, and relative water content were investigated at the heading stage. Figure 3 shows no significant differences in the traits between the two rice genotypes. However, significant differences in Chl parameters were detected between the two rice genotypes (Figure 4). The contents of Chl a and b and the total Chl content in the esl mutant rice leaves rapidly decreased and were significantly lower than those of the wild-type rice leaves during the grain-filling stage (Figure 4A,B,D). The Chl a/b value in the esl mutant rice leaves showed a linear decline and was significantly lower than that of the wild-type rice leaves (Figure 4C), thereby suggesting that degradation of Chl a was greater than that of Chl b in the esl mutant rice leaves.
In addition, the photosynthetic performance was assessed by determining the Chl fluorescence parameters and net photosynthesis rate. Figure 5 shows that F0 in the esl mutant rice leaves increased gradually and became higher than that of the wild-type leaves after 7 days in the grain-filling stage (Figure 5A). By contrast, maximal fluorescence yield (Fm) in the esl mutant rice leaves decreased gradually and was significantly lower than that of the wild-type leaves during the same period (Figure 5B). In comparison with the wild-type rice, the esl mutant rice leaves showed a significant decrease in the variable fluorescence (Fv) and Fv/Fm values and a significant increase in 1 − Fv/Fm during the grain-filling stage (Figure 5C–E), thereby suggesting that the reducing primary quinone acceptor (QA) reduction and quantum yields of PSII photochemistry and increasing heat dissipation of light energy occurred during the photosynthesis of the esl mutant rice leaves. Moreover, the esl mutant rice leaves exhibited a linear decrease in net photosynthetic rate (Pn), which was significantly lower than the wild-type rice leaves after 7 days in the grain-filling stage (Figure 5F).

2.3. Genotype-Dependent Differences in the Expression of Cab and Key Genes Encoding for the Reaction Center of the PSII Complex

In photosynthesis, the light-harvesting Chl (LHC) a/b binding protein (Cab) is involved in harvesting quantum photon and transferring light energy to the PSI and PSII for carbon dioxide assimilation. A genotype-dependent difference in the expression of Cab was determined during the grain-filling stage. Figure 6A shows that the expression levels of Cab in the leaves of the two rice genotypes decreased gradually during the entire grain-filling stage. Compared with the wild-type rice, the esl mutant rice showed a significantly lower expression pattern of Cab in the leaves during the grain-filling stage. In addition, four key genes encoding for the reaction center of the PSII complex were detected for the two rice genotypes. As shown in Figure 6B–E, the expression levels of photosystem II binding protein A (PsbA), PsbB, PsbC, and PsbD in the esl mutant rice leaves decreased gradually after anthesis and were significantly lower than those of the wild-type rice leaves during the entire grain-filling stage. These results indicated the weakened ability of light harvesting and energy transfer and reduced electron transport through the reaction center of PSII in the esl mutant rice leaves during the entire grain-filling stage.

3. Discussion

Leaf senescence is an important trait that influences crop yield and quality. In cereal crops, such as barley, wheat, and rice, leaves are the major source of nutrients for the developing grains during the grain-filling stage. Delaying leaf senescence, particularly of the flag leaf, will result in a significant increase in crop yields [21]. In recent years, the stay-green traits have been considered in breeding practice to enhance stress resistance and increase grain yield [22]. By contrast, early leaf senescence often leads to a severe decrease in crop productivity during the grain-filling stage [23,24]. In this study, early senescence in the esl mutant rice showed significant decreases in the seed-setting rate, 1000-grain weight, and yield per plant relative to the wild-type rice (Figure 1). The temporal accumulation of the 1000-grain weight in the esl mutant rice was significantly lower than that of the wild-type rice during the grain-filling stage (Figure 2), suggesting that the amounts of nutrients transported in the developing grains were reduced for the esl mutant rice during the whole grain-filling stage. Therefore, the dynamic filling of the developing grains during the grain-filling stage was apparently weakened in the esl mutant rice in terms of early leaf senescence, which finally contributed to the reduced seed-setting rate, 1000-grain weight, and yield per plant in the esl mutant rice when harvested. The present demonstration also agreed with a previous conclusion that the reduced nutrient translocation and grain-filling rates due to early source leaf senescence are one of the major reasons that result in insufficient grain filling and severe loss of grain yield in cereal crops [25,26].
Plant leaf is an important organ of photosynthesis. In particular, the uppermost flag leaf has a crucial role in supplying photosynthates to the developing grains [27,28]. Previous studies have demonstrated that grain yield characteristics are positively correlated with flag leaf traits [29]. Faisal [30] investigated the relationship between flag leaf characteristics and grain yield in three cereal crops (oat, wheat, and rice) and discovered that grain yield is significantly and positively correlated with leaf area and fresh weight of flag leaf. In the present study, no significant differences were observed for leaf length, leaf width, leaf dry weight, and water content in the flag leaves between the esl mutant and its corresponding wild-type rice genotypes (Figure 3). The morphological characteristics of the flag leaf were not the principal reason for the loss of yield in the esl mutant rice.
On the other hand, the yield formation of cereal crops is also closely related to the Chl content of the flag leaf during the grain-filling stage, and abundant Chl in the source leaf is required for the biosynthesis of photosynthates [31]. The most salient feature in the early senescent leaf is the yellowish phenotype due to Chl degradation during chloroplast decomposition, which results in reduced photosynthetic activity [32]. In the present study, the flag leaf of the esl mutant rice displayed significant decreases in Chl a, Chl b, Chl a/b, and total Chl compared with the wild-type rice during the grain-filling stage (Figure 4). The decrease in the Chl content due to early leaf senescence was likely the principal reason that resulted in the loss of final yield. The significant decrease in Chl a/b for the early senescent leaf suggested that the degradation rate of Chl a was faster than that of Chl b during leaf senescence. Simeonova et al. [33] reported similar results and observed a more rapid decrease in the Chl a content than in the Chl b content during leaf senescence for rice and wheat. Chl a was possibly highly sensitive to reactive oxygen species that accumulated in mesophyll cells during leaf senescence [34]. Another possible reason is that the degradation of Chl b was more complicated than that of Chl a because the degradation of Chl b must first be converted to Chl a via 7-hydroxymethyl Chl a [35]. In addition, the esl mutant rice leaves showed an increase in F0 (Figure 5A) and decrease in Fm (Figure 5B) and Fv (Figure 5C) during the entire grain-filling stage, indicating the weakened abilities of light energy harvesting and transfer in mesophyll cells of senescent leaves. These effects were due to the reduced Chl a and Chl b levels, because Chl a is responsible for energy excitation and transfer in photosynthesis, and Chl b is considered an antenna Chl and adopts an essential role in light energy capture and energy aggregation [36].
Increasing evidence has demonstrated that Chl takes a central role in photosynthesis by forming complexes with thylakoid-membrane proteins such as PSI, PSII, and the cytochrome b6f complex [32,37]. In this study, the esl mutant rice showed a significant decrease in Fv/Fm value during the grain-filling stage (Figure 5D). The expression levels of PsbA, PsbB, PsbC, and PsbD encoding for the core reaction center of PSII complex were significantly lower for the esl mutant rice than those for the wild-type rice during the entire grain-filling stage (Figure 6B–E). Thus, the structure of the PSII complexes inlaid in the thylakoid membrane was severely damaged, and the PSII apparatus lost some biological function in senescent leaves. The destroyed thylakoid structure was also observed in senescent rice leaves by electronic super-microscopy [38]. The severely damaged PSII reaction centers resulted in the reduced QA reduction and quantum yields of the PSII photochemistry. However, the significantly decreased expression of Cab in senescent leaves (Figure 6A) suggested the weakened harvesting of quantum photon and transfer of light energy to the PSI and PSII for carbon dioxide assimilation. Subsequently, a large amount of light energy dissipated in the form of heat energy in mesophyll cells of senescing leaves. This phenomenon was supported by the result of a significant increase in 1 − Fv/Fm in the esl mutant rice leaves (Figure 5E), demonstrating the increased heat dissipation of light energy in mesophyll cells of senescent leaves. Therefore, a significant decrease in Pn for the esl mutant rice (Figure 5F) was a necessary result of the decreased harvesting and utilization efficiency of light energy in senescent leaves.

4. Materials and Methods

4.1. Plant Material

Samples of esl mutant rice with the early leaf senescence phenotype were obtained from the mature seeds of gamma-irradiated cultivated rice “Fu142” (Oryza sativa L. indica), which was acquired from Institute of Crop and Nuclear Technology Utilization, Zhejiang Academy of Agricultural Sciences in Hangzhou, Zhejiang Province, China. Stable phenotype selection was performed from the mutation (M) 2 to 8 generations through successive self-pollination. The esl mutant rice plant did not show obvious phenotypic abnormalities between the seedling and tillering stages. During the late tillering stage, lesions began to appear on the tips of the lower leaves of the esl mutant rice, and brown lesions gradually became exacerbated and expanded to cover the whole leaf blade. However, the topmost two fully expanded leaves and central leaf of plant retained their normal green appearance (Figure 7A). After the flowering stage, the flag leaf of the esl mutant rice plant began to display senescence symptoms, and the brown lesions gradually spread from the tip down to the whole leaf blade during the grain-filling stage until the leaf completely became withered at nearly 25 days after anthesis (Figure 7B). By contrast, the wild-type rice plant retained its normal green appearance during the same period (Figure 7C).

4.2. Field Study

The experiment was conducted in 2017 at the experimental field of the Fujian Agriculture and Forestry University in Fuzhou, Fujian Province, China. The soil type at the field was periodically waterlogged paddy soil with 1.69 g/kg total N, 24.5 mg/kg available P, and 103.7 mg/kg exchangeable K. The completely randomized field plots were arranged with three replications for each genotype. Rice seeds were presoaked in water for 24 h and then germinated at 37 °C for 24 h in the dark. The germinated seeds were sown in a seedling nursery on April 15 and transplanted on May 10. Each field plot was set in 10 × 12 rows and spaced at 18 cm × 18 cm with one rice seedling for each hill. Field plot management was implemented based on the local cultivation mode. At the full heading stage, 100–120 plants with the same flowering day were randomly selected and tagged for each rice genotype. From the beginning of the grain-filling stage, Chl fluorescence parameters and photosynthetic rate of the flag leaves of the tagged rice plants were measured over 7-day intervals at 11:00 a.m. The flag leaves were also sampled in the same period with three independent biological replications. Some fresh leaf samples were used for the determination of photosynthetic pigments, and other fresh samples were immediately frozen in liquid nitrogen and kept at −80 °C for gene expression analysis. Fifteen panicles were harvested over 7-day intervals, and the grains were threshed by hand and dried in an oven. The 1000-grain weight was weighted over 7-day intervals during the grain-filling stage. At the maturity stage, the seed-setting rate, 1000-grain weight, and yield per plant were investigated for each rice genotype.

4.3. Determination of Photosynthetic Pigments

Photosynthetic pigment contents were measured as described by Lichtenthaler [39]. A leaf sample (0.2 g) was ground and soaked in 95% (v/v) alcohol. The sample was stored in a dark place for approximately 24 h until the color of the sample changed to white. After centrifugation, the absorbance of the supernatant was measured at 470, 649, and 665 nm by a spectrophotometer (UV-2450, Shimadzu, Kyoto, Japan).

4.4. Measurement of Chl Fluorescence Parameters and Net Photosynthetic Rate (Pn)

Chl fluorescence parameters were measured using a steady-state gas-exchange system with an integrated fluorescence chamber head (LI-6400-40, LI-COR, Lincoln, NE, USA). Six plants for each rice genotype were adapted in the dark for 20 min and then irradiated with weak light (0.1 μmol [photon] m−2·s−1). The minimal fluorescence yield of the dark-adapted state (F0) was measured, and the maximal fluorescence yield of the dark-adapted state (Fm) was measured by applying a saturating pulse light (3000 μmol [photon] m−2·s−1). Variable fluorescence (Fv) was calculated as Fv = Fm − F0, and the maximal quantum yield of PSII was calculated as Fv/Fm = (Fm − F0)/Fm, which was used to assess the photochemical efficiency of PSII. The heat dissipation of light energy was calculated as D = 1 − Fv/Fm. Pn in flag leaf was measured from 11:00 to 12:00 a.m. using an LI-6400 portable photosynthesis system (LI-COR, Lincoln, NE, USA).

4.5. RNA Extraction and cDNA Synthesis

Frozen leaf samples (0.1 g) were crushed into a fine powder in liquid N2 by using a mortar and pestle. Total RNA was extracted with Trizol reagent (Tiangen Biotech Co., Ltd., Beijing, China) following the manufacturer’s protocol. RNA quality was evaluated by aspectrophotometer (NanoDropTM 1000, Thermo Fisher Scientific, Waltham, MA, USA), and genomic DNA pollution was removed by treatment with RNase-free DNaseI (Tiangen Biotech Co., Ltd., Beijing, China) at 37 °C for 30 min. Subsequently, 1 μg of purified RNA was reverse-transcribed into cDNA in 50 μL of reaction buffer with an oligo (dT) primer. The reaction buffer was incubated at 37 °C for 15 min and then terminated through heating at 95 °C for 5 min.

4.6. qRT–PCR

An aliquot of cDNA was used as the template for qRT–PCR analysis with the SYBR Green Real-time PCR Master Mix reagent kit (Toyobo, Osaka, Japan). qRT–PCR analysis was performed on a CFX96 system (Bio-Rad, Hercules, CA, USA) following the manufacturer’s protocol, with 20 μL of a reaction solution containing 10 μL of SYBR, 1 μL of cDNA, 1.6 μL of 10 mM primer, and 7.4 μL of H2O. The qRT–PCR cycling conditions were as follows: initial denaturation at 95 °C for 30 s, 40 cycles of denaturation at 95 °C for 5 s and annealing at 58 °C for 10 s, and final extension at 72 °C for 15 s. A melting curve protocol from 58 °C to 95 °C was performed to detect a single gene-specific peak for all the tested primers after the final PCR cycle reaction. Table 1 lists the specific primers of the selected genes that were designed by the online software Primer-BLAST (Available Online: http://www.ncbi.nlm.nih.gov/tools/primer-blast/). To normalize data, the ACTIN-1 sequence was amplified as an internal reference. The relative expression levels of the tested genes were analyzed by the comparative C(T) method [40]. Average values and standard errors were calculated based on three independent biological repetitions.

4.7. Statistical Analysis

The data were analyzed using the SPSS statistical software package (SPSS Inc., Chicago, IL, USA). Statistical significances were estimated by single factor ANOVA, and all determinations were performed in three independent biological repetitions. Differences were considered significant at a probability level of p < 0.05. Standard deviations were marked in the figures.

5. Conclusions

During the grain-filling stage, Chl composition, Fm, Fv, Fv/Fm, and Pn in premature leaves considerably decreased, and the abilities of light energy harvesting and transferring were weakened in senescent leaves. F0 and 1 − Fv/Fm remarkably increased, and the expression levels of Cab, PsbA, PsbB, PsbC, and PsbD encoding for the reaction center of the PSII complex were significantly depressed in the mesophyll cells of senescent leaves. The damaged PSII reaction centers resulted in the weakened harvesting quantum photon and transferring light energy to PSI and PSII for carbon dioxide assimilation, leading to enhanced heat dissipation of light energy and a decrease in Pn, which caused a significant decrease in the seed-setting rate, 1000-grain weight, and yield per plant.

Author Contributions

Z.L. designed the research; W.L. and X.G. performed the research; Z.L. and X.P. analyzed the data; W.L. and Z.L. wrote the paper. All authors read and approved the final manuscript.

Funding

This research was funded by the National Natural Science Foundation of China (No. 31701329), the Natural Science Foundation of Fujian Province (No. 2016J01100), and the Project Funded by China Postdoctoral Science Foundation (No. 2015M580560).

Conflicts of Interest

The authors declare no conflict of interest.

Abbreviations

CabChlorophyll a/b binding protein
ChlChlorophyll
eslEarly senescence leaf
FmMaximal fluorescence yield of the dark-adapted state
F0Minimal fluorescence yield of the dark-adapted state
FvVariable fluorescence
Fv/FmMaximal quantum yield of PSII photochemistry
PSIIPhotosystem II
PnNet photosynthetic rate
QAPrimary quinone acceptor
qRT-PCRQuantitative real-time polymerase chain reaction

References

  1. International Rice Genome Sequencing Project. The map-based sequence of the rice genome. Nature 2005, 436, 793–800. [Google Scholar] [CrossRef] [PubMed] [Green Version]
  2. Lu, D.; Pan, Y.; Ma, Y.; Ling, Z.; Bao, W.; Jing, Y.; You, S. Physiological and biochemical studies on leaf senescence at heading and grain formation stage in hybrid rice. Sci. Agric. Sin. 1988, 3, 004. [Google Scholar]
  3. Duan, J.; Liang, C.; Huang, Y. Studies on leaf senescence of hybrid rice at flowing and grain formation stage. Acta Photophysiol. Sin. 1997, 23, 139–144. [Google Scholar]
  4. Li, Z.; Wang, F.; Lin, W.; Zhao, Q.; Liu, J.; Cheng, F. Carbon reserve and remobilization in leaf sheaths during the grain-filling stage in response to leaf early senescence. Acta Physiol. Plant. 2017, 39, 10. [Google Scholar] [CrossRef]
  5. Panda, D.; Sarkar, R.K. Natural leaf senescence: Probed by chlorophyll fluorescence, CO2 photosynthetic rate and antioxidant enzyme activities during grain filling in different rice cultivars. Physiol. Mol. Biol. Plants 2013, 19, 43–51. [Google Scholar] [CrossRef] [PubMed]
  6. Ma, Y.; Lu, D. Effect of irrigation modes on the senescence and physiological activity in hybrid rice after heading. Chin. J. Rice Sci. 1990, 4, 56–62. [Google Scholar]
  7. Wu, X.Y.; Kuai, B.K.; Jia, J.Z.; Jing, H.C. Regulation of leaf senescence and crop genetic improvement. J. Integr. Plant Biol. 2012, 54, 936–952. [Google Scholar] [CrossRef] [PubMed]
  8. Distelfeld, A.; Avni, R.; Fischer, A.M. Senescence, nutrient remobilization, and yield in wheat and barley. J. Exp. Bot. 2014, 65, 3783–3798. [Google Scholar] [CrossRef] [PubMed] [Green Version]
  9. Gregersen, P.L.; Holm, P.B.; Krupinska, K. Leaf senescence and nutrient remobilisation in barley and wheat. Plant Biol. 2008, 10, 37–49. [Google Scholar] [CrossRef] [PubMed]
  10. Krupinska, K.; Humbeck, K. Photosynthesis and chloroplast breakdown. In Plant Cell Death Processes, 1st ed.; Elsevier: San Diego, CA, USA, 2003; pp. 169–187. [Google Scholar]
  11. Shu, S.; Guo, S.R.; Sun, J.; Yuan, L.Y. Effects of salt stress on the structure and function of the photosynthetic apparatus in Cucumissativus and its protection by exogenous putrescine. Physiol. Plant. 2012, 146, 285–296. [Google Scholar] [CrossRef] [PubMed]
  12. Tang, Y.L.; Wen, X.G.; Lu, C.M. Differential changes in degradation of chlorophyll-protein complexes of photosystem I and photosystem II during flag leaf senescence of rice. Plant Physiol. Biochem. 2005, 43, 193–201. [Google Scholar] [CrossRef] [PubMed]
  13. Falqueto, A.R.; Silva, F.S.P.; Cassol, D.; MagalhãesJúnior, A.M.; Oliveira, A.C.; Bacarin, M.A. Chlorophyll fluorescence in rice: Probing of senescence driven changes of PSII activity on rice varieties differing in grain yield capacity. Braz. J. Plant Physiol. 2010, 22, 35–41. [Google Scholar] [CrossRef]
  14. Dai, Y.; Shen, Z.; Liu, Y.; Wang, L.; Hannaway, D.; Lu, H. Effects of shade treatments on the photosynthetic capacity, chlorophyll fluorescence, and chlorophyll content of Tetrastigmahemsleyanum Diels et Gilg. Environ. Exp. Bot. 2009, 65, 177–182. [Google Scholar] [CrossRef]
  15. Kalaji, H.M.; Schansker, G.; Brestic, M.; Bussotti, F.; Calatayud, A.; Ferroni, L.; Goltsev, V.; Guidi, L.; Jajoo, A.; Li, P.; et al. Frequently asked questions about chlorophyll fluorescence, the sequel. Photosynth. Res. 2017, 132, 13–66. [Google Scholar] [CrossRef] [PubMed]
  16. Yang, A.J.; Anjum, S.A.; Wang, L.; Song, J.X.; Zong, X.F.; Lv, J.; Zohaib, A.; Ali, I.; Yan, R.; Zhang, Y.; et al. Effect of foliar application of brassinolide on photosynthesis and chlorophyll fluorescence traits of Leymuschinensis under varying levels of shade. Photosynthetica 2018, 56, 873–883. [Google Scholar] [CrossRef]
  17. Kalaji, H.M.; Bosa, K.; Kościelniak, J.; Hossain, Z. Chlorophyll a fluorescence—A useful tool for the early detection of temperature stress in spring barley (Hordeumvulgare L.). Omics 2011, 15, 925–934. [Google Scholar] [CrossRef] [PubMed]
  18. Stefanov, M.; Yotsova, E.; Markovska, Y.; Apostolova, E.L. Effect of high light intensity on the photosynthetic apparatus of two hybrid lines of Paulownia grown on soils with different salinity. Photosynthetica 2018, 56, 832–840. [Google Scholar] [CrossRef]
  19. Lu, Q.; Lu, C.; Zhang, J.; Kuang, T. Photosynthesis and chlorophyll a fluorescence during flag leaf senescence of field-grown wheat plants. J. Plant Physiol. 2002, 159, 1173–1178. [Google Scholar] [CrossRef]
  20. Wingler, A.; Marès, M.; Pourtau, N. Spatial patterns and metabolic regulation of photosynthetic parameters during leaf senescence. New Phytol. 2004, 161, 781–789. [Google Scholar] [CrossRef] [Green Version]
  21. Tollenaar, M.; Wu, J. Yield improvement in temperate maize is attributable to greater stress tolerance. Crop. Sci. 1999, 39, 1597–1604. [Google Scholar] [CrossRef]
  22. Thomas, H.; Ougham, H. The stay-green trait. J. Exp. Bot. 2014, 65, 3889–3900. [Google Scholar] [CrossRef] [PubMed] [Green Version]
  23. Ray, S.; Mondal, W.A.; Choudhuri, M.A. Regulation of leaf senescence, grain-filling and yield of rice by kinetin and abscisic acid. Physiol. Plant. 1983, 59, 343–346. [Google Scholar] [CrossRef]
  24. Lim, P.O.; Kim, H.J.; Nam, H.G. Leaf senescence. Annu. Rev. Plant Biol. 2007, 58, 115–136. [Google Scholar] [CrossRef] [PubMed]
  25. Egli, D.B. Seed-fill duration and yield of grain crops. Adv. Agron. 2004, 83, 243–279. [Google Scholar]
  26. Gan, S.S. Leaf senescence as an important target for improving crop production. Adv. Crop. Sci. Technol. 2014, 2, e116. [Google Scholar] [CrossRef]
  27. Sheela, G.; Shai, V.N.; Saran, S. Role of flag leaf on grain yield and spikelet sterility in rice cultivars. Oryza 1990, 27, 87–88. [Google Scholar]
  28. Rahman, M.A.; Haque, M.E.; Sikdar, B.; Islam, M.A.; Matin, M.N. Correlation analysis of flag leaf with yield in several rice cultivars. J. Life Earth Sci. 2013, 8, 49–54. [Google Scholar] [CrossRef]
  29. Ashrafuzzaman, M.; Islam, M.R.; Ismail, M.R.; Shahidullah, S.M.; Hanafi, M.M. Evaluation of six aromatic rice varieties for yield and yield contributing characters. Int. J. Agric. Biol. 2009, 11, 616–620. [Google Scholar]
  30. Faisal, M.M.A.T. Flag leaf characteristics and relationship with grain yield and grain protein percentage for three cereals. J. Med. Plants Stud. 2014, 2, 1–7. [Google Scholar]
  31. Hisir, Y.; Kara, R.; Dokuyucu, T. Evaluation of oat (Avena sativa L.) genotypes for grain yield and physiological traits. Zemdirb. Agric. 2012, 99, 55–60. [Google Scholar]
  32. He, Y.; Li, L.; Zhang, Z.; Wu, J.L. Identification and comparative analysis of premature senescence leaf mutants in rice (Oryza sativa L.). Int. J. Mol. Sci. 2018, 19, 140. [Google Scholar] [CrossRef] [PubMed]
  33. Simeonova, E.; Sikora, A.; Charzyniska, M.; Mostowska, A. Aspects of programmed cell death during leaf senescence of mono- and dicotyledonous plants. Protoplasma 2000, 214, 93–101. [Google Scholar] [CrossRef]
  34. Wang, D.Y.; Zhang, X.F.; Shao, G.S.; Qian, Q.; Xu, C.M. Leaf senescence of difference leaf color rice and its response to light intensity. Chin. J. Rice Sci. 2008, 22, 77–81. [Google Scholar]
  35. Scheumann, V.; Ito, H.; Tanaka, A.; Schoch, S.; Rüdiger, W. Substrate specificity of chlorophyll(ide) b reductase in etioplasts of barley (Hordeumvulgare L.). Eur. J. Biochem. 1996, 242, 163–170. [Google Scholar] [CrossRef] [PubMed]
  36. Farquhar, D.G.; Sharkey, T.D. Stomatal conductance and photosynthesis. Annu. Rev. Plant Physiol. 1982, 33, 317–355. [Google Scholar] [CrossRef]
  37. Morita, R.; Sato, Y.; Masuda, Y.; Nishimura, M.; Kusaba, M. Defect in non-yellow coloring 3, an alpha/beta hydrolase-fold family protein, causes a stay-green phenotype during leaf senescence in rice. Plant J. 2009, 59, 940–952. [Google Scholar] [CrossRef] [PubMed]
  38. Wang, F.B.; Huang, F.D.; Cheng, F.M.; Li, Z.W.; Hu, D.W.; Pan, G.; Mao, Y.C. Photosynthesis and chloroplast ultra-structure characteristics of flag leaves for a premature senescence rice mutant. Acta Agron. Sin. 2012, 38, 871–879. [Google Scholar] [CrossRef]
  39. Lichtenthaler, H.K. Chlorophylls and carotenoids: Pigments of photosynthetic biomembranes. Methods Enzymol. 1987, 148, 350–382. [Google Scholar]
  40. Schmittgen, T.D.; Livak, K.J. Analyzing real-time PCR data by the comparative C(T) method. Nat. Protoc. 2008, 3, 1101–1108. [Google Scholar] [CrossRef] [PubMed]
Figure 1. Genotype-dependent differences in the (A) seed-setting rate, (B) 1000-grain weight, and (C) yield per plant for the two rice genotypes. Vertical bars represent standard errors (n = 3). The asterisks represent significant differences between the early senescence leaf (esl) mutant and its wild-type cultivar (* p < 0.05).
Ijms 19 02945 g001
Figure 2. Genotype-dependent differences in the temporal increases of 1000-grain weight for the two rice genotypes during the grain-filling stage. Vertical bars represent standard errors (n = 3). The asterisks represent significant differences between the esl mutant and its wild-type cultivar (* p < 0.05).
Ijms 19 02945 g002
Figure 3. Comparisons of the (A) leaf length, (B) leaf width, (C) leaf dry weight, and (D) water content of leaves between the esl mutant rice and its wild-type cultivar. Vertical bars represent standard errors (n = 3).
Ijms 19 02945 g003
Figure 4. Genotype-dependent differences in (A) chlorophyll (Chl) a, (B) Chl b, (C) Chl a/b, and (D) total Chl for the flag leaves of the two rice genotypes during the grain-filling stage. Vertical bars represent standard errors (n = 3). The asterisks represent significant differences between the esl mutant and its wild-type cultivar (* p < 0.05).
Ijms 19 02945 g004
Figure 5. Genotype-dependent differences in the temporal changes in (A) minimal fluorescence yield (F0), (B) maximal fluorescence yield (Fm), (C) variable fluorescence (Fv), (D) Fv/Fm, (E) 1 − Fv/Fm, and (F) net photosynthetic rate (Pn) for the flag leaves of the two rice genotypes during the grain-filling stage. Vertical bars represent standard errors (n = 3). The asterisks represent significant differences between the esl mutant and its wild-type cultivar (* p < 0.05).
Ijms 19 02945 g005
Figure 6. Comparison of the temporal expression patterns of (A) light-harvesting Chl a/b binding protein (Cab), (B) photosystem II binding protein A (PsbA), (C) PsbB, (D) PsbC, and (E) PsbD in the flag leaves between the two rice genotypes during the grain-filling stage. Vertical bars represent standard errors (n = 3). The asterisks represent significant differences between the esl mutant and its wild-type cultivar (* p < 0.05).
Ijms 19 02945 g006
Figure 7. Comparisons of plant morphological phenotypes (A) between esl mutant (right) and its corresponding wild-type cultivar (left) at the heading stage. The flag leaves of esl mutant (B) and wild-type cultivar (C) sampled over 8-day intervals from anthesis to 24 days after anthesis.
Ijms 19 02945 g007
Table 1. Sequence of primers for ACTIN-1 and genes used for quantitative real-time PCR.
GenePrimer PairsProducts (Base Pair)
Actin5′-CAGCACATTCCAGCAGATGT-3′
5′-TAGGCCGGTTGAAAACTTTG-3′
198
Cab5′-TGGCAGGACATCAAGAACCC-3′
5′-GCTCCTTCTCCTTGGCCTC-3′
145
PsbA5′-ATCTGTAGTTGATAGCCAAGGTCG-3′
5′-TAGGTCTAGAGGGAAGTTGTGAGC-3′
118
PsbB5′-ACGGTGGAGTTCTATGGTGG-3′
5′-CCCTTGGACTGCTGCGAAA-3′
154
PsbC5′-GGAGCAATGAACCTATTTGAAGTGG-3′
5′-GCCTAAGACTGCGGAGGAAAT-3′
186
PsbD5′-AACCGCAGCAGTTTCCACC-3′
5′-CACCAACGAGTAAAATCCCCTT-3′
93

