Prediction of Protein Hotspots from Whole Protein Sequences by a Random Projection Ensemble System


Abstract
:1. Introduction
2. Results
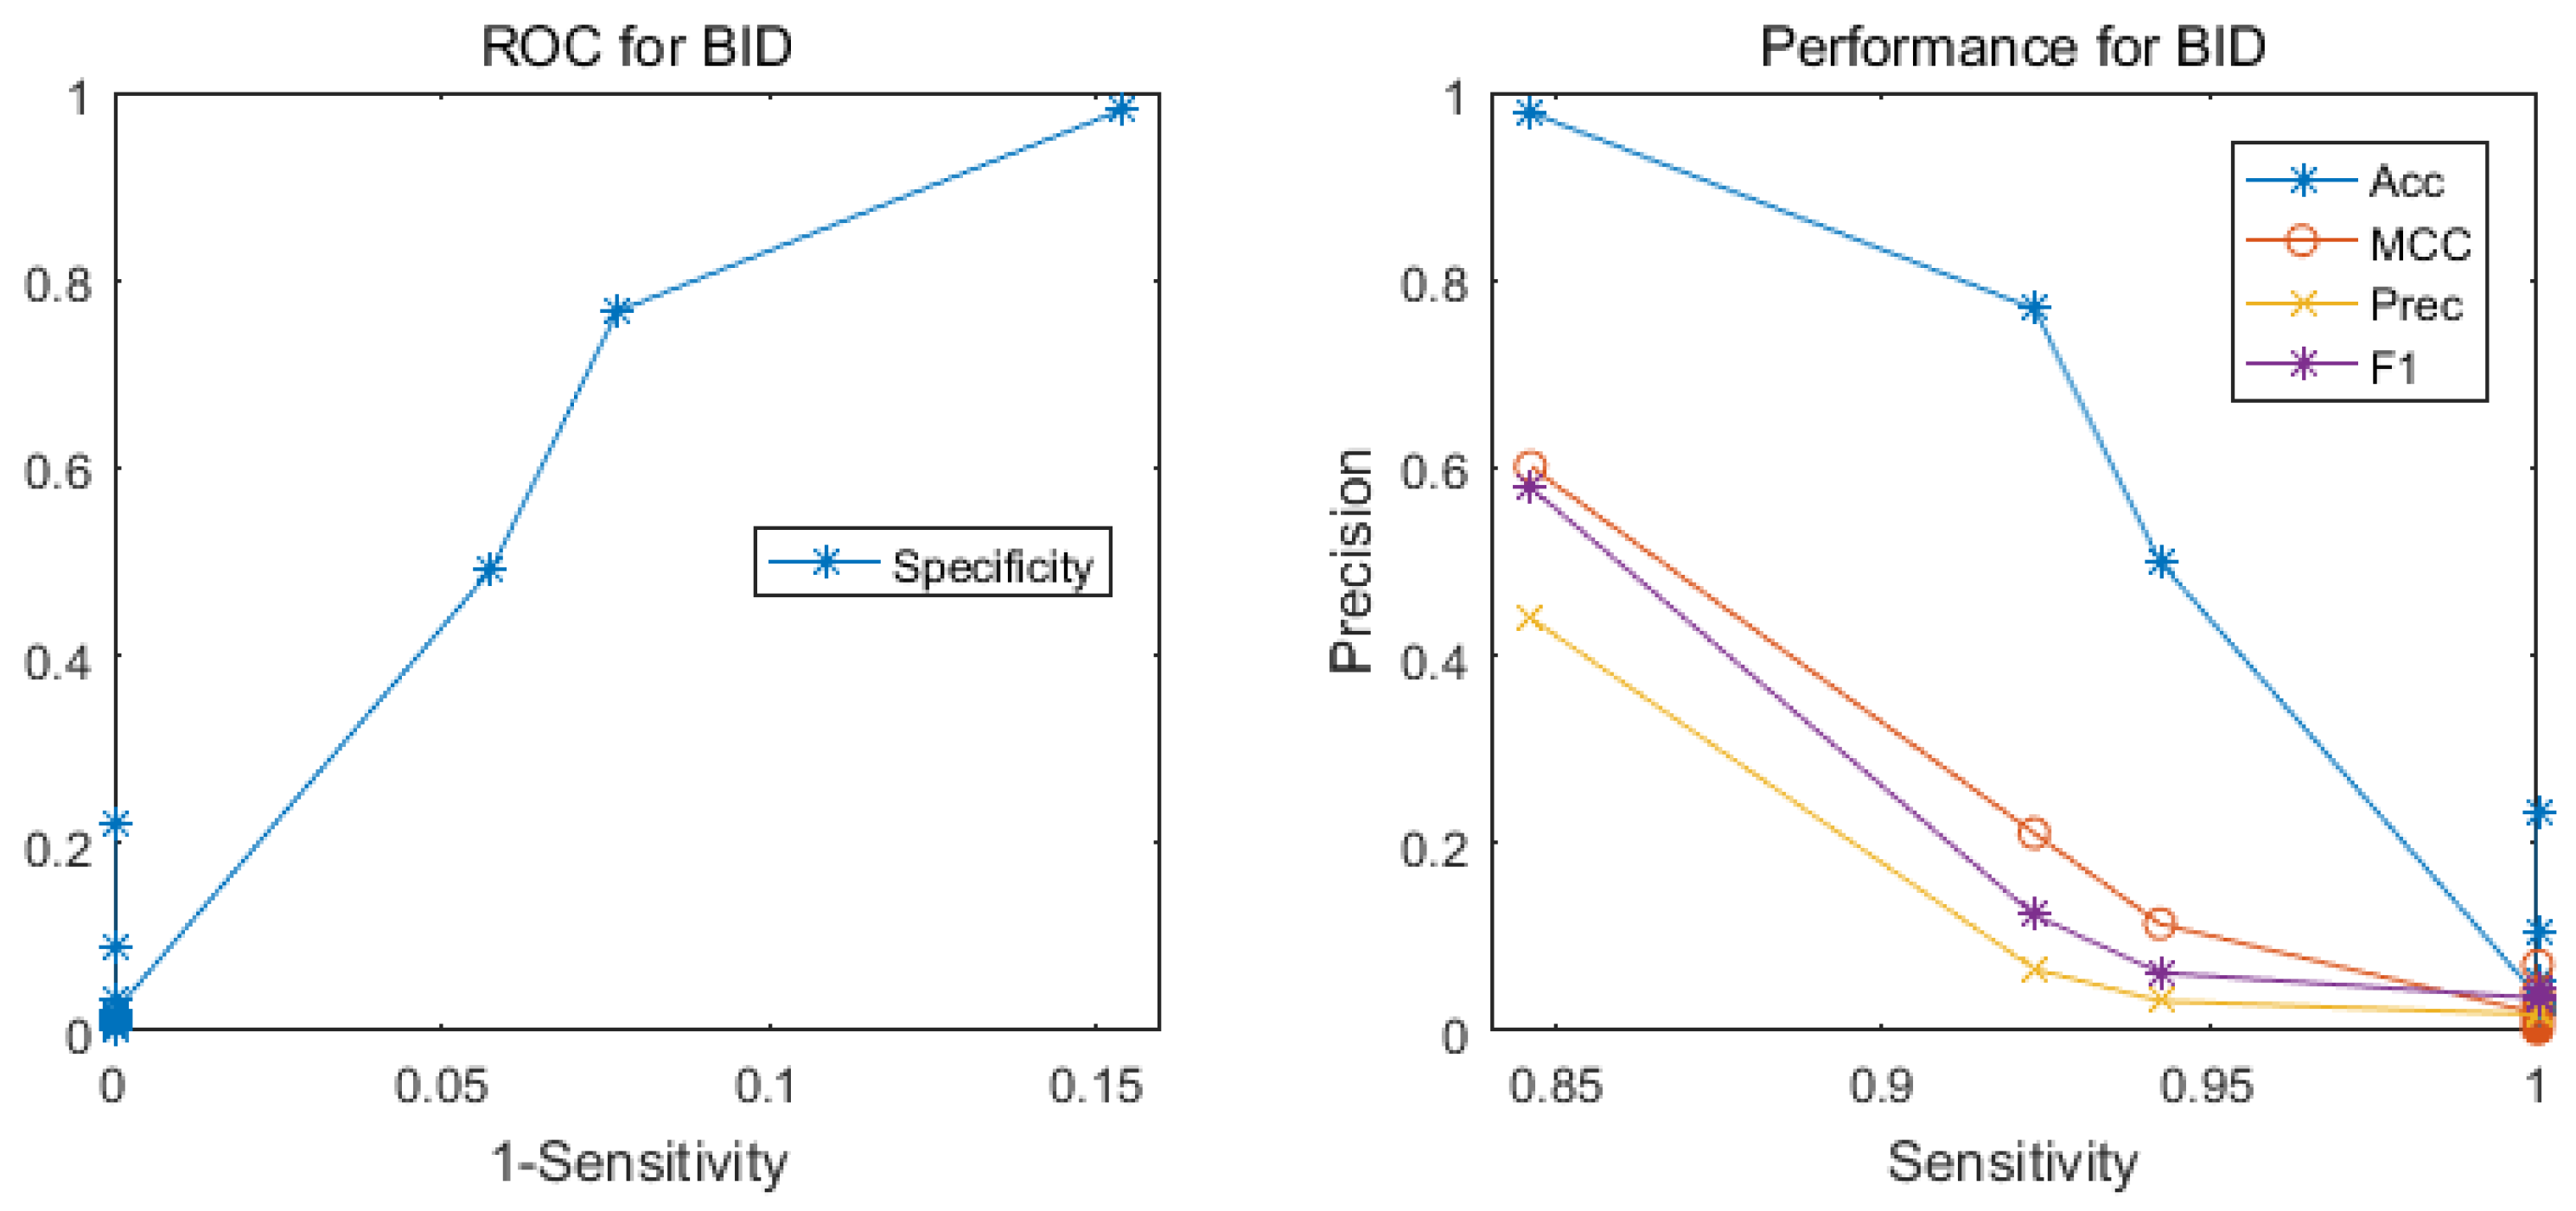
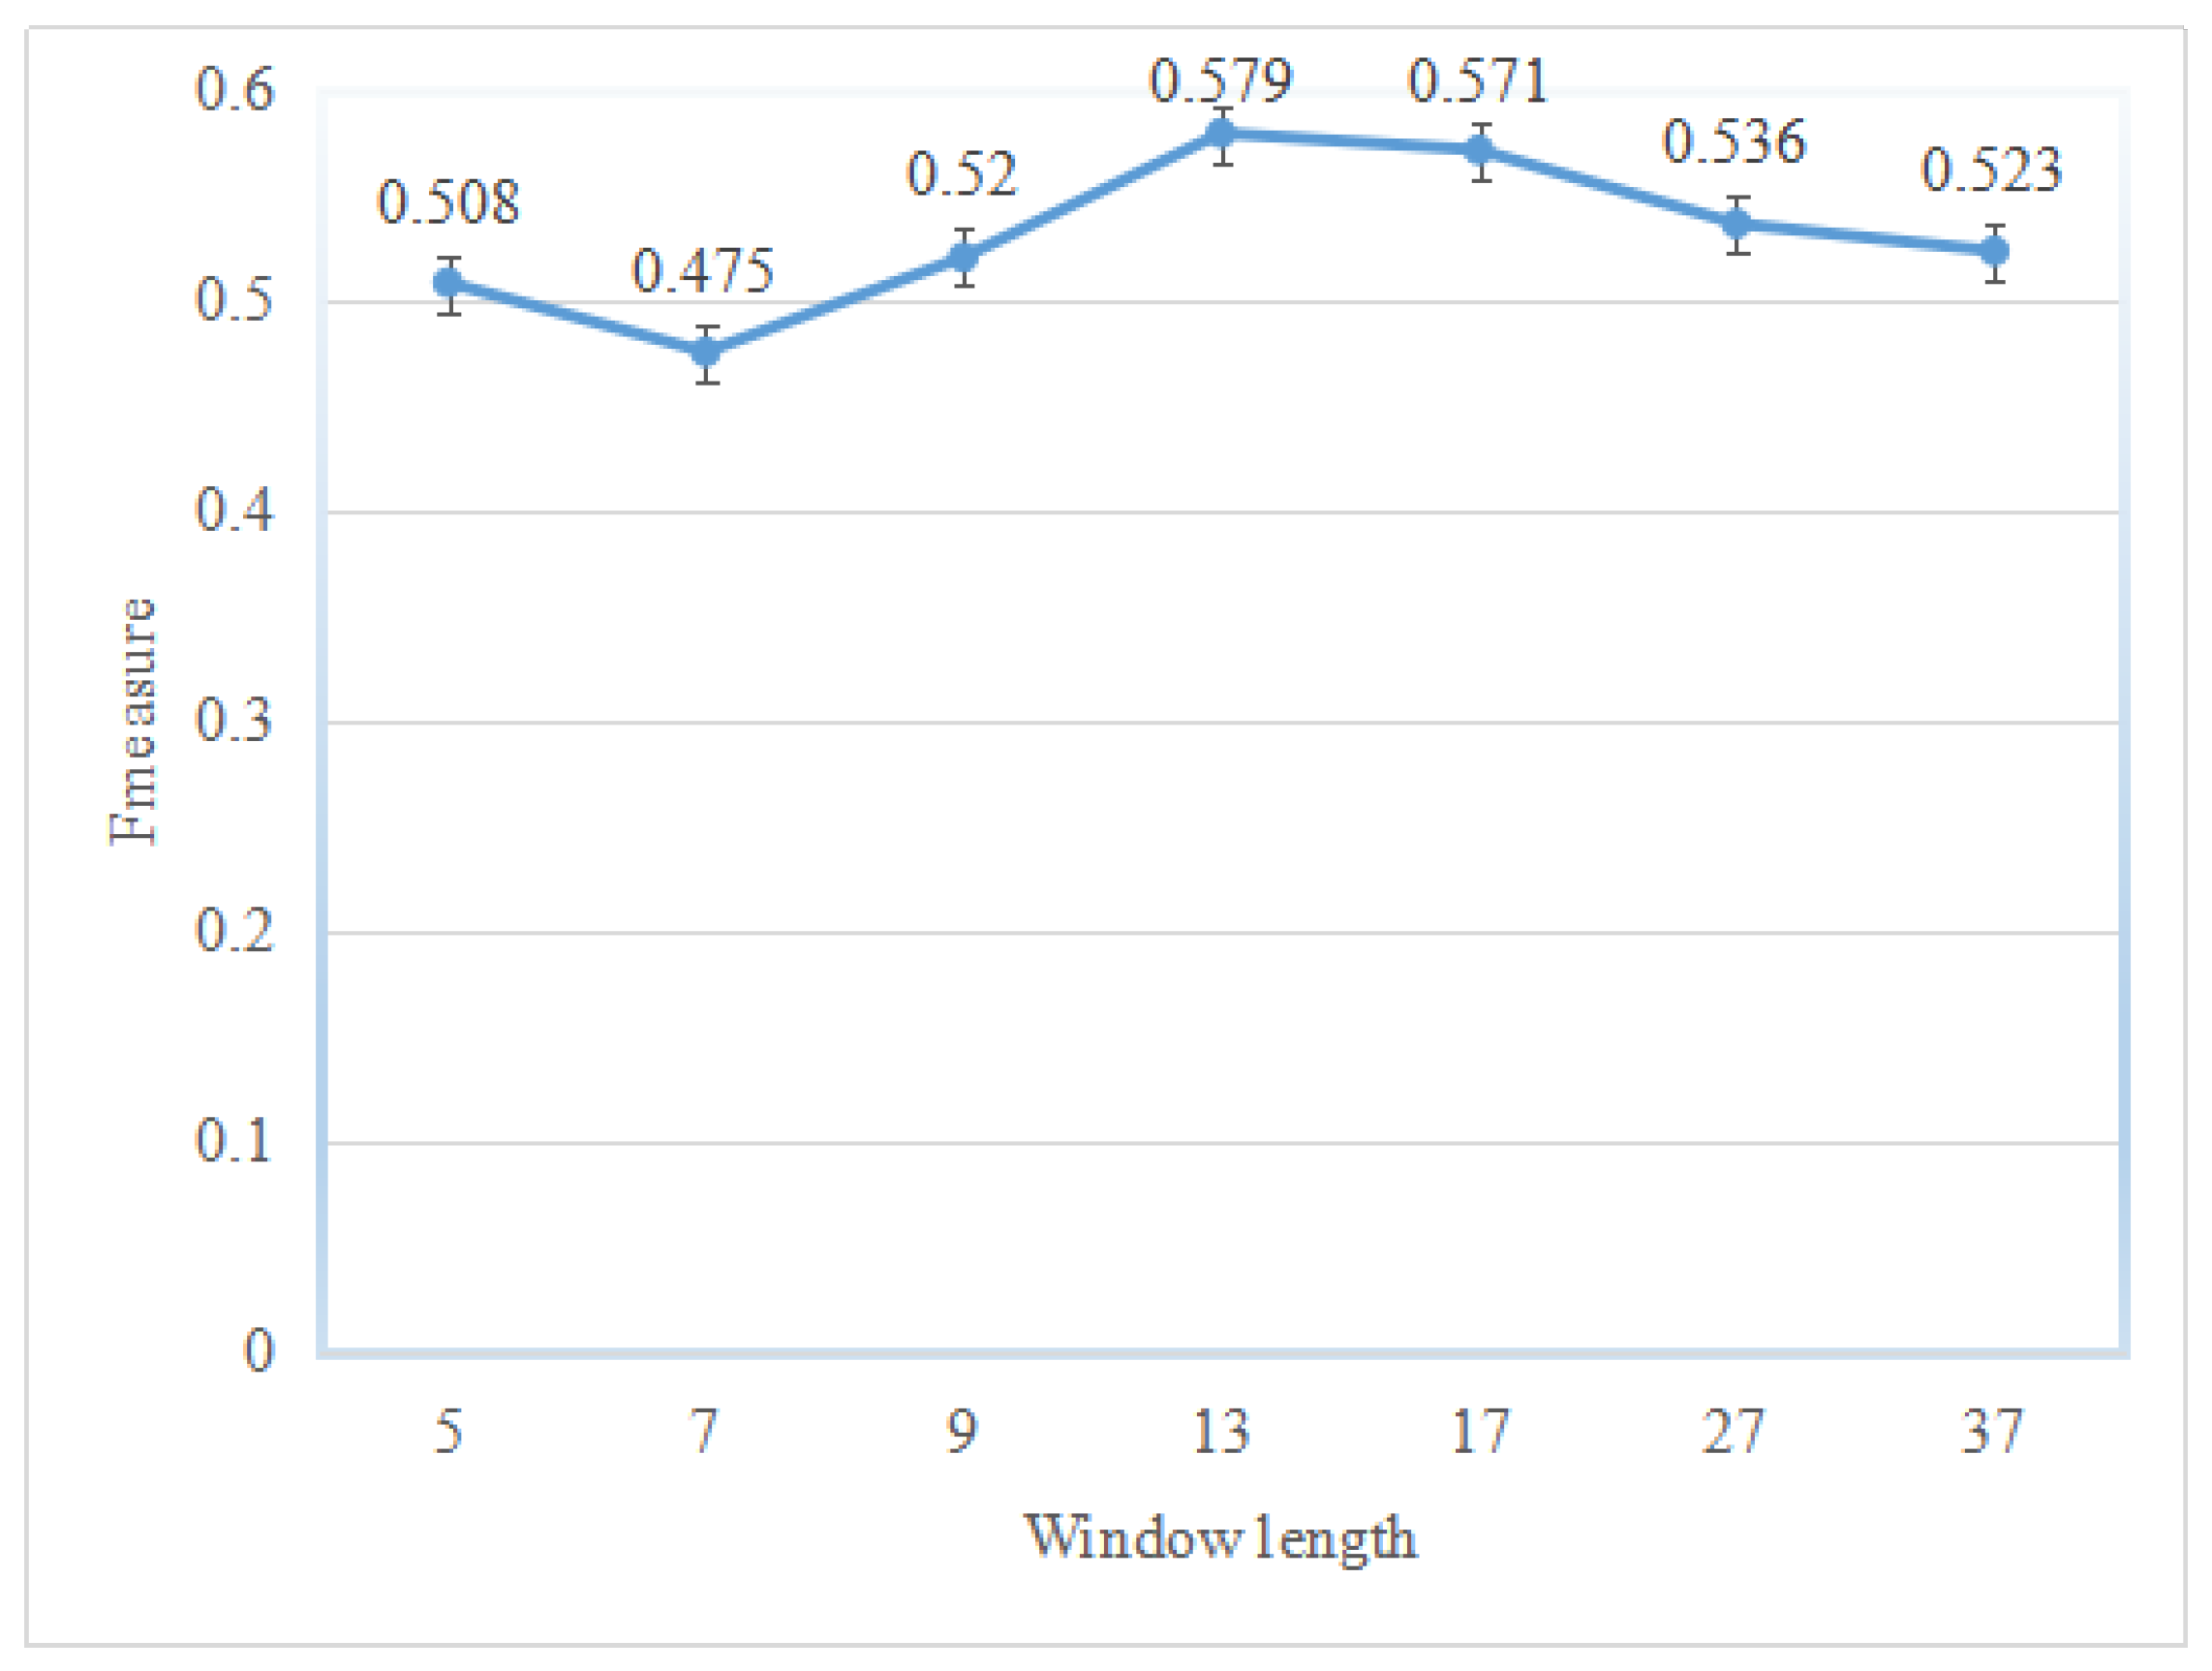
2.1. Performance of the Hotspot Prediction
2.2. Comparison with Other Methods
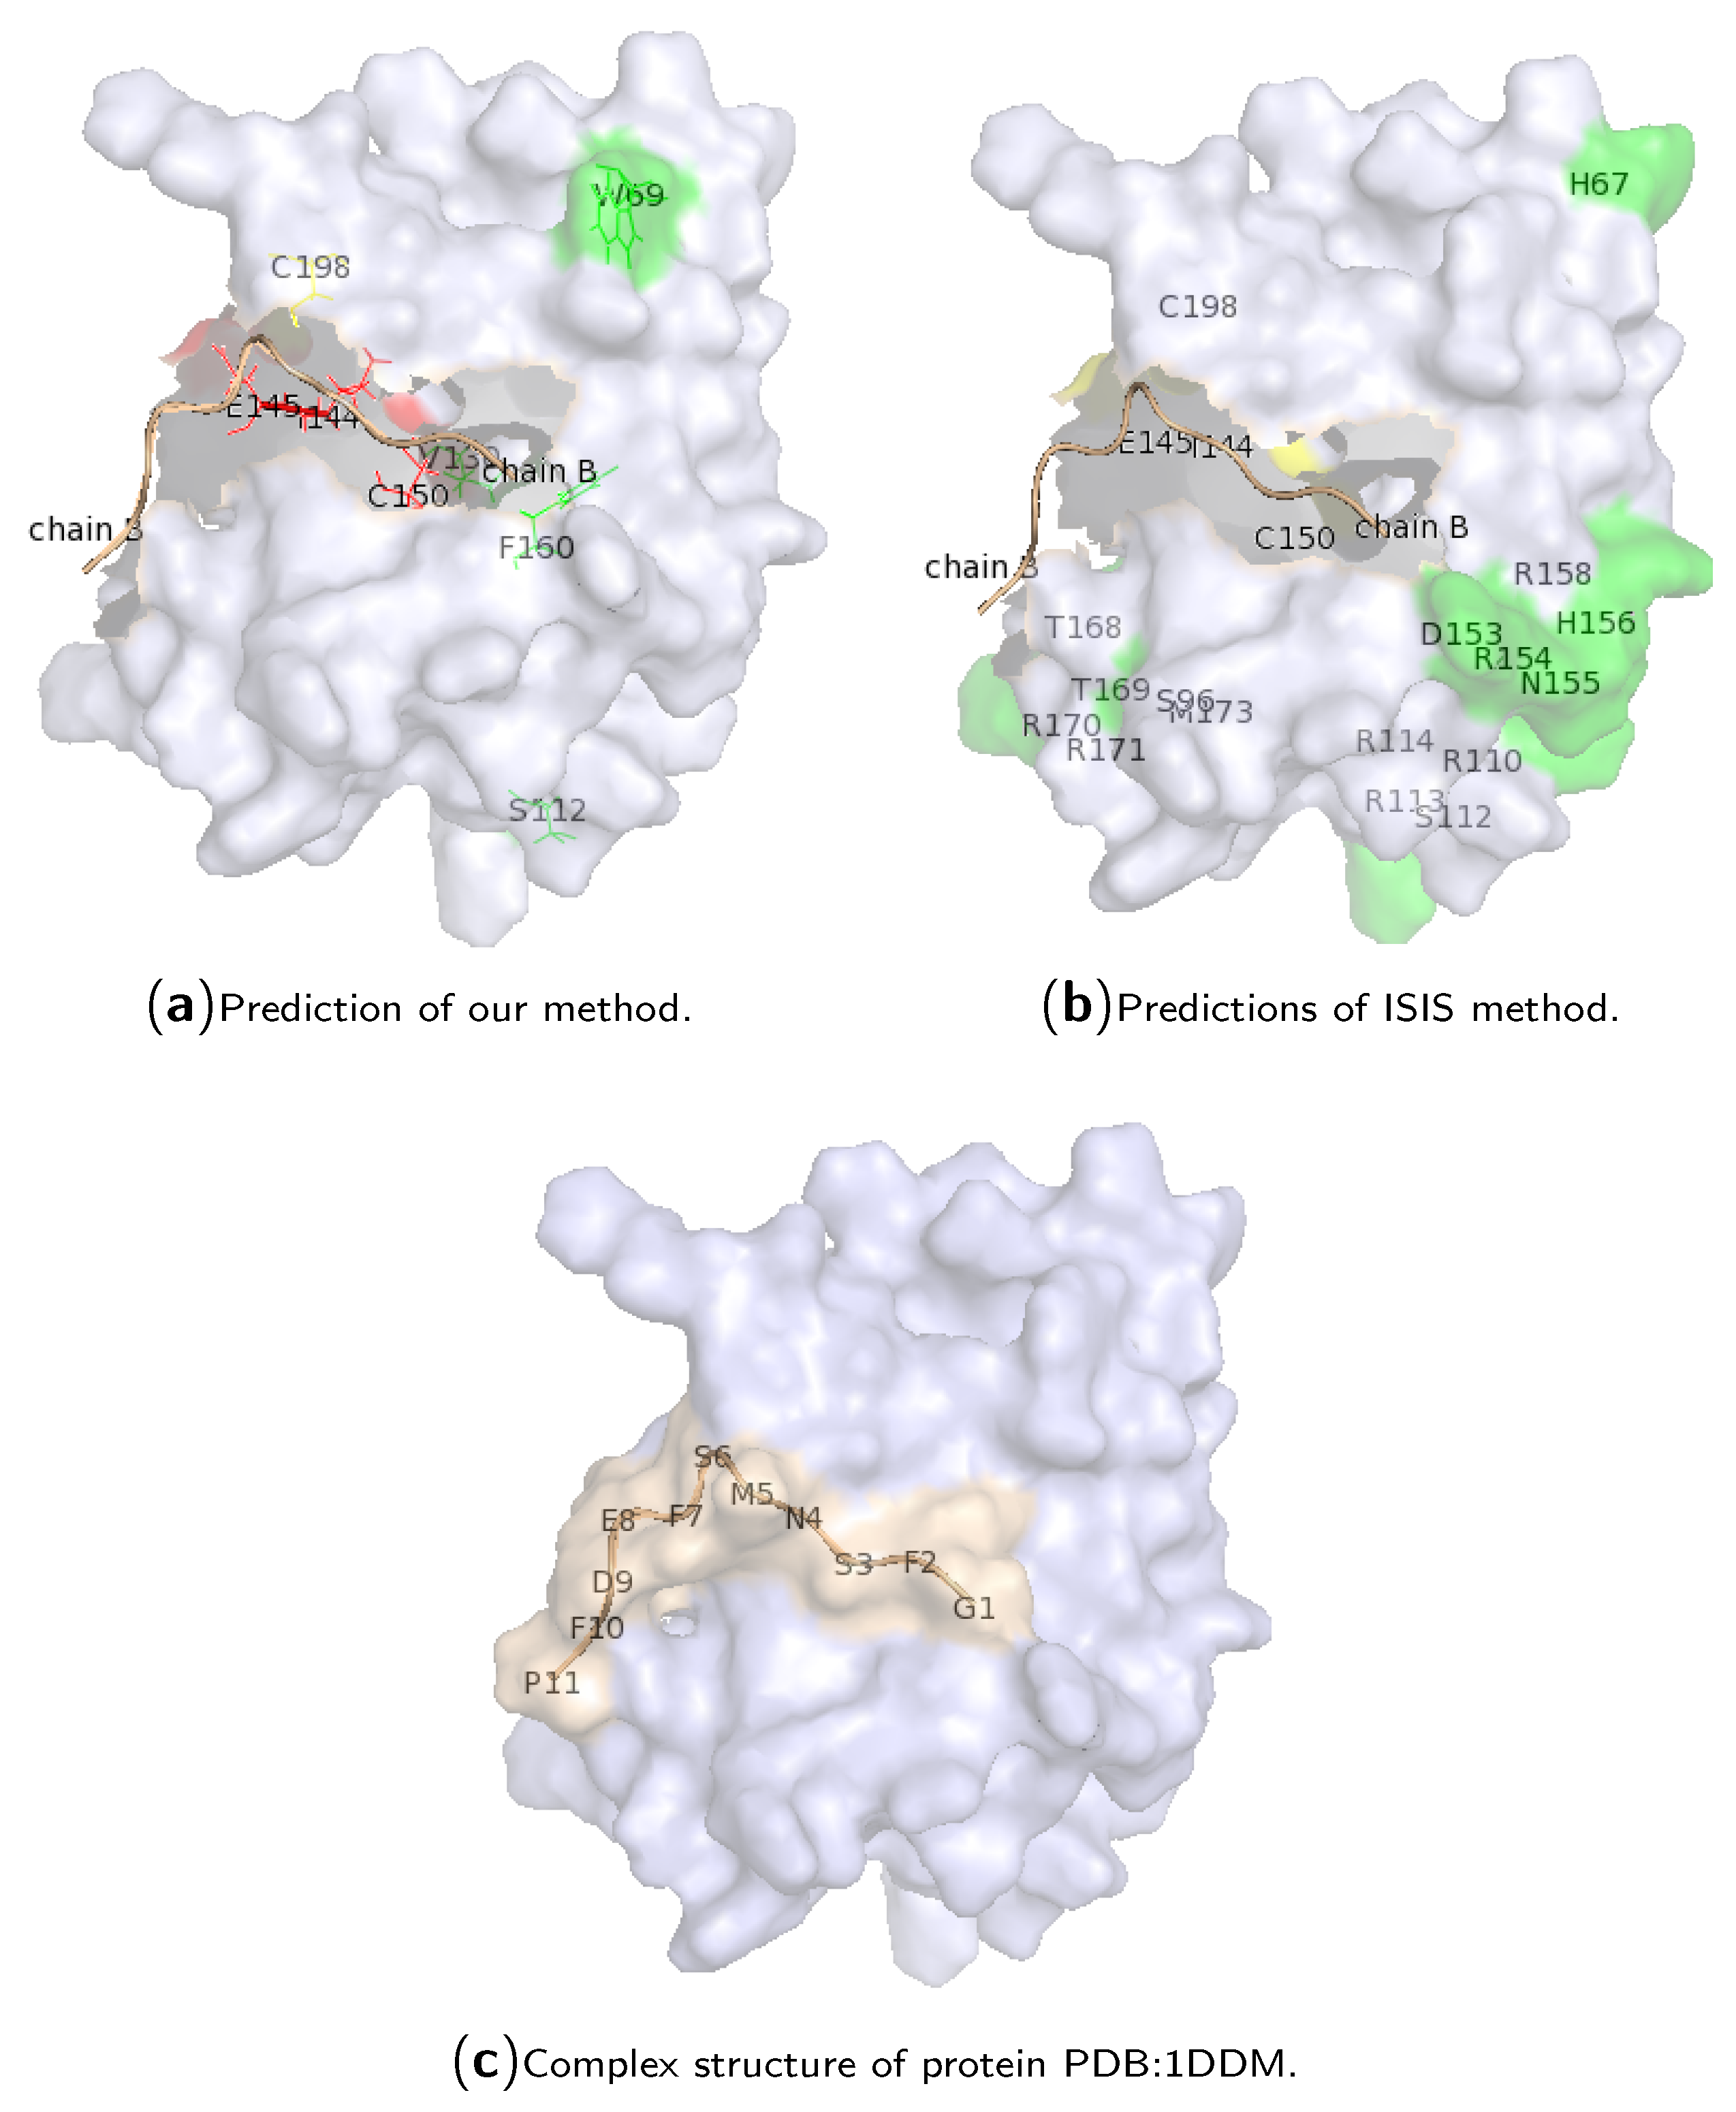
2.3. Case Study of Hotspot Predictions
3. Materials and Methods
3.1. Hot Spot Definitions
3.2. Datasets
3.3. Feature Encoding Scheme
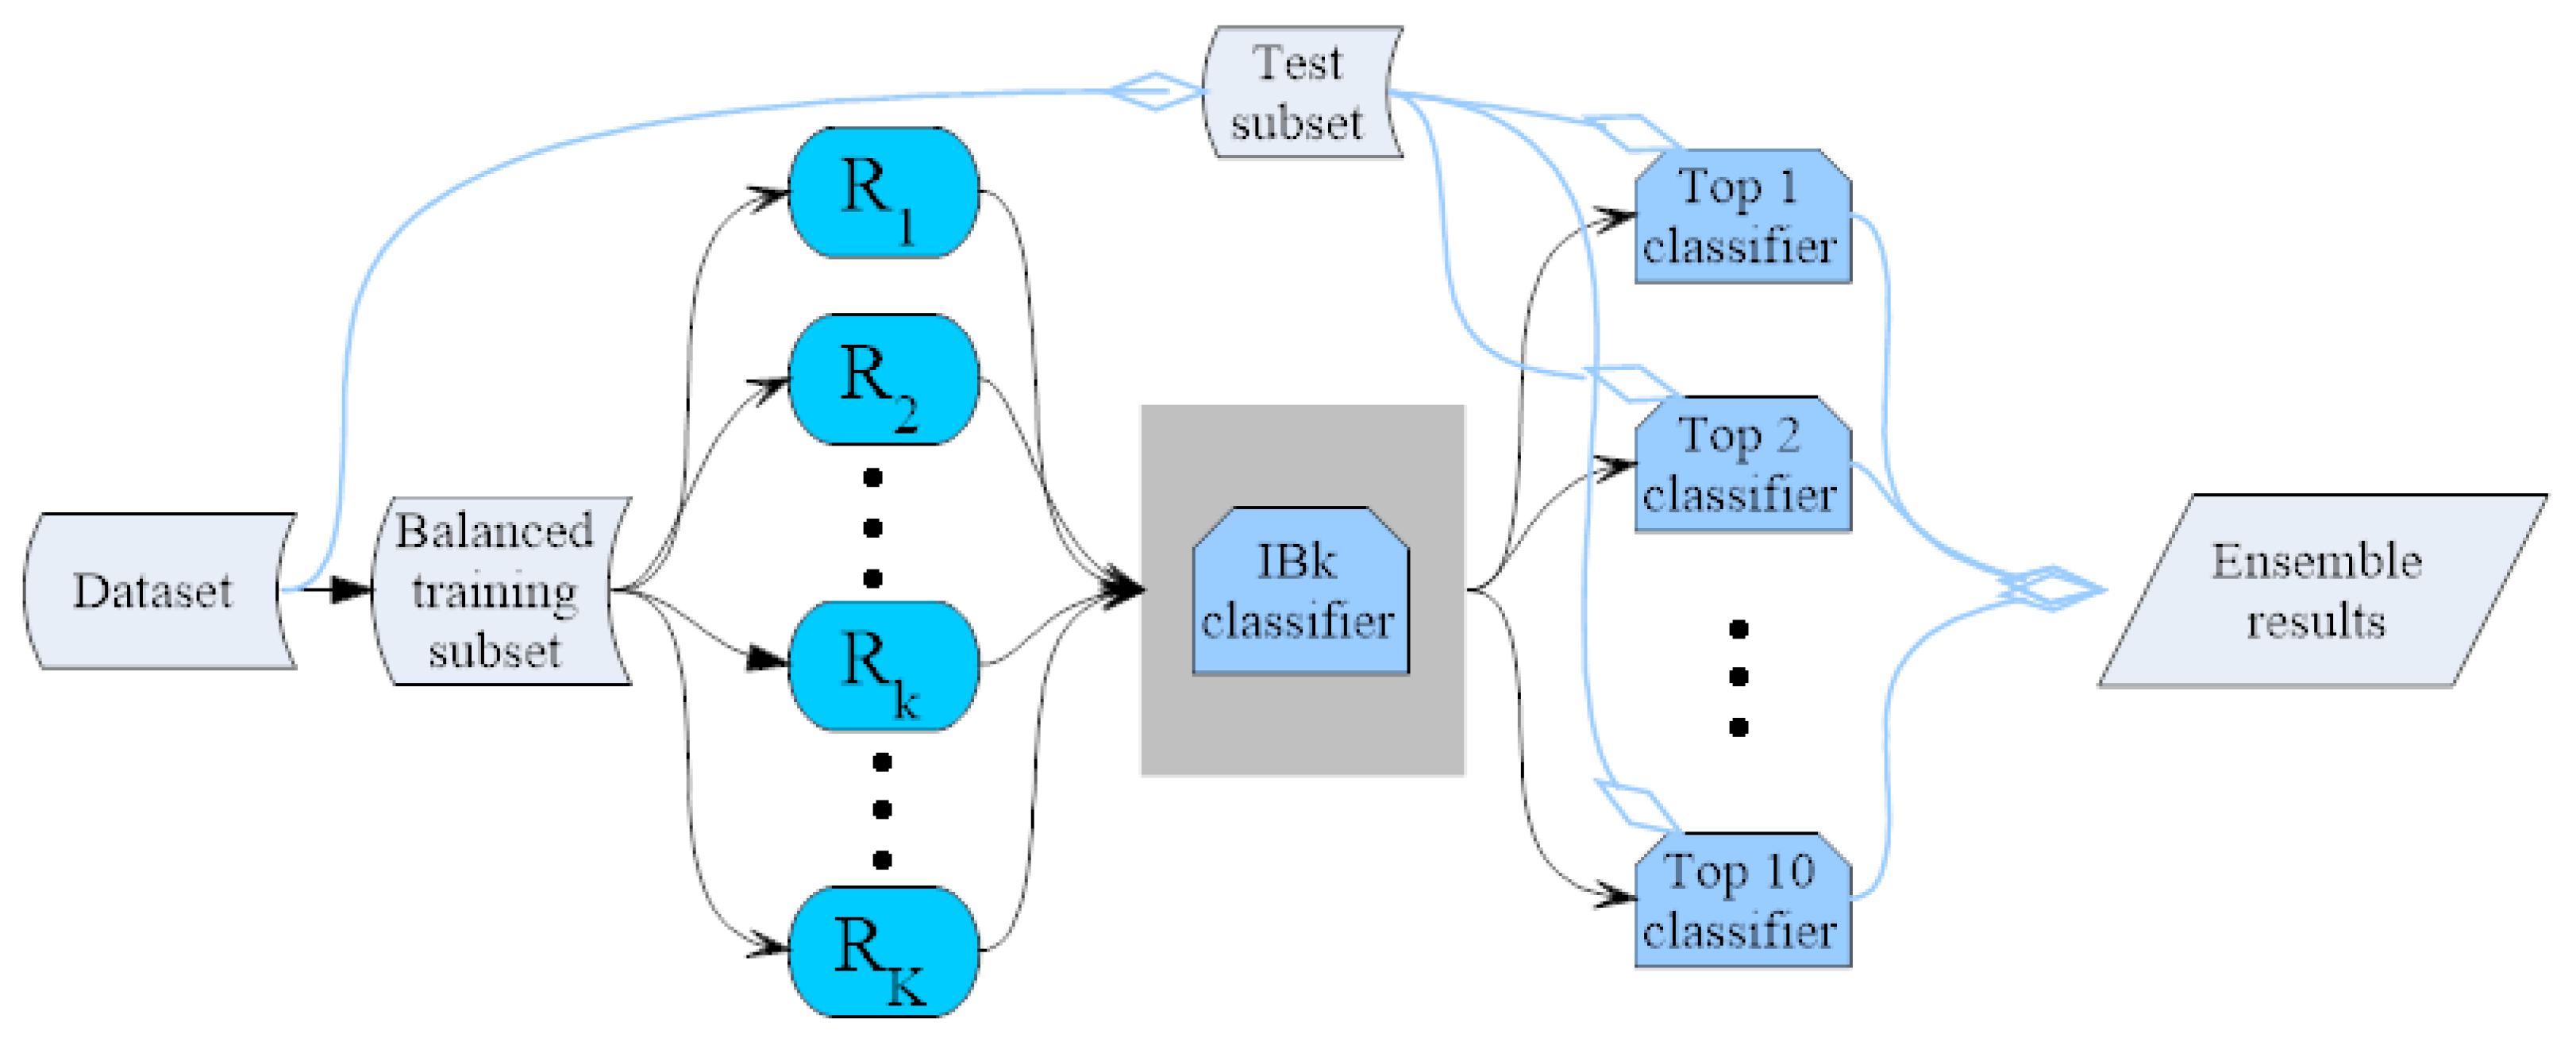
3.4. IBk Classifier Ensemble by the Random Mapping Technique
3.5. Hot Spot Prediction Evaluation
4. Conclusions
Supplementary Materials
Acknowledgments
Author Contributions
Conflicts of Interest
Abbreviations
| kNN | k-Nearest Neighbor |
| Sen | Sensitivity |
| Prec | Precision |
| F1 | F-Measure |
| MCC | Matthews Correlation Coefficient |
| ASEdb | Alanine Scanning Energetics Database |
| BID | Binding Interface Database |
| SKEMPI | Structural Kinetic and Energetic Database of Mutant Protein Interactions |
References
- Clackson, T.; Wells, J.A. A hot spot of binding energy in a hormone-receptor interface. Science 1995, 267, 383–386. [Google Scholar] [CrossRef] [PubMed]
- Bogan, A.A.; Thorn, K.S. Anatomy of hot spots in protein interfaces. J. Mol. Biol. 1998, 280, 1–9. [Google Scholar] [CrossRef] [PubMed]
- Kortemme, T.; Baker, D. A simple physical model for binding energy hot spots in protein-protein complexes. Proc. Natl. Acad. Sci. USA 2002, 99, 14116–14121. [Google Scholar] [CrossRef] [PubMed]
- Keskin, O.; Ma, B.; Nussinov, R. Hot regions in protein-protein interactions: The organization and contribution of structurally conserved hot spot residues. J. Mol. Biol. 2005, 345, 1281–1294. [Google Scholar] [CrossRef] [PubMed]
- Thorn, K.S.; Bogan, A.A. ASEdb: A database of alanine mutations and their effects on the free energy of binding in protein interactions. Bioinformatics 2001, 17, 284–285. [Google Scholar] [CrossRef] [PubMed]
- Fischer, T.B.; Arunachalam, K.V.; Bailey, D.; Mangual, V.; Bakhru, S.; Russo, R.; Huang, D.; Paczkowski, M.; Lalchandani, V.; Ramachandra, C.; et al. The binding interface database (BID): A compilation of amino acid hot spots in protein interfaces. Bioinformatics 2003, 19, 1453–1454. [Google Scholar] [CrossRef] [PubMed]
- Kumar, M.D.S.; Gromiha, M.M. PINT: Protein-protein interactions thermodynamic database. Nucleic Acids Res. 2006, 34, D195–D198. [Google Scholar] [CrossRef] [PubMed]
- Moal, I.H.; Fernández-Recio, J. SKEMPI: A structural kinetic and energetic database of mutant protein interactions and its use in empirical models. Bioinformatics 2012, 28, 2600–2607. [Google Scholar] [CrossRef] [PubMed]
- Guerois, R.; Nielsen, J.E.; Serrano, L. Predicting changes in the stability of proteins and protein complexes: A study of more than 1000 mutations. J. Mol. Biol. 2002, 320, 369–387. [Google Scholar] [CrossRef]
- Gao, Y.; Wang, R.; Lai, L. Structure-based method for analyzing protein-protein interfaces. J. Mol. Model. 2004, 10, 44–54. [Google Scholar] [CrossRef] [PubMed]
- Schymkowitz, J.; Borg, J.; Stricher, F.; Nys, R.; Rousseau, F.; Serrano, L. The FoldX web server: An online force field. Nucleic Acids Res. 2005, 33, W382–W388. [Google Scholar] [CrossRef] [PubMed]
- Huo, S.; Massova, I.; Kollman, P.A. Computational alanine scanning of the 1:1 human growth hormone-receptor complex. J. Comput. Chem. 2002, 23, 15–27. [Google Scholar] [CrossRef] [PubMed]
- Rajamani, D.; Thiel, S.; Vajda, S.; Camacho, C.J. Anchor residues in protein-protein interactions. Proc. Natl. Acad. Sci. USA 2004, 101, 11287–11292. [Google Scholar] [CrossRef] [PubMed]
- Gonzalez-Ruiz, D.; Gohlke, H. Targeting protein-protein interactions with small molecules: Challenges and perspectives for computational binding epitope detection and ligand finding. Curr. Med. Chem. 2006, 13, 2607–2625. [Google Scholar] [CrossRef] [PubMed]
- Ma, B.; Elkayam, T.; Wolfson, H.; Nussinov, R. Protein-protein interactions: Structurally conserved residues distinguish between binding sites and exposed protein surfaces. Proc. Natl. Acad. Sci. USA 2003, 100, 5772–5777. [Google Scholar] [CrossRef] [PubMed]
- Del Sol, A.; O’Meara, P. Small-world network approach to identify key residues in protein-protein interaction. Proteins 2005, 58, 672–682. [Google Scholar] [CrossRef] [PubMed]
- Guharoy, M.; Chakrabarti, P. Conservation and relative importance of residues across protein-protein interfaces. Proc. Natl. Acad. Sci. USA 2005, 102, 15447–15452. [Google Scholar] [CrossRef] [PubMed]
- Grosdidier, S.; Fernandez-Recio, J. Identification of hot-spot residues in protein-protein interactions by computational docking. BMC Bioinform. 2008, 9, 447. [Google Scholar] [CrossRef] [PubMed]
- Brinda, K.V.; Kannan, N.; Vishveshwara, S. Analysis of homodimeric protein interfaces by graph-spectral methods. Protein Eng. 2002, 15, 265–277. [Google Scholar] [CrossRef] [PubMed]
- Ofran, Y.; Rost, B. Protein-protein interaction hotspots carved into sequences. PLoS Comput. Biol. 2007, 3, e119. [Google Scholar] [CrossRef] [PubMed]
- Darnell, S.J.; Page, D.; Mitchell, J.C. An automated decision-tree approach to predicting protein interaction hot spots. Proteins 2007, 68, 813–823. [Google Scholar] [CrossRef] [PubMed]
- Lise, S.; Archambeau, C.; Pontil, M.; Jones, D.T. Prediction of hot spot residues at protein-protein interfaces by combining machine learning and energy-based methods. BMC Bioinform. 2009, 10, 365. [Google Scholar] [CrossRef] [PubMed]
- Wang, L.; Liu, Z.P.; Zhang, X.S.; Chen, L. Prediction of hot spots in protein interfaces using a random forest model with hybrid features. Protein Eng. Des. Sel. 2012, 25, 119–126. [Google Scholar] [CrossRef] [PubMed]
- Tuncbag, N.; Gursoy, A.; Keskin, O. Identification of computational hot spots in protein interfaces: Combining solvent accessibility and inter-residue potentials improves the accuracy. Bioinformatics 2009, 25, 1513–1520. [Google Scholar] [CrossRef] [PubMed]
- Guney, E.; Tuncbag, N.; Keskin, O.; Gursoy, A. HotSprint: Database of computational hot spots in protein interfaces. Nucleic Acids Res. 2008, 36, D662–D666. [Google Scholar] [CrossRef] [PubMed]
- Cho, K.I.; Kim, D.; Lee, D. A feature-based approach to modeling protein-protein interaction hot spots. Nucleic Acids Res. 2009, 37, 2672–2687. [Google Scholar] [CrossRef] [PubMed]
- Tuncbag, N.; Keskin, O.; Gursoy, A. HotPoint: Hot spot prediction server for protein interfaces. Nucleic Acids Res. 2010, 38, W402–W406. [Google Scholar] [CrossRef] [PubMed]
- Lise, S.; Buchan, D.; Pontil, M.; Jones, D.T. Predictions of hot spot residues at protein-protein interfaces using support vector machines. PLoS ONE 2011, 6, e16774. [Google Scholar] [CrossRef] [PubMed]
- Chen, P.; Li, J.; Wong, L.; Kuwahara, H.; Huang, J.Z.; Gao, X. Accurate prediction of hot spot residues through physicochemical characteristics of amino acid sequences. Proteins 2013, 81, 1351–1362. [Google Scholar] [CrossRef] [PubMed]
- Ludmila, I.; Kuncheva, C.J.W. Measures of diversity in classifier ensembles and their relationship with the ensemble accuracy. Mach. Learn. 2003, 51, 181–207. [Google Scholar]
- Yachdav, G.; Kloppmann, E.; Kajan, L.; Hecht, M.; Goldberg, T.; Hamp, T.; Honigschmid, P.; Schafferhans, A.; Roos, M.; Bernhofer, M.; et al. PredictProtein—An open resource for online prediction of protein structural and functional features. Nucleic Acids Res. 2014, 42, W337–W343. [Google Scholar] [CrossRef] [PubMed]
- Kawashima, S.; Pokarowski, P.; Pokarowska, M.; Kolinski, A.; Katayama, T.; Kanehisa, M. AAindex: Amino acid index database, progress report 2008. Nucleic Acids Res. 2008, 36, D202–D205. [Google Scholar] [CrossRef] [PubMed]
- Altschul, S.F.; Madden, T.L.; Schäffer, A.A.; Zhang, J.; Zhang, Z.; Miller, W.; Lipman, D.J. Gapped BLAST and PSI-BLAST: A new generation of protein database search programs. Nucleic Acids Res. 1997, 25, 3389–3402. [Google Scholar] [CrossRef] [PubMed]
- Chen, P.; Li, J. Sequence-based identification of interface residues by an integrative profile combining hydrophobic and evolutionary information. BMC Bioinform. 2010, 11, 402. [Google Scholar] [CrossRef] [PubMed]
- Chen, P.; Wong, L.; Li, J. Detection of outlier residues for improving interface prediction in protein heterocomplexes. IEEE/ACM Trans. Comput. Biol. Bioinform. 2012, 9, 1155–1165. [Google Scholar] [CrossRef] [PubMed]
- Chen, P.; Hu, S.; Zhang, J.; Gao, X.; Li, J.; Xia, J.; Wang, B. A sequence-based dynamic ensemble learning system for protein ligand-binding site prediction. IEEE/ACM Trans. Comput. Biol. Bioinform. 2016, 13, 901–912. [Google Scholar] [CrossRef] [PubMed]
- Ritter, H.; Kohonen, T. Self-organizing semantic maps. Biol. Cybern. 1989, 61, 241. [Google Scholar] [CrossRef]
- Papadimitriou, C.H.; Raghavan, P.; Tamaki, H.; Vempala, S. Latent semantic indexing: A probabilistic analysis. J. Comput. Syst. Sci. 2000, 61, 217–235. [Google Scholar] [CrossRef]
- Kaski, S. Dimensionality reduction by random mapping: Fast similarity computation for clustering. In Proceedings of the IEEE International Joint Conference on Neural Networks Proceedings, World Congress on Computational Intelligence, Anchorage, AK, USA, 4–9 May 1998; Volume 1, pp. 413–418. [Google Scholar]
- Chen, P.; Huang, J.Z.; Gao, X. LigandRFs: Random forest ensemble to identify ligand-binding residues from sequence information alone. BMC Bioinform. 2014, 15 (Suppl. S15), S4. [Google Scholar] [CrossRef] [PubMed]
- Kuncheva, L.; Whitaker, C.; Shipp, C.; Duin, R. Limits on the majority vote accuracy in classifier fusion. Pattern Anal. Appl. 2003, 6, 22–31. [Google Scholar] [CrossRef]
- Wang, B.; Chen, P.; Huang, D.S.; Li, J.j.; Lok, T.M.; Lyu, M.R. Predicting protein interaction sites from residue spatial sequence profile and evolution rate. FEBS Lett. 2006, 580, 380–384. [Google Scholar] [CrossRef] [PubMed]


| No. | Training | Test | ||||||
|---|---|---|---|---|---|---|---|---|
| Sen | MCC | Prec | F1 | Sen | MCC | Prec | F1 | |
| 1 | 0.259 | 0.110 | 0.069 | 0.109 | 0.558 | 0.332 | 0.220 | 0.315 |
| 2 | 0.069 | 0.125 | 0.250 | 0.108 | 0.558 | 0.357 | 0.250 | 0.345 |
| 3 | 0.138 | 0.080 | 0.070 | 0.093 | 0.212 | 0.141 | 0.122 | 0.155 |
| 4 | 0.069 | 0.085 | 0.129 | 0.090 | 0.500 | 0.274 | 0.173 | 0.257 |
| 5 | 0.121 | 0.075 | 0.071 | 0.089 | 0.308 | 0.194 | 0.150 | 0.201 |
| 6 | 0.069 | 0.083 | 0.125 | 0.089 | 0.096 | 0.040 | 0.044 | 0.060 |
| 7 | 0.069 | 0.076 | 0.108 | 0.084 | 0.269 | 0.136 | 0.096 | 0.141 |
| 8 | 0.069 | 0.076 | 0.108 | 0.084 | 0.269 | 0.129 | 0.090 | 0.135 |
| 9 | 0.138 | 0.071 | 0.061 | 0.084 | 0.558 | 0.364 | 0.259 | 0.354 |
| 10 | 0.138 | 0.069 | 0.058 | 0.082 | 0.346 | 0.226 | 0.173 | 0.231 |
| 11 | 0.069 | 0.071 | 0.098 | 0.081 | 0.135 | 0.038 | 0.037 | 0.058 |
| 12 | 0.086 | 0.066 | 0.075 | 0.080 | 0.615 | 0.337 | 0.205 | 0.308 |
| 13 | 0.052 | 0.080 | 0.150 | 0.077 | 0.577 | 0.317 | 0.196 | 0.293 |
| 14 | 0.052 | 0.076 | 0.136 | 0.075 | 0.404 | 0.227 | 0.153 | 0.222 |
| 15 | 0.069 | 0.064 | 0.083 | 0.075 | 0.135 | 0.082 | 0.080 | 0.100 |
| 16 | 0.052 | 0.074 | 0.130 | 0.074 | 0.577 | 0.323 | 0.203 | 0.300 |
| 17 | 0.052 | 0.074 | 0.130 | 0.074 | 0.596 | 0.279 | 0.153 | 0.243 |
| 18 | 0.069 | 0.062 | 0.080 | 0.074 | 0.404 | 0.225 | 0.151 | 0.220 |
| 19 | 0.069 | 0.062 | 0.080 | 0.074 | 0.308 | 0.152 | 0.102 | 0.153 |
| 20 | 0.052 | 0.072 | 0.125 | 0.073 | 0.115 | 0.030 | 0.033 | 0.052 |
| 21 | 0.121 | 0.058 | 0.052 | 0.073 | 0.192 | 0.135 | 0.123 | 0.150 |
| 22 | 0.052 | 0.067 | 0.111 | 0.071 | 0.288 | 0.150 | 0.105 | 0.154 |
| 23 | 0.190 | 0.064 | 0.044 | 0.071 | 0.577 | 0.281 | 0.159 | 0.249 |
| 24 | 0.069 | 0.056 | 0.070 | 0.070 | 0.269 | 0.145 | 0.105 | 0.151 |
| 25 | 0.086 | 0.054 | 0.057 | 0.069 | 0.423 | 0.171 | 0.095 | 0.155 |
| 26 | 0.086 | 0.053 | 0.057 | 0.068 | 0.212 | 0.079 | 0.057 | 0.090 |
| 27 | 0.086 | 0.051 | 0.054 | 0.066 | 0.365 | 0.218 | 0.156 | 0.218 |
| 28 | 0.052 | 0.058 | 0.091 | 0.066 | 0.250 | 0.091 | 0.060 | 0.097 |
| 29 | 0.052 | 0.057 | 0.088 | 0.065 | 0.481 | 0.237 | 0.141 | 0.218 |
| 30 | 0.034 | 0.095 | 0.286 | 0.062 | 0.519 | 0.241 | 0.136 | 0.215 |
| 31 | 0.034 | 0.095 | 0.286 | 0.062 | 0.346 | 0.204 | 0.146 | 0.206 |
| 32 | 0.052 | 0.050 | 0.073 | 0.061 | 0.173 | 0.095 | 0.081 | 0.110 |
| 33 | 0.138 | 0.048 | 0.039 | 0.061 | 0.442 | 0.271 | 0.190 | 0.266 |
| 34 | 0.052 | 0.049 | 0.071 | 0.060 | 0.231 | 0.115 | 0.085 | 0.124 |
| 35 | 0.224 | 0.055 | 0.035 | 0.060 | 0.346 | 0.186 | 0.127 | 0.186 |
| 36 | 0.034 | 0.078 | 0.200 | 0.059 | 0.250 | 0.161 | 0.131 | 0.172 |
| 37 | 0.207 | 0.052 | 0.034 | 0.059 | 0.519 | 0.273 | 0.167 | 0.252 |
| 38 | 0.034 | 0.074 | 0.182 | 0.058 | 0.365 | 0.238 | 0.181 | 0.242 |
| 39 | 0.034 | 0.064 | 0.143 | 0.056 | 0.192 | 0.083 | 0.064 | 0.096 |
| 40 | 0.052 | 0.044 | 0.061 | 0.056 | 0.231 | 0.146 | 0.120 | 0.158 |
| 41 | 0.052 | 0.042 | 0.059 | 0.055 | 0.135 | 0.070 | 0.065 | 0.088 |
| 42 | 0.103 | 0.038 | 0.036 | 0.054 | 0.327 | 0.145 | 0.091 | 0.143 |
| 43 | 0.103 | 0.037 | 0.036 | 0.053 | 0.192 | 0.111 | 0.093 | 0.125 |
| 44 | 0.034 | 0.049 | 0.095 | 0.051 | 0.077 | 0.013 | 0.025 | 0.037 |
| 45 | 0.069 | 0.035 | 0.040 | 0.051 | 0.154 | 0.054 | 0.046 | 0.071 |
| 46 | 0.121 | 0.034 | 0.031 | 0.050 | 0.423 | 0.231 | 0.151 | 0.222 |
| 47 | 0.224 | 0.041 | 0.028 | 0.050 | 0.288 | 0.172 | 0.129 | 0.179 |
| 48 | 0.241 | 0.037 | 0.026 | 0.046 | 0.308 | 0.152 | 0.102 | 0.153 |
| 49 | 0.052 | 0.030 | 0.040 | 0.045 | 0.442 | 0.210 | 0.125 | 0.195 |
| 50 | 0.155 | 0.031 | 0.026 | 0.045 | 0.462 | 0.252 | 0.162 | 0.240 |
| Test Set | No. Dimension | Sen | MCC | Prec | F1 |
|---|---|---|---|---|---|
| ASEdb0 | 2 | 0.224 | 0.322 | 0.481 | 0.306 |
| 3 | 0.793 | 0.428 | 0.245 | 0.374 | |
| 5 | 0.897 | 0.383 | 0.177 | 0.295 | |
| 10 | 1.000 | 0.299 | 0.103 | 0.186 | |
| 15 | 1.000 | 0.219 | 0.062 | 0.116 | |
| 25 | 1.000 | 0.149 | 0.036 | 0.070 | |
| 50 | 1.000 | 0.081 | 0.021 | 0.041 | |
| BID0 | 2 | 0.385 | 0.260 | 0.200 | 0.263 |
| 3 | 0.846 | 0.601 | 0.440 | 0.579 | |
| 5 | 1.000 | 0.461 | 0.226 | 0.369 | |
| 10 | 1.000 | 0.283 | 0.096 | 0.175 | |
| 15 | 1.000 | 0.222 | 0.066 | 0.124 | |
| 25 | 1.000 | 0.145 | 0.038 | 0.074 | |
| 50 | 1.000 | 0.078 | 0.024 | 0.046 |
| No. Dimension | Sen | MCC | Prec | F1 |
|---|---|---|---|---|
| 1 | 0.328 | 0.475 | 0.704 | 0.447 |
| 2 | 0.328 | 0.352 | 0.396 | 0.358 |
| 5 | 0.846 | 0.601 | 0.440 | 0.579 |
| 10 | 0.846 | 0.499 | 0.310 | 0.454 |
| 20 | 0.481 | 0.240 | 0.144 | 0.221 |
| 50 | 0.500 | 0.274 | 0.173 | 0.257 |
| 100 | 0.538 | 0.252 | 0.141 | 0.224 |
| Method | Type | Sen | MCC | Prec | F1 |
|---|---|---|---|---|---|
| Our Method | Random Projection | 0.846 | 0.601 | 0.440 | 0.579 |
| ISIS | Neural Networks | 0.191 | 0.030 | 0.026 | 0.046 |
| Random Predictor | 0.983 | 0.000 | 0.018 | 0.035 | |
| Dataset | Hot Spots | Non-Hotspots | Total Residues | Ratio |
|---|---|---|---|---|
| BID0 | 54 | 2895 | 2949 | 1.831% |
| ASEdb0 | 58 | 3957 | 4015 | 1.445% |
| BID | 54 | 58 | 112 | 48.214% |
| ASEdb | 58 | 91 | 149 | 38.926% |
© 2017 by the authors. Licensee MDPI, Basel, Switzerland. This article is an open access article distributed under the terms and conditions of the Creative Commons Attribution (CC BY) license (http://creativecommons.org/licenses/by/4.0/).
Share and Cite
Jiang, J.; Wang, N.; Chen, P.; Zheng, C.; Wang, B. Prediction of Protein Hotspots from Whole Protein Sequences by a Random Projection Ensemble System. Int. J. Mol. Sci. 2017, 18, 1543. https://doi.org/10.3390/ijms18071543
Jiang J, Wang N, Chen P, Zheng C, Wang B. Prediction of Protein Hotspots from Whole Protein Sequences by a Random Projection Ensemble System. International Journal of Molecular Sciences. 2017; 18(7):1543. https://doi.org/10.3390/ijms18071543
Chicago/Turabian StyleJiang, Jinjian, Nian Wang, Peng Chen, Chunhou Zheng, and Bing Wang. 2017. "Prediction of Protein Hotspots from Whole Protein Sequences by a Random Projection Ensemble System" International Journal of Molecular Sciences 18, no. 7: 1543. https://doi.org/10.3390/ijms18071543
APA StyleJiang, J., Wang, N., Chen, P., Zheng, C., & Wang, B. (2017). Prediction of Protein Hotspots from Whole Protein Sequences by a Random Projection Ensemble System. International Journal of Molecular Sciences, 18(7), 1543. https://doi.org/10.3390/ijms18071543